1. Introduction
Despite the widespread use of the internet over the past 30 years and its numerous applications, it has definitely not lived up to the expectations in terms of the development of the financial industry, especially considering the dynamics of change versus technological progress (
Abdulhakeem and Hu 2021;
Harwick and Caton 2020). Moreover, despite widespread access to the internet, there are still about 1.7 billion people in the world who are bank-excluded, i.e., have no access to bank accounts at all. At least that is what a report by the World Bank Group says (
Abdulhakeem and Hu 2021). Even with a relevant number of innovative institutions such as investment banking and fintechs, the biggest shortcoming of the financial sector remains its heavy concentration and centralization. A breakthrough in this regard—raising hopes for a progressive decentralization of the entire financial system—only came with the development of blockchain technology and the innovations associated with this revolutionary technology (
Sobieraj 2019;
Abdulhakeem and Hu 2021). It should be emphasised that blockchain itself as a technology enables peer-to-peer transactions without intermediaries and any centralization (
Swan 2015;
Sobieraj 2019;
Saengchote 2021;
Almeida and Gonçalves 2022;
Xu and Xu 2022).
With the development of the Blockchain, an entire ecosystem of financial applications has also emerged, built on the Blockchain network, using crypto tokens and smart contracts, and offering transparent financial services without intermediaries (
Caldarelli and Ellul 2021;
Grassi et al. 2022). This entire ecosystem has been named DeFi, from decentralized finance (
Stepanova and Eriņš 2021). DeFi implies that financial services should be provided by users themselves to other users (
Schueffel 2021). In short, this is made possible by using software components for a decentralized peer-to-peer system on the blockchain (
Schueffel 2021). As
Zetzsche et al. (
2020) note, DeFi protocols and platforms are some of the most widely discussed new technological developments in global finance today. They are trustless and based on transparent solutions (
Caldarelli and Ellul 2021).
Saengchote (
2021) notes that the existence of DeFi protocols offers many advantages. One of the most valuable, in his opinion, is composability, i.e., that different protocols can freely interact with each other to form new services.
This study addresses some basic metrics that allow DeFi protocols to be compared in terms of their basic analytical performance. One of these metrics is the Total Value Locked (TVL), which defines the DeFi market and indicates how much money is locked in a given DeFi protocol. Since there are different types of DeFi protocols in the DeFi market (e.g., decentralized exchanges, lending protocols, asset management, etc.), TVL represents different things for different types of DeFis. To illustrate what exactly TVL is, it is therefore useful to use a concrete example. Assuming that we are referring to lending protocols, the TVL associated with such DeFi platforms can be explained as the funds held as collateral for the loans taken out. More precisely, it is the total value of DeFi tokens staked on the blockchain as collateral.
The design of the study is very simple. We examine the relationship between DeFi protocol valuations and a whole set of financial metrics (variables) commonly used to compare the performance of these protocols. In reviewing the literature (
Table A1 in
Appendix A), there are not that many studies that address this issue. Admittedly, there are quite a number of studies on the emerging DeFi market. However, they mostly address the same, highly theoretical issues, i.e., the challenges, benefits and potential of the DeFi ecosystem (
Abdulhakeem and Hu 2021;
Werner et al. 2021;
Calcaterra and Kaal 2021;
Makarov and Schoar 2022), primitives, types of operational protocols and safety (
Werner et al. 2021;
Sun et al. 2021;
Kitzler et al. 2021;
Caldarelli and Ellul 2021), problems and risks associated with the formation of DeFi markets (including market manipulation, distorting incentives, excessive short-termism, Ponzi schemes and money laundering) (
Chohan 2021;
Schär 2021;
Sun et al. 2021;
Caldarelli and Ellul 2021;
Bekemeier 2021), comparisons between the DeFi market and the CeFi market (
Qin et al. 2021b), and inefficiencies of the DeFi market (
Momtaz 2022). There are also few studies that rely on robust statistical models, and those that have been conducted relate exclusively to the most popular performance indicator, namely TVL (as if this were the only indicator that tracks the performance of DeFi protocols), alternatively to investor attention (
Corbet et al. 2022;
Şoiman et al. 2022) or to the association of the performance of DeFi protocols with traditional cryptocurrencies (
Corbet et al. 2021;
Dahlberg and Dabaja 2021;
Maouchi et al. 2022;
Schär 2021;
Şoiman et al. 2022;
Yousaf et al. 2022). There is also a study that refers to the returns of DeFi protocols (
Şoiman et al. 2022). The literature also contains very focused studies that address specific issues related to DeFi protocols, such as the study on the nature of user behavior (
Green et al. 2022) or the studies on explosive dynamics (
Corbet et al. 2021;
Wang et al. 2022). In contrast, there is a distinct lack of research addressing the issue of protocol valuation and how it depends on relevant financial variables. Indeed,
Kaal et al. (
2022) and
Brucker (
2022) point to the lack of such studies and the need for research to better understand digital asset valuations, including DeFi protocols in particular. Our study attempts to fill this gap. More specifically, the study examines how the valuations of individual DeFi projects depend on their TVL and a number of other important metrics characterizing individual DeFi projects, such as protocol revenue, total revenue, gross merchandise volume, and DeFi tokens’ inflation factor, etc.
Furthermore, the study shows a difference between different DeFi protocols’ classes (i.e., decentralized exchanges, lending protocols and asset management). Finally, the study also highlights some similarities between DeFi and conventional finance—in terms of the relevant valuation metrics considered in this study (and their counterparts in traditional finance). This knowledge leads to a better understanding of DeFi markets that are only in their early stages of emergence. We note that there is a lot of research on DeFi, but there is a lack of solid, model-based econometric research explaining the specificity and relevant properties of this market from a financial analysis perspective.
As for the contribution, the study shows that there are a number of different metrics that go beyond the most well-known TVL. Knowing these metrics allows for a better understanding of the DeFi market and a more in-depth evaluation of DeFi protocols. In the article, we analyze the valuations in the context of these metrics and provide a set of definitions. Among other things, we point out that besides TVL, another metric that seems to be widely underestimated is gross merchandise volume (GMV), which is the total value of sales and has gained popularity in the analysis of internet companies and especially e-commerce platforms (
Yan et al. 2017;
Prokhorova 2020;
Sharma 2021). We also note that there are several categories of DeFi protocols that differ from each other. For example, they show different tolerance to changes in TVL (which is shown in a simple experiment where valuations are regressed on TVL values). All in all, the work is quantitative in nature and in it we use different research methods (correlation analysis, Granger-causality, and panel data analyses) that lend themselves to the analysis of associations between the type of data used in the study.
The structure of this article is as follows. First, we provide an overview of the literature to date, outlining the current state of academic knowledge on decentralized finance. We then present a methodology and model that explains the relationship between the valuations of DeFi protocols. Finally, we describe the results obtained, provide a discussion, and present conclusions from the conducted research.
2. Characteristic of the DeFi Market
There is currently a growing global interest in the digital economy, with a particular focus on blockchain technology. Decentralized finance is one of the leading current trends related to blockchain technology (
Stepanova and Eriņš 2021). DeFi offers exciting possibilities, i.e., it consists of many highly interoperable protocols and applications. The advantage of DeFi over traditional finance of centralised finance (CeFi) is that all transactions can be independently verified by anyone due to the easy accessibility of data to users. DeFi platforms work as decentralized applications with smart contracts implemented on the blockchain (distributed ledger technology). As an emerging technology, they have the potential to disrupt the entire financial sector in the future (
Şoiman et al. 2022).
Schär (
2021) sketched a picture of the DeFi market with a special focus on the opportunities this market offers and the potential risks of the DeFi ecosystem. According to the author, the DeFi market currently has a niche character, but could offer a more transparent, open and stable financial infrastructure in the future due to some of its specific features, i.e., easy accessibility, transparency, efficiency, and composition.
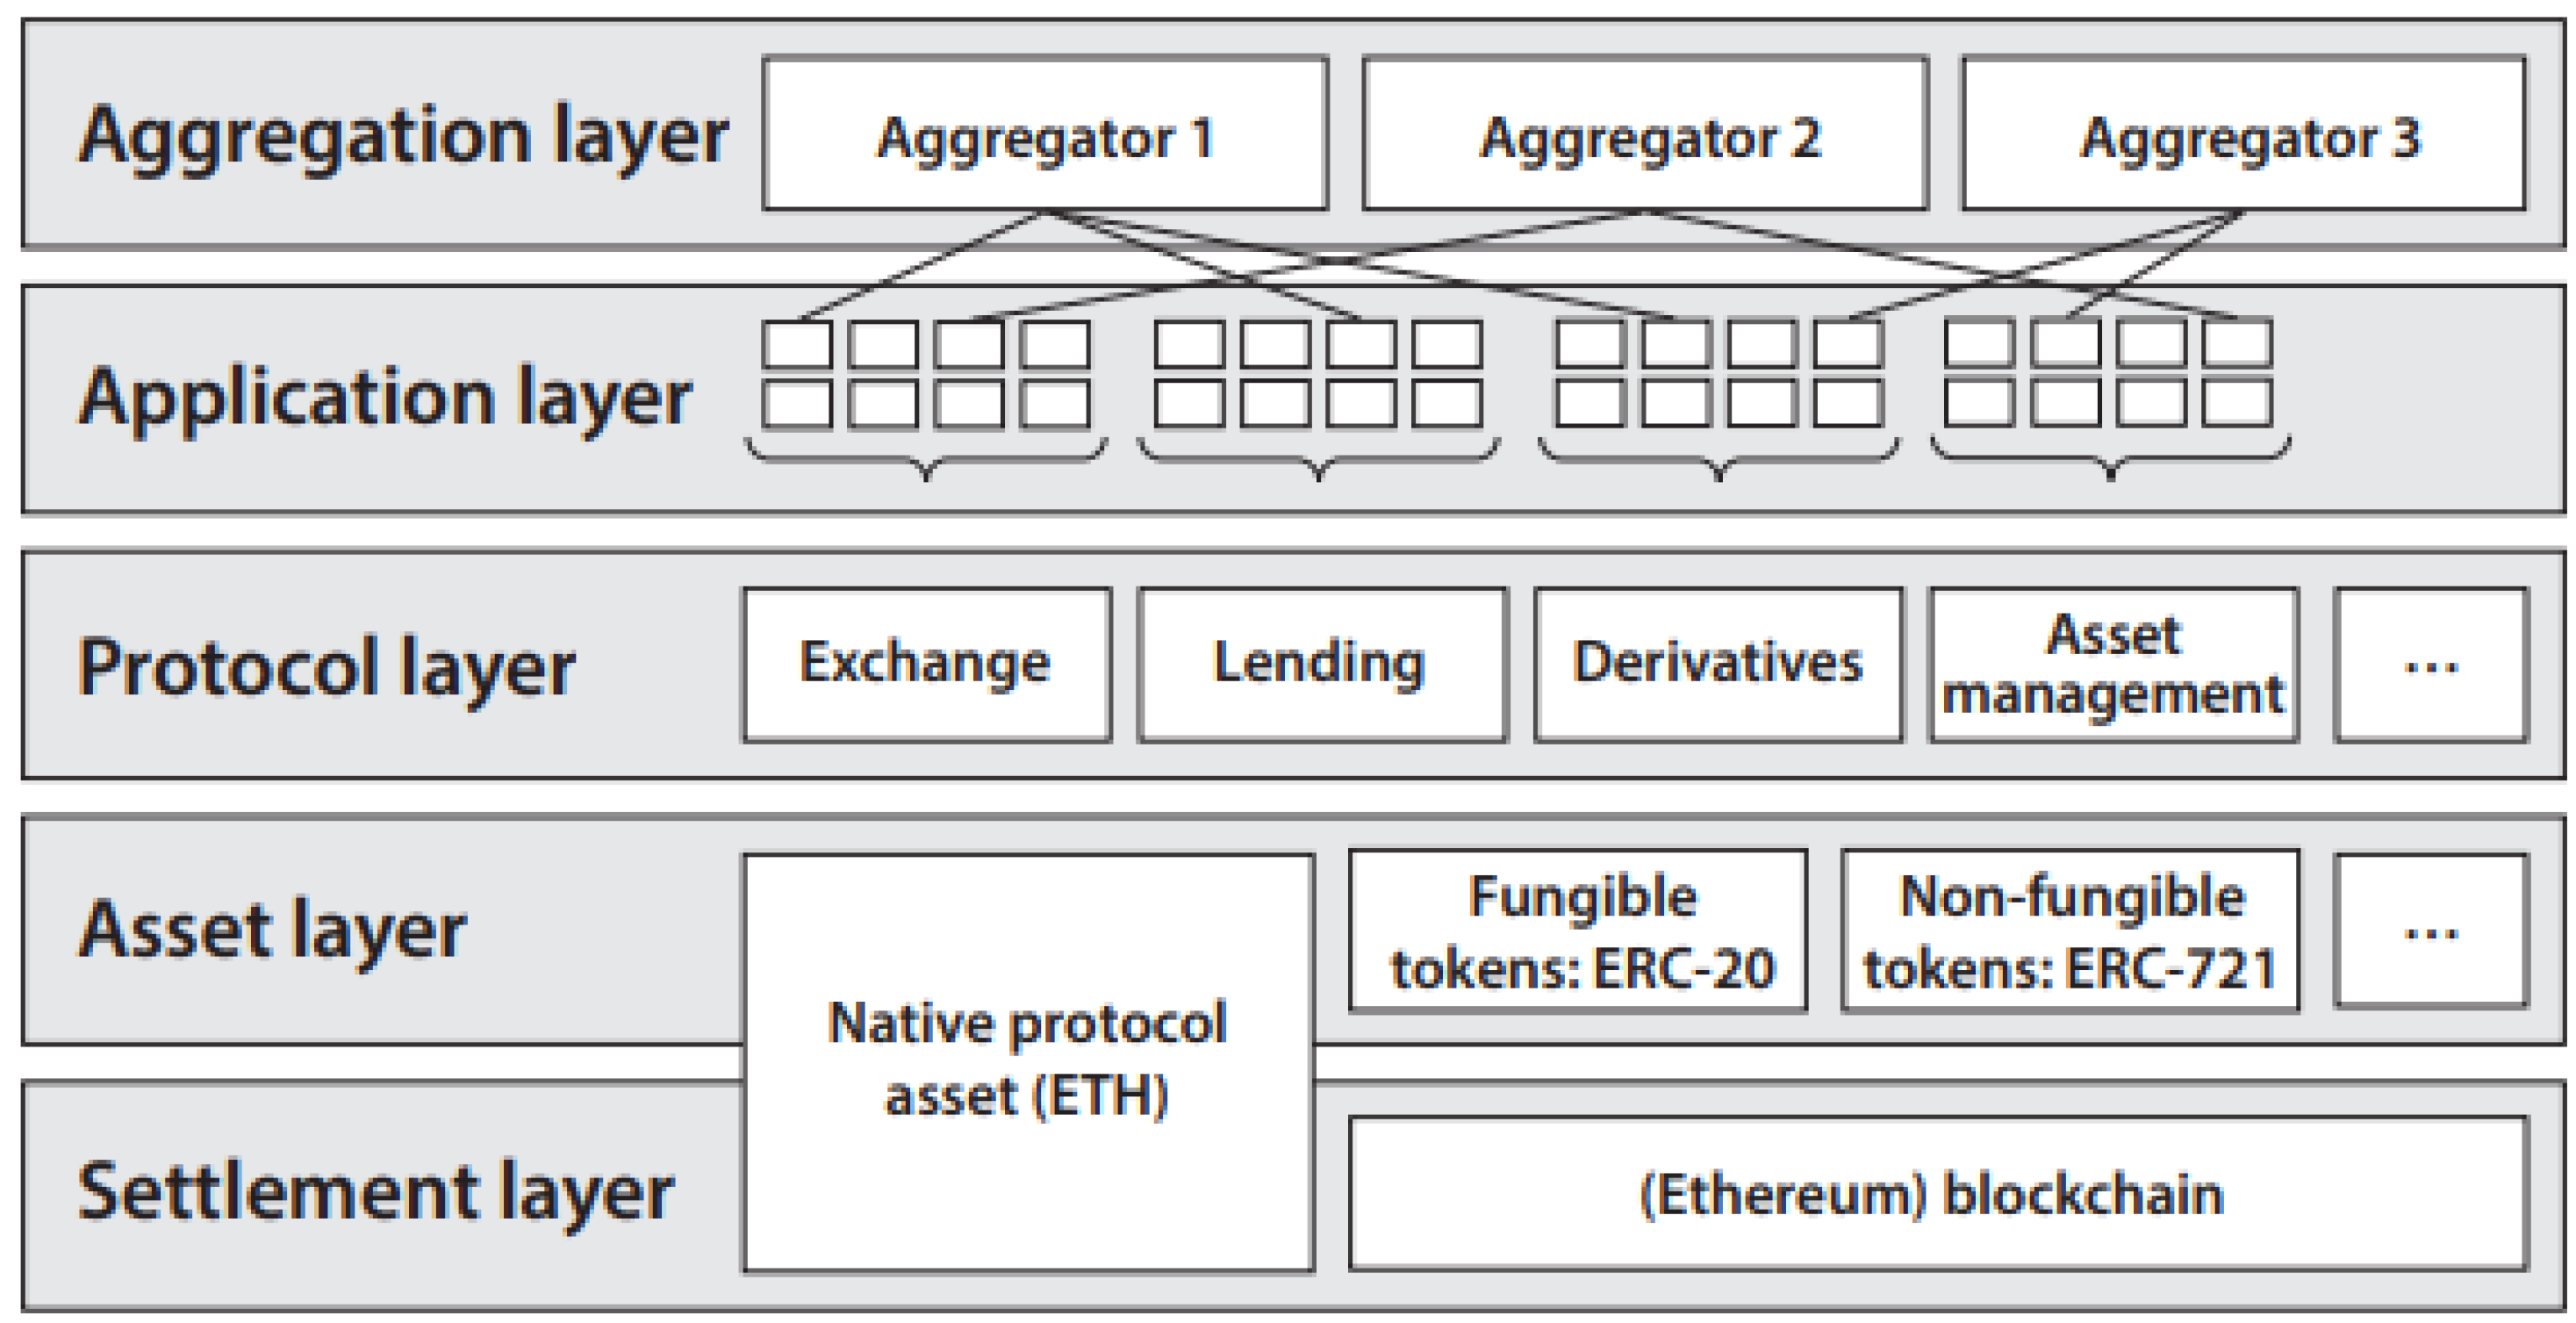
The decentralized nature of smart contract applications (based on distributed ledgers) provides these systems with a properly managed settlement layer. DeFi’s blockchain-based ecosystem architecture enables the creation of many innovative products, e.g., decentralized equivalents of traditional financial instruments, but also completely novel instruments that did not exist before. Examples include decentralized stablecoins, flash loans (
Qin et al. 2021a;
Chohan 2021), autonomous liquidity pools (
Schär 2021;
Borisov 2022) or atomic swaps (
Tefagh et al. 2020;
Reiter 2022). All this makes the potential of DeFi enormous. For example, flash loans are a unique concept related to blockchain and DeFi, offering the ability to borrow hundreds of millions of dollars without putting up any collateral. However, the caveat (limitation) is that such an operation (transaction) must be completed in a single block. This gives an opportunity to borrow unlimited funds, provided that such a flash loan is repaid immediately after all sets of operations have been completed in one full transaction.
Below is a diagram of the layers of the DeFi market (also known as the DeFi stack), which gives a better understanding of the nature of this market (see
Figure 1).
It is also worth pointing out some significant risks and weaknesses associated with DeFi technology. There are at least several of them. The most serious relate primarily to the safety of users of this technology, with unintended use and the oracle problem (
Caldarelli and Ellul 2021) cited among the greatest threats. The latter is a problem arising from the system’s reliance on external data sources to properly update smart contracts (e.g., clearing issues). These problems are discussed in great detail in the work of
Caldarelli and Ellul (
2021), among others. In the same vein,
Chohan (
2021) points to a number of problems associated with the emergence of the DeFi sector, namely various types of security risks that prevent the wider adoption of DeFi, such as distorting incentives, market manipulations, Ponzi schemes or money laundering practices. One such Ponzi scheme turned out to be the Terra-LUNA project, which collapsed spectacularly in just one week in early May 2022. The crypto community is still struggling with the aftermath of the billion-dollar collapse of Terra LUNA. Within a week, around
$45 billion of the market capitalization of UST and Luna was completely wiped out of the market.
It is important to note that the empirical research and literature on DeFi is not yet as extensive as that on cryptocurrencies. However, there are some interesting studies that deserve to be mentioned. For example,
Gudgeon et al. (
2020) have presented evidence of the inefficiency of DeFi tokens in relation to their liquidity, market efficiency and interest rates.
Werner et al. (
2021) characterize the DeFi market in the context of operational protocol types, its overall ecosystem primitives and its security concerns.
Zetzsche et al. (
2020) have analyzed the development potential of the DeFi market in relation to its security, threats, risk control and regulatory needs. The authors emphasize the need for efficient design of regulatory issues, which in their view should include their embedding in the DeFi protocols themselves, i.e., through algorithmization in smart contracts. According to these authors, the biggest threat to the DeFi market is the risk that the traditional form of accountability will be challenged by decentralization, potentially compromising the effectiveness of enforcement of traditional financial regulations.
Harwick and Caton (
2020) note that if decentralized, autonomous finance is to be taken seriously in the financial world, it must begin to integrate identity with the real world.
Among the benefits that DeFi protocols can offer are, for example, a much wider range of financial services, lower costs of the services offered, as well as the business model itself, which operates at a lower operating cost, and finally the obtaining of greater privacy (
Şoiman et al. 2022). DeFi offers easy access to services (pseudo-anonymity). Furthermore, it makes use of multiple technological layers (
Katona 2021).
Stepanova and Eriņš (
2021) provided an overview of the capabilities, advantages and disadvantages of DeFi projects/protocols, analyzing and discussing the 12 most popular DeFi applications, and relying on the TVL metric.
For a more detailed characterization of the DeFi market, it is worth reaching for the work of
Harwick and Caton (
2020),
Schär (
2021),
Stepanova and Eriņš (
2021),
Zetzsche et al. (
2020), among others. In terms of the technology itself and business models, DeFi protocols are based on smart contracts and implement decentralized management. What is also important is that DeFi platforms use multiple technology layers, which provides opportunities to easily combine existing applications and create new innovative solutions (
Katona 2021;
Popescu 2020;
Şoiman et al. 2022).
Şoiman et al. (
2022) note that DeFi tokens share a number of similarities with ICO tokens and, like the latter, can serve many different functions depending on the needs of the platform, e.g., they can be traded on platforms, held for profit, but they can also provide access to various products or services. The functions of DeFi platforms (protocols) can be very complex and play different roles, e.g., they offer the possibility to trade digital assets, lend digital tokens and earn interest, trade derivatives, buy insurance and more (
Coinbase 2022). An important and growing application of DeFi protocols are stablecoins, which are tokens that attempt to tie their market value to an external reference asset, such as fiat currencies. Examples of such stablecoins are Tether (USDT), USD Coin (USDC), Dai (DAI), Binance USD (BUSD), Pax Dollar (USDP), TrueUSD (TUSD), and Digix Gold Token (DGX).
Examples of the different roles/functions that DeFi protocols can fulfil are (1) utility tokens that provide access to platform services and can be used to regulate payments for services offered on such DeFi platforms (such utility tokens are payable in relation to such services); (2) governance tokens (examples are year.finance or Maker Protocol) that allow users to benefit from the development of the platforms. Such tokens are similar to equity shares in public companies; (3) stablecoins, whose price is linked to other more stable currencies; (4) liquidity provider tokens (LPTs), which increase the liquidity of decentralized exchanges (DEXes); and (5) collateral tokens, which facilitate transactions in lending protocols. These can be stablecoins, for example, but also LPTs or even non-fungible tokens (NFTs).
Qin et al. (
2021b) point out that unlike traditional finance, in the case of DeFi, the blockchain technology (on which DeFi is based) ensures an adequate integrity, transparency and control of the entire system. In contrast to conventional cryptocurrencies such as Bitcoin or Ethereum, which are touted as alternative money and payment solutions, DeFi protocols offer an alternative to banking and investment services (
Zetzsche and Anker-Sorensen 2021;
Şoiman et al. 2022).
Aramonte et al. (
2021) point out the differences between DeFi and traditional finance. More specifically, DeFi protocols are different in terms of the functionalities they offer. DeFi operates on different principles than traditional finance, including the use of digital collateral instead of physical collateral (
Aramonte et al. 2021). Digital assets used as collateral in DeFi protocols include cryptocurrencies such as Bitcoins, Ethereum or Non-Fungible Tokens (NFTs). DeFi market participants who use their funds in lending protocols can book interest gains and, in return, borrowers can reinvest borrowed assets in other platforms and projects (
Corbet et al. 2021). Furthermore,
Qin et al. (
2021b) and
Saengchote (
2021) highlight another important feature of DeFi, namely the significantly higher returns on financial assets that DeFi protocols offer.
It is also worth noting that not everyone shares the optimism related to DeFi development. For example,
Momtaz (
2022) examined the efficiency and role of intermediation in a large segment of DeFi, with particular attention to the theory of search. More specifically, to search-related frictions, which, according to this theory, offset to some extent the efficiency gains attributed to lower transaction costs through blockchain and smart contracts. Viewed through the lens of Walrasian equilibrium, search constraints in the DeFi market reduce society’s wealth by almost half, which is why DeFi appears to be relatively inefficient, according to the authors.
3. Empirical Background
In-depth econometric analyses arising from robust models provide great opportunities to assess the relationships between different types of data. In the case of DeFi, unfortunately, there is a lot of data available, while there are few such studies. For example,
Corbet et al. (
2021) examined DeFi markets for explosive dynamics (bubbles), relying on the Supremum Augmented Dickey-Fuller (
Sobieraj and Metelski 2021) and the modified Hacker-Hatemi-J Wald method, as well as the Diebold-Yilmaz return and volatility spillover analysis. Interestingly, their results showed the presence of bubbles in the valuations of DeFi protocols in Q3 2021, while it is worth noting here that the TVL peak in the DeFi market was reached in early December 2021. A similar study was later conducted by
Wang et al. (
2022) and also showed the existence of bubbles in the DeFi market. Thus, it can be seen that SADF and GSADF tests for price exaggeration (explosiveness) detection can serve as a tool to effectively monitor this market. In another study,
Corbet et al. (
2022) used the Mackey-Glass causality test and Markov regime switching vector autoregression analysis to investigate what drives DeFi prices and the impact of investor attention.
Green et al. (
2022) used survival analysis, more specifically Kaplan-Meier survival curves and Cox hazard regression, to assess usage and risk patterns within the AAVE protocol, which is one of the largest lending protocols within DeFi.
Interestingly, regarding the specifics of the bubbles in DeFi tokens,
Corbet et al. (
2021) have shown that they are self-generated and that the catalyst for their acceleration is associated conventional cryptocurrencies, mainly Ether and Bitcoin. On the other hand, an analysis of the comovement between DeFi tokens and cryptocurrencies has shown that DeFi tokens should not be placed in the same asset class as conventional cryptocurrencies. In this context, they are a separate asset class (
Maouchi et al. 2022;
Corbet et al. 2021;
Schär 2021;
Şoiman et al. 2022;
Yousaf et al. 2022), although they are strongly linked to cryptocurrencies. The study by
Corbet et al. (
2021) also shows that, given the returns and volatility, it is not the leading cryptocurrencies Bitcoin and Ethereum, but rather Chainlink (LINK) and Maker (MKR) that have a significant impact on DeFi tokens and contribute to bubbles in this market.
Zmaznev (
2021) investigated the negative impact of regulatory uncertainty shocks on the TVL in DeFi smart contracts using a structural VAR model. Overall, the response is negative for the leading DeFi categories (decentralized exchanges, lending protocols). However, the author emphasises that uncertainty contributes to the TVL in derivatives and payment protocols.
As with traditional cryptocurrencies (Bitcoin, Ethereum), the extremely dynamic development of the DeFi market in its initial phase was influenced by the so-called network effect (i.e., the capture of user acceptance) (
Liu and Tsyvinski 2021;
Cong et al. 2021;
Ante 2020;
Şoiman et al. 2022). Typically, network effects consist of an exponential growth of people joining a particular protocol, making a particular DeFi token more useful and valuable. Each additional user of DeFi tokens makes them more valuable to all other players at a rapid pace (
Alabi 2017;
Wheatley et al. 2019).
Another study worth mentioning is the work of
Şoiman et al. (
2022), who conducted an analysis of the determinants of DeFi market returns. In their study, they considered four important factors that can affect the returns of this market, namely (1) the relationship of DeFi tokens to the cryptocurrency market, (2) network factors, (3) investor attention, and (4) the TVL-to-market valuation ratio. The study by
Şoiman et al. (
2022) highlights the importance of TVL, which is a measure of the amount of funding allocated to DeFi projects, while illustrating the extent of the growth and performance of this market.
4. Total Value Locked
Total value locked is the value of assets deposited in a project’s smart contracts (
Zakieh et al. 2022). In addition to the valuations themselves (i.e., the capitalization of individual projects and the market as a whole), TVL is one of the cryptocurrency indicators that DeFi market investors use to evaluate the projects they put their money into (
Zmaznev 2021). The fact of the matter is that funds are invested in different DeFi protocols for a variety of purposes, including staking, liquidity pools, and lending. According to
Xu and Xu (
2022), the exponential growth of TVL in DeFi protocols shows that there is a bright future for automated financial services. The TVL is specifically brought up as a comprehensive metric for DeFi protocols, as it directly reflects the financial side of services as well as their usage (
Zmaznev 2021).
Saengchote (
2021) sheds light on what DeFi Total Value Locked (TVL) could really measure and illustrates the complexity of DeFi analysis and market monitoring. The author notes that TVL is calculated as the market value of tokens deposited/locked in the system and is therefore highly dependent on token prices. Therefore, the relationship of this variable to valuations is expected to be relatively strong.
Şoiman et al. (
2022) refer to TVL as a certain unique variable that is specific to the DeFi market, as it is an indicator of the growth and success of that market. In simple terms, it corresponds to the amount of committed funds in DeFi protocols. According to the empirical evidence presented by these authors, TVL seems to be the most important variable for this market, followed by transactions (investor attention) and network effects. Some interesting remarks on TVL can also be found in the work of
Stepanova and Eriņš (
2021). According to
Maouchi et al. (
2022), TVL can be used to evaluate DeFi tokens and monitor this market. It is therefore worth taking a closer look at this variable and evaluating its historical performance.
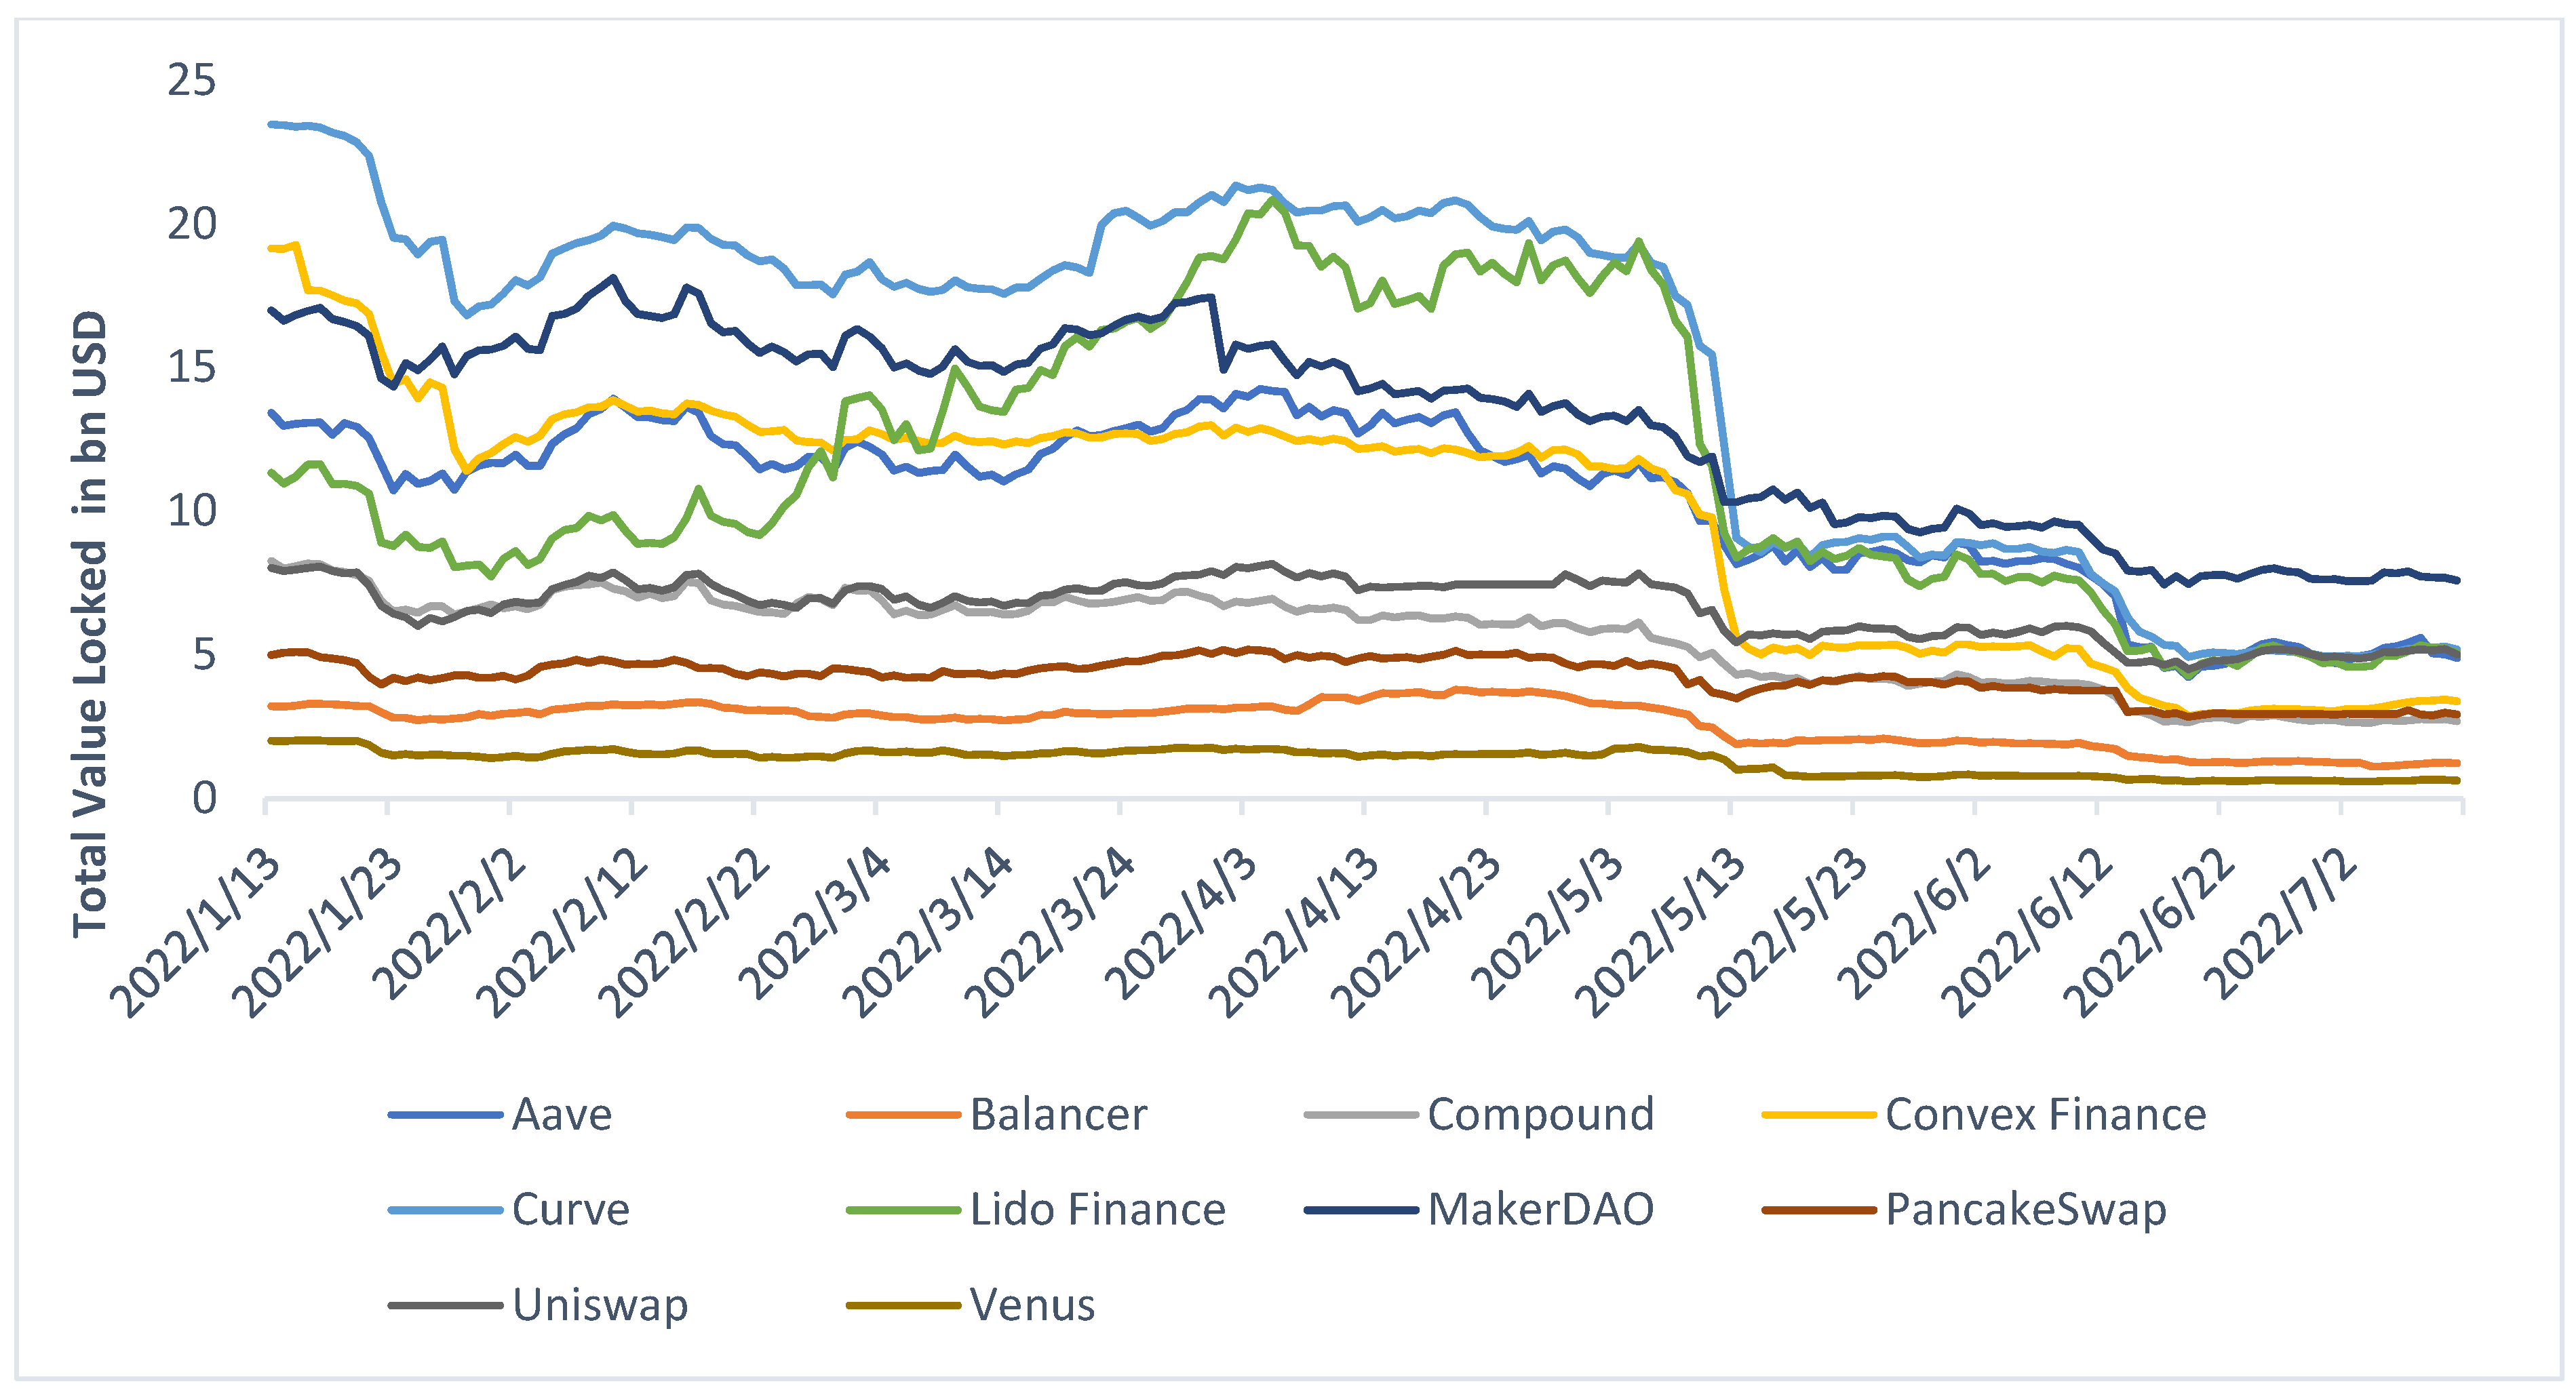
The sharp downward trends in the cryptocurrency markets that have emerged in the second quarter of 2022 have led to decentralized finance seeing a very dramatic decline in TVL. A major impetus that accelerated this trend was the price collapse of the major cryptocurrencies Bitcoin and Ethereum below the level of 50% of their peak values reached in the first half of 2022. The slump in the market for the leading cryptocurrencies also led to declines in the DeFi market. As a result, the TVL across all decentralized financial protocols has fallen by 50% in a relatively short period of time. It should be noted that in early May 2022 (i.e., before the actual crash of the entire cryptocurrency market, which coincided with the collapse of Terra-LUNA project), the TVL in all DeFi protocols was estimated to be around
$200 billion. At that point, it was difficult to even speak of a crash, as the historical TVL for this market reached
$252 billion in December 2021. The sequence of events was as follows. In the last week of April there was a drop of about
$20 billion in DeFi’s TVL. However, the real crash began on 9 May 2022. From then on, it took only 3 days (until 11 May 2022) for the TVL of the entire DeFi market to shrink by another
$30 billion to
$150 billion. And yet this was only the beginning. In the weeks that followed, further declines occurred, for a total of an additional
$40 billion in TVL. This development shows how high the risk is when investing in DeFi markets at this early stage of their development (see
Figure 2).
5. Data and Methodology
5.1. Data Collection
We collected information on 30 DeFi tokens using data from the defillama, tokenterminal and dappradar databases (tokenterminal.com, defillama.com and dappradar.com websites accessed on 15 July 2022).
Table 1 shows the exact names of the DeFi types and protocols examined. Defillama and Tokenterminal are the most complete data aggregators collecting important metrics for DeFi platforms and financial data for DeFi protocols. From the above databases, we have extracted data on key DeFi performance metrics, i.e., market capitalization, TVL, protocol revenue, total revenue, gross merchandise volume, and the inflation factor of DeFi protocols.
The study investigates the relationships between different variables related to DeFi protocol assessments. To this end, we have used several research methods that are appropriate for investigating relationships between data of this type, namely causality analysis and a panel regression study, which is underpinned by the fact that the study examines longitudinal data and thus both cross-sections and time series. The causality study shows how knowledge about individual variables enables the assessment of the interaction between variables, but can also be used to predict future valuations. In causality analysis, the interaction between variables can be determined. While x determines y, y can determine x. In panel regression analysis, there is a one-sided interaction.
The data used in the study refer to the period between 11 January and 8 July of 2022. The advantage of choosing such a data window is that the results provide a better answer to the question of how to mitigate the decline in valuations during the bear market. One of the ways to do this is to control the supply of tokens, which should be more tightly controlled by an appropriate inflation factor. But of course there are a number of other factors that could be considered. One such factor could be the investment strategies of the protocols themselves. A good example is Umami Finance, a protocol that is pioneering the mass adoption of DeFi with its growing ecosystem of professional, regulatory-compliant DeFi products tailored to the institutional market (
Umami 2022). The Umami team is building a suite of rigorously tested, highly scalable vaults that generate sustainable returns on key crypto assets (e.g.,
$USDC,
$ETH and
$BTC). Umami’s goal is to establish decentralized, permissionless smart contracts as the foundation of the global financial system and enable financial autonomy for investors around the world. The Umami Finance protocol pays out a portion of the return to market participants who stake their governance tokens. In short, the Umami Protocol uses a delta-neutral strategy where it earns returns on both long and short positions (
Umami 2022). It is expected to be able to generate returns between 15–35% while remaining delta neutral. For historical comparison, as far as Umami Finance is concerned, its non-native treasury assets were worth
$5.6 m in February 2022, and by the end of May 2022 they had fallen to
$5.4 m (a drop of
$0.2 m), a decline of 3.5%. It is also important to note that the broader market has fallen by 30% over the same period. This means that in a declining market, the US Treasury was able to generate enough returns and fees to reward the protocol token holders, cover its operating costs and still outperform the broader market.
Table 2 below shows the variables used in the study and their descriptions.
Table 3,
Table 4 and
Table 5 show some descriptive statistics for different classes of DeFi protocols (lending protocols, decentralized exchanges and DeFi apps).
Table 6 shows similar statistics for the conventional blockchain class. It is worth noting that most DeFi protocols are based on the Ethereum blockchain.
5.2. Methodology
Since the study aims to examine the relationship between the DeFi Protocol valuations and a number of financial variables that can be used to represent and justify the performance of this market, it is assumed that both Granger causality analysis and panel data analysis are methods commonly used to assess the relationship between different variables. Panel data analysis is a widely used statistical method for analysing two-dimensional (i.e., cross-sectional and time-series) data. In the empirical part, valuations are estimated using panel regressions. More specifically, DeFi protocols are represented as panels and subsequent days as time. The pooled OLS specification assumes that there is no heterogeneity between different DeFi projects, which is expressed by using the following equation:
where
denotes the valuation corresponding to each of the projects and is log-linearized to adjust for disparities, to better explore their dynamic properties and simplify the calculations (
Metelski and Mihi-Ramirez 2015). In other words,
i = 1,2,…, 30 refers to the number of individual projects recorded in the database, and t = 11 January 2022...8 July 2022 refers to consecutive days. The term
is the common intercept,
is the vector with the predicting variables, which means that a specific set of control variables is used to obtain the results. The same predictors are used in all models, i.e., total value locked (tvl), protocol revenue (pr), total revenue (tr), gross merchandise volume (gmv), inflation factor (inf). Moreover, the term
included in the model presented above is the error term. The specification FE with fixed individual effects is expressed by the following equation:
where
represents the fixed effects of each DeFi protocol. It controls for heterogeneity between different DeFi protocols. The difference between the FE specification and the OLS model is that the former, unlike the latter, reflects DeFi protocols’ effects, which are reflected in the term
. Therefore,
can be viewed as the ignorance about all of the other systematic factors that predict DeFi projects’ valuations, other than X’.
In the study, we will also conduct a correlation analysis and check whether there are causal relationships between the variables under study. To this end, we conduct Granger causality and Granger causality reversal tests. For a more detailed explanation of the Granger causality method, see the work by
Metelski and Mihi-Ramirez (
2015).
6. Results
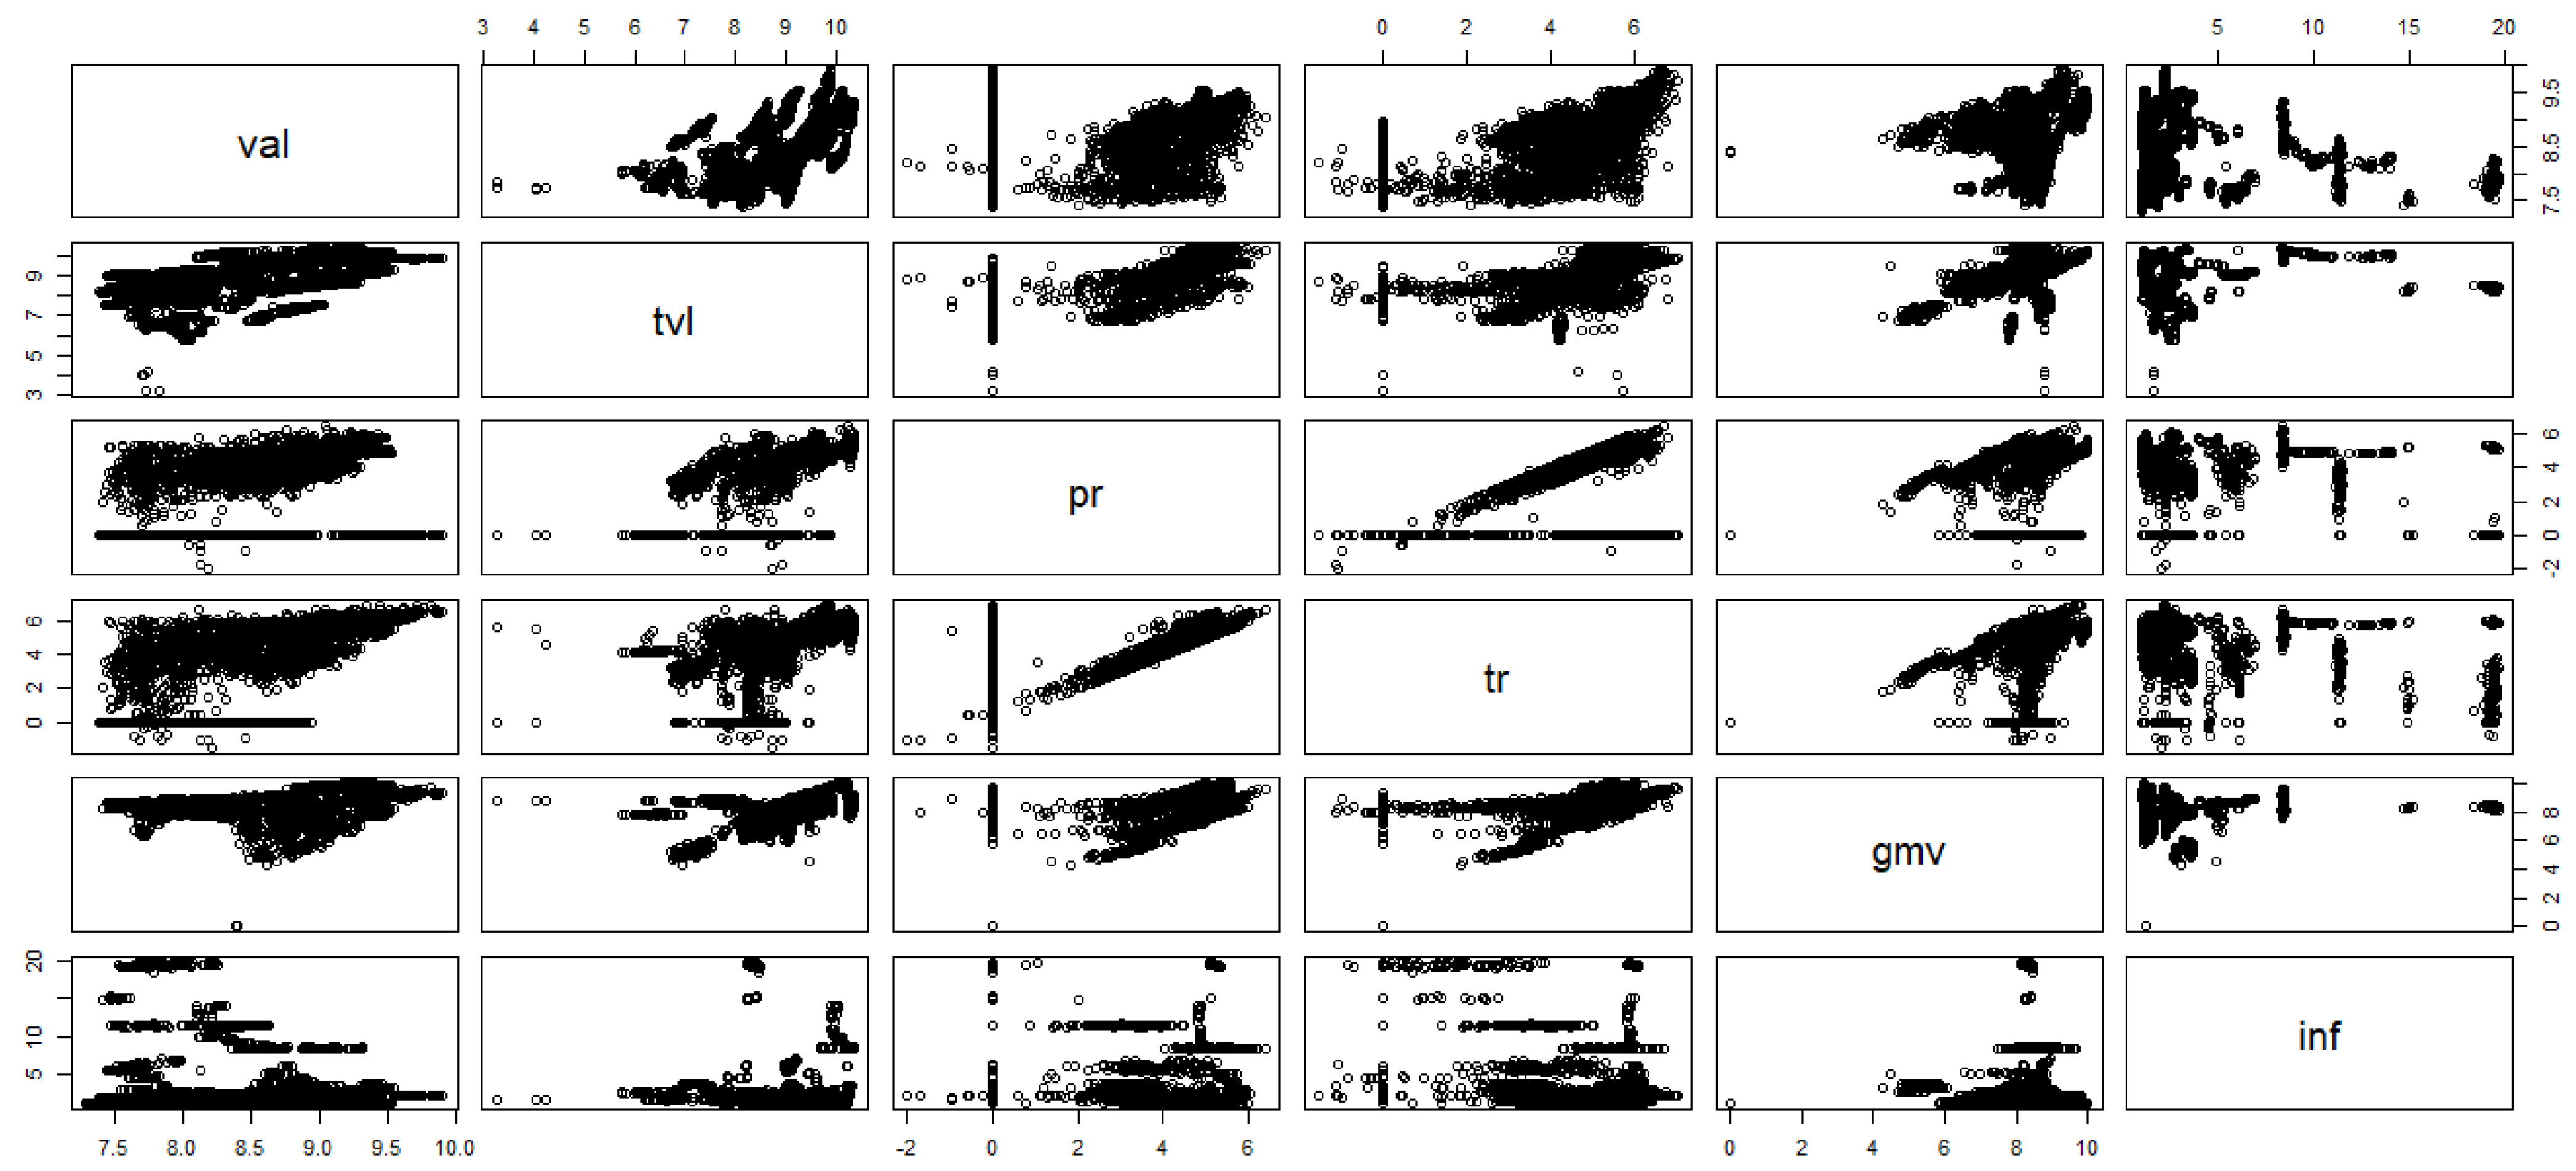
As mentioned earlier, for the analysis, we use daily data from the first two quarters of 2022 (between 11 January and 8 July), specifically data on circulating market capitalization (val) (response variable) and the total value locked (tvl) and a whole host of other variables, i.e., protocol revenue (pr), total revenue (tr), gross merchandise volume (gmv), and inflation factor (inf) (explanatory variables) for 30 different DeFi protocols studied (i.e., Uniswap, Synthetix, Loopring, PancakeSwap, Curve, etc.). The study examines the relationships between the data and, in particular, explores how the TVL and the rest of the explanatory variables affect the valuations of these protocols. In other words, the panel regression analysis aims to provide evidence that helps to better understand what drives DeFi valuations in relation to some intrinsic characteristics and informative metrics of the DeFi protocols. We tested all correlation coefficients (for each pair individually) and found that all corresponding
p-values were less than 0.05 (see
Figure 3 and
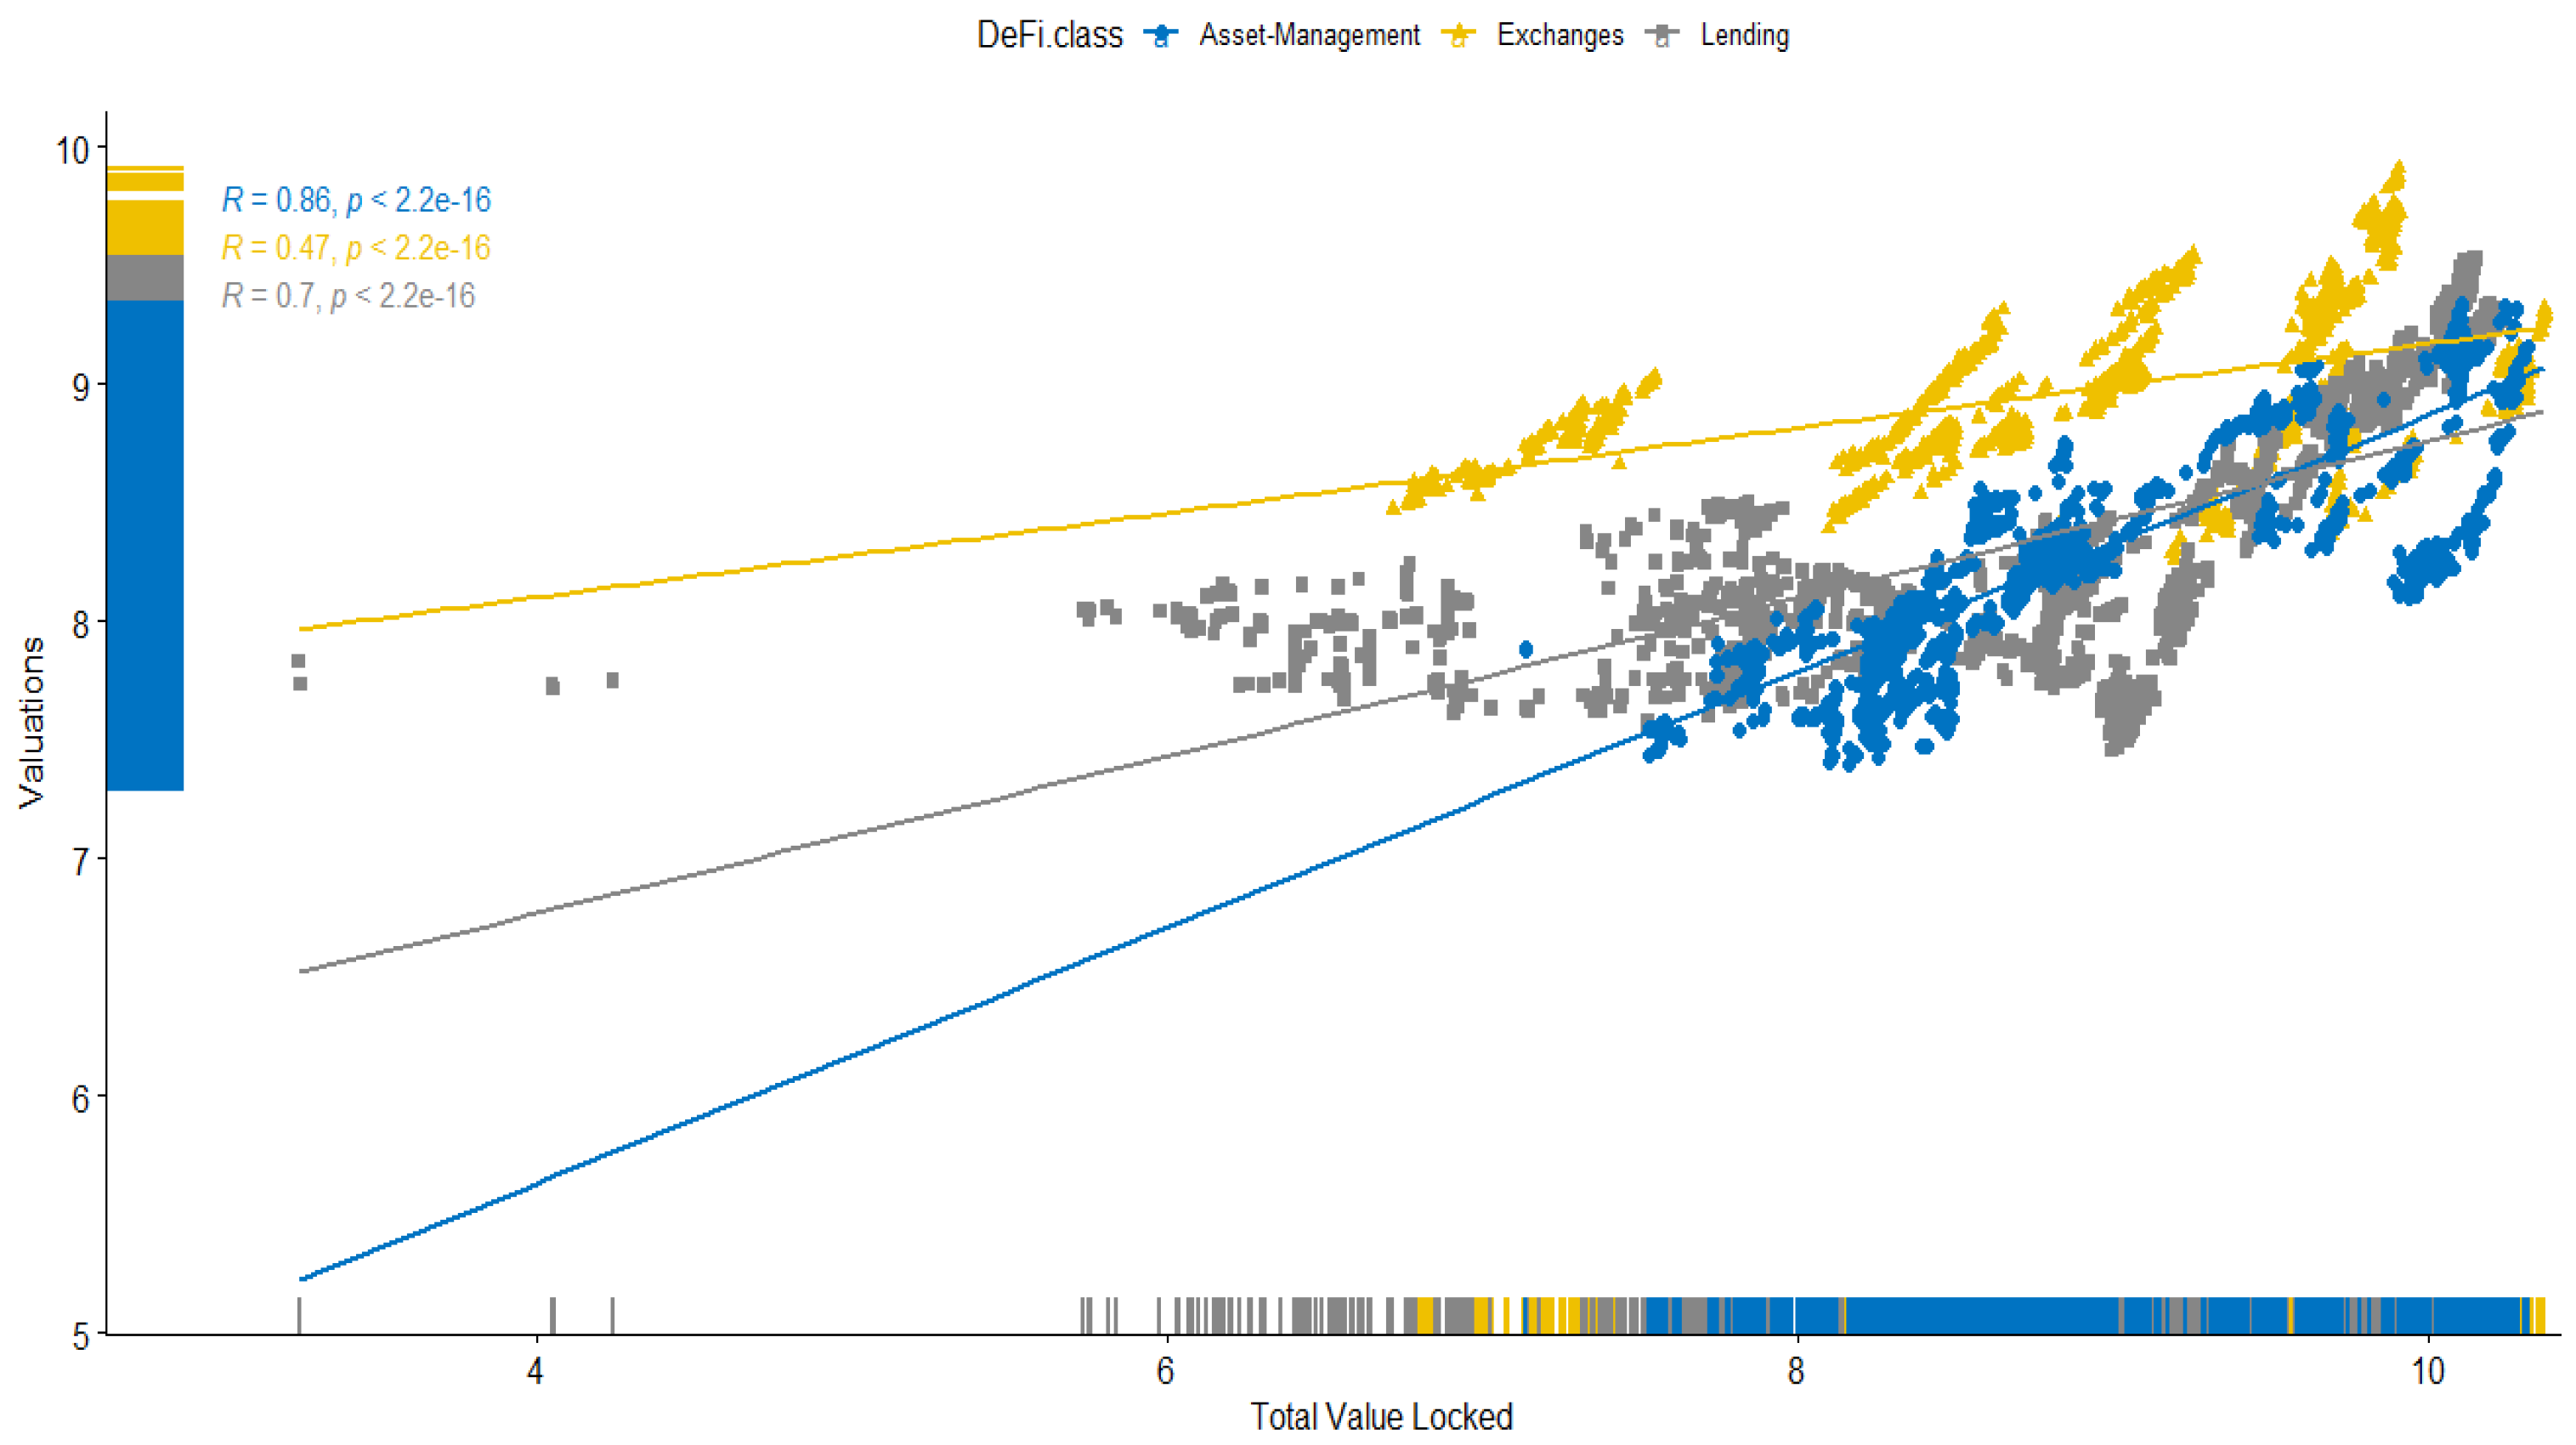
Figure 4). This is an indication that the correlation estimates between the variables studied are statistically significant. For example, the correlation between the valuation of the DeFi protocols and their respective TVLs is 0.6080682, and this is a statistically significant result (Pearson
t-test value = 52.639, df = 4723,
p-value < 2.2 × 10
−16) (see
Figure 3 below). However, it must be taken into account that we are dealing with a time series, so the reliability of such tests is weaker than with cross-sectional data.
Interestingly, for the different classes of DeFi protocols, we can see that the relationships between the valuations of these protocols and their TVLs vary (this can be seen in the elasticities of the regression lines shown in
Figure 3 above). In general, the steepest regression line is for the “Asset Management” class and the flattest for the ‘Decentralized Exchanges” class. It is thus clear that the TVL is relatively more important for “Asset Management” protocols, which seems logical in that the performance of these protocols is much more dependent on the funds under management. To understand this better, an analogy can be drawn with mutual funds, whose valuations depend to a much greater extent (than e.g., other companies in the financial industry) on the amount of capital under management. In general, the value of a fund is determined by its net asset value (NAV), which is equal to the total value of assets minus the total value of liabilities. Moreover, assets under management (AUM) represent the total market value of investments, which depends on the flow of funds entrusted by investors. On the other hand, AUM determines the level of asset management fees, which influence the valuations of these funds (
Boudoukh et al. 2004).
However, the pairwise correlations between the variables studied do not suggest causality. Based on the above results, it is difficult to give a clear answer as to whether TVL and other exogenous variables cause an increase in DeFi valuations, which would confirm our research hypotheses that DeFi valuations are dependent on TVL, total revenue, and gross merchandise volume—which might be perceived as proxies reflecting the success of the DeFi protocols. There is much evidence to suggest that this may be the case. The results of the correlation coefficients give an indication that this is indeed the case. To be sure, we use the Granger causality test to assess the causal relationships between the variables under study (
Thurman and Fisher 1988;
Metelski and Mihi-Ramirez 2015). This can help us understand whether some of the explanatory variables provide statistically significant information about future DeFi valuations. The results of the Granger causality tests suggest that knowledge of DeFi valuations (as measured by daily circulating market capitalization) is useful in predicting future values of the TVL in these protocols [F = 5.6021, Pr(>F) = 0.009755]. As it turns out, of all the explanatory variables included in the study, only the Gross Merchandise Volume can be useful in predicting the future valuations of the DeFi protocols [F = 2.6968, Pr(>F) = 0.04435]. All tested relationships are listed in
Table 7.
The results of the Granger causality tests show the most likely direction of the relationships between the variables. Thus, the results suggest that DeFi protocols’ valuations drive the change in TVL and in other pivotal variables such as protocol revenue and total revenue, and gross merchandise volume. TVL, on the other hand, drives protocol revenue, total revenue, and gross merchandise volume. This could suggest that at this early stage of the DeFi market’s development, increased valuations are attracting new users and liquidity providers to these protocols, which translates into an increase in the total revenue from these protocols, and also an increase in payments to token holders in the form of protocol revenue, which further pulls in new users and new capital (in the form of staking and yield farming). As for the relationships between DeFi protocols’ valuations and the other explanatory variables, the bilateral relationship was only demonstrated for one variable, namely gross merchandise volume. This type of data analysis allows for a better understanding of the relationships that exist between the variables.
In general, a higher TVL of DeFi protocols means greater liquidity, popularity and, at the same time, usability—an indication of the success of DeFi projects. When the TVL increases, it means that more capital is committed to DeFi protocols, which translates into significant benefits and revenues for participants in these protocols. Lower TVLs, on the other hand, mean less availability of funds (liquidity pools) and thus lower revenues from these protocols.
To better explain the assessment of the association of DeFi protocols’ valuations with other variables studied, we also conducted a short panel regression analysis, the ordinary least squares (OLS) and fixed effects model specifications.
The results of the FE model specification can be found in
Table 8. We omit the results of the OLS model specification because the F-test showed that it is inferior to the results of the FE specification (F = 713.02, df1 = 19, df2 = 3174,
p-value < 0.000000000000022; alternative hypothesis: significant effects). All variables were log transformed (
Metelski and Mihi-Ramirez 2015). The logarithmic transformation of the variables in the model has some important advantages. In general, a regression model without transformation has unit changes between the explanatory and response variables, where a unit change in an independent variable coincides with a constant change in the dependent variable. Taking the logarithm of one or both variables, the case changes from a unit change to a percentage change (
Metelski and Mihi-Ramirez 2015).
As far as the modelling assumptions are concerned, a number of tests were carried out to verify that the model used is robust and reliable. In particular, the Breusch-Pagan LM test of independence (chi2(171) = 191.56, Pr = 0.1344) indicates that there is no cross-sectional dependence in the model. As for heteroskedasticity, the modified Wald test (since the best model specification turned out to be the one with fixed effects) confirms that no heteroskedasticity problem was found in the model (Prob > chi2 > 0.05 [chi2 (19) = 27.09, Prob > chi2 = 0.10257]). With regard to the analysis of stationarity, a Fisher’s test was performed (which assumes under the null hypothesis that all series are non-stationary; H0: all panels contain unit roots and the alternative assumes that at least one series in the panel is stationary). The results confirm stationarity (i.e., inverse chi-square(60) P = 91.6689, p-value = 0.0052, and since the p-value is less than 0.05, we reject H0). As for the analysis of the cointegration test, it is assumed that researchers conduct cointegration tests when time series are non-stationary to determine whether they have a stable, long-term relationship. Since we are dealing with already transformed data and stationarity in the model, there is no need to conduct a cointegration test analysis. Furthermore, the F-test of overall significance shows that the variation in the dependent variable (the valuations of the DeFi protocols) is explained by the independent variables (jointly). In other words, the regression model is a better fit than a model that does not contain independent variables. The F-test is used to test the overall significance of the multiple regression by determining whether the variation in the dependent variable (DeFi protocols’ valuations) is explained by the independent variables. It is also worth noting that the goodness of fit () indicates that almost 45% of the variability in the valuations of the DeFi protocols (endogenous variable) is explained by the explanatory (exogenous) variables—which seems to be an indication of a good model.
From the results, it can be concluded that TVL, Total Revenue, and Gross Merchandise Volume have a positive impact on the valuations of DeFi protocols. All beta coefficient estimates for these variables are positive and statistically significant. It should be noted that the influence of the variable TVL on DeFi protocols’ valuations is the largest. These results find a logical explanation as we are dealing with proxies for the performance of DeFi protocols. This is because the more resources that go into these DeFi protocols, the better it is for their valuations (which means that higher valuations are justified). Since the TVL reflects the value of funds paid into the smart contracts of these protocols, higher numbers usually mean higher valuations for these protocols. In turn, the gross merchandise volume is equal to the total value of sales. It has a different meaning for the different classes of DeFi protocols. For decentralized exchanges it is the total trading volume, for lending protocols it is the total borrowing volume and for asset management it is the total trading volume of their product. Total revenue, in turn, is the total fees paid by users of DeFi protocols. It is calculated over a certain period of time. Thus, the daily total revenue for a given day corresponds to the fees paid on that day. The protocol revenue and the inflation factor, on the other hand, show a negative association with DeFi protocols’ valuations, for which there is also a logical explanation. This is because the protocol revenue is equal to the amount of revenue distributed to DeFi token holders. The protocol revenue can therefore be understood in a similar way to the dividends that a public company distributes to its shareholders. In the case of DeFi protocols, the capital paid out is the capital flowing out of the protocol. The inflation factor, on the other hand, reflects the dilution of the valuations, i.e., it has a similar meaning to the issuance of new shares in traditional companies. Even for a typical equity company, an increase in the number of shares in circulation usually has a negative impact on the valuation.
7. Discussion
The emergence of DeFi in 2020 has brought with it the possibility of new forms of investment. From a financial perspective, this is positive as DeFi can help diversify and complement traditional portfolios by seeking returns that are independent of traditional asset classes such as equities and bonds, and by reducing overall sensitivity to traditional markets (
Yousaf and Yarovaya 2022). In particular, some DeFi protocols offer an automated, low-risk way to generate returns with a “delta-neutral” trading strategy that reduces volatility. On the other hand, DeFi represents a completely new field and therefore requires an unconventional view when measuring performance. It is worth noting that there are no comprehensive studies (robust model-based econometric analyses) in the literature that justify the evaluation of DeFi protocols in the context of some specific metrics of a financial nature. The need for such studies has been highlighted by
Kaal et al. (
2022) and
Brucker (
2022), among others. One performance metric that is becoming increasingly popular among DeFi investors is TVL, a cryptocurrency indicator to assess the total value of all assets (funds) deposited in DeFi protocols (TVL can be reported for a single DeFi protocol, but can also be aggregated and reported as a value for all protocols). According to
Zmaznev (
2021), TVL reflects the financial side of DeFi services and their use and is therefore a suitable metric for assessing DeFi protocols. However, it should be noted that DeFi assets are not homogeneous, but are composed of different classes of contributed funds in DeFi protocols, i.e., they include liquidity pools as well as interest or different types of rewards resulting from the services offered in DeFi protocols, such as loans, stakes, or the aforementioned liquidity pools locked in smart contracts. In terms of stakes, the TVL metric should be interpreted as the amount of assets deposited by liquidity providers in DeFi protocols. Such a metric makes it easier to compare different DeFi protocols to select those that offer the highest returns in terms of annual percentage yields (APYs). Of course, it is not possible to flawlessly rank individual protocols (e.g., based on their TVLs), and therefore the demise of a DeFi protocol that offers high staking premiums while having a high TVL cannot be ruled out. An example of this is the recent quick total failure of Terra (LUNA), which allowed up to 20% APY through stakes. TerraUSD (UST) was a stablecoin hosted by the Terra network that became the second blockchain with the highest TVL after Ethereum in the second quarter of 2022 (
Azar et al. 2022).
Typically, TVL can be used to assess whether an individual DeFi protocol is sound and worth investing in. As a rule of thumb, determining the value of TVL sometimes requires more sophisticated mathematics than taking into account all deposits, withdrawals and determining the actual amount held in a DeFi protocol and deposited in smart contracts. The TVL is also affected by the value of the native token and the fiat currency in which it is denominated. Therefore, the TVL changes when these values change. An increase in the value of a DeFi token therefore leads to an increase in its TVL (
Saengchote 2021). The TVL is important from the perspective of DeFi protocols because it is their lifeblood and enables them to operate; without deposited capital, in the form of smart contracts, DeFi protocols could not function. In this context, the TVL can be interpreted as an early indicator of the potential gains of DeFi protocols as well as the benefits to participants and investors in these protocols.
In addition to TVL, this study also considers metrics such as protocol revenue, total revenue, gross merchandise volume and the inflation factor. Each of these metrics is important in its own way (in the context of the DeFi assessment) from the perspective of both project teams and investors. However, if one takes protocol revenue and total revenue, for example, it is interestingly difficult to find broader definitions for these terms that explain how the two metrics differ. It turns out that the difference between them is significant. First of all, protocol revenue and total revenue have different economic meanings for token holders. Protocol revenue includes only the revenue paid to the owners of the protocol and/or its token holders, while total revenue also takes into account the revenue of supply-side participants. Supply-side participants, for example, can be defined as liquidity providers who receive a certain number of liquidity provider tokens (LPTs) when they deposit their cryptocurrency into the DeFi pool. What the policy of each DeFi protocol is in terms of revenue generated depends largely on the individual strategies of those protocols. The design teams of the DeFi protocols are staffed by the respective strategists and project managers who develop the financial and marketing policies implemented in the smart contracts. These policies define, among other things, the strategy plans for issuing additional tokens (minting, burning), payouts, rewards, etc. It is in this context that the inflation factor variable, which was included in our study (and whose broader definition is included in
Table 2), should be understood. In fact, all these points are interlinked and form part of complex DeFi protocol strategies. A number of complex factors such as adding new tokens or removing them, involving market participants in the development of DeFi platforms by issuing governance tokens (
Şoiman et al. 2022), offering high rewards for providing liquidity (to attract capital to the protocol so that the whole project gains momentum)—these are all elements of complex system dynamics that ultimately lead either to the success or failure of the project. In the case of Terraform Labs, the company behind Terra USD (UST) and Terra (LUNA), their flawed adoption led to the collapse of the entire project. It is therefore worth highlighting and analyzing these problems. By clearly pointing them out, we also see the value and contribution of this study.
The results also show that GMV has a significant Granger effect on DeFi protocol valuations, implying that there is some kind of interaction between the two variables. In practise, this can be seen as a kind of relationship between variables, where each of the variables under consideration influences the other reciprocally. This confirms that the GMV is particularly useful as an indicator for analyzing the growth potential of DeFi projects/applications/protocols. This indicator makes it possible to estimate the performance of DeFi protocols’ business models over time. Simply put, DeFi market participants can use the GMV indicator to easily compare protocols with a similar business model. Obviously, the higher the value of the indicator, the greater the DeFi protocol. From the investor’s perspective, the GMV enables the selection of business projects with higher growth potential and the estimation of the growth of financial performance in the future. In addition, the GMV indirectly shows who is the leader in a particular niche. The higher the value, the better known a project is among its participants/users. In the context of the DeFi protocols and the results of the study (both the causality analysis and the panel regression analysis), it can be assumed that the GMV is strongly undervalued in contrast to the TVL. The causality analysis suggests that GMV is the only variable that Granger-causes future DeFi protocol valuations.
In contrast, the results of the panel regression analysis study show that the beta coefficients of the variables protocol revenue, total revenue and inflation rate are small and therefore these variables have low predictive power (compared to TVL and GMV), although on the other hand, the direction of these relationships suggests that slightly higher valued projects are those that distribute less revenue to their token holders and control their token supply in circulation more restrictively. It is likely that in the early stages of development of these projects, retained revenues may have a positive impact on subsequent valuations. In the early stages of project development (presumably to maximize the network effect), distribution to supply-side participants in the form of liquidity pools might make more sense from the perspective of the project teams behind the development of the DeFi protocols.
As a future research direction, it might be interesting to link DeFi protocol valuations to the treasury metric (which is the value of project funds held in the chain and includes the value of unallocated governance tokens). The value of the treasury can be seen as an indicator of the financial strategies of each protocol, which of course are also related to the reward distribution policy. This would make it possible to examine the correlation between the distribution policy of the rewards and the overall strategies of the individual protocols.
8. Conclusions
The study is based on a dual quantitative methodology (panel data analysis + Granger causality) and analyzes the valuations of 30 selected protocols representing three different classes of DeFi projects (i.e., decentralized exchanges, lending protocols and asset management) in terms of their relevant performance metrics. More specifically, the study shows how the valuations of DeFi protocols depend on key financial variables that represent their performance, such as total value locked, protocol revenue, total revenue, gross merchandise volume and inflation factor.
The study shows the results of the pairwise Granger causality tests for all variables and the results of the fixed effects panel regression model. The panel data analysis provides evidence that all five explanatory variables examined influence DeFi protocol valuations (TVL, total revenue and gross merchandise volume—positively; protocol revenue and inflation factor—negatively). Considering that for each explanatory variable studied there is a specific counterpart in the world of traditional finance (e.g., TVL corresponds to assets under management, total revenues to corporate profits, protocol revenues to the share of profits paid to investors, etc.), one can conclude that DeFi protocols’ valuations follow very similar laws to those of traditional finance. As for the Granger causality tests, it could not be confirmed that future valuations of DeFi protocols can be effectively predicted based on knowledge of the TVLs of these protocols, while other directions of causality (unilateral and bilateral) were confirmed, e.g., a causal bilateral relationship between valuations of DeFi protocols and gross merchandise volume. As for the Granger causality tests, knowing the causal relationships between the variables (see
Table 7) can serve to better understand the interdependencies between all variables.
Also, assessing of the correlations between valuations and TVLs for three different classes of DeFi protocols shows that the strongest relationship between DeFi protocol valuations and their respective TVLs is reported for asset management protocols and the weakest for decentralized exchanges (DEXes). In general, the steepest regression line is for the “Asset Management” class and the flattest for the “Decentralized Exchanges” class. It is thus clear that the TVL is relatively more important for “Asset Management” protocols, which seems logical since the performance of these protocols depends much more on the funds under management. To understand this better, an analogy can be drawn with mutual funds, whose valuations depend to a much greater extent (than for other companies in the financial sector, for example) on the amount of capital under management.
In summary, the study firstly confirms the relevance of the relationship between TVL and the performance of DeFi protocols (their valuations). TVL is the most popular indicator for evaluating DeFi projects. The panel analysis study confirms the strongest association of this indicator with valuations themselves, which should not surprise anyone. After all, TVL is considered the lifeblood of DeFi protocols, and without deposited capital, DeFi protocols could not thrive. Moreover, the idea of liquidity pools and yield farming is to offer often unimaginably high returns (over certain, usually short periods of time) in order to attract investors’ attention (which can be interpreted as the cost of promoting the projects). On the other hand, the bicausal relationship between TVL and DeFi protocol valuations could not be confirmed. Second, the study highlights the need to consider metrics other than TVL, investor attention or associations with the classic cryptocurrency market (such as Bitcoin or Ethereum) when evaluating DeFi protocols (or selecting appropriate protocols in an investment context).
Third, the paper clarifies some DeFi-related definitions (for the metrics on which the study is based) that are also not found in the literature. While one can read about the GMV indicator in the context of some internet projects (mainly e-commerce) (
Yan et al. 2017;
Prokhorova 2020;
Sharma 2021), few know that it can also be effectively used to evaluate DeFi protocols as an indicator (as confirmed by the results of our study and both Granger causality and panel data analysis). We also clarify the differences between protocol revenues and total revenues by justifying their relevance (importance) from the perspective of investors/market participants and DeFi protocol design teams. In particular, in the context of the latter (i.e., the design teams), we highlight that these issues form an important part of the design strategies they develop, which are later implemented in smart contracts.
Fourth, the study highlights the importance of controlling the supply of tokens in the investment policy of project development teams, while also pointing out that this is an important issue for participants in this market—and is not always perceived negatively. Very often, the additional supply of tokens is linked to the participation of users and market participants in the development of the protocols themselves (through governance tokens). Again, much depends on the strategy of a protocol and it is impossible to determine conclusively whether this will have a positive or negative impact on the future of the projects themselves. Often the performance of two projects with similar initial conditions will be different.
Fifth, the diversity of the DeFi market (which is not homogeneous) is explained in the paper. Within this market, there are different categories of business models, including decentralized exchanges, lending protocols and asset management protocols. In a simple experiment, shown in
Figure 3, we can see that the sensitivity of valuations to inflows and outflows of funds is different for the different categories of DeFi protocols. This is reflected in the different elasticities of the regression lines (reflecting valuations regressed on the TVL values). As it turns out, the steepest regression line is for the Asset Management class and the flattest for the Decentralized Exchanges class. It is clear, then, that the TVL is relatively more important for the “Asset Management” protocols.
Finally, the practical application of the findings presented in this paper is that they contribute to a better understanding of what drives DeFi protocol valuations and what indicative performance metrics to look for. In other words, the paper contributes to systematizing knowledge about the determinants of DeFi protocol assessments. A fairly extensive literature review presented in the paper provides a better understanding of the importance of DeFi protocols as an alternative to traditional finance. Drawing on the literature on the subject, we identify a number of potential determinants of DeFi protocol assessments and investigate their relevance and robustness using two different scientific methods. The article can therefore be seen as a contribution to the broader debate on the valuation of DeFi protocols in the context of financial markets and the value of the assets these protocols represent. The empirical evidence and some conclusions presented in the article can be useful for both theorists and practitioners of the DeFi market.


