Self-Instruction Video Versus Face-to-Face Instruction of Pharmacy Students’ Skills in Blood Pressure Measurement

 , , ,
, , ,
Abstract
1. Introduction
2. Materials and Methods
2.1. Operational Definitions
- Self-instruction video (SIV) to refer to a video recording that demonstrates and explains a skill and that aims to teach the skill without any facilitator or instructor present.
- Face-to-face instruction (FTFI) to refer to an instruction performed by an instructor, whereby the learner and instructor are in the same location and participate in the instruction at the same time [34].
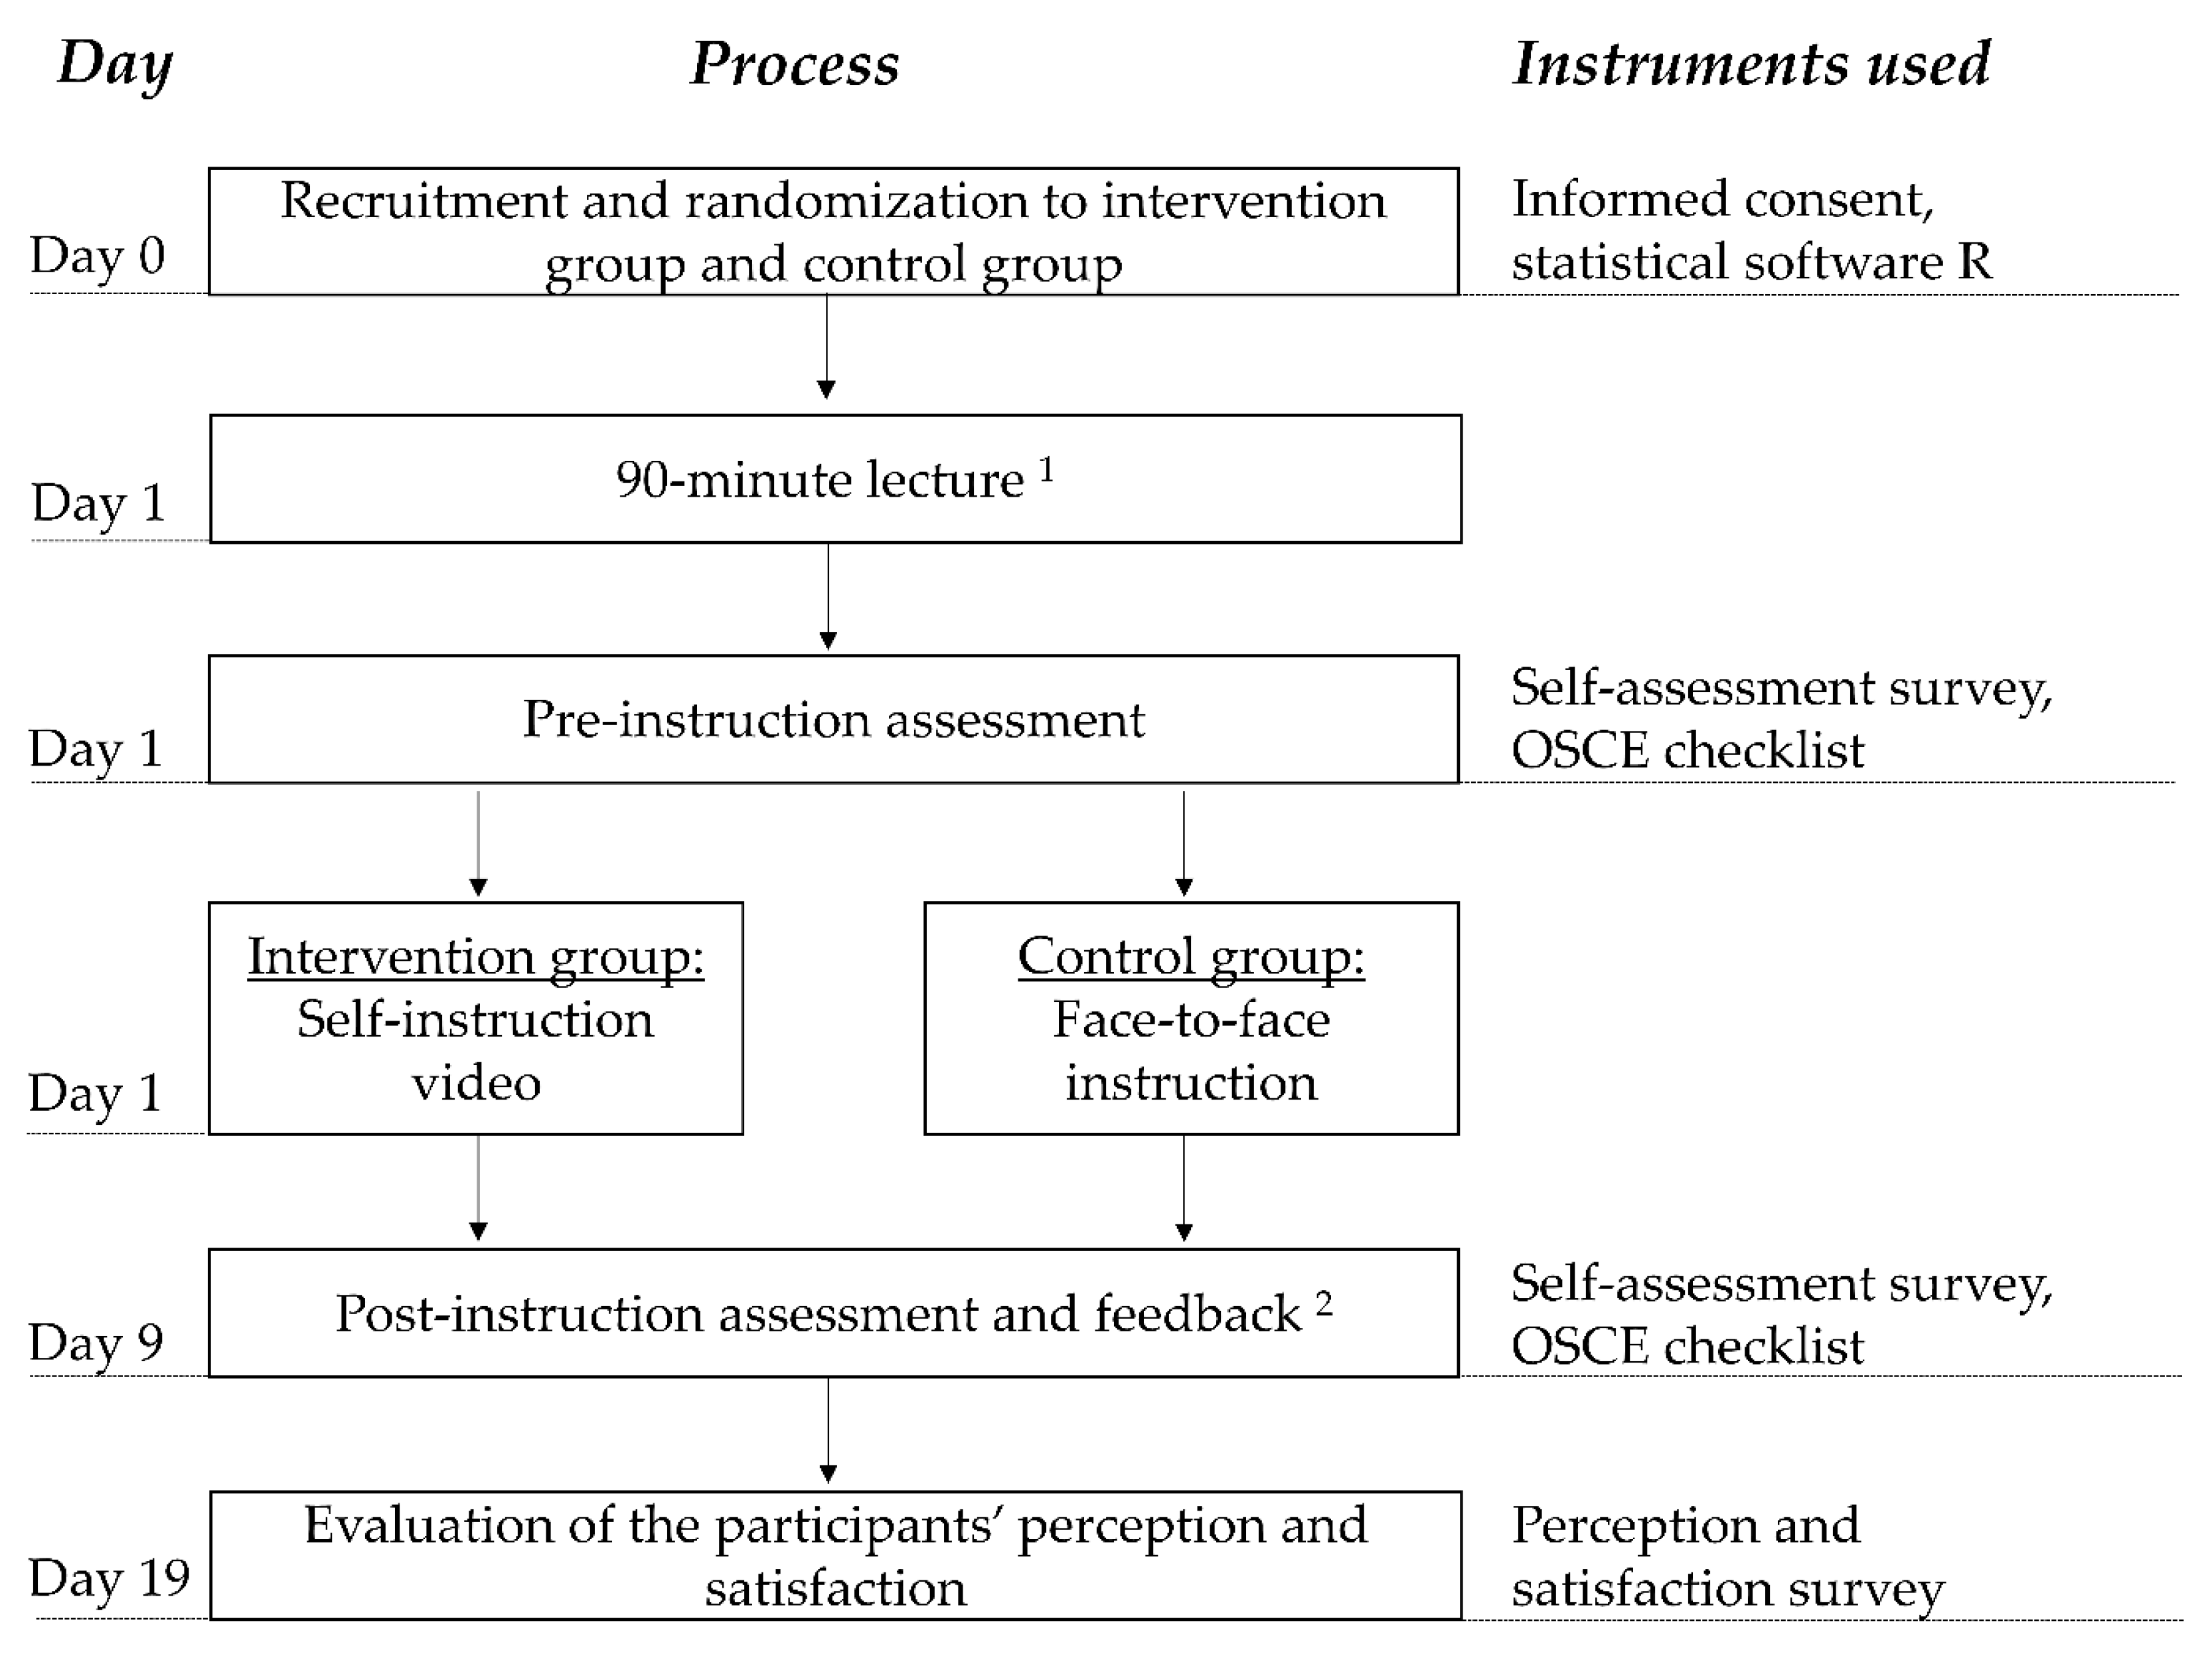
2.2. Participants and Study Design
2.3. Objective Structured Clinical Examination (OSCE)
2.4. Instruction
2.4.1. Self-Instruction Video
2.4.2. Face-to-Face Instruction
2.5. Instruments
2.5.1. OSCE Checklist
2.5.2. Self-Assessment Survey
2.5.3. Perception and Satisfaction Survey
2.6. Statistical Analysis
3. Results
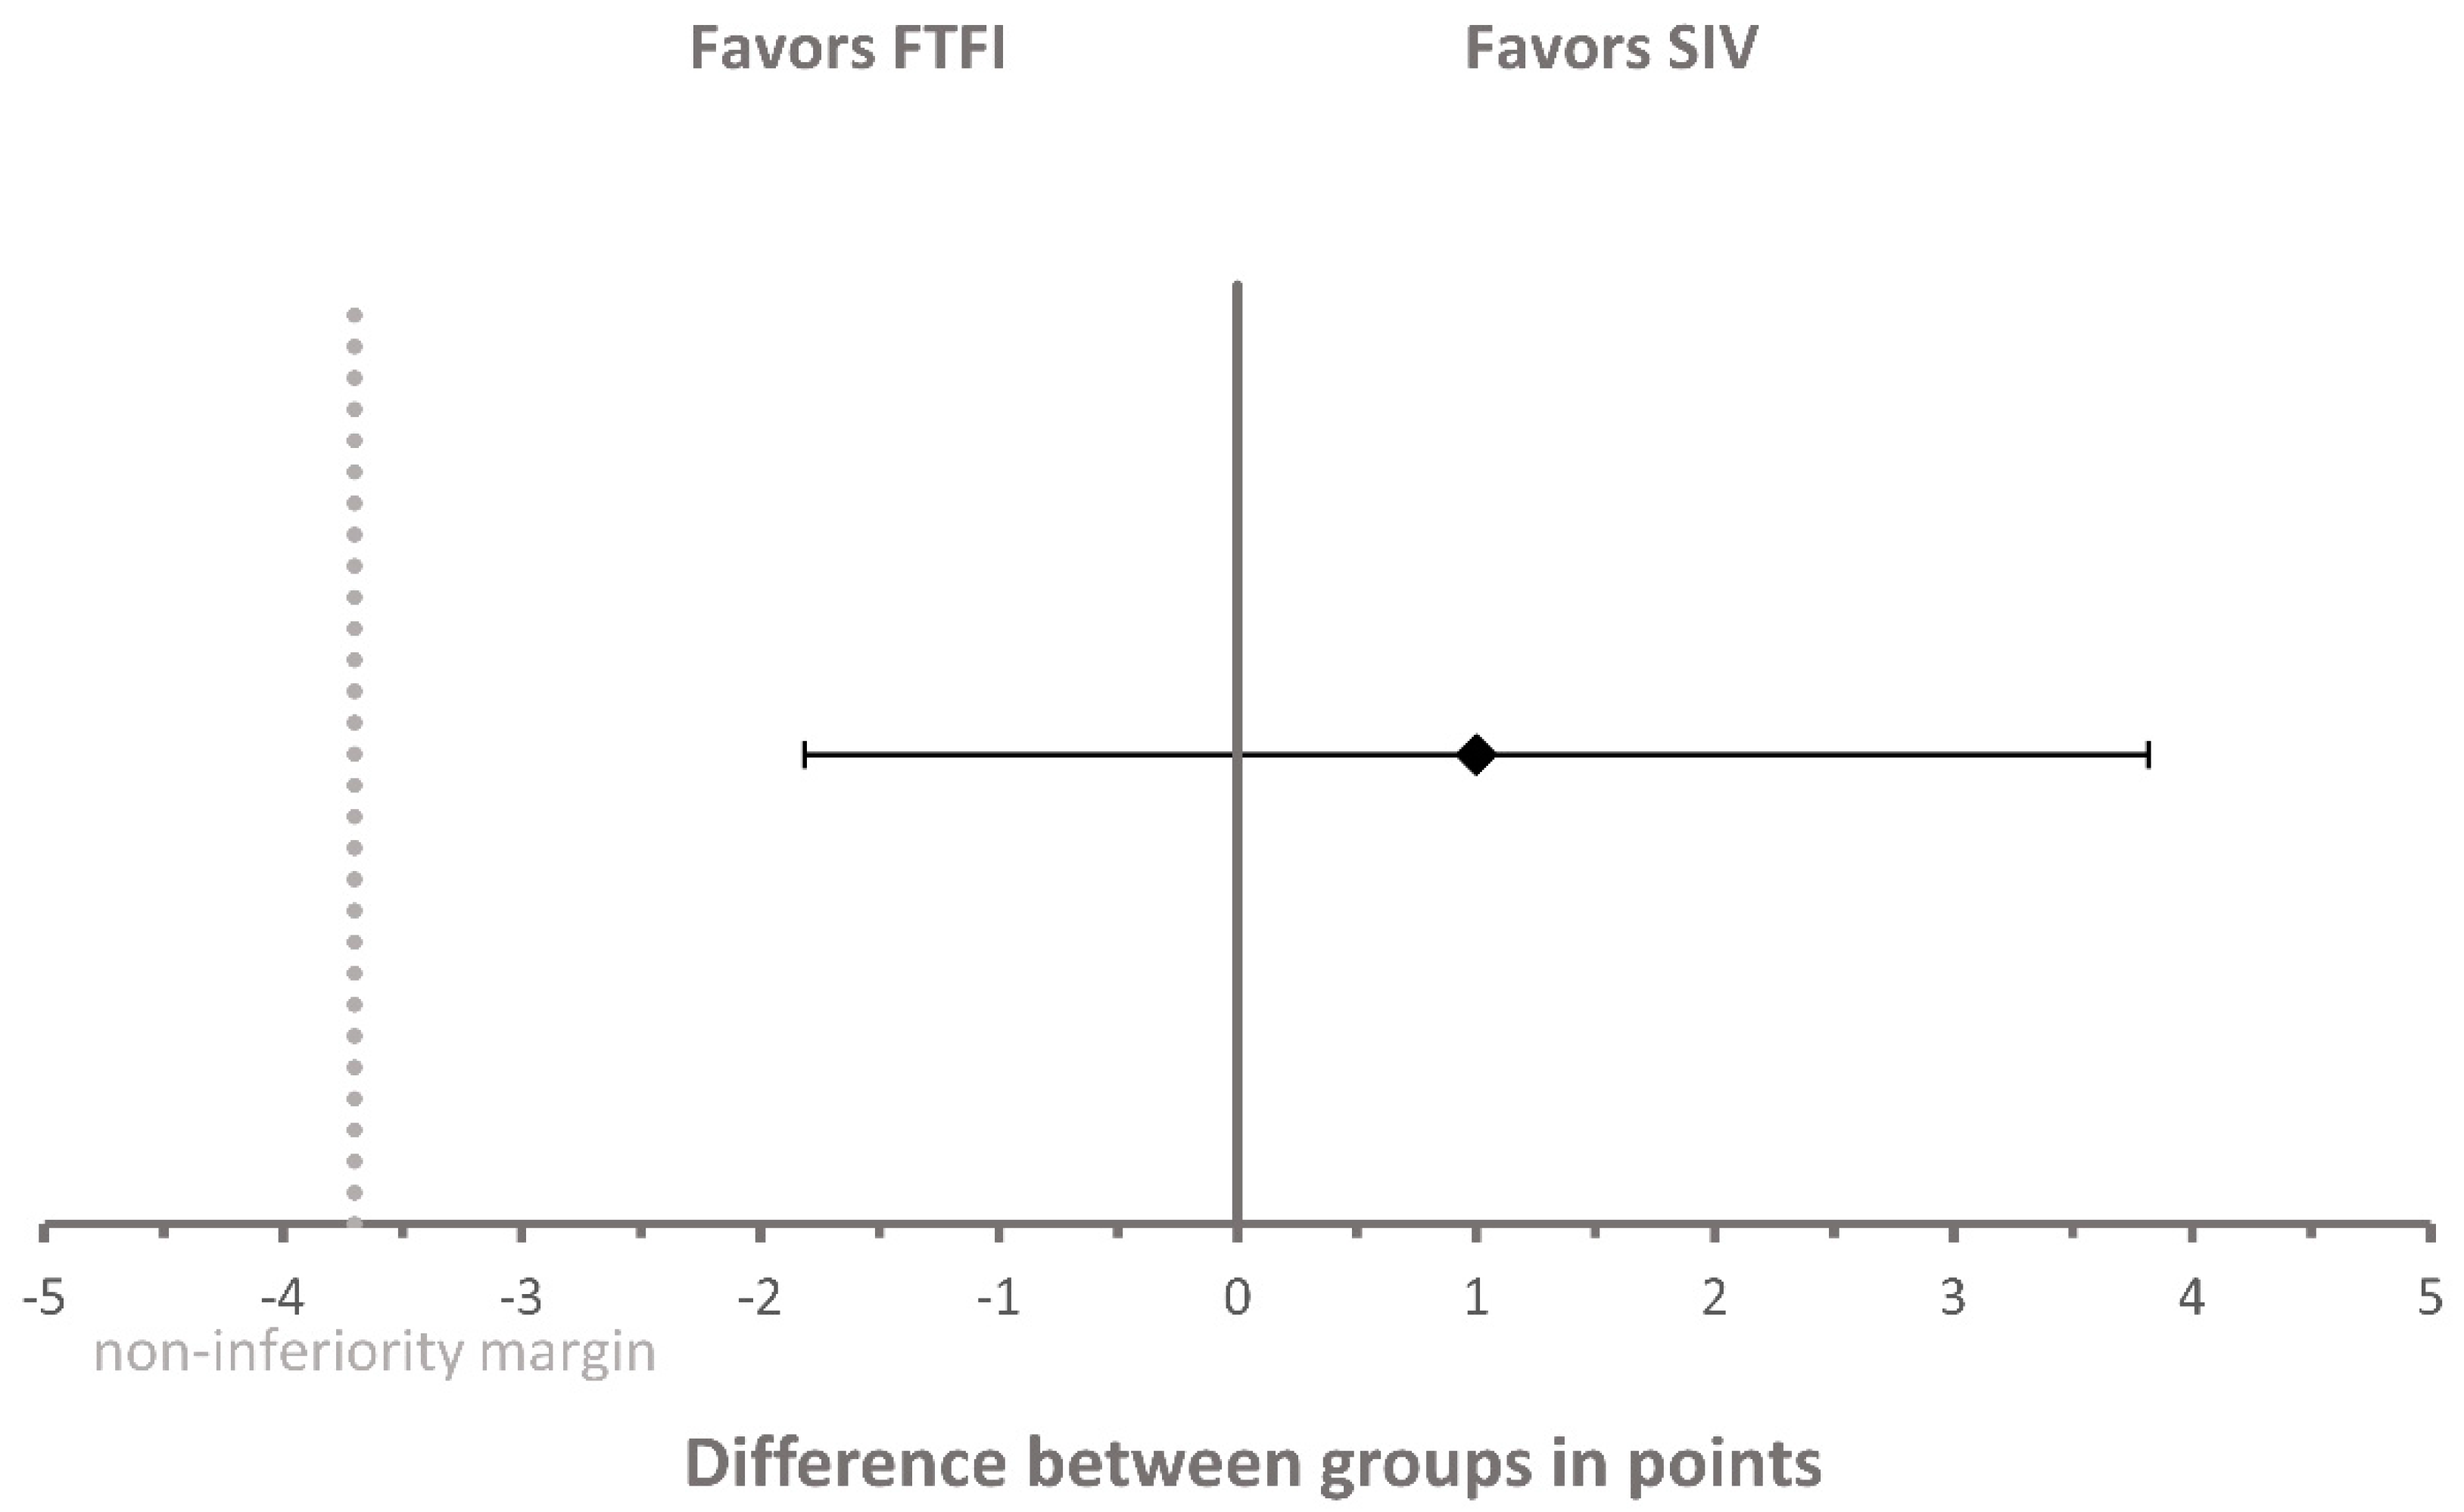
3.1. OSCE Score
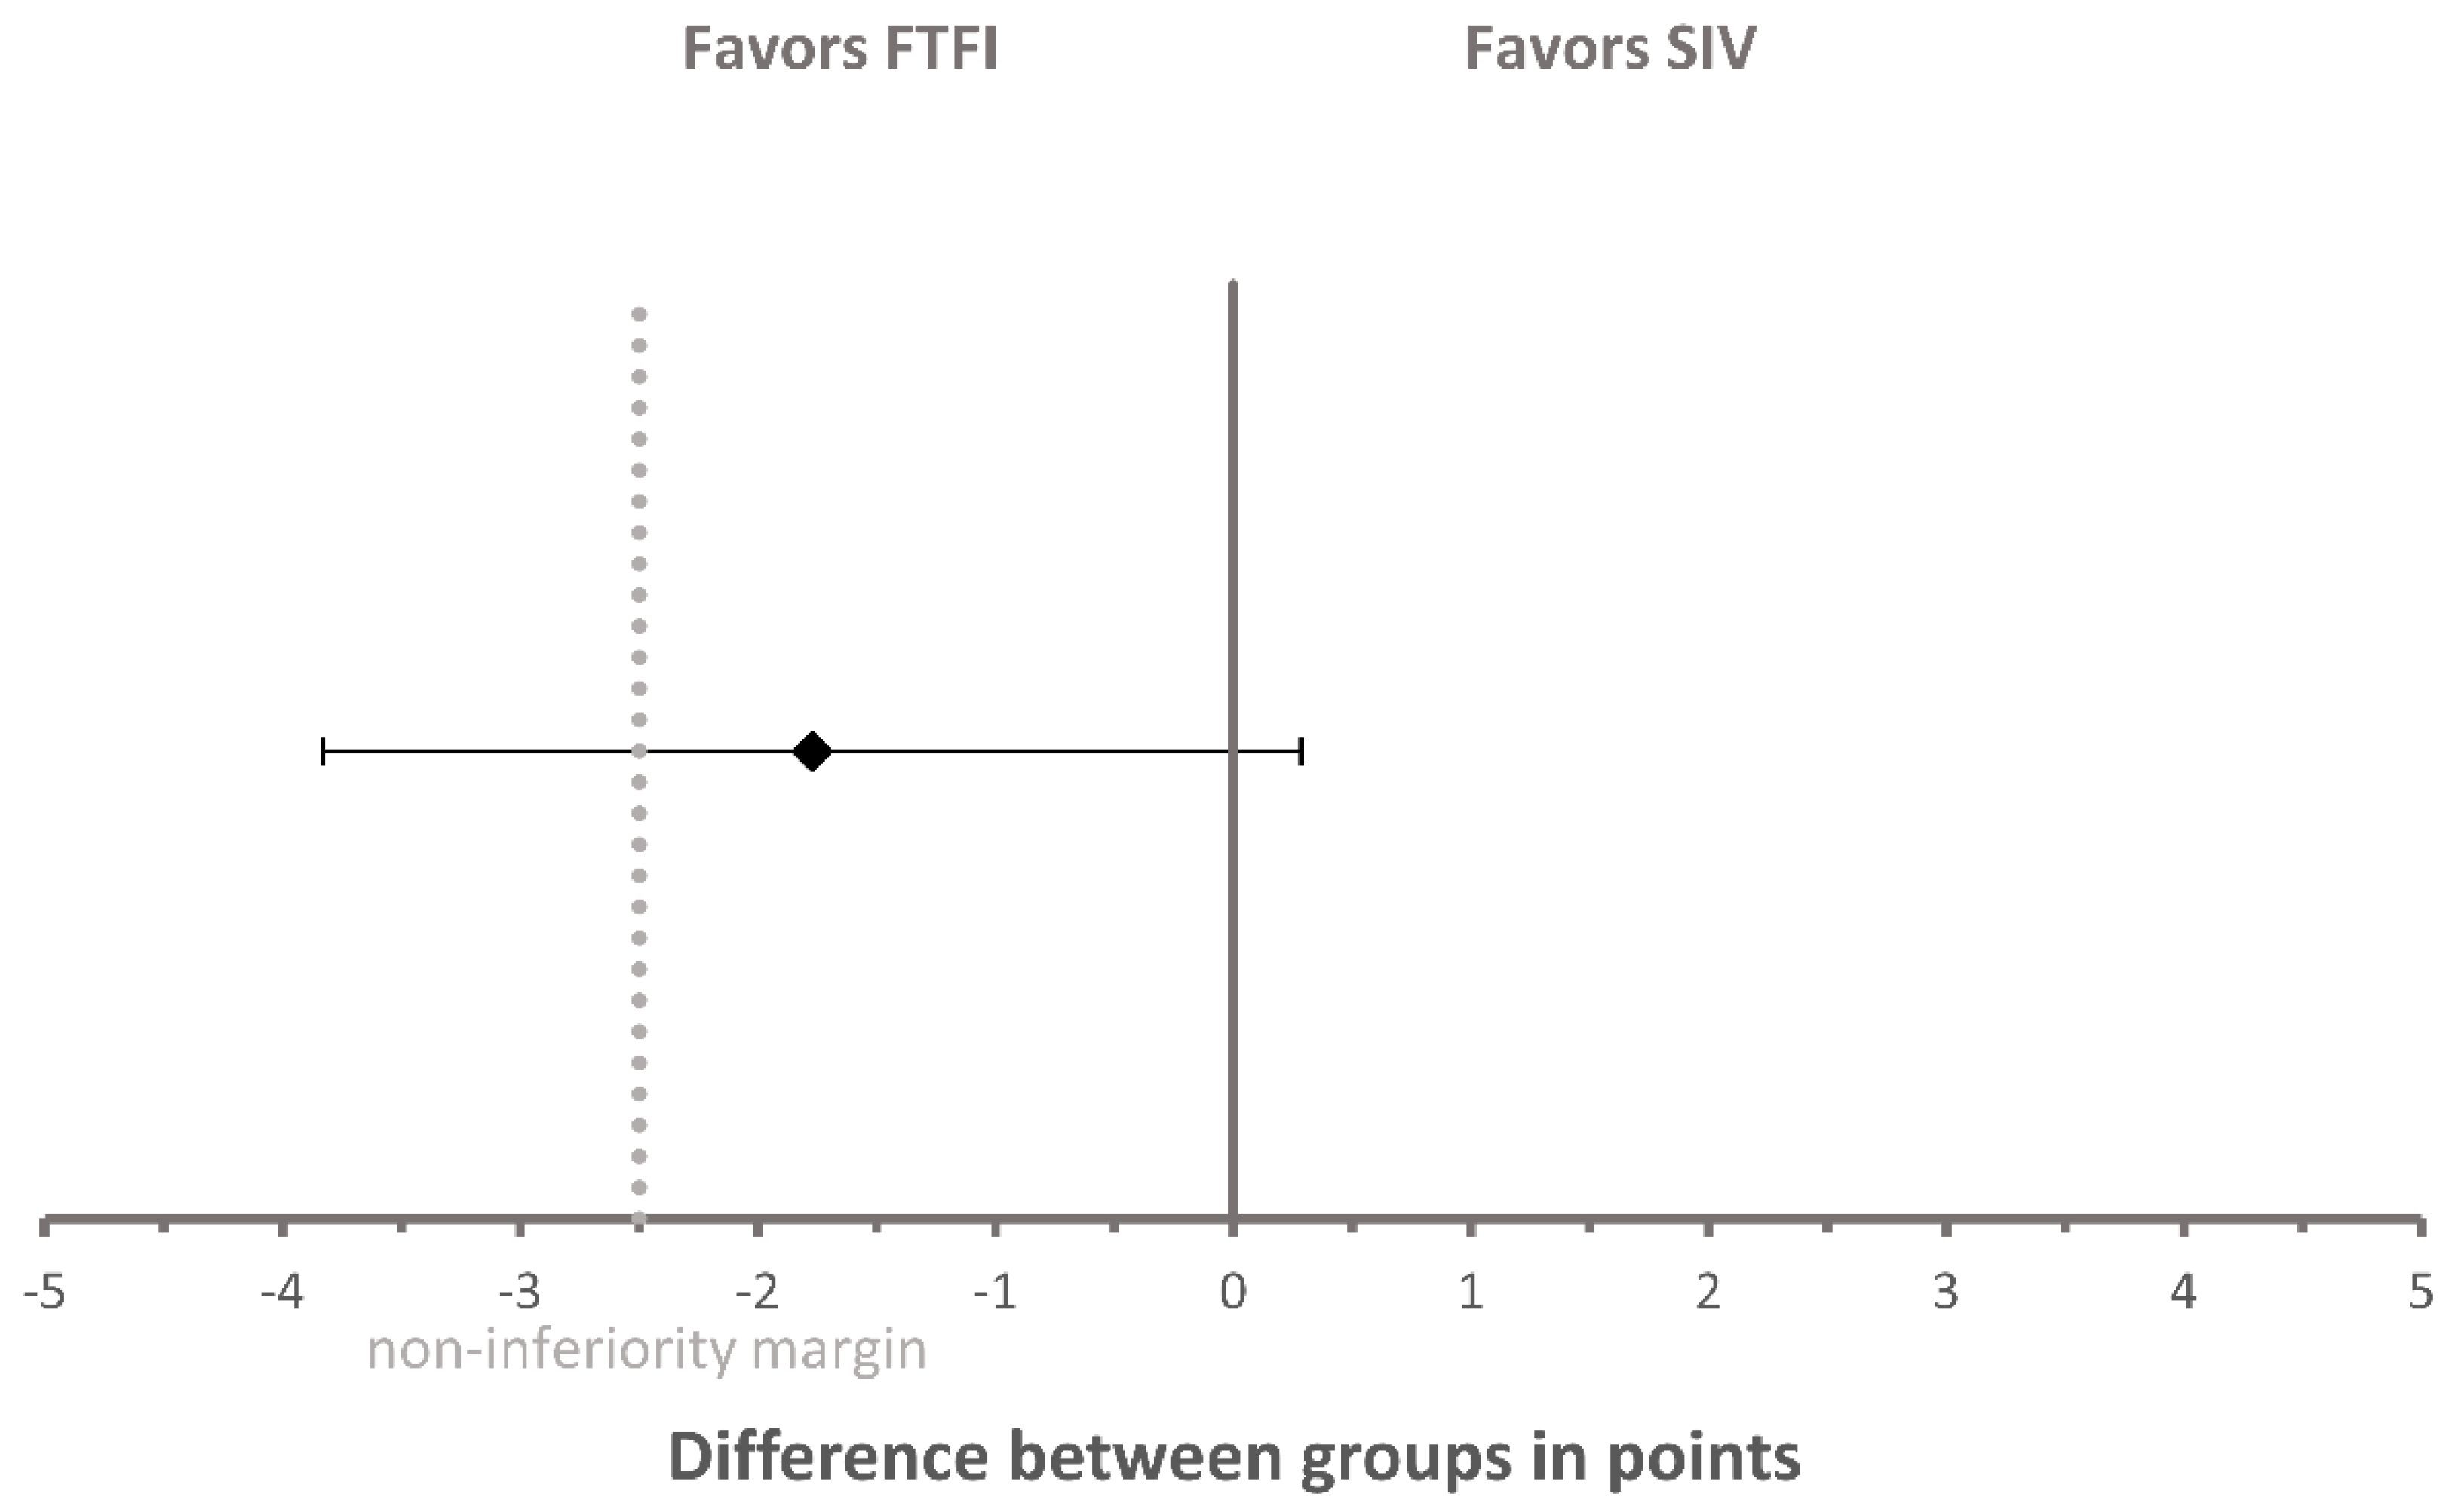
3.2. Self-Assessment Score
3.3. Perception and Satisfaction Survey
4. Discussion
Limitations
5. Conclusions
Supplementary Materials
Author Contributions
Funding
Acknowledgments
Conflicts of Interest
Appendix A

| Face-to-Face Instruction Group (FTFI Group) (n = 21 1) | Self-Instruction Video Group (SIV Group) (n = 22 2) | |
|---|---|---|
| Age in years | ||
| Median (IQR) | 22 (3) | 24.5 (6) |
| Mean (SD) | 23.86 (3.17) | 27.14 (7.91) |
| Gender | ||
| Female, n (%) | 15 (71.43) | 16 (72.73) |
| Male, n (%) | 6 (28.57) | 6 (27.27) |
| Training as a pharmaceutical technical assistant | ||
| Yes, n (%) | 2 (9.52) | 3 (13.64) |
| No, n (%) | 19 (90.48) | 19 (86.36) |
| Currently or formerly worked in a community pharmacy | ||
| Yes, n (%) | 6 (28.57) | 3 (13.64) |
| No, n (%) | 15 (71.43) | 19 (86.36) |
| Have measured BP with an oscillometric device for the first time | ||
| Yes, n (%) | 6 (28.57) | 10 (45.45) |
| No, n (%) | 15 (71.43) | 12 (54.55) |
| Preparation for BP measurement task at pre-instruction assessment | ||
| Yes, n (%) | 0 (0) | 1 (4.55) |
| No, n (%) | 21 (100) | 21 (95.45) |
| Preparation for BP measurement task at post-instruction assessment 2 | ||
| Yes, n (%) | 0 (0) | 3 (13.64) |
| No, n (%) | 22 (100) | 19 (86.36) |
Appendix B
| Proportion of Responses, n (%) | ||||||
|---|---|---|---|---|---|---|
| Strongly Disagree | Disagree | Rather Disagree | Rather Agree | Agree | Strongly Agree | |
| 1. I enjoyed the OSCE seminar on BP measurement. | ||||||
| FTFI group; n = 20 | 0 (0) | 2 (10) | 2 (10) | 7 (35) | 8 (40) | 1 (5) |
| SIV group; n = 21 | 0 (0) | 1 (4.76) | 3 (14.29) | 4 (19.05) | 12 (57.14) | 1 (4.76) |
| 2. During the OSCEs/simulations, I was able to determine my strengths and weaknesses on BP measurement. | ||||||
| FTFI group; n = 20 | 0 (0) | 0 (0) | 0 (0) | 2 (10) | 8 (40) | 10 (50) |
| SIV group; n = 21 | 0 (0) | 1 (4.76) | 0 (0) | 6 (28.57) | 9 (42.86) | 5 (23.81) |
| 3. The level of difficulty of the OSCE case was appropriate. | ||||||
| FTFI group; n = 20 | 0 (0) | 0 (0) | 0 (0) | 4 (20) | 7 (35) | 9 (45) |
| SIV group; n = 20 | 0 (0) | 1 (5) | 1 (5) | 1 (5) | 9 (45) | 8 (40) |
| 4. Ten minutes was an appropriate timeframe to complete the OSCE case. | ||||||
| FTFI group; n = 20 | 0 (0) | 1 (5) | 1 (5) | 4 (20) | 6 (30) | 8 (40) |
| SIV group; n = 21 | 1 (4.76) | 1 (4.76) | 1 (4.76) | 2 (9.52) | 10 (47.62) | 6 (28.57) |
| 5. The instruction (FTFI or SIV) should take place on a different day than the OSCEs/simulations. | ||||||
| FTFI group; n = 20 | 4 (20) | 6 (30) | 1 (5) | 4 (20) | 3 (15) | 2 (10) |
| SIV group; n = 20 | 4 (20) | 10 (50) | 2 (10) | 0 (0) | 2 (10) | 2 (10) |
| 6. The OSCEs/simulations enabled me to apply the knowledge and skills that I acquired during the instruction. | ||||||
| FTFI group; n = 20 | 0 (0) | 0 (0) | 0 (0) | 3 (15) | 10 (50) | 7 (35) |
| SIV group; n = 21 | 0 (0) | 0 (0) | 1 (4.76) | 6 (28.57) | 9 (42.86) | 5 (23.81) |
| 7. After this seminar, I feel better prepared for the correct BP measurement in the community pharmacy. | ||||||
| FTFI group; n = 20 | 0 (0) | 0 (0) | 0 (0) | 4 (20) | 7 (35) | 9 (45) |
| SIV group; n = 21 | 0 (0) | 0 (0) | 0 (0) | 4 (19.05) | 12 (57.14) | 5 (23.81) |
| 8. Carrying out the OSCEs/simulations increased my self-confidence in performing BP measurements on real patients in the community pharmacy. | ||||||
| FTFI group; n = 20 | 0 (0) | 0 (0) | 2 (10) | 6 (30) | 5 (25) | 7 (35) |
| SIV group; n = 21 | 0 (0) | 0 (0) | 0 (0) | 4 (19.05) | 13 (61.90) | 4 (19.05) |
| 9. The SIV was helpful for the preparation for the OSCEs/simulations. | ||||||
| FTFI group; n = 0 | Not applicable | |||||
| SIV group; n = 21 | 0 (0) | 0 (0) | 2 (9.52) | 3 (14.29) | 7 (33.33) | 9 (42.86) |
| 10. The FTFI was helpful for the preparation for the OSCEs/simulations. | ||||||
| FTFI group; n = 20 | 0 (0) | 0 (0) | 2 (10) | 5 (25) | 7 (35) | 6 (30) |
| SIV group; n = 0 | Not applicable | |||||
| 11. In the future, instruction videos should be included in the teaching of clinical pharmacy. | ||||||
| FTFI group; n = 11 | 0 (0) | 0 (0) | 0 (0) | 2 (18.18) | 4 (36.36) | 5 (45.45) |
| SIV group; n = 20 | 0 (0) | 0 (0) | 2 (10) | 4 (20) | 7 (35) | 7 (35) |
| 12. OSCEs/simulations about BP measurement are superfluous because one can do nothing wrong with the BP measurement. | ||||||
| FTFI group; n = 18 | 11 (61.11) | 7 (38.89) | 0 (0) | 0 (0) | 0 (0) | 0 (0) |
| SIV group; n = 20 | 14 (70) | 5 (25) | 1 (5) | 0 (0) | 0 (0) | 0 (0) |
| 13. In the future, OSCEs/simulations for training of practical skills (such as BP measurement) should be included as a regular part of the clinical pharmacy course. | ||||||
| FTFI group; n = 16 | 0 (0) | 0 (0) | 0 (0) | 3 (18.75) | 9 (56.25) | 4 (25) |
| SIV group; n = 21 | 0 (0) | 1 (4.76) | 1 (4.76) | 3 (14.29) | 8 (38.10) | 8 (38.10) |
Appendix C
| Group | Free-Text Item | Topics |
|---|---|---|
| Face-to-face instruction group | What did you particularly like about the face-to-face instruction? |
|
| ||
| ||
| I would change the following about the face-to-face instruction: |
| |
| ||
| ||
| Self-instruction video group | What did you particularly like about the self-instruction video? |
|
| ||
| ||
| I would change the following about self-instruction video: |
| |
| ||
|
References
- Global Burden of Metabolic Risk Factors for Chronic Diseases Collaboration. Cardiovascular disease, chronic kidney disease, and diabetes mortality burden of cardiometabolic risk factors from 1980 to 2010: A comparative risk assessment. Lancet Diabetes Endocrinol. 2014, 2, 634–647. [Google Scholar] [CrossRef]
- Mills, K.T.; Bundy, J.D.; Kelly, T.N.; Reed, J.E.; Kearney, P.M.; Reynolds, K.; Chen, J.; He, J. Global Disparities of Hypertension Prevalence and Control: A Systematic Analysis of Population-Based Studies From 90 Countries. Circulation 2016, 134, 441–450. [Google Scholar] [CrossRef] [PubMed]
- Kumar, J. Epidemiology of hypertension. Clin. Queries Nephrol. 2013, 2, 56–61. [Google Scholar] [CrossRef]
- World Health Organization. A Global Brief on Hypertension: Silent Killer, Global Public Health Crisis: World Health Day 2013. World Health Organization. Available online: https://apps.who.int/iris/handle/10665/79059 (accessed on 22 July 2020).
- Blouin, R.A.; Adams, M.L. The Role of the Pharmacist in Health Care: Expanding and Evolving. North Carol. Med. J. 2017, 78, 165–167. [Google Scholar] [CrossRef]
- van Mil, J.W.F.; Schulz, M. A Review of Pharmaceutical Care in Community Pharmacy in Europe. Harv. Health Policy Rev. 2006, 7, 155–168. [Google Scholar]
- World Health Organization. Regional Office for Europe. Pharmacy-Based Hypertension Management Model: Protocol and Guidelines: A Joint CINDI/EuroPharm Forum Project; WHO Regional Office for Europe: Copenhagen, Denmark, 2005; Available online: https://apps.who.int/iris/handle/10665/107638 (accessed on 22 July 2020).
- Morgado, M.P.; Morgado, S.R.; Mendes, L.C.; Pereira, L.J.; Castelo-Branco, M. Pharmacist interventions to enhance blood pressure control and adherence to antihypertensive therapy: Review and meta-analysis. Am. J. Health Syst. Pharm. 2011, 68, 241–253. [Google Scholar] [CrossRef]
- Williams, B.; Mancia, G.; Spiering, W.; Agabiti Rosei, E.; Azizi, M.; Burnier, M.; Clement, D.L.; Coca, A.; de Simone, G.; Dominiczak, A.F.; et al. 2018 ESC/ESH Guidelines for the management of arterial hypertension. Eur. Heart J. 2018, 39, 3021–3104. [Google Scholar] [CrossRef]
- Reid, F.; Murray, P.; Storrie, M. Implementation of a Pharmacist-Led Clinic for Hypertensive Patients in Primary Care—A Pilot Study. Pharm. World Sci. 2005, 27, 202–207. [Google Scholar] [CrossRef]
- Robinson, J.D.; Segal, R.; Lopez, L.M.; Doty, R.E. Impact of a Pharmaceutical Care Intervention on Blood Pressure Control in a Chain Pharmacy Practice. Ann. Pharmacother. 2010, 44, 88–96. [Google Scholar] [CrossRef]
- Santschi, V.; Chiolero, A.; Colosimo, A.L.; Platt, R.W.; Taffé, P.; Burnier, M.; Burnand, B.; Paradis, G. Improving Blood Pressure Control Through Pharmacist Interventions: A Meta-Analysis of Randomized Controlled Trials. J. Am. Heart Assoc. 2014, 3, e000718. [Google Scholar] [CrossRef]
- Cheema, E.; Sutcliffe, P.; Singer, D.R.J. The impact of interventions by pharmacists in community pharmacies on control of hypertension: A systematic review and meta-analysis of randomized controlled trials. Br. J. Clin. Pharmacol. 2014, 78, 1238–1247. [Google Scholar] [CrossRef] [PubMed]
- Kallioinen, N.; Hill, A.; Horswill, M.S.; Ward, H.E.; Watson, M.O. Sources of inaccuracy in the measurement of adult patients’ resting blood pressure in clinical settings: A systematic review. J. Hypertens. 2017, 35, 421–441. [Google Scholar] [CrossRef] [PubMed]
- Handler, J. The Importance of Accurate Blood Pressure Measurement. Perm. J. 2009, 13, 51–54. [Google Scholar] [CrossRef] [PubMed]
- Ray, G.M.; Nawarskas, J.J.; Anderson, J.R. Blood Pressure Monitoring Technique Impacts Hypertension Treatment. J. Gen. Intern. Med. 2011, 27, 623–629. [Google Scholar] [CrossRef] [PubMed][Green Version]
- Muntner, P.; Shimbo, D.; Carey, R.M.; Charleston, J.B.; Gaillard, T.; Misra, S.; Myers, M.G.; Ogedegbe, G.; Schwartz, J.E.; Townsend, R.R.; et al. Measurement of Blood Pressure in Humans: A Scientific Statement From the American Heart Association. Hypertension 2019, 73, e35–e66. [Google Scholar] [CrossRef] [PubMed]
- Maloney, S.; Storr, M.; Paynter, S.; Morgan, P.; Ilic, D. Investigating the efficacy of practical skill teaching: A pilot-study comparing three educational methods. Adv. Health Sci. Educ. Theory Pract. 2013, 18, 71–80. [Google Scholar] [CrossRef]
- Lwin, A.T.; Lwin, T.; Naing, P.T.; Oo, Y.; Kidd, D.; Cerullo, M.; Posen, J.; Hlaing, K.; Yenokyan, G.; Thinn, K.K.; et al. Self-Directed Interactive Video-Based Instruction Versus Instructor-Led Teaching for Myanmar House Surgeons: A Randomized, Noninferiority Trial. J. Surg. Educ. 2018, 75, 238–246. [Google Scholar] [CrossRef] [PubMed]
- Lu, F.; Lemonde, M. A comparison of online versus face-to-face teaching delivery in statistics instruction for undergraduate health science students. Adv. Health Sci. Educ. Theory Pract. 2013, 18, 963–973. [Google Scholar] [CrossRef]
- Kelly, M.; Lyng, C.; McGrath, M.; Cannon, G. A multi-method study to determine the effectiveness of, and student attitudes to, online instructional videos for teaching clinical nursing skills. Nurse Educ. Today 2009, 29, 292–300. [Google Scholar] [CrossRef]
- Mir, M.A.; Marshall, R.J.; Evans, R.W.; Hall, R.; Duthie, H.L. Comparison between videotape and personal teaching as methods of communicating clinical skills to medical students. BMJ 1984, 289, 31–34. [Google Scholar] [CrossRef]
- Zhang, N.; Chawla, S. Effect of implementing instructional videos in a physical examination course: An alternative paradigm for chiropractic physical examination teaching. J. Chiropr. Educ. 2012, 26, 40–46. [Google Scholar] [CrossRef] [PubMed][Green Version]
- Ghirardini, B. E-Learning Methodologies. A Guide for Designing and Developing e-Learning Courses; Food and Agriculture Organization of the United Nations: Rome, Italy, 2011; ISBN 9251070970. [Google Scholar]
- UNESCO. COVID-19 Educational Disruption and Response. Available online: https://en.unesco.org/covid19/educationresponse (accessed on 22 July 2020).
- Sahu, P.K. Closure of Universities Due to Coronavirus Disease 2019 (COVID-19): Impact on Education and Mental Health of Students and Academic Staff. Cureus 2020, 12, e7541. [Google Scholar] [CrossRef] [PubMed]
- Brockfeld, T.; Müller, B.; De Laffolie, J. Video versus live lecture courses: A comparative evaluation of lecture types and results. Med. Educ. Online 2018, 23, 1555434. [Google Scholar] [CrossRef] [PubMed]
- Hibbert, E.J.; Lambert, T.; Carter, J.N.; Learoyd, D.L.; Twigg, S.M.; Clarke, S.J. A randomized controlled pilot trial comparing the impact of access to clinical endocrinology video demonstrations with access to usual revision resources on medical student performance of clinical endocrinology skills. BMC Med. Educ. 2013, 13, 135. [Google Scholar] [CrossRef] [PubMed]
- Yoon, B.Y.; Choi, I.; Choi, S.; Kim, T.-H.; Roh, H.; Rhee, B.D.; Lee, J.-T. Using standardized patients versus video cases for representing clinical problems in problem-based learning. Korean J. Med. Educ. 2016, 28, 169–178. [Google Scholar] [CrossRef][Green Version]
- Holland, A.; Smith, F.; McCrossan, G.; Adamson, E.; Watt, S.; Penny, K. Online video in clinical skills education of oral medication administration for undergraduate student nurses: A mixed methods, prospective cohort study. Nurse Educ. Today 2013, 33, 663–670. [Google Scholar] [CrossRef]
- Pan, M.; Harcharik, S.; Moskalenko, M.; Luber, A.J.; Bernardo, S.; Levitt, J. Instructional video for teaching venepuncture. Clin. Teach. 2014, 11, 436–441. [Google Scholar] [CrossRef]
- George, A.; Blaauw, D.; Green-Thompson, L.; Hajinicolaou, C.; Lala, N.; Parbhoo, K.; Rodda, J.; Velaphi, S.; Kala, U.; Vallabh, P.; et al. Comparison of video demonstrations and bedside tutorials for teaching paediatric clinical skills to large groups of medical students in resource-constrained settings. Int. J. Educ. Technol. High. Educ. 2019, 16, 1–16. [Google Scholar] [CrossRef]
- Saiboon, I.M.; Qamruddin, R.M.; Jaafar, J.M.; Bakar, A.A.; Hamzah, F.A.; Eng, H.S.; Robertson, C.E. Effectiveness of teaching automated external defibrillators use using a traditional classroom instruction versus self-instruction video in non-critical care nurses. Saudi Med. J. 2016, 37, 429–435. [Google Scholar] [CrossRef]
- Klein, J.D.; Spector, J.M.; Grabowski, B.; de laTeja, I. Instructor Competencies. Standards for Face-to-Face, Online, and Blended Settings, 3rd ed.; IAP--Information Age Pub: Greenwich, CT, USA, 2004; ISBN 160752886X. [Google Scholar]
- R Core Team. R: A Language and Environment for Statistical Computing; R Foundation for Statistical Computing: Vienna, Austria, 2018. [Google Scholar]
- Platz, E.; Liteplo, A.; Hurwitz, S.; Hwang, J. Are Live Instructors Replaceable? Computer vs. Classroom Lectures for EFAST Training. J. Emerg. Med. 2011, 40, 534–538. [Google Scholar] [CrossRef]
- Microsoft Corporation. Microsoft Excel 2019 (for Windows); Microsoft Corporation: Redmond, WA, USA, 2019. [Google Scholar]
- OriginLab Corporation. OriginPro 2019; OriginLab Corporation: Northampton, MA, USA, 2019. [Google Scholar]
- De Vries, W.; Turner, N.M.; Monsieurs, K.G.; Bierens, J.J.; Koster, R.W. Comparison of instructor-led automated external defibrillation training and three alternative DVD-based training methods. Resuscitation 2010, 81, 1004–1009. [Google Scholar] [CrossRef] [PubMed]
- Lee, N.-J.; Chae, S.-M.; Kim, H.; Lee, J.-H.; Min, H.J.; Park, D.-E. Mobile-Based Video Learning Outcomes in Clinical Nursing Skill Education: A Randomized Controlled Trial. CIN Comput. Inf. Nurs 2016, 34, 8–16. [Google Scholar] [CrossRef] [PubMed]
- Bazyk, S.; Jeziorowski, J. Videotaped versus Live Instruction in Demonstrating Evaluation Skills to Occupational Therapy Students. Am. J. Occup. Ther 1989, 43, 465–468. [Google Scholar] [CrossRef] [PubMed]
- Nielsen, A.M.; Henriksen, M.J.; Isbye, D.L.; Lippert, F.K.; Rasmussen, L.S. Acquisition and retention of basic life support skills in an untrained population using a personal resuscitation manikin and video self-instruction (VSI). Resuscitation 2010, 81, 1156–1160. [Google Scholar] [CrossRef]
- Lee, J.C.; Boyd, R.; Stuart, P. Randomized controlled trial of an instructional DVD for clinical skills teaching. Emerg. Med. Australas. 2007, 19, 241–245. [Google Scholar] [CrossRef]


| Group | Instrument | Pre-Instruction Assessment Score in Points | Post-Instruction Assessment Score in Points | Change in Points | p-Value | |||
|---|---|---|---|---|---|---|---|---|
| Mean (SD) | Median (IQR) | Mean (SD) | Median (IQR) | Mean (SD) | Median (IQR) | |||
| FTFI | OSCE checklist | 7.95 | 8 | 20.32 | 20 | 12.36 | 11.5 | p < 0.001 |
| (n = 22) | (3.91) | (4) | (3.20) | (4) | (4.51) | (7) | ||
| Self-assessment survey | 12.91 | 14 | 18.05 | 18 | 5.14 | 4.5 | p < 0.001 | |
| (n = 22) | (3.48) | (4) | (2.66) | (2) | (2.62) | (4) | ||
| SIV | OSCE checklist | 7.41 | 6 | 20.77 | 20.5 | 13.36 | 13.5 | p < 0.001 |
| (n = 22) | (3.85) | (7) | (4.28) | (5) | (5.01) | (8) | ||
| Self-assessment survey | 14.14 | 14.5 | 17.5 | 17.5 | 3.36 | 3 | p = 0.001 | |
| (n = 22) | (4.38) | (7) | (2.43) | (3) | (4.17) | (7) | ||
Publisher’s Note: MDPI stays neutral with regard to jurisdictional claims in published maps and institutional affiliations. |
© 2020 by the authors. Licensee MDPI, Basel, Switzerland. This article is an open access article distributed under the terms and conditions of the Creative Commons Attribution (CC BY) license (http://creativecommons.org/licenses/by/4.0/).
Share and Cite
Farahani, S.; Farahani, I.; Burckhardt, B.B.; Schwender, H.; Laeer, S. Self-Instruction Video Versus Face-to-Face Instruction of Pharmacy Students’ Skills in Blood Pressure Measurement. Pharmacy 2020, 8, 217. https://doi.org/10.3390/pharmacy8040217
Farahani S, Farahani I, Burckhardt BB, Schwender H, Laeer S. Self-Instruction Video Versus Face-to-Face Instruction of Pharmacy Students’ Skills in Blood Pressure Measurement. Pharmacy. 2020; 8(4):217. https://doi.org/10.3390/pharmacy8040217
Chicago/Turabian StyleFarahani, Samieh, Imaneh Farahani, Bjoern B. Burckhardt, Holger Schwender, and Stephanie Laeer. 2020. "Self-Instruction Video Versus Face-to-Face Instruction of Pharmacy Students’ Skills in Blood Pressure Measurement" Pharmacy 8, no. 4: 217. https://doi.org/10.3390/pharmacy8040217
APA StyleFarahani, S., Farahani, I., Burckhardt, B. B., Schwender, H., & Laeer, S. (2020). Self-Instruction Video Versus Face-to-Face Instruction of Pharmacy Students’ Skills in Blood Pressure Measurement. Pharmacy, 8(4), 217. https://doi.org/10.3390/pharmacy8040217