Assessing the Understanding of Pharmaceutical Pictograms among Cultural Minorities: The Example of Hindu Individuals Communicating in European Portuguese


Abstract
:1. Introduction
1.1. What are Pictograms?
1.2. Study Objectives
2. Materials and Methods
2.1. Study Participants
2.2. Questionnaire
2.3. Data Analysis
3. Results
3.1. Socio-Demographic Data
3.2. Pictograms Data
3.3. Pictogram Design Data
4. Discussion
4.1. Pictograms Comprehension
4.2. SP and FIP Comparison
4.3. Pictograms Design
4.4. Study Limitations
5. Conclusions
Acknowledgments
Author Contributions
Conflicts of Interest
References
- O’Loughlin, J.; Masson, P.; Déry, V.; Fagnan, D. The role of community pharmacists in health education and disease prevention: A survey of their interests and needs in relation to cardiovascular disease. Prev. Med. 1999, 28, 324–331. [Google Scholar] [CrossRef] [PubMed]
- Van Grootheest, A.C.; de Jong-van den Berg, L.T. The role of hospital and community pharmacists in pharmacovigilance. Res. Soc. Adm. Pharm. 2005, 1, 126–133. [Google Scholar] [CrossRef] [PubMed]
- Bryant, L.J.; Coster, G.; Gamble, G.D.; McCormick, R.N. General practitioners’ and pharmacists’ perceptions of the role of community pharmacists in delivering clinical services. Res. Soc. Adm. Pharm. 2009, 5, 347–362. [Google Scholar] [CrossRef] [PubMed]
- Cramer, J.A.; Roy, A.; Burrell, A.; Fairchild, C.J.; Fuldeore, M.J.; Ollendorf, D.A.; Wong, P.K. Medication compliance and persistence: Terminology and definitions. Value Health 2008, 11, 44–47. [Google Scholar] [CrossRef] [PubMed]
- Balkrishnan, R.; Rajagopalan, R.; Camacho, F.T.; Huston, S.A.; Murray, F.T.; Anderson, R.T. Predictors of medication adherence and associated health care costs in an older population with type 2 diabetes mellitus: A longitudinal cohort study. Clin. Ther. 2003, 25, 2958–2971. [Google Scholar] [CrossRef]
- Ho, P.M.; Rumsfeld, J.S.; Masoudi, F.A.; McClure, D.L.; Plomondon, M.E.; Steiner, J.F.; Magid, D.J. Effect of medication nonadherence on hospitalization and mortality among patients with diabetes mellitus. Arch. Intern. Med. 2006, 166, 1836–1841. [Google Scholar] [CrossRef] [PubMed]
- Barros, I.M.; Alcântara, T.S.; Mesquita, A.R.; Santos, A.C.; Paixão, F.P.; Lyra, D.P. The use of pictograms in the health care: A literature review. Res. Soc. Adm. Pharm. 2014, 10, 704–719. [Google Scholar] [CrossRef] [PubMed]
- Ng, A.W.; Chan, A.H.; Ho, V.W. Comprehension by older people of medication information with or without supplementary pharmaceutical pictograms. Appl. Ergon. 2017, 58, 167–175. [Google Scholar] [CrossRef] [PubMed]
- Kassam, R.; Vaillancourt, L.R.; Collins, J.B. Pictographic instructions for medications: Do different cultures interpret them accurately? Int. J. Pharm. Pract. 2004, 12, 199–209. [Google Scholar] [CrossRef]
- Yasmin, R.; Shakeel, S.; Iffat, W.; Hasnat, S.; Quds, T. Comparative Analysis of Understanding of Pictograms in Pharmacy and non-Pharmacy Students. Intl. J. Sci. Basic Appl. Res. 2014, 13, 197–204. [Google Scholar]
- Barros, I.M.; Alcântara, T.S.; Mesquita, A.R.; Bispo, M.L.; Rocha, C.E.; Moreira, V.P.; Junior, D.P.L. Understanding of pictograms from the United States Pharmacopeia Dispensing Information (USP-DI) among elderly Brazilians. Patient Prefer Adher. 2014, 8, 1493–1501. [Google Scholar]
- Kolers, P. Some formal characteristics of pictograms. Am. Sci. 1969, 57, 348–363. [Google Scholar]
- Dowse, R.; Ehlers, M. Medicine labels incorporating pictograms: Do they influence understanding and adherence? Patient Educ. Couns. 2005, 58, 63–70. [Google Scholar] [CrossRef] [PubMed]
- Fonseca, R. Reading Pictograms and Signs—The Need for Visual Literacy. Master’s Thesis, University of Stavanger, Stavanger, Norway, 2011. Available online: https://brage.bibsys.no/xmlui/handle/11250/185313 (accessed on 1 September 2017).
- Davies, S.; Haines, H.; Norris, B.; Wilson, J.R. Safety pictograms: Are they getting the message across? Appl. Ergon. 1998, 29, 15–23. [Google Scholar] [CrossRef]
- McDougall, S.J.; Curry, M.B.; de Bruijn, O. Measuring symbol and icon characteristics: Norms for concreteness, complexity, meaningfulness, familiarity, and semantic distance for 239 symbols. Behav. Res. Methods Instrum. Comput. 1999, 31, 487–519. [Google Scholar] [CrossRef] [PubMed]
- Rogers, Y. Icon Design for the User Interface. In International Reviews of Ergonomics; Oborne, D.J., Ed.; Taylor & Francis: London, UK, 1989; pp. 129–155. [Google Scholar]
- Wolf, J.S.; Wogalter, M.S. Test and development of pharmaceutical pictorials. Proc. Interface 1993, 93, 187–192. [Google Scholar]
- Foster, J.J.; Afzalnia, M.R. International assessment of judged symbol comprehensibility. Int. J. Psychol. 2005, 40, 169–175. [Google Scholar] [CrossRef]
- Lee, S.; Dazkir, S.S.; Paik, H.S.; Coskun, A. Comprehensibility of universal healthcare symbols for wayfinding in healthcare facilities. Appl. Ergon. 2014, 45, 878–885. [Google Scholar] [CrossRef] [PubMed]
- Montagne, M. Pharmaceutical pictograms: A model for development and testing for comprehension and utility. Res. Soc. Adm. Pharm. 2013, 9, 609–620. [Google Scholar] [CrossRef] [PubMed]
- Health Sciences Library. Health Literacy and Patient Education Guide: Pictograms. 2017. Available online: http://hslibraryguides.ucdenver.edu/c.php?g=259516&p=1732398 (accessed on 22 August 2017).
- Dowse, R.; Ehlers, M.S. The evaluation of pharmaceutical pictograms in a low-literate South African population. Patient Educ. Couns. 2001, 45, 87–99. [Google Scholar] [CrossRef]
- Dowse, R.; Ehlers, M. Pictograms for conveying medicine instructions: Comprehension in various South African language groups. S. Afr. J. Sci. 2004, 100, 678–693. [Google Scholar]
- Soares, M.A. Legibility of USP pictograms by clients of community pharmacies in Portugal. Int. J. Clin. Pharm. 2013, 35, 22–29. [Google Scholar] [CrossRef] [PubMed]
- Instituto Nacional de Estatística. Censos—Resultados Definitivos. Região Lisboa—2011. Available online: http://censos.ine.pt/xportal/xmain?xpid=CENSOS&xpgid=ine_censos_publicacao_det&contexto=pu&PUBLICACOESpub_boui=156651739&PUBLICACOESmodo=2&selTab=tab1&pcensos=61969554 (accessed on 17 December 2016).
- Yu, B.; Willis, M.; Sun, P.; Wang, J. Crowdsourcing participatory evaluation of medical pictograms using Amazon Mechanical Turk. J. Med. Internet Res. 2013, 15, e108. [Google Scholar] [CrossRef] [PubMed]
- Richler, M.; Vaillancourt, R.; Celetti, S.; Besançon, L.; Arun, K.; Sebastien, F. The use of pictograms to convey health information regarding side effects and/or indications of medications. J. Commun. Healthc. 2012, 5, 200–226. [Google Scholar] [CrossRef]

| Education (Years) | Self-Perc. PT Proficiency | Time Living in PT (Years) | ||||||
|---|---|---|---|---|---|---|---|---|
| ≤9 | >9 | ≤5 | >5 | ≤5 | ≤20 | >20 | ||
| Gender | Male | 15 | 16 | 15 | 16 | 15 | 8 | 8 |
| Female | 12 | 7 | 7 | 12 | 7 | 5 | 7 | |
| Total | 27 | 23 | 22 | 28 | 22 | 13 | 15 | |
| Nationality | Portuguese | 11 | 11 | 6 | 16 | 2 | 5 | 15 |
| Hindu | 11 | 10 | 11 | 10 | 14 | 7 | 0 | |
| Pakistani | 5 | 0 | 4 | 1 | 4 | 1 | 0 | |
| Bangladesh | 0 | 2 | 1 | 1 | 2 | 0 | 0 | |
| Total | 27 | 23 | 22 | 28 | 22 | 13 | 15 | |
| Pictogram Id | Images | Pictogram Meaning | Correct Answers Counts (%) |
|---|---|---|---|
| #1 (FIP) |  | Take this medicine in the morning, afternoon and at night | 19 (38%) |
| #2 (USP) | 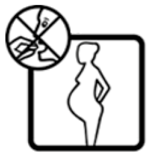 | Do not take this medicine if pregnant | 24 (48%) |
| #3 (FIP) | 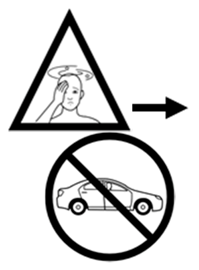 | If this medicine makes you dizzy, do not drive | 25 (50%) |
| #4 (FIP) | 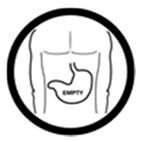 | Take this medicine with an empty stomach | 19 (38%) |
| #5 (USP) | 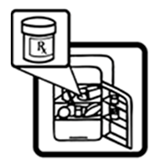 | Store this medicine in the fridge | 24 (48%) |
| #6 (USP) | 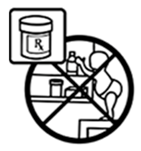 | Keep this medicine out of the reach of children | 32 (64%) |
| #7 (FIP) |  | Do not drink alcoholic beverages during treatment with this medicine | 15 (30%) |
| #8 (USP) |  | Do not break the tablets nor open the capsules | 20 (40%) |
| #9 (USP) | 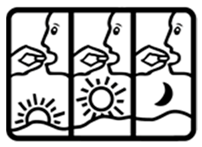 | Take this medicine 3 times per day | 5 (10%) |
| #10 (FIP) | 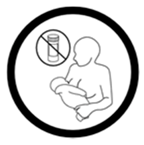 | Do not take this medicine if breastfeeding | 17 (34%) |
| #11 (USP) |  | Take this medicine with meals | 20 (40%) |
| #12 (FIP) | 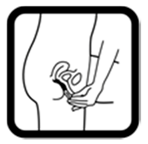 | Insert the medicine in the vagina | 23 (46%) |
| #13 (USP) |  | Do not take this medicine with meals | 26 (52%) |
| #14 (FIP) |  | This medicine can cause sleepiness | 18 (36%) |
| #15 (USP) | 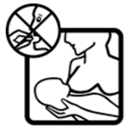 | Do not take this medicine if breastfeeding | 33 (66%) |
| #16 (USP) | 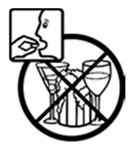 | Do not drink alcoholic beverages during treatment with this medicine | 23 (46%) |
| #17 (USP) | 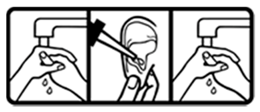 | Wash your hands before and after applying this medicine on the ear | 24 (48%) |
| #18 (FIP) |  | Keep this medicine out of the reach of children | 9 (18%) |
| #19 (FIP) |  | Store this medicine in the fridge | 18 (36%) |
| #20 (FIP) |  | Shake this medicine before using | 26 (52%) |
| #21 (FIP) | 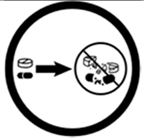 | Do not break the tablets nor open the capsules | 26 (52%) |
| #22 (FIP) | 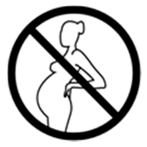 | Do not take this medicine if pregnant | 14 (28%) |
| #23 (FIP) |  | Take this medicine with meals | 12 (24%) |
| #24 (USP) | 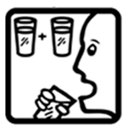 | Drink this medicine with an extra glass of water | 12 (24%) |
| #25 (USP) | 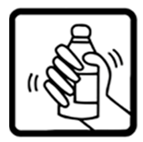 | Shake this medicine before using | 22 (44%) |
| #26 (FIP) |  | Apply one drop of this medicine on the left and on the right ears | 18 (36%) |
| #27 (USP) | 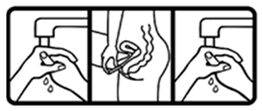 | Wash your hands before and after applying this medicine on the vagina | 35 (70%) |
| #28 (USP) |  | This medicine can cause sleepiness | 26 (52%) |
| #29 (USP) |  | If this medicine makes you dizzy, do not drive | 17 (34%) |
| #30 (FIP) |  | Take this medicine with water | 17 (34%) |
| Entire Sample | Subsample A | Subsample B | |||||
|---|---|---|---|---|---|---|---|
| Average | σ | Average | σ | Average | σ | ||
| Images | 1 | 1.68 | 0.43 | 1.79 | 0.46 | 1.55 | 0.36 |
| >1 | 1.92 | 0.35 | 2.05 | 0.29 | 1.75 | 0.34 | |
| Negation marks | Present | 1.87 | 0.45 | 2.06 | 0.39 | 1.62 | 0.39 |
| Absent | 1.80 | 0.32 | 1.86 | 0.32 | 1.72 | 0.31 | |
| Text | Directions | 1.80 | 0.34 | 1.88 | 0.35 | 1.71 | 0.31 |
| Other info | 1.86 | 0.43 | 2.04 | 0.37 | 1.62 | 0.39 | |
© 2018 by the authors. Licensee MDPI, Basel, Switzerland. This article is an open access article distributed under the terms and conditions of the Creative Commons Attribution (CC BY) license (http://creativecommons.org/licenses/by/4.0/).
Share and Cite
Kanji, L.; Xu, S.; Cavaco, A. Assessing the Understanding of Pharmaceutical Pictograms among Cultural Minorities: The Example of Hindu Individuals Communicating in European Portuguese. Pharmacy 2018, 6, 22. https://doi.org/10.3390/pharmacy6010022
Kanji L, Xu S, Cavaco A. Assessing the Understanding of Pharmaceutical Pictograms among Cultural Minorities: The Example of Hindu Individuals Communicating in European Portuguese. Pharmacy. 2018; 6(1):22. https://doi.org/10.3390/pharmacy6010022
Chicago/Turabian StyleKanji, Lakhan, Sensen Xu, and Afonso Cavaco. 2018. "Assessing the Understanding of Pharmaceutical Pictograms among Cultural Minorities: The Example of Hindu Individuals Communicating in European Portuguese" Pharmacy 6, no. 1: 22. https://doi.org/10.3390/pharmacy6010022
APA StyleKanji, L., Xu, S., & Cavaco, A. (2018). Assessing the Understanding of Pharmaceutical Pictograms among Cultural Minorities: The Example of Hindu Individuals Communicating in European Portuguese. Pharmacy, 6(1), 22. https://doi.org/10.3390/pharmacy6010022