1. Introduction
As of 2015, over 30.3 million Americans have a diabetes diagnosis, and another 84.1 million have prediabetes. In 2012, total direct and indirect costs of healthcare for patients with diabetes was estimated at
$245 billion with average annual medical expenses of
$13,700 per patient. In 2014 alone, 14.2 million emergency room visits and 7.2 million hospitalizations were for patients with diabetes [
1]. While diabetes prevention is important, for those already afflicted, adherence to recommended medications can lower the risk of being hospitalized or visiting the emergency room by 13% [
2].
Medication non-adherence is common among patients with type 2 diabetes who are taking oral antidiabetic medications. Studies have reported rates that range anywhere from 36% to 93% medication adherence for oral antidiabetic medications [
3]. Common reasons for medication non-adherence among patients with diabetes include forgetfulness, concerns about side effects or harm from medicines, and cost [
4,
5]. The stigma associated with taking medications, paired with the fear of medication-related complications can cause apprehension about taking medications as prescribed [
4,
5]. Medication non-adherence also is associated with higher direct and indirect healthcare costs [
6].
There are a variety of interventions that have been used to improve adherence [
7]. Successful interventions generally involve a multifaceted approach that uses a combination of behavioral interventions, disease-state education, medication organization aids, and technological supports [
8]. Adherence scales have been used to identify specific reasons for non-adherence [
9]. However, a limitation of these scales is many do not provide guidance to the provider about strategies to resolve the identified barriers to adherence. The Drug Adherence Work-Up (DRAW©) tool provides this type of guidance in an interview guide format with recommended targeted action for the provider to consider [
10].
The objective of this this study was to pilot a telephone intervention for providing targeted adherence interventions to patients taking oral medicines for diabetes. The justification for focusing on diabetes is that non-adherence is common for this condition and medication adherence is important to avoiding or delaying diabetes disease progression.
2. Materials and Methods
2.1. Study Design
This study was a prospective, pharmacist-initiated, quality improvement initiative that used a pre-post comparison where patients served as their own comparator. The study was conducted at a single site of a small independent pharmacy chain in the Mid-West, United States and occurred over a year-long PGY1 Community Pharmacy Residency. Interventions occurred from 30 September 2016, to 7 February 2017. The University of Iowa Institutional Review Board approved the project as a quality-improvement study.
2.2. Patients
At the initiation of the study, a query using a third party software platform for facilitating pharmacy quality improvement identified 96 patients taking at least one oral antidiabetic medication and who also had a proportion of days covered (PDC) for their oral antidiabetic medications of less than 80%. Proportion of days covered is a standard measure for medication adherence that makes important adjustments to avoid over-estimation [
11]. The threshold of 80% is generally accepted as appropriate for chronic conditions such as diabetes [
11]. Patients were excluded if they used more than one pharmacy for their prescriptions, stopped taking oral medications for diabetes during the study period, or if they were not able to communicate via telephone in English. All patients interviewed were patients that regularly obtained their prescriptions from the study pharmacy and this was verified using dispensing records. If, when the pharmacist called to deliver the intervention the patient was no longer taking the medication, she was thanked for her time and told the pharmacy would update their records. Demographic information including age, gender, insurance type, number and type of oral antidiabetic medications was collected for patients who completed the study using information from the dispensing system for the purpose of describing the sample.
2.3. Procedure
Eligible patients were contacted via their listed pharmacy profile telephone number up to 3 times. Interviews were performed by the pharmacy resident and guided by an abbreviated version of the DRAW© tool (
Appendix A) specific for oral antidiabetic medications. The rationale for creating an abbreviated version of the DRAW tool was to streamline the interview process because the original version asked about the adherence domains in multiple ways. The abbreviated version only asked about each domain once. This reduced the redundancy of the questions and the duration of the calls while still addressing the major types of adherence barriers (forgetfulness, side effects, need perception, and cost). The tool retained its list of targeted interventions based on the particular adherence barrier (e.g., medication box for forgetfulness, motivational interviewing techniques for low perceived medication need. This work-up was tailored towards oral antidiabetic medications taken by the patient with diabetes. The pharmacist making the telephone intervention used paper forms to record the problems and interventions identified during the call. These were later transcribed into an Excel Spreadsheet (Redmond, WA, USA). Phone interviews lasted from 5 to 10 min per patients.
2.4. Outcomes
The primary outcome of this study was the change in PDC for oral antidiabetic medications following the telephone intervention. Patients served as their own control. Pre-interview PDCs were collected from the third-party software connected to the dispensing system for the pharmacy on 30 September 2016. These baseline PDCs were calculated based on refill history for the past 270 days, or when the medication was initiated, if sooner. Post-interview PDCs were assessed 120 days following the interaction between pharmacist and patient using the third-party software. In some instances, manual PDCs had to be calculated such as when patients had cash transactions that did not go through insurance. For manual PDC calculations, patient profiles were analyzed looking at fill dates for all oral antidiabetic medications for the needed period. The number of days in the period was adjusted if patients began an oral antidiabetic regimen after the standard period length. For patients taking multiple oral antidiabetic medications, the PDC was calculated based on if at least one medication provided coverage during the designated period as defined by the Pharmacy Quality Alliance [
11]. For each patient, a timeline was drawn to the lay out when the medication fills occurred, allowing for the period and covered days to be calculated. If a patient had an oral antidiabetic medication on hand every day of the period, then their number of days covered equaled their number of days in the period resulting in a 100% PDC. The following equation was used for manual PDC calculations. This involved truncating fills or moving covered days forward if necessary to provide a valid estimate of covered days [
8].
The secondary outcome was to characterize the reasons for non-adherence and pharmacist interventions made during the telephone interviews. The reasons and interventions were abstracted from the paper forms completed by the pharmacist and assigned to the categories contained in the DRAW tool [
10]. The corresponding text accompanied the categories.
2.5. Analysis
Data were entered and managed using Microsoft Excel (Redmond, WA, USA). Demographics for study variables were calculated. A paired t-test (2-sided) was used to test for a difference in PDCs from the 270-day before interview period and the 120-day post interview period using an alpha of 0.05. Statistical analyses were performed in SPSS v 24 (Chicago, IL, USA). Frequencies were calculated for the various categories of reasons for non-adherence and interventions contained in the completed DRAW tools. Text in addition to the DRAW categories was examined to identify additional detail about the identified reasons for non-adherence and corresponding interventions for the purpose of adding context to the quality improvement effort.
3. Results
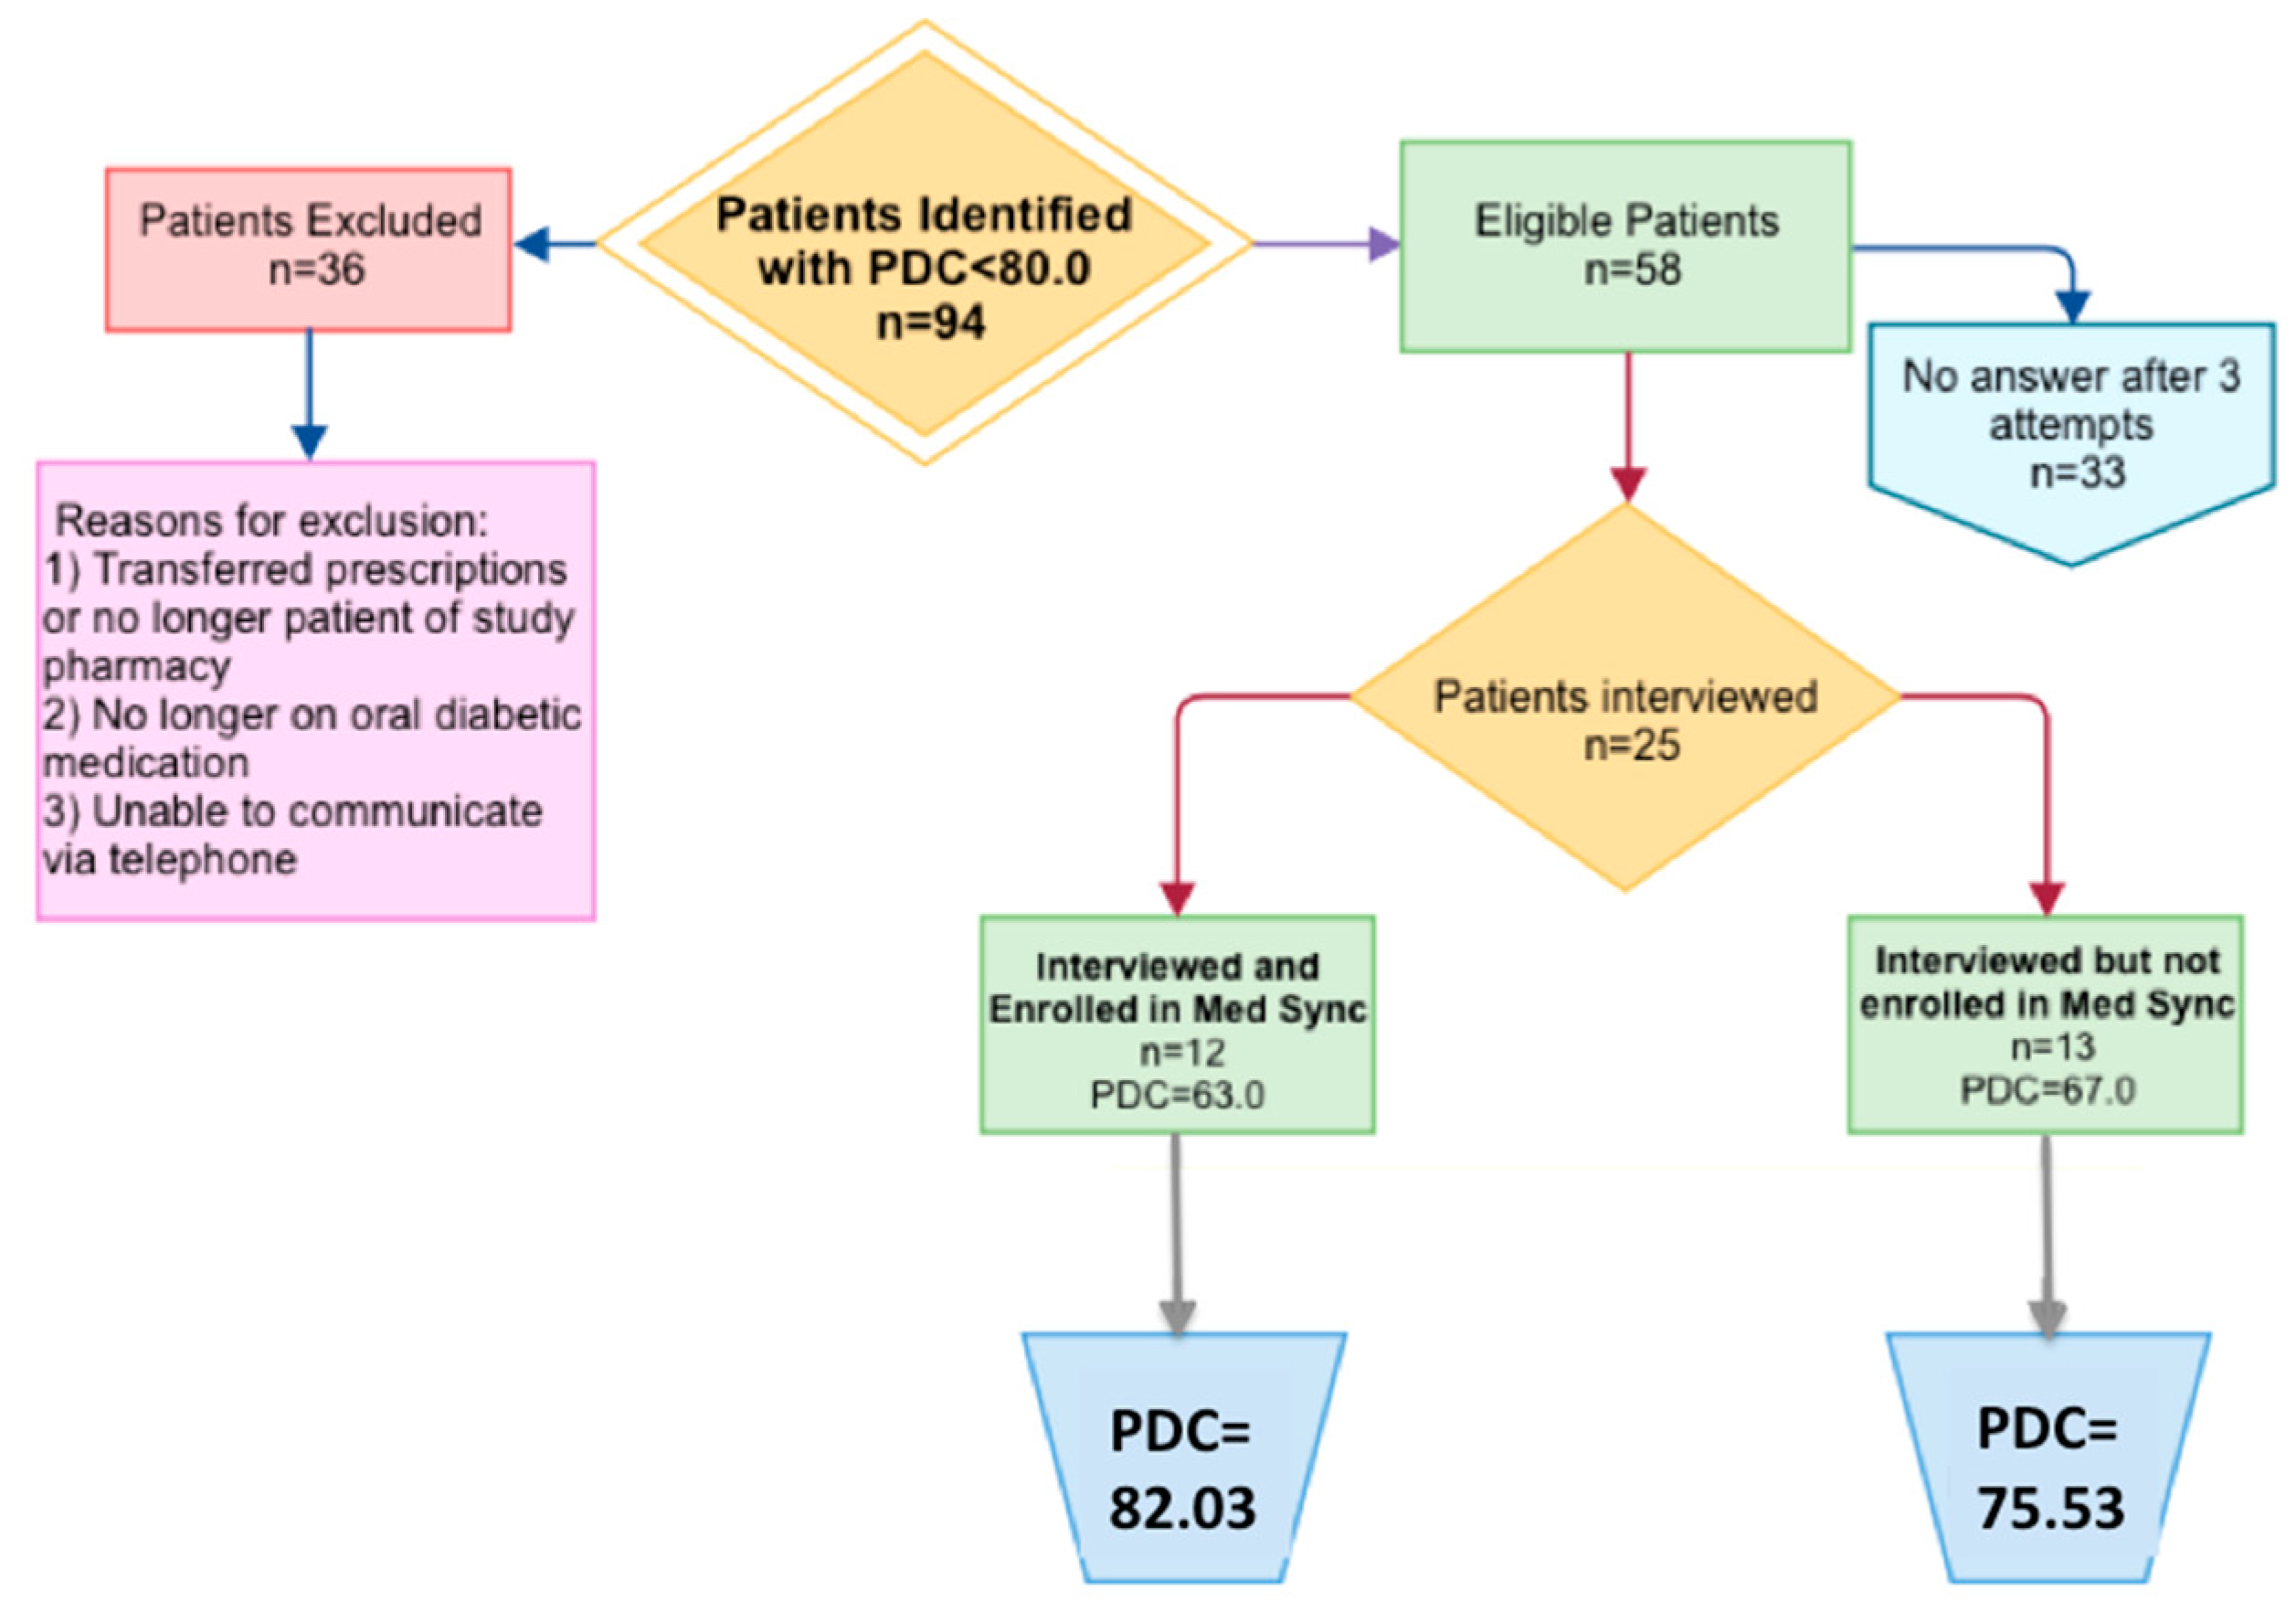
An investigation of patient medication profiles and refill histories resulted in the exclusion of 36 patients from the initial pool of 96patients. This included patients who were no longer taking oral antidiabetic medications, used a different pharmacy, or had documented barriers to participating in a telephone interview. The remaining 58 patients were called via telephone, 33 did not answer after three attempts and 25 and were interviewed (
Figure 1). Demographic information of the patients interviewed is found in
Table 1.
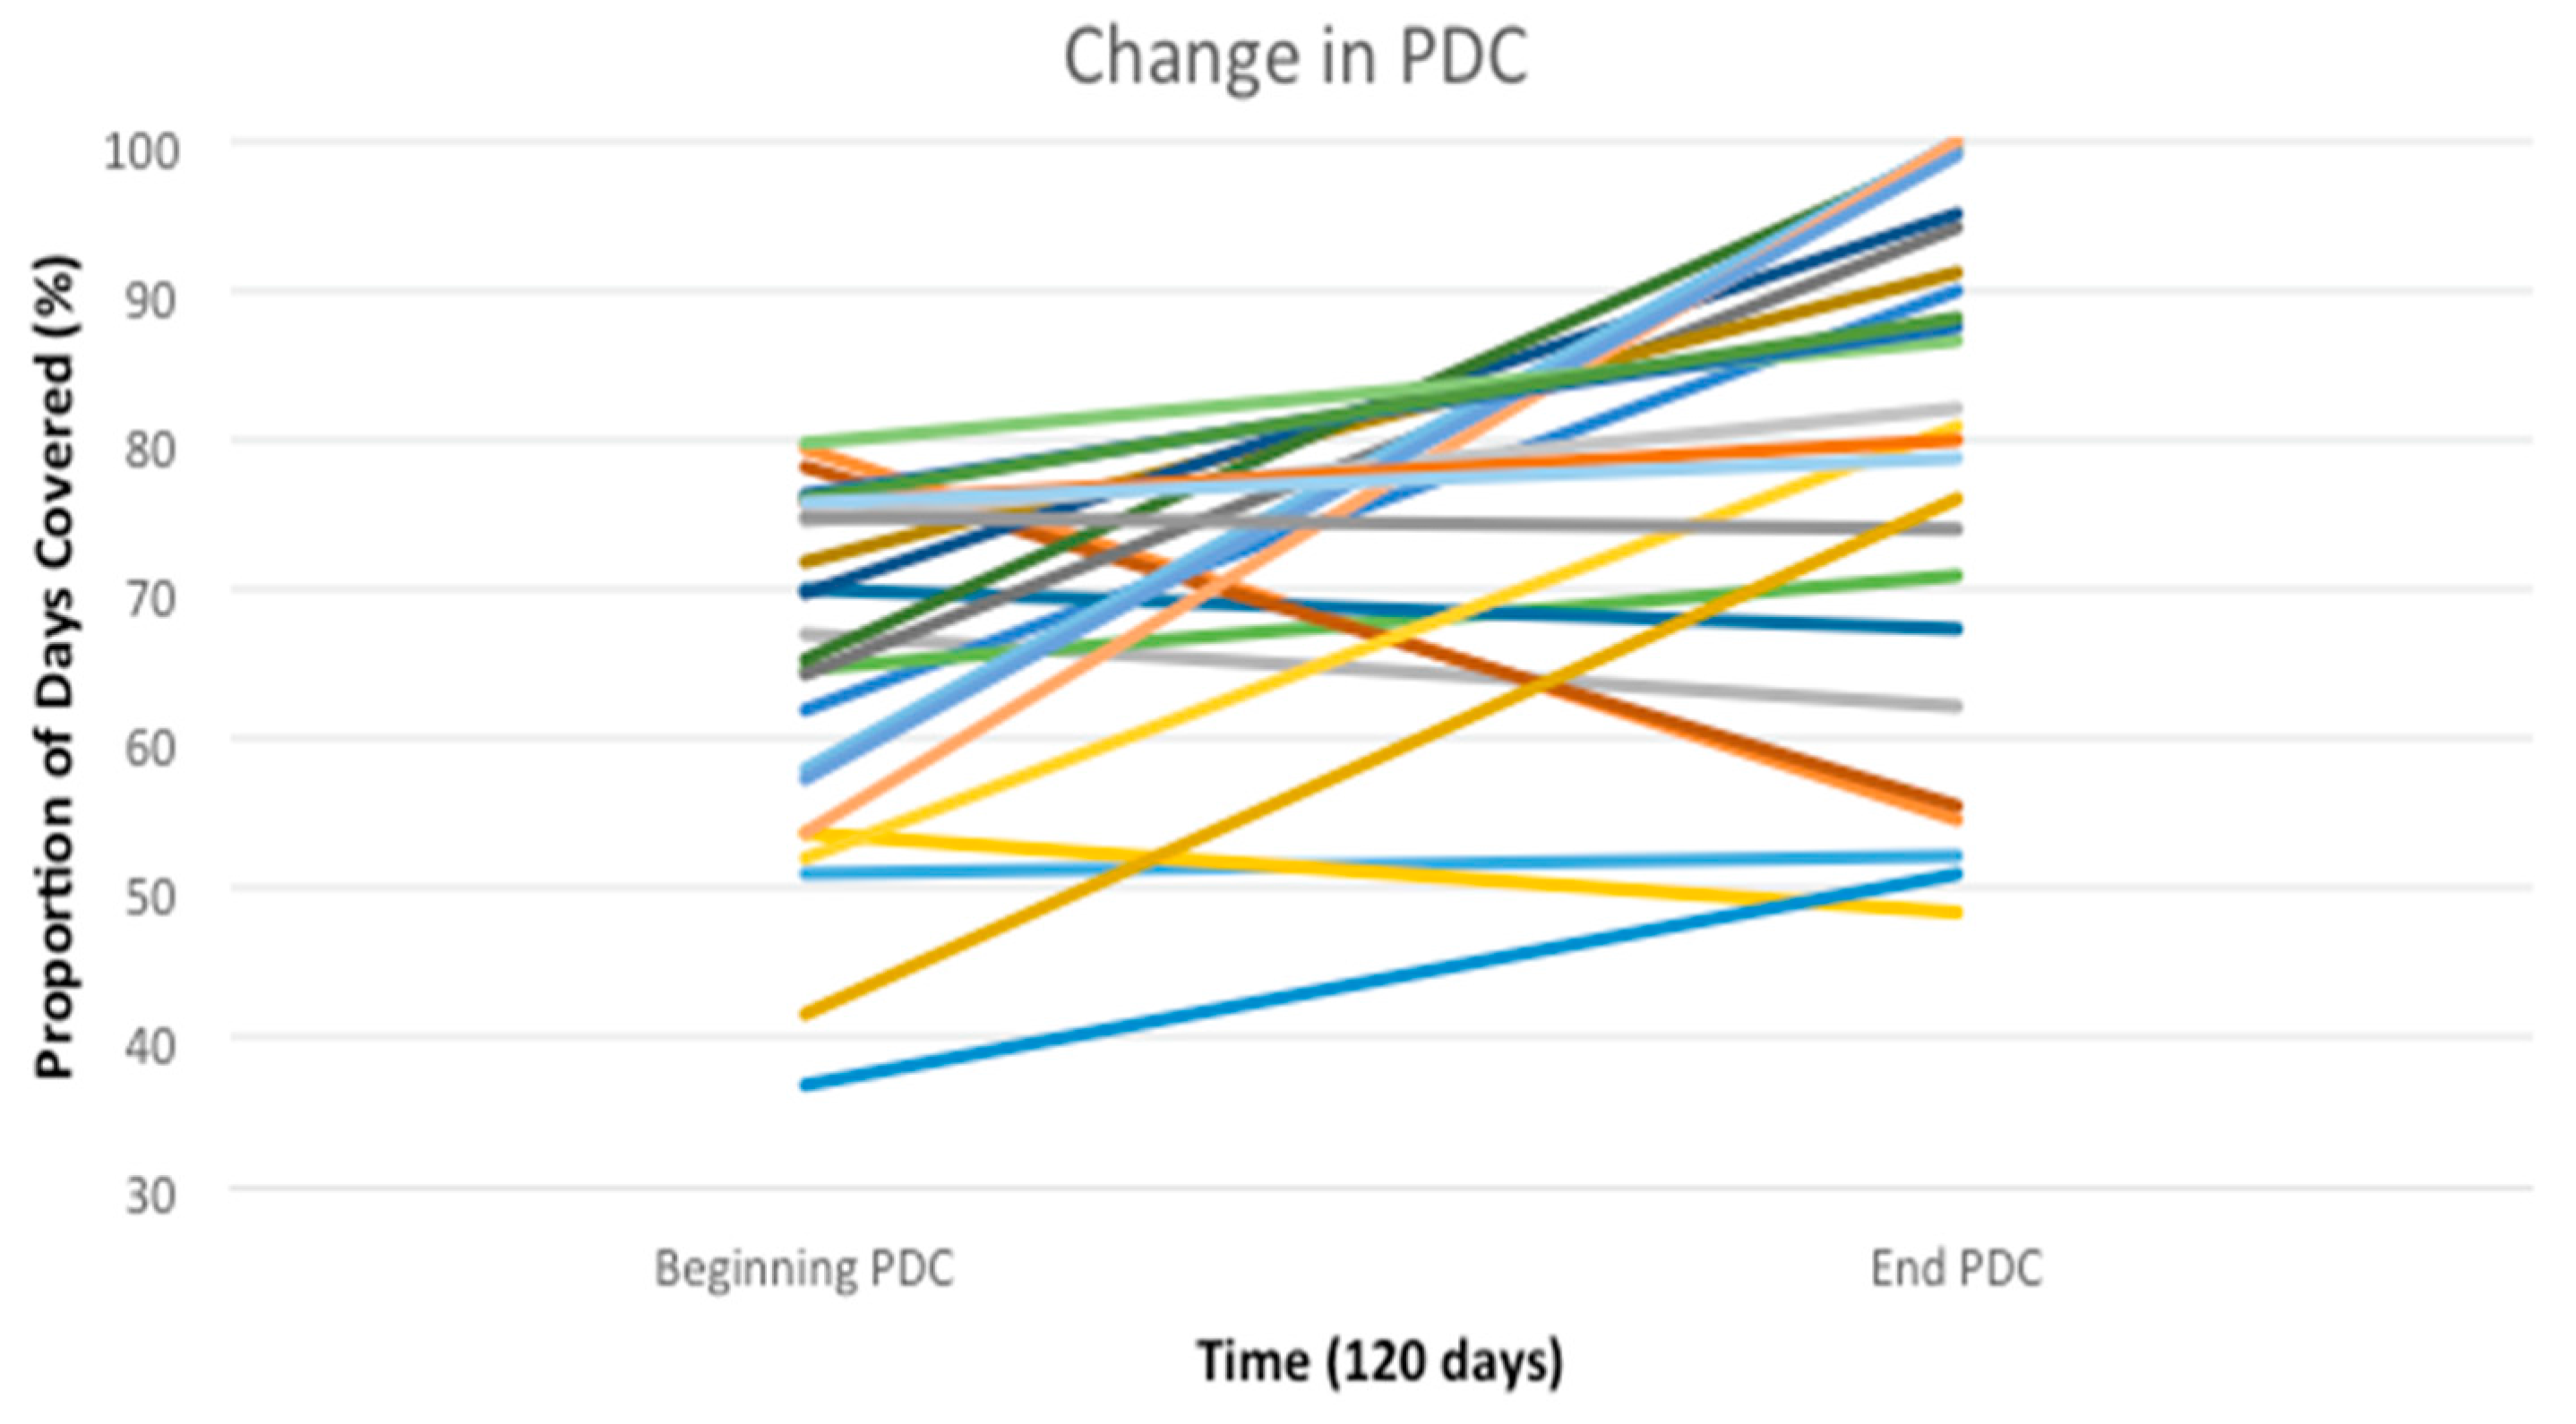
The average baseline PDC (
n = 25) was 65.2%. The average 120-day post interview PDC rose to 78.7%, a 13.5% increase (
p < 0.002), see
Table 2. The cohort also had 12 patients reach the threshold PDC value of 80% which is considered to be adherent. Two patients achieved a PDC value of 100%, up from 58% and 54%, respectively, see
Figure 2.
A simple majority, 52% (
n = 13) of patients self-identified at least one reason for nonadherence in response to the prompts from the DRAW© tool interview, and 12 reported no barriers. Of those reporting a reason, most (69%) stated forgetfulness. Other recognized reasons for non-adherence include: feeling as though the medication is not helping with their disease state, experiencing side effects from their medication(s), and refill complications either at the pharmacy or from their provider, see
Table 3.
Following the identification of reasons for non-adherence, the pharmacist offered targeted interventions at their discretion to 18 patients (72%) with some receiving more than one intervention. There was an average of 1.6 interventions per patients performed. Recommended interventions were detailed on the abbreviated DRAW® tool followed during interview. Of the 12 patients who did not identify a reason for non-adherence, 6 patients (50%) agreed to an intervention during the interview; including medication box counseling to all 6 patients with four of these patients enrolling in the pharmacy’s medication synchronization program.
Patients were eligible for medication synchronization if they filled more than three prescriptions on more than two separate days in a 30-day period as determined by third-party software. Seventeen patients were eligible and offered medication synchronization during interview. Of those receiving any intervention, two-thirds (
n = 12) were enrolled in medication synchronization. Other interventions are detailed in
Table 4.
Patients undergoing medication synchronization experienced an average increase change in PDC of 18.8%; resulting from a starting average PDC of 63.2% and an ending PDC of 82%. Patients who were not eligible for medication synchronization or who chose not to participate experience an average increase change in PDC of 8.5%; resulting from a starting average PDC of 67.1% and an ending PDC of 75.5%, see
Table 5. This difference, however, was not statistically significant.
4. Discussion
The study supports the role of community pharmacists in improving the medication adherence of patients with diabetes. This particular interview approach was associated with an average increase in PDC of 13.5%, 72% of patients having an increase in PDC, and 48% achieving a PDC of >80–threshold associated with acceptable adherence [
11].
The most common intervention in this telephone based interview program was to initiate medication synchronization. This process aligns a patient’s chronic medication refills so they all can be picked up at the same time. This option is beneficial for some patients, but may not work for everyone’s needs, as evident by a small number of patients not being interested in the service when offered. The analysis suggested that medication synchronization may be associated with a greater increase in PDC over a 120-day post-intervention period compared to patients who did not participate in medication synchronization, although statistical significance of the difference was not established for this small sample. Such a comparison may be problematic due to selection bias that can occur with voluntary enrollment into this service. Patients that sign up to have their medications synchronized may have different medication beliefs, practices, and other characteristics than those that decline the service. For example, the medication synchronization patients in our study started with a lower average PDCs, so they had more room to improve.
About half of patients participating in the pharmacist interview did not identify a reason for non-adherence despite their being targeted by the software as having evidence of non-adherence. This inconsistency may be due to social desirability bias or the patient not wanting to discuss adherence with a pharmacist or over the telephone. Alternatively, the patient may have had an adherence barrier that was not prompted by the interview guide. Alternatively, a logistical reason related to the days supply of medication, the doctor having given new instructions without a new prescription, or some other situation may have resulted in an inaccurate adherence alert [
12]. Regardless, several patients for whom a barrier was not identified agreed to an organization-related intervention such as a medication box or enrolling in the pharmacy’s medication synchronization program.
This pilot and feasibility study had several limitations. First, this study lacked a control group and therefore it cannot be determined if the adherence changes were solely due to the intervention or other influences. Also, a study of 1 pharmacy location with a small sample limits generalizability. More research in different settings with different patients is needed. Future research may include comparing the abbreviated DRAW© with the original DRAW© tool or other iterations like the M-DRAW [
13]. Comparisons also are needed with control groups and comparing in-person to telephone interviews. It also may be beneficial to co-administer the DRAW© in combination with a service like diabetes education or other appointment based interventions like comprehensive medication reviews. Also, the questions from the DRAW© tool could be incorporated in routine counseling as pharmacists become better versed on the variety of reasons why patients may be non-adherent. Regardless of the approach, discussing adherence and medication use is an important role for pharmacists, warranting expansion and further optimization in the community pharmacy setting.
5. Conclusions
This pharmacy-based, telephonic adherence intervention focused on patients with diabetes who were non-adherent to their diabetes medications. The clinical pharmacist used a newly developed abbreviated version of the DRAW© tool to identify patient reasons for non-adherence and recommend interventions such as medication synchronization and targeted counseling. Patients receiving the intervention had a significant improvement in adherence over the study period as measured by PDCs.
Acknowledgments
Study was conducted at Mercy Family Pharmacy in Dubuque, Iowa in conjunction with PGY1 Community Pharmacy Residency program with the University of Iowa College of Pharmacy. Mercy Family Pharmacy and Miller Purcell, Inc. purchased the third-party software with which initial patient identification was conducted. Thanks to the staff of Mercy Family Pharmacy, especially Emma Kraayenbrink, Rachel Otting, Joshua Feldmann, Susan Purcell, and Jessica Smith.
Author Contributions
Jerica Singleton, Matthew Witry, Christine Catney, and Stevie Veach conceived the experiment preliminarily designed by Jerica Singleton in conjunction with Mercy Family Pharmacy for completion of PGY1 Community Pharmacy Residency research project. Jerica Singleton performed the interventions and analyzed the data with Matthew Witry. Christine Catney, and Stevie Veach provided additional feedback throughout the study. Jerica Singleton and Matthew Witry wrote the paper with suggestions by Christine Catney and Stevie Veach.
Conflicts of Interest
The authors declare no conflict of interest.
Appendix A. Abbreviated DRAW© Tool Utilized during Patient Interview
References
- Centers for Disease Control and Prevention. National Diabetes Statistics Report, 2017; U.S. Department of Health and Human Services: Atlanta, GA, USA, 2017; pp. 1–20.
- Jhs, A.K.; Aubert, R.E.; Yao, J.; Teagarden, J.R.; Epstein, R.S. Greater adherence to diabetes drugs is linked to less hospital use and could save nearly $5 billion annually. Health Aff. 2012, 31, 1836–1846. [Google Scholar] [CrossRef]
- Sapkota, S.; Brien, J.E.; Greenfield, J.R.; Aslani, P. A Systematic Review of Interventions Addressing Adherence to Anti-Diabetic Medication in Patients with Type 2 Diabetes-Components of Interventions. PLoS ONE 2015, 10, e0128581. [Google Scholar] [CrossRef] [PubMed]
- Polonsky, W.H. Poor medication adherence in diabetes: What’s the problem? J. Diabetes 2015, 7, 777–778. [Google Scholar] [CrossRef] [PubMed]
- Lam, W.Y.; Fresco, P. Medication Adherence Measures: An Overview. BioMed Res. Int. 2015, 1–15. [Google Scholar] [CrossRef] [PubMed]
- Roebuck, M.C.; Liberman, J.N.; Gemmill-Toyama, M.; Brennan, T.A. Medication adherence leads to lower health care use and costs despite increased drug spending. Health Aff. 2011, 30, 91–99. [Google Scholar] [CrossRef] [PubMed]
- Demonceau, J.; Ruppar, T.; Kristanto, P.; Hughes, D.A.; Fargher, E.; Kardas, P.; De Geest, S.; Dobbels, F.; Lewek, P.; Urquhart, J.; et al. Identification and assessment of adherence-enhancing interventions in studies assessing medication adherence through electronically compiled drug dosing histories: a systematic literature review and meta-analysis. Drugs 2013, 73, 545–562. [Google Scholar] [CrossRef] [PubMed]
- Osterberg, L.; Blaschke, T. Adherence to medication. N. Engl. J. Med. 2005, 353, 487–497. [Google Scholar] [CrossRef] [PubMed]
- Nguyen, T.; La Caze, A.; Cottrell, N. Validated adherence scales used in a measurement-guided medication management approach to target and tailor a medication adherence intervention: A randomized controlled trial. BMJ Open 2016, 6, 1–11. [Google Scholar] [CrossRef] [PubMed]
- Doucette, W.R.; Farris, K.B.; Youland, K.M.; Newland, B.A.; Egerton, S.J.; Barnes, J.M. Development of the Drug Adherence Work-Up (DRAW) Tool. J. Am. Pharm. Assoc. 2003, 52, 199–204. [Google Scholar] [CrossRef] [PubMed]
- Nau, D.P. Proportion of Days Covered (PDC) as a Preferred Method of Measuring Medication Adherence. Pharmacy Quality Alliance. 2012. Available online: http://www.pqaalliance.org/images/uploads/files/PQA%20PDC%20vs%20%20MPR.pdf (accessed on 16 October 2017).
- Witry, M.; Parry, R.; McDonough, R.; Deninger, M. Analysis of medication adherence-related notes from a service-oriented community pharmacy. Res. Soc. Adm. Pharm. 2017, in press. [Google Scholar] [CrossRef] [PubMed]
- Lee, S.; Bae, Y.H.; Worley, M.; Law, A. Validating the modified drug adherence Work-Up (M-DRAW) Tool to identify and address barriers to medication adherence. Pharmacy 2017, 5, 52. [Google Scholar] [CrossRef] [PubMed]
© 2017 by the authors. Licensee MDPI, Basel, Switzerland. This article is an open access article distributed under the terms and conditions of the Creative Commons Attribution (CC BY) license (http://creativecommons.org/licenses/by/4.0/).


