
The Effect of the NorGeP–NH on Quality of Life and Drug Prescriptions in Norwegian Nursing Homes: A Randomized Controlled Trial

 , , and
Abstract
:1. Introduction
2. Materials and Methods
2.1. Trial Design
2.2. Participants
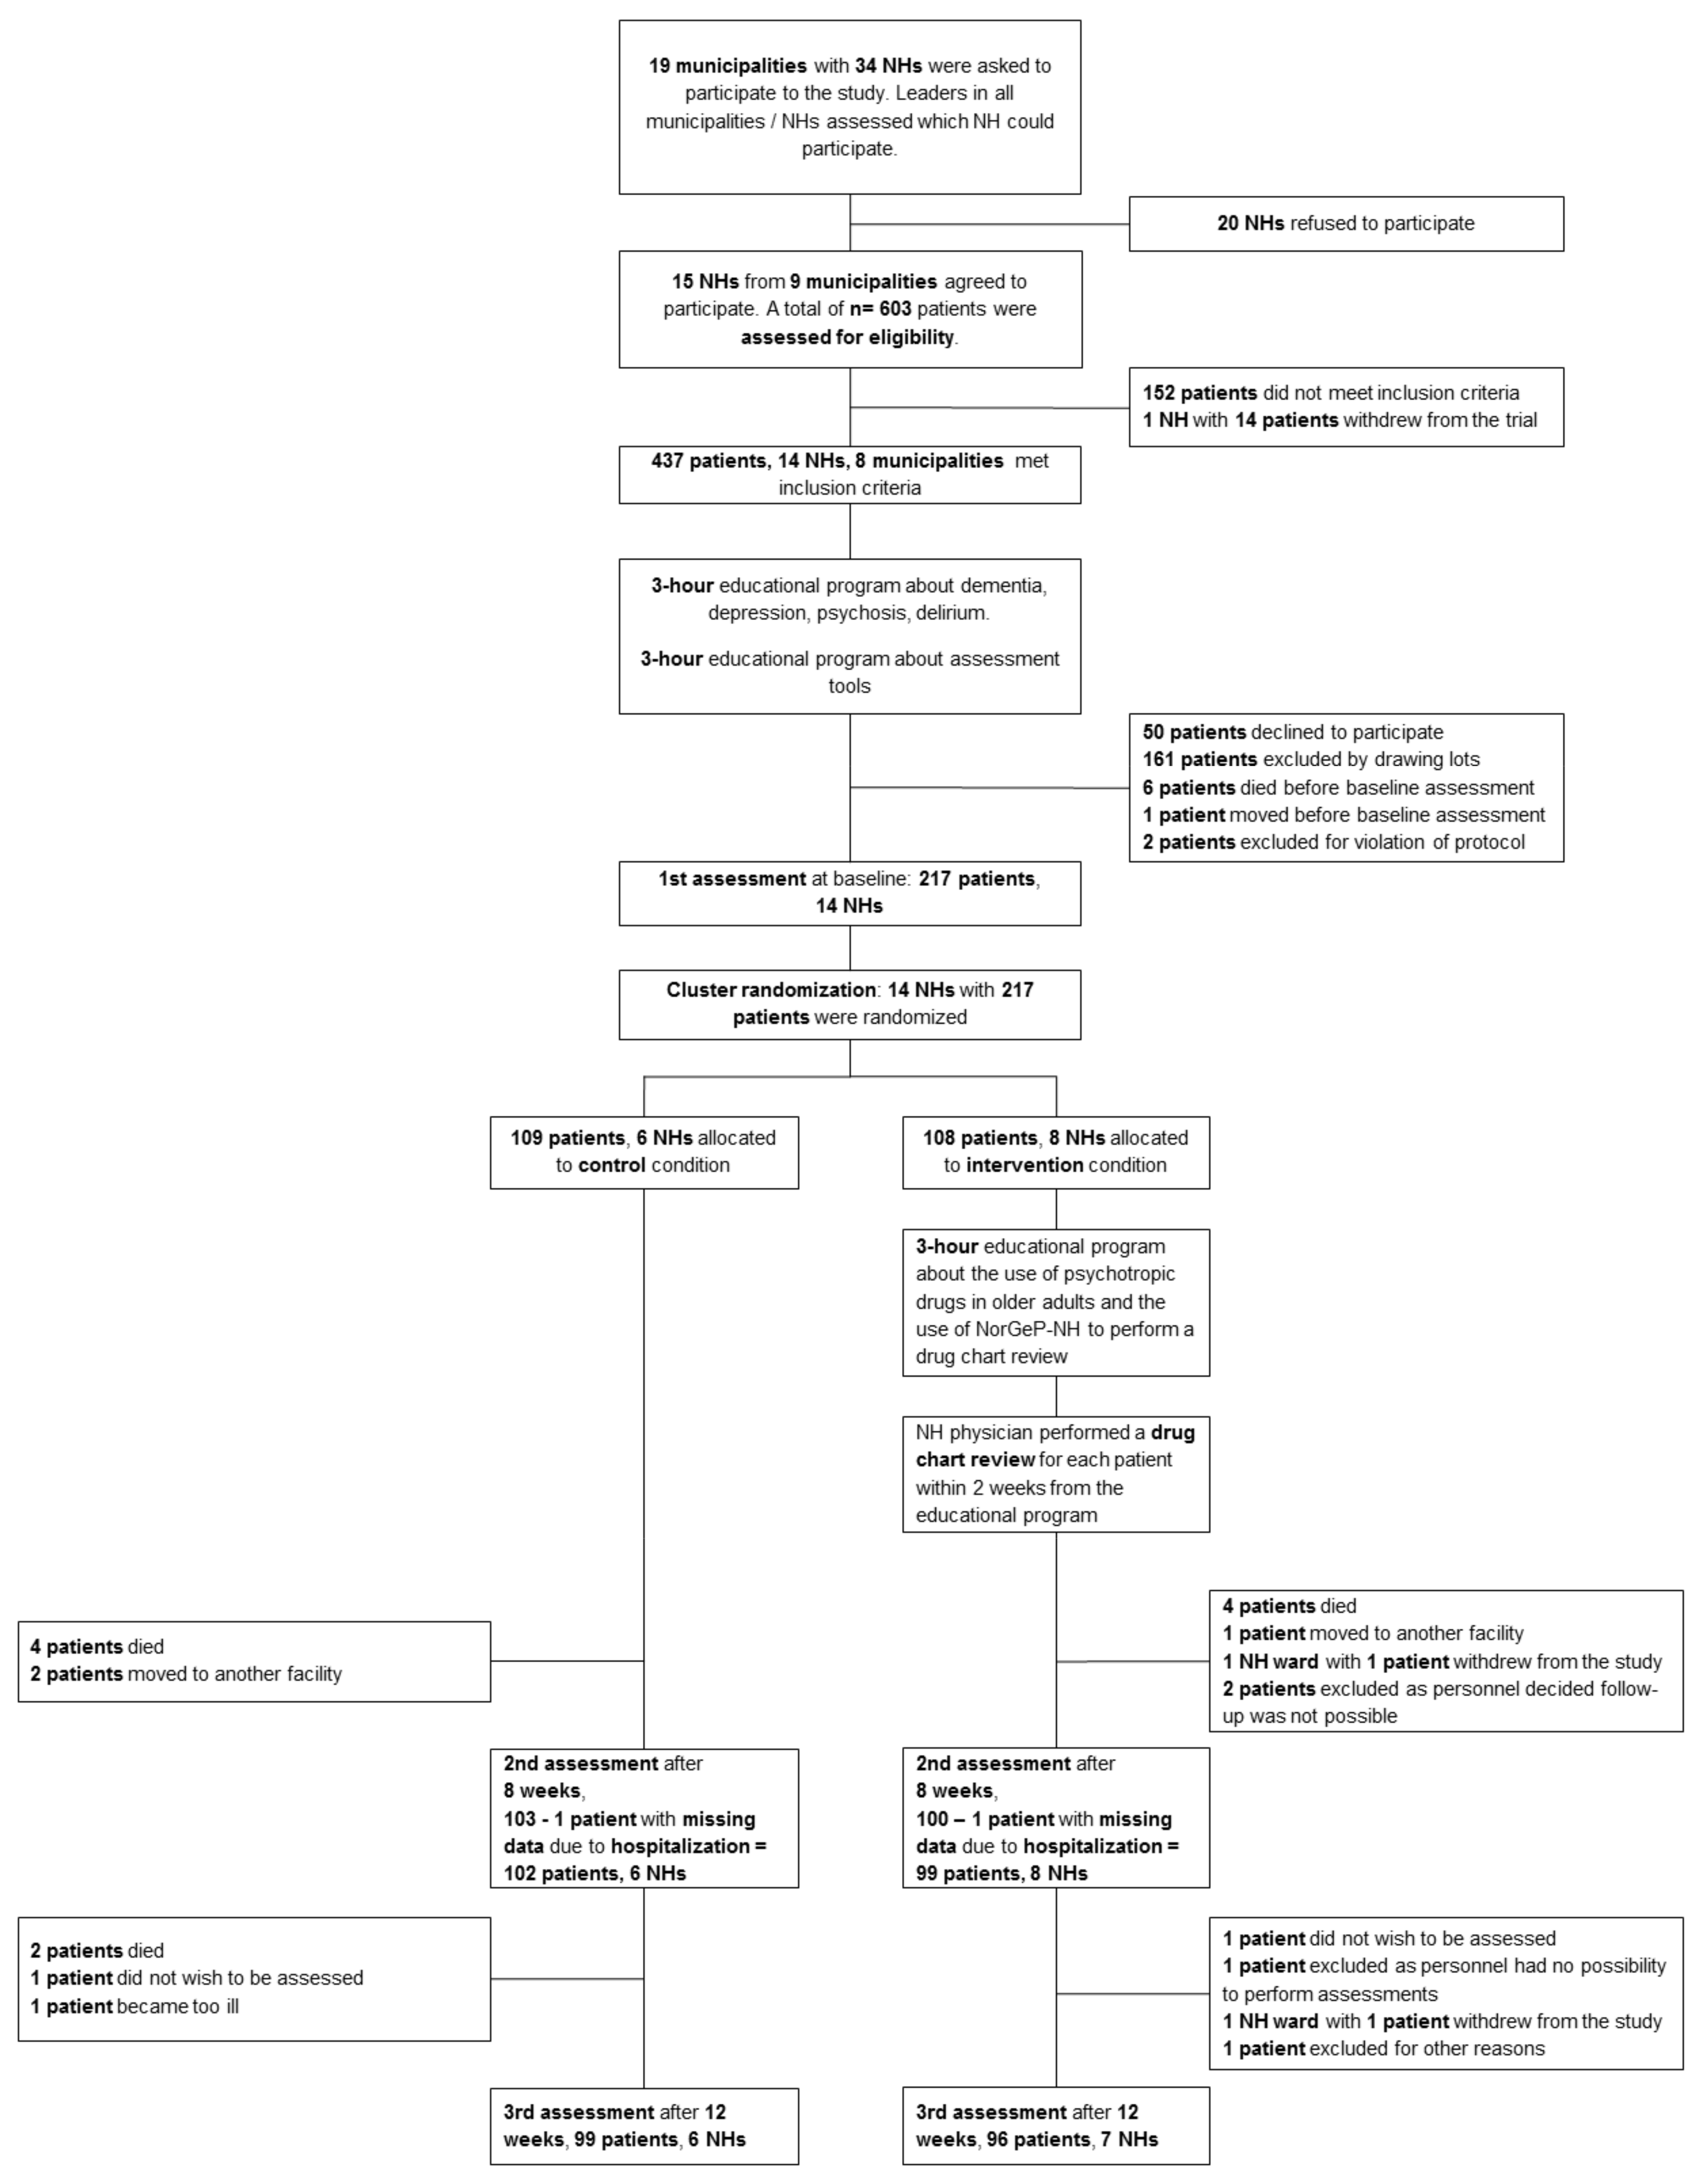
2.3. Intervention
- -
- principles of pharmacology in older people;
- -
- the use of PTDs in older people;
- -
- how to conduct a drug chart review with the Norwegian General Practice–NH (NorGeP–NH) criteria [27].
2.4. Control Group
2.5. Collected Data and Outcomes
2.6. Sample Size
2.7. Randomization
2.8. Statistical Methods
3. Results
4. Discussion
4.1. Brief Synopsis of Key Findings
4.2. Strengths and Limitations
4.3. Considerations and Comparison with Relevant Studies
5. Conclusions
Author Contributions
Funding
Institutional Review Board Statement
Informed Consent Statement
Data Availability Statement
Acknowledgments
Conflicts of Interest
References
- El Haddad, K.; de Souto Barreto, P.; de Mazieres, C.L.; Rolland, Y. Effect of a geriatric intervention aiming to improve polypharmacy in nursing homes. Eur. Geriatr. Med. 2020, 11, 863–868. [Google Scholar] [CrossRef] [PubMed]
- Pazan, F.; Wehling, M. Polypharmacy in older adults: A narrative review of definitions, epidemiology and consequences. Eur. Geriatr. Med. 2021, 12, 443–452. [Google Scholar] [CrossRef] [PubMed]
- Zazzara, M.B.; Palmer, K.; Vetrano, D.L.; Carfì, A.; Graziano, O. Adverse drug reactions in older adults: A narrative review of the literature. Eur. Geriatr. Med. 2021, 12, 463–473. [Google Scholar] [CrossRef] [PubMed]
- Beers, M.H.; Ouslander, J.G.; Rollingher, I.; Reuben, D.B.; Brooks, J.; Beck, J.C. Explicit criteria for determining inappropriate medication use in nursing home residents. UCLA Division of Geriatric Medicine. Arch. Intern. Med. 1991, 151, 1825–1832. [Google Scholar] [CrossRef] [PubMed]
- Fick, D.M.; Cooper, J.W.; Wade, W.E.; Waller, J.L.; Maclean, J.R.; Beers, M.H. Updating the Beers criteria for potentially inappropriate medication use in older adults: Results of a US consensus panel of experts. Arch. Intern. Med. 2003, 163, 2716–2724. [Google Scholar] [CrossRef] [Green Version]
- O’Mahony, D.; O’Sullivan, D.; Byrne, S.; O’Connor, M.N.; Ryan, C.; Gallagher, P. STOPP/START criteria for potentially inappropriate prescribing in older people: Version 2. Age Ageing 2015, 44, 213–218. [Google Scholar] [CrossRef] [Green Version]
- Renom-Guiteras, A.; Meyer, G.; Thürmann, P.A. The EU(7)-PIM list: A list of potentially inappropriate medications for older people consented by experts from seven European countries. Eur. J. Clin. Pharmacol. 2015, 71, 861–875. [Google Scholar] [CrossRef] [Green Version]
- Holt, S.; Schmiedl, S.; Thürmann, P.A. Potentially inappropriate medications in the elderly: The PRISCUS list. Dtsch. Ärzteblatt Int. 2010, 107, 543–551. [Google Scholar]
- Rognstad, S.; Brekke, M.; Fetveit, A.; Spigset, O.; Wyller, T.B.; Straand, J. The Norwegian General Practice (NORGEP) criteria for assessing potentially inappropriate prescriptions to elderly patients. A modified Delphi study. Scand. J. Prim. Health Care 2009, 27, 153–159. [Google Scholar] [CrossRef]
- Steinman, M.A.; Beizer, J.L.; DuBeau, C.E.; Laird, R.D.; Lundebjerg, N.E.; Mulhausen, P. How to Use the American Geriatrics Society 2015 Beers Criteria-A Guide for Patients, Clinicians, Health Systems, and Payors. J. Am. Geriatr. Soc. 2015, 63, e1–e7. [Google Scholar] [CrossRef] [Green Version]
- Motter, F.R.; Fritzen, J.S.; Hilmer, S.N.; Paniz, É.V.; Paniz, V.M.V. Potentially inappropriate medication in the elderly: A systematic review of validated explicit criteria. Eur. J. Clin. Pharmacol. 2018, 74, 679–700. [Google Scholar] [CrossRef] [PubMed]
- Stojanovic, M.; Vukovic, M.; Jovanovic, M.; Dimitrijevic, S.; Radenkovic, M. Potentially Inappropriate Medications in Nursing Home Residents: A Comparison of Two Approaches. Eval. Health Prof. 2021, 44, 180–185. [Google Scholar] [CrossRef] [PubMed]
- Wang-Hansen, M.S.; Wyller, T.B.; Hvidsten, L.T.; Kersten, H. Can screening tools for potentially inappropriate prescriptions in older adults prevent serious adverse drug events? Eur. J. Clin. Pharmacol. 2019, 75, 627–637. [Google Scholar] [CrossRef] [PubMed] [Green Version]
- Halvorsen, K.H.; Kucukcelik, S.; Garcia, B.H.; Svendsen, K. Assessing Potentially Inappropriate Medications in Nursing Home Residents by NORGEP-NH Criteria. Pharmacy 2019, 7, 26. [Google Scholar] [CrossRef] [PubMed] [Green Version]
- Rankin, A.; Cadogan, C.A.; Patterson, S.M.; Kerse, N.; Cardwell, C.R.; Bradley, M.C.; Ryan, C.; Hughes, C. Interventions to improve the appropriate use of polypharmacy for older people. Cochrane Database Syst. Rev. 2018, 9, Cd008165. [Google Scholar] [CrossRef] [PubMed] [Green Version]
- Alldred, D.P.; Kennedy, M.C.; Hughes, C.; Chen, T.F.; Miller, P. Interventions to optimise prescribing for older people in care homes. Cochrane Database Syst. Rev. 2016, 2, Cd009095. [Google Scholar] [CrossRef] [Green Version]
- Beuscart, J.B.; Pont, L.G.; Thevelin, S.; Boland, B.; Dalleur, O.; Rutjes, A.W.S.; Westbrook, J.I.; Spinewine, A. A systematic review of the outcomes reported in trials of medication review in older patients: The need for a core outcome set. Br. J. Clin. Pharmacol. 2017, 83, 942–952. [Google Scholar] [CrossRef] [Green Version]
- Jester, D.J.; Molinari, V.; Zgibor, J.C.; Volicer, L. Prevalence of psychotropic polypharmacy in nursing home residents with dementia: A meta-analysis. Int. Psychogeriatr. 2021, 33, 1083–1098. [Google Scholar] [CrossRef]
- Helsedirektoratet. Nasjonal Faglig Retningslinje om Demens; Helsedirektoratet: Oslo, Norway, 2017. [Google Scholar]
- Schjott, J.; Assmus, J. A retrospective comparison of inappropriate prescribing of psychotropics in three Norwegian nursing homes in 2000 and 2016 with prescribing quality indicators. BMC Med. Inform. Decis. Mak. 2019, 19, 102. [Google Scholar] [CrossRef]
- Fog, A.F.; Mdala, I.; Engedal, K.; Straand, J. Variation between nursing homes in drug use and in drug-related problems. BMC Geriatr. 2020, 20, 336. [Google Scholar] [CrossRef]
- Sheehan, R.; Strydom, A.; Brown, E.; Marston, L.; Hassiotis, A. Association of Focused Medication Review with Optimization of Psychotropic Drug Prescribing: A Systematic Review and Meta-analysis. JAMA Netw. Open 2018, 1, e183750. [Google Scholar] [CrossRef] [PubMed]
- Smeets, C.H.W.; Smalbrugge, M.; Koopmans, R.; Nelissen-Vrancken, M.; van der Spek, K.; Teerenstra, S.; Gerritsen, D.L.; Zuidema, S.U. Can the PROPER intervention reduce psychotropic drug prescription in nursing home residents with dementia? Results of a cluster-randomized controlled trial. Int. Psychogeriatr. 2021, 33, 577–586. [Google Scholar] [CrossRef] [PubMed]
- Junius-Walker, U.; Krause, O.; Thürmann, P.; Bernhard, S.; Fuchs, A.; Sparenberg, L.; Wollny, A.; Stolz, R.; Haumann, H.; Freytag, A.; et al. Drug Safety for Nursing-Home Residents-Findings of a Pragmatic, Cluster-Randomized, Controlled Intervention Trialin 44 Nursing Homes. Dtsch. Ärzteblatt Int. 2021, 118, 705–712. [Google Scholar]
- Maidment, I.D.; Aston, L.; Hilton, A.; Iqbal, N.; Child, A.; Shaw, R. Role of community pharmacists in the use of antipsychotics for behavioural and psychological symptoms of dementia (BPSD): A qualitative study. BMJ Open 2016, 6, e010278. [Google Scholar] [CrossRef] [Green Version]
- Bach, L.L.; Lazzaretto, D.L.; Young, C.F.; Lofholm, P.W. Improving Nursing Home Compliance via Revised Antipsychotic Use Survey Tool. Consult. Pharm. 2017, 32, 228–238. [Google Scholar] [CrossRef]
- Nyborg, G.; Straand, J.; Klovning, A.; Brekke, M. The Norwegian General Practice—Nursing Home criteria (NORGEP-NH) for potentially inappropriate medication use: A web-based Delphi study. Scand. J. Prim. Health Care 2015, 33, 134–141. [Google Scholar] [CrossRef] [Green Version]
- Masnoon, N.; Shakib, S.; Kalisch-Ellett, L.; Caughey, G.E. Tools for Assessment of the Appropriateness of Prescribing and Association with Patient-Related Outcomes: A Systematic Review. Drugs Aging 2018, 35, 43–60. [Google Scholar] [CrossRef]
- Bowling, A.; Rowe, G.; Adams, S.; Sands, P.; Samsi, K.; Crane, M.; Joly, L.; Manthorpe, J. Quality of life in dementia: A systematically conducted narrative review of dementia-specific measurement scales. Aging Ment. Health 2015, 19, 13–31. [Google Scholar] [CrossRef]
- Roen, I.; Selbaek, G.; Kirkevold, O.; Engedal, K.; Lerdal, A.; Bergh, S. The Reliability and Validity of the Norwegian Version of the Quality of Life in Late-Stage Dementia Scale. Dement. Geriatr. Cogn. Disord. 2015, 40, 233–242. [Google Scholar] [CrossRef] [Green Version]
- Burks, H.B.; des Bordes, J.K.A.; Chadha, R.; Holmes, H.M.; Rianon, N.J. Quality of Life Assessment in Older Adults with Dementia: A Systematic Review. Dement. Geriatr. Cogn. Disord. 2021, 50, 103–110. [Google Scholar] [CrossRef]
- Olsson, I.N.; Runnamo, R.; Engfeldt, P. Medication quality and quality of life in the elderly, a cohort study. Health Qual. Life Outcomes 2011, 9, 95. [Google Scholar] [CrossRef] [PubMed] [Green Version]
- Cahir, C.; Bennett, K.; Teljeur, C.; Fahey, T. Potentially inappropriate prescribing and adverse health outcomes in community dwelling older patients. Br. J. Clin. Pharmacol. 2014, 77, 201–210. [Google Scholar] [CrossRef] [PubMed] [Green Version]
- Campbell, M.K.; Piaggio, G.; Elbourne, D.R.; Altman, D.G. Consort 2010 statement: Extension to cluster randomised trials. BMJ 2012, 345, e5661. [Google Scholar] [CrossRef] [Green Version]
- Hoffmann, T.C.; Glasziou, P.P.; Boutron, I.; Milne, R.; Perera, R.; Moher, D.; Altman, D.G.; Barbour, V.; Macdonald, H.; Johnston, M.; et al. Better reporting of interventions: Template for intervention description and replication (TIDieR) checklist and guide. BMJ 2014, 348, g1687. [Google Scholar] [CrossRef] [PubMed] [Green Version]
- Etchells, E.; Darzins, P.; Silberfeld, M.; Singer, P.A.; McKenny, J.; Naglie, G.; Katz, M.; Guyatt, G.H.; Molloy, D.W.; Strang, D. Assessment of patient capacity to consent to treatment. J. Gen. Intern. Med. 1999, 14, 27–34. [Google Scholar] [CrossRef] [Green Version]
- Weiner, M.F.; Martin-Cook, K.; Svetlik, D.A.; Saine, K.; Foster, B.; Fontaine, C.S. The quality of life in late-stage dementia (QUALID) scale. J. Am. Med. Dir. Assoc. 2000, 1, 114–116. [Google Scholar]
- Nasreddine, Z.S.; Phillips, N.A.; Bédirian, V.; Charbonneau, S.; Whitehead, V.; Collin, I.; Cummings, J.L.; Chertkow, H. The Montreal Cognitive Assessment, MoCA: A brief screening tool for mild cognitive impairment. J. Am. Geriatr. Soc. 2005, 53, 695–699. [Google Scholar] [CrossRef]
- Morris, J.C. The Clinical Dementia Rating (CDR): Current version and scoring rules. Neurology 1993, 43, 2412–2414. [Google Scholar] [CrossRef]
- Steinberg, M.; Tschanz, J.T.; Corcoran, C.; Steffens, D.C.; Norton, M.C.; Lyketsos, C.G.; Breitner, J.C.S. The persistence of neuropsychiatric symptoms in dementia: The Cache County Study. Int. J. Geriatr. Psychiatry 2004, 19, 19–26. [Google Scholar] [CrossRef]
- Cummings, J.L.; Mega, M.; Gray, K.; Rosenberg-Thompson, S.; Carusi, D.A.; Gornbein, J. The Neuropsychiatric Inventory: Comprehensive assessment of psychopathology in dementia. Neurology 1994, 44, 2308–2314. [Google Scholar] [CrossRef] [Green Version]
- Selbaek, G.; Kirkevold, O.; Sommer, O.H.; Engedal, K. The reliability and validity of the Norwegian version of the Neuropsychiatric Inventory, nursing home version (NPI-NH). Int. Psychogeriatr. 2008, 20, 375–382. [Google Scholar] [PubMed]
- Alexopoulos, G.S.; Abrams, R.C.; Young, R.C.; Shamoian, C.A. Cornell Scale for Depression in Dementia. Biol. Psychiatry 1988, 23, 271–284. [Google Scholar] [PubMed]
- Montgomery, S.A.; Asberg, M. A new depression scale designed to be sensitive to change. Br. J. Psychiatry 1979, 134, 382–389. [Google Scholar] [CrossRef] [PubMed]
- Pachana, N.A.; Byrne, G.J.; Siddle, H.; Koloski, N.; Harley, E.; Arnold, E. Development and validation of the Geriatric Anxiety Inventory. Int. Psychogeriatr. 2007, 19, 103–114. [Google Scholar] [CrossRef] [PubMed]
- Lyketsos, C.G.; Galik, E.; Steele, C.; Steinberg, M.; Rosenblatt, A.; Warren, A.; Sheppard, J.-M.; Baker, A.; Brandt, J. The General Medical Health Rating: A bedside global rating of medical comorbidity in patients with dementia. J. Am. Geriatr. Soc. 1999, 47, 487–491. [Google Scholar]
- Charlson, M.E.; Pompei, P.; Ales, K.L.; MacKenzie, C.R. A new method of classifying prognostic comorbidity in longitudinal studies: Development and validation. J. Chronic Dis. 1987, 40, 373–383. [Google Scholar] [CrossRef]
- Podsiadlo, D.; Richardson, S. The timed “Up & Go”: A test of basic functional mobility for frail elderly persons. J. Am. Geriatr. Soc. 1991, 39, 142–148. [Google Scholar]
- Lawton, M.P.; Brody, E.M. Assessment of older people: Self-maintaining and instrumental activities of daily living. Gerontol. 1969, 9, 179–186. [Google Scholar]
- Selbaek, G.; Engedal, K. Stability of the factor structure of the Neuropsychiatric Inventory in a 31-month follow-up study of a large sample of nursing-home patients with dementia. Int. Psychogeriatr. 2012, 24, 62–73. [Google Scholar] [CrossRef]
- Roen, I.; Selbaek, G.; Kirkevold, O.; Engedal, K.; Testad, I.; Bergh, S. Resourse Use and Disease Couse in dementia—Nursing Home (REDIC-NH), a longitudinal cohort study; design and patient characteristics at admission to Norwegian nursing homes. BMC Health Serv. Res. 2017, 17, 365. [Google Scholar]
- Sandvik, R.K.; Selbaek, G.; Bergh, S.; Aarsland, D.; Husebo, B.S. Signs of Imminent Dying and Change in Symptom Intensity During Pharmacological Treatment in Dying Nursing Home Patients: A Prospective Trajectory Study. J. Am. Med. Dir. Assoc. 2016, 17, 821–827. [Google Scholar] [CrossRef] [Green Version]
- Husebø, B.S.; Ballard, C.; Aarsland, D.; Selbaek, G.; Slettebo, D.D.; Gulla, C.; Aasmul, I.; Habiger, T.; Elvegaard, T.; Testad, I.; et al. The Effect of a Multicomponent Intervention on Quality of Life in Residents of Nursing Homes: A Randomized Controlled Trial (COSMOS). J. Am. Med. Dir. Assoc. 2019, 20, 330–339. [Google Scholar] [CrossRef] [PubMed]
- Jyrkkä, J.; Enlund, H.; Korhonen, M.J.; Sulkava, R.; Hartikainen, S. Patterns of drug use and factors associated with polypharmacy and excessive polypharmacy in elderly persons: Results of the Kuopio 75+ study: A cross-sectional analysis. Drugs Aging 2009, 26, 493–503. [Google Scholar] [CrossRef] [PubMed]
- Qato, D.M.; Ozenberger, K.; Olfson, M. Prevalence of Prescription Medications with Depression as a Potential Adverse Effect Among Adults in the United States. JAMA 2018, 319, 2289–2298. [Google Scholar] [CrossRef] [Green Version]
- Hukins, D.; Macleod, U.; Boland, J.W. Identifying potentially inappropriate prescribing in older people with dementia: A systematic review. Eur. J. Clin. Pharmacol. 2019, 75, 467–481. [Google Scholar] [CrossRef] [PubMed] [Green Version]


| Clinical Feature | Assessment Tools | Method of Collection | Ranging Score | Comments |
|---|---|---|---|---|
| Cognitive function | Montreal Cognitive Assessment (MoCA) | Interview | 0–30 | A higher score indicates better cognitive function [38]. |
| Clinical Dementia Rating (CDR) scale | Proxy-based | 0–3 | Total score is calculated using a complex algorithm. CDR = 0: no dementia; CDR = 0.5, 1, 2, or 3 indicates questionable, mild, moderate, or severe cognitive impairment [39]. | |
| Neuropsychiatric symptoms | Neuropsychiatric Inventory 12-item Nursing Home Version (NPI-NH) b | Proxy-based | 0–144 | Single-item score is calculated by multiplying severity (score 1–3) by frequency (score 1–4). Total score is the sum of all the single-item scores [40,41,42]. We calculated the NPI-NH subsyndrome scores for agitation, psychosis and affective symptoms b. |
| Cornell Scale for Depression in Dementia (CSDD) | Proxy-based | 0–38 | Total score is calculated by summing up 19 single-item scores. Each single item can be scored 0, 1 or 2 (symptom not present, moderate or periodically present, severe). A higher score indicates more severe symptoms [43]. | |
| Montgomery and Asberg Depression Rating Scale (MADRS) | Interview | 0–60 | Total score is calculated by summing up 10 single-items scores (0–6). A higher score indicates more severe symptoms [44]. | |
| Geriatric Anxiety Inventory (GAI) | Interview | 0–20 | A 20-item self-report or nurse-administered scale. A higher score indicates more anxiety-related symptoms [45]. | |
| Medication | Anatomic Therapeutic Chemical (ATC) classification system | Medication chart in resident’s journal | N/A | We calculated the total amount of daily prescribed drugs, and the total amount of prescribed pro re nata (PRN) drugs. We collected data on prescribed psychotropic drugs, and we grouped them as antipsychotics (N05A except lithium), antidepressants (N06A), anxiolytics (N05B), hypnotic/sedatives (N05C), and anti-dementia medication (N06D). |
| Physical health status | General Medical Health Rating (GMHR) scale | Proxy-based | Excellent, good, fair, poor | Used to assess the general medical health status of each participant, according to the amount of stable/unstable medical conditions, the number of prescribed drugs and the general clinical condition [46]. |
| Charlson Comorbidity Index | N/A | 0–30 | A scale divided into 18 items/groups of diseases. Each item is scored yes/no, assuming the value of 1/0. An algorithm calculates the total score. Higher values indicate a higher level of comorbidity [47]. | |
| Timed “Up and Go” test (TUG) | N/A | N/A | It measures the ability to stand up from a sitting position, walk a predefined distance, and sit down again. The score is in seconds and calculated as the average of two performances [48]. | |
| Functioning in daily living and quality of life (QoL) | Physical Self-Maintenance Scale (PSMS) | Proxy-based | 1–6 | A 6-item scale to measure the level of functioning. Each item is scored 1 only if there is no decline. A higher score indicates a higher level of functioning [49]. |
| Quality of Life in Late-Stage Dementia scale (QUALID) | Proxy-based | 11–55 | A 11-item assessment scale, where lower scores indicate a higher QoL [30,37]. |
| Control NHs (n = 109) a | Intervention NHs (n = 108) a | |
|---|---|---|
| Age | ||
| Mean (SD) | 84.57 (9.43) | 83.33 (7.97) |
| Gender | ||
| Female, n (%) | 78 (71.6) | 61 (56.5) |
| Type of unit, n (%) | ||
| Regular b | 62 (56.9) | 44 (40.7) |
| Special care c | 33 (30.3) | 64 (59.3) |
| Other | 14 (12.8) | 0 (0) |
| Number of residents per unit | ||
| Mean (SD) | 15.07 (4.41) | 13.15 (3.97) |
| Number of staff members per unit on day shift | ||
| Mean (SD) | 4.73 (1.80) | 4.61 (1.79) |
| Physician hours per week | ||
| Mean (SD) | 6.43 (1.68) | 5.55 (3.52) |
| CDR, n (%) | n = 103 | n = 104 |
| 0–no dementia | 3 (2.9) | 0 (0) |
| 0.5–questionable cognitive impairment | 8 (7.8) | 8 (7.7) |
| 1.0–mild cognitive impairment | 30 (29.1) | 20 (19.2) |
| 2.0–moderate cognitive impairment | 28 (27.2) | 32 (30.8) |
| 3.0–severe cognitive impairment | 34 (33) | 44 (42.3) |
| Charlson Comorbidity Index | n = 108 | n = 101 |
| Mean (SD) | 2,54 (1.96) | 2.57 (1.68) |
| CSDD | n = 94 | n = 87 |
| Mean (SD) | 6.50 (5.84) | 7.46 (5.99) |
| MADRS | n = 78 | n = 45 |
| Mean (SD) | 9.03 (7.80) | 7.47 (6.67) |
| GAI | n = 81 | n = 56 |
| Mean (SD) | 5.58 (5.70) | 5.0 (5.32) |
| GMHR, n (%) | n = 106 | n = 99 |
| Poor | 0 (0) | 11 (11.1) |
| Fair | 44 (41.5) | 50 (50.5) |
| Good | 37 (34.9) | 19 (19.2) |
| Excellent | 25 (23.6) | 19 (19.2) |
| MoCA | n = 79 | n = 73 |
| Mean (SD) | 10.66 (6.97) | 7.08 (6.44) |
| NPI-Total score | n = 107 | n = 104 |
| Mean (SD) | 17.10 (19.10) | 21.92 (21.30) |
| NPI-Caregiver | n = 107 | n = 104 |
| Mean (SD) | 6.92 (8.50) | 9.48 (10.49) |
| NPI-Affective d | n = 107 | n = 101 |
| Mean (SD) | 3.58 (5.46) | 4.15 (5.42) |
| NPI-Psychosis d | n = 101 | n = 102 |
| Mean (SD) | 1.93 (3.72) | 3.51 (4.73) |
| NPI-Agitation d | n = 107 | n = 104 |
| Mean (SD) | 5.26 (8.38) | 8.20 (9.48) |
| PSMS | ||
| Mean (SD) | 1.06 (1.31) | 1.16 (1.29) |
| QUALID | n = 97 | n = 106 |
| Mean (SD) | 21.31 (6.72) | 23.27 (8.03) |
| TUG | n = 40 | n = 36 |
| Mean (SD) | 26.81 (16.67) | 27.52 (20.36) |
| Number of daily medications | ||
| Mean (SD) | 6.92 (3.49) | 7.55 (3.04) |
| Number of PRN drugs | n = 106 | n = 107 |
| Mean (SD) | 4.04 (2.74) | 4.72 (2.89) |
| Control NHs | Intervention NHs | |
|---|---|---|
| Baseline | ||
| n | 97 | 106 |
| Mean (SD) | 21.31 (6.72) | 23.27 (8.03) |
| Week 12 | ||
| n | 84 | 95 |
| Mean (SD) | 22.74 (7.64) | 23.11 (8.72) |
| Mean change (95% CI) | −1.69 (−3.00; −0.38) | −0.18 (−1.43; 1.07) |
| Mean difference in change (95% CI) p-value | −1.51 (−3.30; 0.28) 0.101 | |
| Control NHs | Intervention NHs | |||
|---|---|---|---|---|
| QUALID | n | Mean (SD) | n | Mean (SD) |
| Baseline | 97 | 21.31 (6.72) | 106 | 23.27 (8.03) |
| Week 8 | 89 | 22.45 (7.96) | 97 | 24.03 (8.83) |
| Week 12 | 84 | 22.74 (7.65) | 95 | 23.11 (8.72) |
| Mean change (95% CI) | ||||
| Baseline to Week 8 | −1.26 (−2.36; −0.16) | −1.14 (−2.21; −0.07) | ||
| Baseline to Week 12 | −1.75 (−2.89; −0.61) | −0.21 (−1.30; 0.88) | ||
| Difference in change | Mean (95% CI) | p-value | ||
| Baseline to Week 8 | −0.12 (−1.62; 1.38) | 0.876 | ||
| Baseline to Week 12 | −1.54 (−3.08; 0.01) | 0.052 | ||
| CSDD | n | Mean (SD) | n | Mean (SD) |
| Baseline | 94 | 6.50 (5.84) | 87 | 7.46 (5.99) |
| Week 8 | 86 | 7.38 (6.19) | 72 | 7.60 (6.91) |
| Week 12 | 77 | 6.49 (5.75) | 60 | 5.80 (5.39) |
| Mean change (95% CI) | ||||
| Baseline to Week 8 | −1.09 (−1.96; −0.22) | −0.05 (−1.02; 0.91) | ||
| Baseline to Week 12 | −0.73 (−1.66; 0.20) | 1.86 (0.82; 2.90) | ||
| Difference in change | Mean (95% CI) | p-value | ||
| Baseline to Week 8 | −1.03 (−2.29; 0.23) | 0.109 | ||
| Baseline to Week 12 | −2.59 (−3.95; −1.23) | <0.001 | ||
| MADRS | n | Mean (SD) | n | Mean (SD) |
| Baseline | 78 | 9.03 (7.80) | 45 | 7.47 (6.67) |
| Week 8 | 66 | 10.59 (8.17) | 22 | 7.27 (5.18) |
| Week 12 | 65 | 10.05 (7.83) | 16 | 7.88 (6.62) |
| Mean change (95% CI) | ||||
| Baseline to Week | −1.81 (−3.06; −0.56) | 0.17 (−1.90; 2.23) | ||
| Baseline to Week 12 | −0.98 (−2.34; 0.38) | −0.10 (−2.62; 2.41) | ||
| Difference in change | Mean (95% CI) | p-value | ||
| Baseline to Week 8 | −1.98 (−4.36; 0.40) | 0.106 | ||
| Baseline to Week 12 | −0.88 (−3.69; 1.94) | 0.542 | ||
| NPI-Agitation subsyndrome b | n | Mean (SD) | n | Mean (SD) |
| Baseline | 107 | 5.26 (8.38) | 104 | 8.20 (9.48) |
| Week 8 | 98 | 6.70 (9.52) | 92 | 8.64 (9.68) |
| Week 12 | 92 | 6.27 (9.06) | 85 | 8.73 (10.21) |
| Mean change (95% CI) | ||||
| Baseline to Week 8 | −1.22 (−2.57; 0.14) | −0.41 (−1.83; 1.01) | ||
| Baseline to Week 12 | −1.12 (−2.53; 0.29) | −0.46 (−1.93; 1.02) | ||
| Difference in change | Mean (95% CI) | p-value | ||
| Baseline to Week 8 | −0.81 (−2.72; 1.11) | 0.409 | ||
| Baseline to Week 12 | −0.66 (−2.65; 1.32) | 0.514 | ||
| NPI-Psychosis subsyndrome b | n | Mean (SD) | n | Mean (SD) |
| Baseline | 101 | 1.93 (3.72) | 102 | 3.51 (4.73) |
| Week 8 | 92 | 1.95 (3.45) | 90 | 4.07 (5.88) |
| Week 12 | 85 | 1.85 (3.75) | 81 | 4.30 (6.17) |
| Mean change (95% CI) | ||||
| Baseline to Week 8 | −0.20 (−0.92; 0.51) | −0.55 (−1.28; 0.19) | ||
| Baseline to Week 12 | −0.25 (−0.99; 0.50) | −0.57 (−1.34; 0.20) | ||
| Difference in change | Mean (95% CI) | p-value | ||
| Baseline to Week 8 | 0.35 (−0.65; 1.35) | 0.497 | ||
| Baseline to Week 12 | 0.32 (−0.73; 1.37) | 0.548 | ||
| NPI-Affective subsyndrome b | n | Mean (SD) | n | Mean (SD) |
| Baseline | 107 | 3.58 (5.46) | 101 | 4.15 (5.42) |
| Week 8 | 96 | 4.94 (6.78) | 90 | 4.76 (6.48) |
| Week 12 | 90 | 4.41 (6.12) | 84 | 5.04 (7.04) |
| Mean change (95% CI) | ||||
| Baseline to Week 8 | −1.19 (−2.16; −0.23) | −0.67 (−1.67; 0.32) | ||
| Baseline to Week 12 | −0.95 (−1.93; 0.04) | −0.86 (−1.88; 0.16) | ||
| Difference in change | Mean (95% CI) | p-value | ||
| Baseline to Week 8 | −0.52 (−1.90; 0.86) | 0.459 | ||
| Baseline to Week 12 | −0.09 (−1.50; 1.33) | 0.907 | ||
| NPI-Total score | n | Mean (SD) | n | Mean (SD) |
| Baseline | 107 | 17.10 (19.10) | 104 | 21.92 (21.30) |
| Week 8 | 98 | 20.11 (21.73) | 92 | 23.79 (25.45) |
| Week 12 | 99 | 16.61 (19.25) | 91 | 23.33 (27.45) |
| Mean change (95% CI) | ||||
| Baseline to Week 8 | −2.85 (−5.90; 0.20) | −2.22 (−5.39; 0.96) | ||
| Baseline to Week 12 | 0.48 (−2.59; 3.54) | −1.75 (−4.95; 1.45) | ||
| Difference in change | Mean (95% CI) | p-value | ||
| Baseline to Week 8 | −0.63 (−4.98; 3.71) | 0.775 | ||
| Baseline to Week 12 | 2.22 (−2.15; 6.59) | 0.319 | ||
| NPI-Caregiver | n | Mean (SD) | n | Mean (SD) |
| Baseline | 107 | 6.92 (8.50) | 104 | 9.48 (10.49) |
| Week 8 | 98 | 7.73 (8.31) | 92 | 9.57 (11.26) |
| Week 12 | 92 | 7.11 (8.49) | 85 | 9.88 (12.05) |
| Mean change (95% CI) | ||||
| Baseline to Week 8 | −0.79 (−1.97; 0.38) | −0.16 (−1.41; 1.08) | ||
| Baseline to Week 12 | −0.48 (−1.71; 0.76) | −0.19 (−1.49; 1.11) | ||
| Difference in change | Mean (95% CI) | p-value | ||
| Baseline to Week 8 | −0.63 (−2.28; 1.02) | 0.454 | ||
| Baseline to Week 12 | −0.29 (−2.01; 1.43) | 0.744 | ||
| MoCA | n | Mean (SD) | n | Mean (SD) |
| Baseline | 79 | 10.66 (6.97) | 73 | 7.08 (6.44) |
| Week 8 | 67 | 10.48 (6.66) | 44 | 7.43 (6.33) |
| Week 12 | 62 | 10.58 (6.90) | 37 | 7.62 (7.03) |
| Mean change (95% CI) | ||||
| Baseline to Week 8 | 0.61 (−0.37; 1.60) | 0.66 (−0.55; 1.86) | ||
| Baseline to Week 12 | 0.62 (−0.43; 1.67) | 0.26 (−1.06; 1.58) | ||
| Difference in change | Mean (95% CI) | p-value | ||
| Baseline to Week 8 | −0.05 (−1.55; 1.46) | 0.953 | ||
| Baseline to Week 12 | 0.36 (−1.28; 1.99) | 0.671 | ||
| GAI | n | Mean (SD) | n | Mean (SD) |
| Baseline | 81 | 5.58 (5.70) | 56 | 5.00 (5.32) |
| Week 8 | 65 | 5.95 (6.20) | 26 | 3.38 (3.85) |
| Week 12 | 65 | 5.91 (6.20) | 27 | 3.07 (3.09) |
| Mean change (95% CI) | ||||
| Baseline to Week 8 | −0.78 (−1.69; 0.13) | 0.91 (−0.49; 2.32) | ||
| Baseline to Week 12 | −0.35 (−1.26; 0.55) | 1.27 (−0.11; 2.64) | ||
| Difference in change | Mean (95% CI) | p-value | ||
| Baseline to Week 8 | −1.69 (−3.37; −0.01) | 0.049 | ||
| Baseline to Week 12 | −1.62 (−3.27; 0.03) | 0.056 | ||
| PSMS | n | Mean (SD) | n | Mean (SD) |
| Baseline | 109 | 1.06 (1.31) | 108 | 1.16 (1.29) |
| Week 8 | 101 | 1.14 (1.52) | 98 | 1.19 (1.26) |
| Week 12 | 98 | 1.03 (1.38) | 95 | 1.02 (1.17) |
| Mean change (95% CI) | ||||
| Baseline to Week 8 | −0.04 (−0.17; 0.09) | 0.00 (−0.14; 0.13) | ||
| Baseline to Week 12 | 0.04 (−0.10; 0.17) | 0.11 (−0.03; 0.25) | ||
| Difference in change | Mean (95% CI) | p-value | ||
| Baseline to Week 8 | −0.04 (−0.22; 0.15) | 0.710 | ||
| Baseline to Week 12 | −0.07 (−0.26; 0.23) | 0.444 | ||
| Charlson Comorbidity Index | n | Mean (SD) | n | Mean (SD) |
| Baseline | 108 | 2.54 (1.96) | 101 | 2.57 (1.68) |
| Week 8 | 98 | 2.48 (1.84) | 96 | 2.52 (1.65) |
| Week 12 | 94 | 2.50 (1.79) | 93 | 2.57 (1.78) |
| Mean change (95% CI) | ||||
| Baseline to Week 8 | 0.04 (−0.09; 0.16) | 0.04 (−0.08; 0.16) | ||
| Baseline to Week 12 | 0.08 (−0.04; 0.20) | −0.04 (−0.16; 0.08) | ||
| Difference in change | Mean (95% CI) | p-value | ||
| Baseline to Week 8 | −0.00 (−0.18; 0.17) | 0.984 | ||
| Baseline to Week 12 | 0.12 (−0.05; 0.30) | 0.169 | ||
| TUG | n | Mean (SD) | n | Mean (SD) |
| Baseline | 40 | 26.81 (16.67) | 36 | 27.52 (20.36) |
| Week 8 | 25 | 64.84 (110.98) | 20 | 36.22 (25.52) |
| Week 12 | 24 | 83.01 (136.12) | 20 | 40.56 (26.94) |
| Mean change (95% CI) | ||||
| Baseline to Week 8 | −35.95 (−66.04; −5.85) | −9.42 (−41.98; 23.14) | ||
| Baseline to Week 12 | −52.98 (−87.12; −18.83) | −17.10 (−53.39; 19.19) | ||
| Difference in change | Mean (95% CI) | p-value | ||
| Baseline to Week 8 | −26.53 (−69.52; 16.46) | 0.229 | ||
| Baseline to Week 12 | −35.88 (−83.38; 11.63) | 0.141 | ||
| CDR | n (%) | n (%) | ||
| Baseline | ||||
| No/questionable cognitive impairment c | 11 (10.7) | 8 (7.7) | ||
| Mild cognitive impairment | 30 (29.1) | 20 (19.2) | ||
| Moderate cognitive impairment | 28 (27.2) | 32 (30.8) | ||
| Severe cognitive impairment | 34 (33.0) | 44 (42.3) | ||
| Week 8 | ||||
| No/questionable cognitive impairment c | 12 (12.6) | 4 (4.3) | ||
| Mild cognitive impairment | 24 (25.3) | 8 (8.5) | ||
| Moderate cognitive impairment | 28 (29.5) | 34 (36.2) | ||
| Severe cognitive impairment | 31 (32.6) | 48 (51.1) | ||
| Week 12 | ||||
| No/questionable cognitive impairment c | 10 (11.1) | 4 (4.3) | ||
| Mild cognitive impairment | 23 (25.6) | 10 (10.9) | ||
| Moderate cognitive impairment | 26 (28.9) | 28 (30.4) | ||
| Severe cognitive impairment | 31 (34.4) | 50 (54.3) | ||
| Odds of change (95% CI) | ||||
| Baseline to Week 8 | 0.97 (0.52; 1.83) | 0.27 (0.14; 0.53) | ||
| Baseline to Week 12 | 0.68 (0.35; 1.30) | 0.29 (0.14; 0.57) | ||
| Difference in change | OR (95% CI) | p-value | ||
| Baseline to Week 8 | 0.28 (0.11; 0.70) | 0.007 | ||
| Baseline to Week 12 | 0.42 (0.16; 1.09) | 0.076 | ||
| GMHR | n (%) | n (%) | ||
| Baseline | ||||
| Poor/Fair c | 44 (41.5) | 61 (61.6) | ||
| Good | 37 (34.9) | 19 (19.2) | ||
| Excellent | 25 (23.6) | 19 (19.2) | ||
| Week 8 | ||||
| Poor/Fair c | 43 (43.4) | 57 (60.0) | ||
| Good | 36 (36.4) | 20 (21.1) | ||
| Excellent | 20 (20.2) | 18 (18.9) | ||
| Week 12 | ||||
| Poor/Fair c | 41 (42.7) | 55 (60.4) | ||
| Good | 41 (42.7) | 17 (18.7) | ||
| Excellent | 14 (14.6) | 19 (20.9) | ||
| Odds of change (95% CI) | ||||
| Baseline to Week 8 | 1.22 (0.60; 2.44) | 0.80 (0.35; 1.79) | ||
| Baseline to Week 12 | 1.57 (0.77; 3.20) | 0.96 (0.42; 2.18) | ||
| Difference in change | OR (95% CI) | p-value | ||
| Baseline to Week 8 | 0.66 (0.22; 1.91) | 0.440 | ||
| Baseline to Week 12 | 0.61 (0.21; 1.81) | 0.375 | ||
| Control NHs | Intervention NHs | |||
|---|---|---|---|---|
| Total number of daily drugs | n | Mean (SD) | n | Mean (SD) |
| Baseline | 109 | 6.92 (3.49) | 108 | 7.55 (3.04) |
| Week 8 | 102 | 6.73 (3.69) | 99 | 7.14 (3.00) |
| Week 12 | 99 | 6.65 (3.54) | 96 | 7.18 (3.16) |
| Mean change (95% CI) | ||||
| Baseline to Week 8 | 0.16 (−0.08; 0.39) | 0.56 (0.32; 0.81) | ||
| Baseline to Week 12 | 0.30 (0.01; 0.58) | 0.44 (0.16; 0.73) | ||
| Difference in change | Mean (95% CI) | p-value | ||
| Baseline to Week 8 | −0.41 (−0.75; −0.06) | 0.023 | ||
| Baseline to Week 12 | −0.15 (−0.58; 0.29) | 0.504 | ||
| Total number of PRN drugs | n | Mean (SD) | n | Mean (SD) |
| Baseline | 106 | 4.04 (2.74) | 107 | 4.72 (2.89) |
| Week 8 | 96 | 4.42 (2.69) | 97 | 4.48 (3.13) |
| Week 12 | 88 | 4.43 (2.78) | 91 | 4.30 (3.12) |
| Mean change (95% CI) | ||||
| Baseline to Week 8 | −0.26 (−0.56; 0.03) | 0.11 (−0.18; 0.41) | ||
| Baseline to Week 12 | −0.25 (−0.60; 0.09) | 0.09 (−0.26; 0.43) | ||
| Difference in change | Mean (95% CI) | p-value | ||
| Baseline to Week 8 | −0.38 (−0.80; 0.065) | 0.083 | ||
| Baseline to Week 12 | −0.34 (−0.86; 0.17) | 0.189 | ||
| Antidepressants | n | n (%) | n | n (%) |
| Baseline | 109 | 37 (33.9) | 108 | 36 (33.3) |
| Week 8 | 102 | 35 (34,3) | 99 | 30 (30.3) |
| Week 12 | 99 | 35 (35.4) | 96 | 29 (30.2) |
| Odds for change (95% CI) | ||||
| Baseline to Week 8 | 1.00 (0.43; 2.33) | 0.75 (0.34; 1.68) | ||
| Baseline to Week 12 | 1.04 (0.44; 2.42) | 0.77 (0.34; 1.74) | ||
| Odds for difference in change | OR (95% CI) | p-value | ||
| Baseline to Week 8 | 0.75 (0.23; 2.40) | 0.626 | ||
| Baseline to Week 12 | 0.74 (0.23; 2.41) | 0.623 | ||
| Antipsychotics | n | n (%) | n | n (%) |
| Baseline | 109 | 17 (15.6) | 108 | 29 (26.9) |
| Week 8 | 102 | 14 (13.7) | 99 | 25 (25.3) |
| Week 12 | 99 | 13 (13.1) | 96 | 25 (26.0) |
| Odds for change (95% CI) | ||||
| Baseline to Week 8 | 0.70 (0.25; 1.98) | 0.86 (0.37; 1.98) | ||
| Baseline to Week 12 | 0.67 (0.23; 1.93) | 0.91 (0.39; 2.10) | ||
| Odds for difference in change | OR (95% CI) | p-value | ||
| Baseline to Week 8 | 1.23 (0.32; 4.65) | 0.765 | ||
| Baseline to Week 12 | 1.36 (0.35; 5.27) | 0.654 | ||
| Sedatives and hypnotics | n | n (%) | n | n (%) |
| Baseline | 109 | 30 (27.5) | 108 | 22 (20.4) |
| Week 8 | 102 | 26 (25.5) | 99 | 21 (21.2) |
| Week 12 | 99 | 24 (24.2) | 96 | 18 (18.8) |
| Odds for change (95% CI) | ||||
| Baseline to Week 8 | 0.81 (0.35; 1.90) | 1.09 (0.43; 2.73) | ||
| Baseline to Week 12 | 0.80 (0.34; 1.89) | 0.84 (0.32; 2.17) | ||
| Odds for difference in change | OR (95% CI) | p-value | ||
| Baseline to Week 8 | 1.33 (0.38; 4.67) | 0.652 | ||
| Baseline to Week 12 | 1.05 (0.29; 3.81) | 0.942 | ||
| Anxiolytics | n | n (%) | n | n (%) |
| Baseline | 109 | 22 (20.2) | 108 | 14 (13.0) |
| Week 8 | 102 | 20 (19.6) | 99 | 12 (12.1) |
| Week 12 | 99 | 19 (19.2) | 96 | 11 (11.5) |
| Odds for change (95% CI) | ||||
| Baseline to Week 8 | 0.94 (0.35; 2.51) | 0.83 (0.27; 2.57) | ||
| Baseline to Week 12 | 0.85 (0.31; 2.28) | 0.71 (0.22; 2.25) | ||
| Odds for difference in change | OR (95% CI) | p-value | ||
| Baseline to Week 8 | 0.89 (0.20; 3.93) | 0.874 | ||
| Baseline to Week 12 | 0.84 (0.18; 3.84) | 0.822 | ||
| Antidementia drugs | n | n (%) | n | n (%) |
| Baseline | 109 | 9 (8.3) | 108 | 34 (31.5) |
| Week 8 | 102 | 10 (9.8) | 99 | 29 (29.3) |
| Week 12 | 99 | 11 (11.1) | 96 | 29 (30.2) |
| Odds for change (95% CI) | ||||
| Baseline to Week 8 | 1.30 (0.36; 4.74) | 0.80 (0.34; 1.89) | ||
| Baseline to Week 12 | 1.64 (0.46; 5.86) | 0.83 (0.35; 1.95) | ||
| Odds for difference in change | OR (95% CI) | p-value | ||
| Baseline to Week 8 | 0.62 (0.13; 2.90) | 0.541 | ||
| Baseline to Week 12 | 0.51 (0.11; 2.35) | 0.385 | ||
Publisher’s Note: MDPI stays neutral with regard to jurisdictional claims in published maps and institutional affiliations. |
© 2022 by the authors. Licensee MDPI, Basel, Switzerland. This article is an open access article distributed under the terms and conditions of the Creative Commons Attribution (CC BY) license (https://creativecommons.org/licenses/by/4.0/).
Share and Cite
Callegari, E.; Benth, J.Š.; Selbæk, G.; Grønnerød, C.; Bergh, S. The Effect of the NorGeP–NH on Quality of Life and Drug Prescriptions in Norwegian Nursing Homes: A Randomized Controlled Trial. Pharmacy 2022, 10, 32. https://doi.org/10.3390/pharmacy10010032
Callegari E, Benth JŠ, Selbæk G, Grønnerød C, Bergh S. The Effect of the NorGeP–NH on Quality of Life and Drug Prescriptions in Norwegian Nursing Homes: A Randomized Controlled Trial. Pharmacy. 2022; 10(1):32. https://doi.org/10.3390/pharmacy10010032
Chicago/Turabian StyleCallegari, Enrico, Jurate Šaltytė Benth, Geir Selbæk, Cato Grønnerød, and Sverre Bergh. 2022. "The Effect of the NorGeP–NH on Quality of Life and Drug Prescriptions in Norwegian Nursing Homes: A Randomized Controlled Trial" Pharmacy 10, no. 1: 32. https://doi.org/10.3390/pharmacy10010032
APA StyleCallegari, E., Benth, J. Š., Selbæk, G., Grønnerød, C., & Bergh, S. (2022). The Effect of the NorGeP–NH on Quality of Life and Drug Prescriptions in Norwegian Nursing Homes: A Randomized Controlled Trial. Pharmacy, 10(1), 32. https://doi.org/10.3390/pharmacy10010032