Abstract
Acquiring a consistent accent and targeting a native standard like Received Pronunciation (RP) or General American (GA) are prerequisites for French learners who plan to become English teachers in France. Reliable methods to assess learners’ productions are therefore extremely valuable. We recorded a little over 300 students from our English Studies department and performed auditory analysis to investigate their accents and determine how close to native models their productions were. Inter-rater comparisons were carried out; they revealed overall good agreement scores which, however, varied across phonetic cues. Then, automatic speech recognition (ASR) and automatic accent identification (AID) were applied to the data. We provide exploratory interpretations of the ASR outputs, and show to what extent they agree with and complement our auditory ratings. AID turns out to be very consistent with our perception, and both types of measurements show that two thirds of our students favour an American, and the remaining third, a British pronunciation, although most of them have mixed features from the two accents.
1. Introduction
In the French educational system, future English teachers usually obtain a university degree from an English Studies department before taking one of two national competitive exams, the CAPES or the Agrégation. Pronunciation training in these departments relies on two standard accents: Received Pronunciation (RP)1 and General American (GA). This implies that students should master the phonological system and the phonetic realisations of either variety (or ideally both). In other words, students should be able to list the rules for grapheme to phoneme mapping (Deschamps et al. 2004, part 5), to phonetically transcribe speech from either variety, and to demonstrate these sounds orally. By extension, it is expected that they should be capable of speaking English with one of these two accents, and of doing it consistently (at least those who are not native English speakers or those who have not spent any significant amount of time in English-speaking countries and who have not acquired a consistent regional/non-standard accent—i.e., nearly all of those at the undergraduate level). This requirement was put forward in the yearly report written by the jury of the Agrégation (Torrent 2022). Whether students are indeed able to comply with this requirement is the general goal of the current article.
While recent decades have witnessed the emergence in L2 studies of such concepts as English as a Lingua Franca (Jenkins 2006; Walker 2010), comprehensibility (Derwing and Munro 1997; Trofimovich and Isaacs 2012), and the so-called “mid-Atlantic” standard (Mering 2022; Modiano 1996), the training of English teachers in France still relies on the nativeness principle (Levis 2005), which amounts, in our case, to targeting native-like productions that are consistent with either RP or GA. Questioning this premise is well beyond the scope of the current article (see Pennington and Rogerson-Revell 2019, esp. chap 3, for a very readable and comprehensive review). Suffice it to say that, as teachers who make every effort to familiarise our students with all varieties of English, we find it nonetheless convenient (i) to have a limited set of varieties against which our students’ pronunciation can be assessed, in particular within the constrained framework of the CAPES and the Agrégation, and (ii) to teach them accents that are not stigmatised (Baratta 2017; Frumkin and Stone 2020), thus increasing the odds that their pronunciation will be perceived favourably. Using auditory assessments and automatic methods, we set out to explore whether our students adopt the RP or the GA standard, and whether they do it consistently.
There is a notable dearth of literature on which English accents advanced learners actually target or use. To the best of our knowledge, no systematic large-scale study has addressed the oral productions of French learners in terms of the RP vs. GA dichotomy. Some studies have investigated learners’ and teachers’ attitudes towards accents in English as a Foreign Language (EFL). In a survey involving over 450 teachers of English from seven European countries, Henderson et al. (2012) found that RP remains the preferred variety in the classroom, even when teachers acknowledge that their students might favour GA. The same pattern is apparent in Carrie (2017), where a cohort of Spanish students responded that RP was more suitable as a model to emulate, while recognizing that GA was more socially attractive. The Czech students in Jakšič and Šturm (2017) also thought that RP was more prestigious, but RP or GA preferences were partly determined by where (in either the UK or the US) the respondents would like to spend five years of their lives. In Meer et al. (2022), German high-school students ranked Southern Standard British first and Standard American second as reference varieties, while English as a second language varieties were perceived negatively. Beyond Europe, the Vietnamese students in Phan (2020) gave higher ratings to GA (over RP), based on status (intelligent, educated, confident, clear, fluent, knowledgeable, authoritative, professional) and solidarity (friendly, attractive, cool, serious) traits. In a survey submitted to +1300 Hong Kong secondary-level EFL learners, Tsang (2020) found that, even though to a lesser degree than in previous studies (e.g., Kang 2015), students generally had a slight preference for teachers using RP or GA, especially those students who aimed at developing these accents. Some studies have, in addition to learners’ attitude ratings, factored in actual recordings of learners and their explicit accent target. For example, Rindal (2010) found that Norwegian students preferred RP to GA. Most of them said they targeted a British accent; however, their productions had a high rate of American phonological variants. It is noteworthy that very few studies have investigated actual audio recordings, and following the findings in Rindal (2010), the accent learners target is not the accent they actually produce. Therefore, when Dubravac et al. (2018) found a preference for American pronunciation variants (over British ones) in their university students in Bosnia and Herzegovina after the researchers pronounced, e.g., the word better successively with a British and an American accent and asked which variant the participant would produce, it is questionable whether their explicit choice actually reflects their productions. Such findings reinforce the need for thorough production studies like ours.
As far as French learners of English are concerned, Toffoli and Sockett (2015) cite a previous study of theirs, where teachers noted that more and more students targeted an American pronunciation. The only recent acoustic study (that we are aware of) involving French students’ productions in an attempt to assess the proportion of RP and GA variants is Yibokou et al. (2019). Ten students were recorded producing key words whose phonetic content is known to be accent-specific (rhoticity, T Voicing, etc.). Over all speakers, the proportion of RP features was slightly greater than that of GA features; however, students were not consistent, in that they all borrowed features from both accents.
In their review of 75 L2 pronunciation studies, Thomson and Derwing (2015) found that about four/five of them involved human listeners, while the remainder used acoustic measurements. The originality of our approach is that we combine auditory analyses (our daily routine as EFL teachers specialised in pronunciation) with automatic computerised methods, so that each approach can reinforce or invalidate the other. Computer assisted pronunciation training (CAPT) tools have received increasing attention in recent years, as they provide autonomous, adaptive and stress-free learning. These tools usually provide automatic assessments of learners’ productions with the help of automatic speech recognition (ASR) systems, which offer the advantage of cost-effectiveness, objectivity and consistency. Early ASR technology (reviewed in Cucchiarini and Strik 2017) was not optimised to assess L2 pronunciation. However, more recent research (Ahn and Lee 2016; Golonka et al. 2014; McCrocklin 2015; Ngo et al. 2023) suggests that ASR tools are beneficial to L2 pronunciation learning. Ryan and Ryuji (2021) implemented an online ASR-based training platform which presented 98 Japanese EFL students with words or sentences (written and spoken using text to speech) they had to record, before receiving feedback generated by the ASR of their computer or mobile device. Their results suggest objective improvement in intelligibility and articulation rate, especially for mid-level learners. Furthermore, the feedback was, overall, positive, and students reported improvement, particularly on segmental aspects. Xiao and Park (2021) investigated the effectiveness of ASR for pronunciation assessments with five Chinese EFL learners who took a human-assessed read-aloud test, as well as an ASR-based read-aloud test, and surveyed their attitudes towards the use of the latter type of training. In an interview carried out after the experiment, students appreciated the usefulness and user-friendliness of the training software, and found that their different learning needs were met. Chiefly, this study found that 85% of phonemes diagnosed as errors by the software were also detected as errors by the human raters. de Wet et al. (2009) measured the correlation between automatic proficiency indicators and proficiency ratings attributed to South African ESL speakers by human raters in a reading task and a repetition task. They found that rate of speech and accuracy (determined by comparing the orthographic transcription of a repeated sentence with the output of automatic speech recognition of that sentence) are highly correlated with human ratings. However, goodness of pronunciation (GOP) yielded a very low correlation with human ratings. They argue that this may be due to the small variation in proficiency among their speakers (generally high proficiency), and suggest that “[t]he predictive power of the GOP scores could possibly be improved by targeting specific sounds that are known to be problematic for the target student population” (p. 873). Importantly, their results reveal a higher inter-rater agreement in the more difficult (repeating) of the two tasks. More recently, Tejedor-García et al. (2020) reported a high level of correlation between machine and human ratings in an experiment involving 20 Spanish EFL learners who were trained to discriminate and produce English minimal pairs using CAPT.
Although a substantial body of work has explored the efficiency and accuracy of automatic pronunciation assessment, little research has investigated the relevance and usability of automatic methods for learners’ accent classification or for measuring accent consistency. It is therefore important to investigate the possibility of providing EFL teachers with automatic tools that could allow them to evaluate whether the oral productions of their students are indeed British or American, and whether these productions are consistent.
The main goal of this study is to explore how best to assess our students’ productions. First, we judged our students’ accents as either GA or RP in an auditory assessment task from 307 recordings (one for each student) of one sentence from a set of twelve. We predicted to observe fairly consistent RP and GA accents, along with students who combine phonetic features from both. We also aimed to determine to what extent we (university English teachers) agree with one another in our classification of students’ accents. Finally, we explore whether automatic speech recognition and automatic accent classification may be useful in assessing our students’ productions. We therefore compare our (human) classifications with those of four ASR and one automatic accent identification (AID) system.
2. Materials and Methods
2.1. Audio Recordings
We recorded 307 undergraduate students from the English Department at Université Paris Cité reading 12 phonetically rich sentences (see Appendix A) specifically designed to elicit 10 pronunciation cues known to vary between RP and GA (Roach 2009; Wells 1982): the trap, bath, lot, and thought vowels (Wells’s (1982) standard lexical sets);2 the <-ile>, <-ization>, and <-ary/-ory> endings, and items potentially displaying T Voicing, rhoticity, and Yod Dropping.
Recordings took place in a sound-attenuated room. Sentences were displayed on a computer screen using the ROCme! software (Ferragne et al. 2013) and recorded with an Audio-Technica AT-2020 USB microphone directly plugged into a laptop. The experiment was self-paced: prior to recording each sentence, the students were asked to read it for themselves and to make sure they were able to say it without hesitation. Whenever they were ready, they recorded the sentence, and if they were satisfied with their production, they could move on to the next sentence by pressing a key.
Due to practical issues, self-reported metadata were obtained only for a subset of participants (242/307). A total of 206 students were French monolinguals (who had French as their mother tongue and were late learners of English with an expected minimum B2 level); 7 were French bilinguals (self-assessed fully fluent native speakers of French and another language—2 of whom declared their other language was English), and 29 had other L1s (monolinguals of a language different from French, including one native speaker of American English). The remaining 65 students had unknown L1s, but based on our experience, we can expect most of them to have been native speakers of French. A standardised test such as the LEAP-Q (Marian et al. 2007) would have allowed us to gather very accurate bilingual profiles. However, our self-reported data fails to capture the diversity of cases; we can only use it as a rough guideline. Therefore, since metadata on our students’ linguistic background is only partial, and probably biased by their own conception of bilingualism, and given that our aim was to characterise the accents of our students whatever their linguistic background, it was decided that they should all be included.
2.2. Auditory Assessment
The four authors served as judges in an auditory assessment task. All judges have taught English phonetics and pronunciation to French students for 16 years on average (SD: 5.35). One of them is a native speaker of (northern) British English. The other three are native speakers of French. One of the latter speaks with an American accent, while the other two favour a British pronunciation.
Only one of the twelve sentences—sentence 8—was auditorily assessed for each speaker. It was chosen because it was shorter, hence minimising the risk of faltering or stammering. It contained a small subset of four phonological features (lot, bath, T Voicing, and rhoticity—instantiated in the keywords logs, grass, water, and hotter) that are known to be accent-specific (Roach 2009; Wells 1982). The lot vowel is longer, more open, and less rounded in GA. The bath vowel is longer and more posterior in RP. T Voicing, which is the tapping or flapping of post-stress intervocalic /t/, normally occurs only in GA. RP is not rhotic, while GA is. Based on this sentence, we also rated perceived native-likeness on a five-point scale.
The listening experiment was delivered through a purpose-built Praat-based interface. For each occurrence of sentence 8, listeners saw a first prompt for the native-likeness rating with a “play” button, and the possibility to choose a number between 1 (very bad) and 5 (very good). They were able to play back the sentence as many times as they deemed necessary. A potential judge bias in native-likeness ratings will be tested in Section 3.1.3 by means of an analysis of variance. Pairwise correlations between judges and intra class correlations (ICCs) of the ICC2k3 (as all ICCs in our article) type (Koo and Li 2016) will also be used to assess rating consistency. A possible accent bias, whereby judges would give higher native-likeness ratings to one of the two target accents, will be evaluated with t-tests.
Then, a second prompt appeared for the RP vs. GA rating. The sentence also had unlimited play back, and four rows were displayed; to the left of each row, the test word was shown, then there were three buttons: a British flag, an American flag, and a question mark. The first two buttons are self-explanatory: e.g., if the RP variant was heard, the button with the British flag was pressed. The question mark button was used whenever the listener failed to determine whether the variant was RP or GA, or when the wrong vowel was used (e.g., “hotter” produced with the goat vowel), or when the pronunciation was too close to the French sound. As a convention, GA responses were coded as −1, RP responses as 1, and question marks as 0. This rating scheme allowed us to compute mean accent scores for each speaker: for each judge, the four ratings (one for each phonological feature) were averaged, and these by-judge means were averaged across judges. We thus obtained, for each speaker, a single score that reflected where he or she lay on the GA–RP continuum, with values equal or close to −1 indicating high “GAness” and values equal or close to 1 indicating high “RPness” (Section 3.1.2). Sometimes (as will be the case in Figure 4), by-judge means (the mean ratings across the four phonological features by a single judge for each speaker) were used, since what mattered was the ratings of individual judges.
In order to assess the overall consistency of judges, ICCs were computed. Percent agreement between pairs of judges for all ratings, and also on a by-feature basis, were also calculated (Section 3.1.1). Percent agreement was simply the percentage of strictly identical responses (−1, 0, or 1) among raters. Given the diversity of judges’ linguistic backgrounds (see beginning of the current section), it was important to keep track of individual ratings; hence our use of pairwise correlations, between-rater comparisons, and plots, where judges appear separately.
2.3. Automatic Speech Recognition
We ran four automatic speech recognition models (ASR)—DeepSpeech (Hannun et al. 2014), wav2vec 2.0 (Baevski et al. 2020; wav2vec henceforth), and two models from the Google speech-to-text API (the default model for British English and that for American English; GoogleGB and GoogleUS henceforth)—to determine if their outputs reflected our ratings, and if they could be of any use to assess students’ productions. We used these pretrained models without retraining them, so that anyone trying to replicate our findings with their data can just download the first two from their publicly accessible repositories and run them. Similarly, Google speech-to-text API offers pretrained models. In other words, speech-to-text conversion was performed without the possibility of altering default parameters, hence the total reproducibility of this section. We used Matlab Audio Toolbox and its specific functions to run speech-to-text conversions with DeepSpeech and wav2vec 2.0, or to interface with the Google API.
Since we used a finite set of known sentences, we were able to compute a measure of discrepancy, the word error rate (WER), between the original 12 sentences and the outputs given by the ASR models. Direct comparisons (through correlations) with our auditory ratings will first involve WER values from sentence 8. Then, in order to see whether the remaining 11 sentences are consistent with sentence 8, all WERs will be compared between sentences using a linear mixed model (Section 3.2.1). An ICC was also computed to determine the degree of agreement in terms of WER between the 12 sentences.
Here, the WER is computed for each sentence token as the Levenshtein distance at the word level, i.e., the minimum number of insertions, deletions, or substitutions of words to perform in order to convert the sentence output by the ASR system into the real target sentence, divided by the number of words in the true sentence. We predicted that higher WERs should be found in speakers who had obtained low native-likeness ratings, and vice versa.
The DeepSpeech version used here4 has been trained on corpora including various varieties of English (among which was Common Voice English—Ardila et al. 2019). Thus, it might serve for pronunciation error diagnosis, but says little about students’ targeted accent. With GoogleGB, GoogleUS, and wav2vec (the latter, with accents closer to US English, Panayotov et al. 2015)5 being trained on accents from more specific regions, they let us keep track of the American vs. British dichotomy, and therefore might provide insight as to which accent our speakers targeted.
These models output orthographic representations, not phones; interpreting what happened phonetically is therefore not so straightforward. However, we propose an exploratory analysis of the results (Section 3.2.2 and Section 3.2.3). In the implementation we used, both Google models were constrained to output real words, while the other two models returned whatever orthographic pattern matched the acoustic input (including non-words). It is therefore possible to try to infer what phonetic realisation may have caused the model to output a given orthographic form (Deschamps et al. 2004).
2.4. Automatic Accent Identification
Automatic accent identification (AID) was performed in order to compare our auditory ratings with an off-the-shelf pretrained model. The system, by Zuluaga-Gomez et al. (2023), has been trained on 16 varieties of English from the Common Voice 7.0 database. The 16 classes were: African, Australia, Bermuda, Canada, England, Hong Kong, Indian, Ireland, Malaysia, New Zealand, Philippines, Scotland, Singapore, South Atlantic, US, and Wales. The best version of the system achieves 97.1% accuracy. We applied this method to sentence 8 and compared the output with our auditory mean accent scores in Section 3.3. The mean accent scores will be used to split students into two groups (RP vs. GA), and we will measure to what extent the two groups match the England vs. US partition obtained by the AID system.
3. Results
3.1. Auditory Assessment
3.1.1. Four Phonological Features
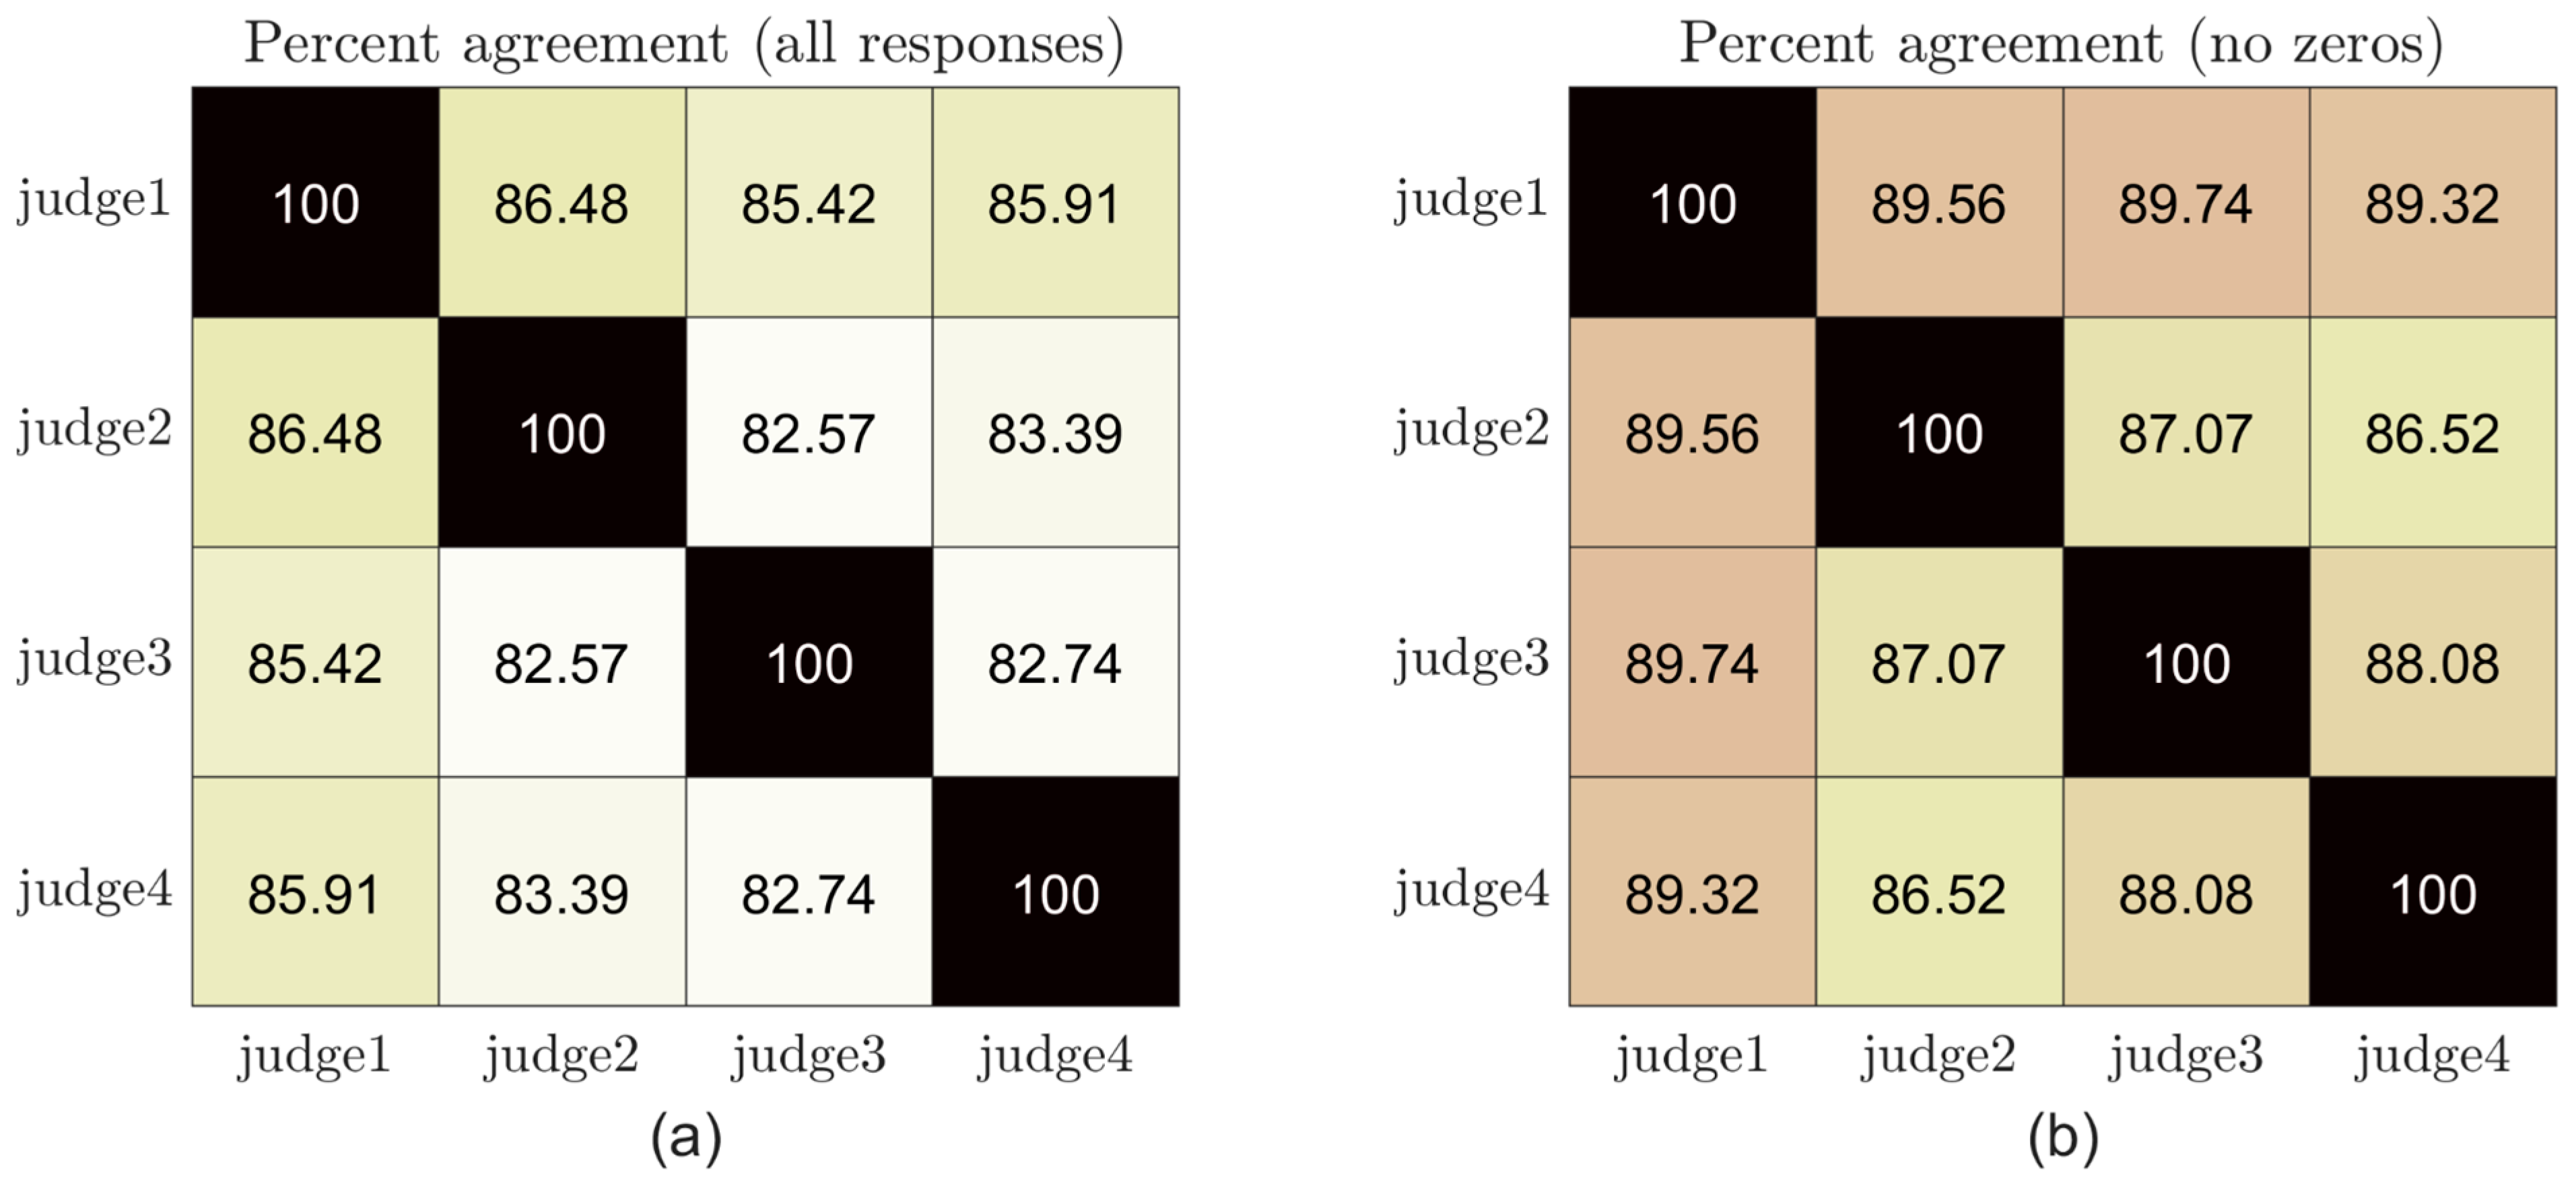
Each of the four judges analysed 1228 tokens (307 speakers × 4 features), hence a total of 4912. Percentage agreement between pairs of judges ranged from 82.57 to 86.48%. When zeros (question mark responses) were removed, agreement ranged from 86.52 to 89.74%. All pairwise agreement scores, shown in Figure 1, reached statistical significance according to Cohen’s Kappa test. When all responses were included, the ICC coefficient reached 0.92 (F(1227,3681) = 12.69, p < 0.001); when zeros were removed, the coefficient was 0.93 (F(1114,3342) = 14.22, p < 0.001). According to Koo and Li (2016), values above 0.90 should be regarded as “excellent reliability”.
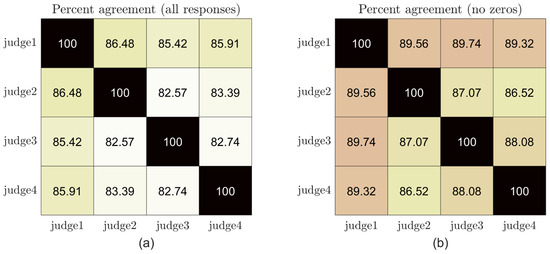
Figure 1.
Pairwise auditory agreement between judges: (a) with all responses; (b) without zero (question mark) responses.
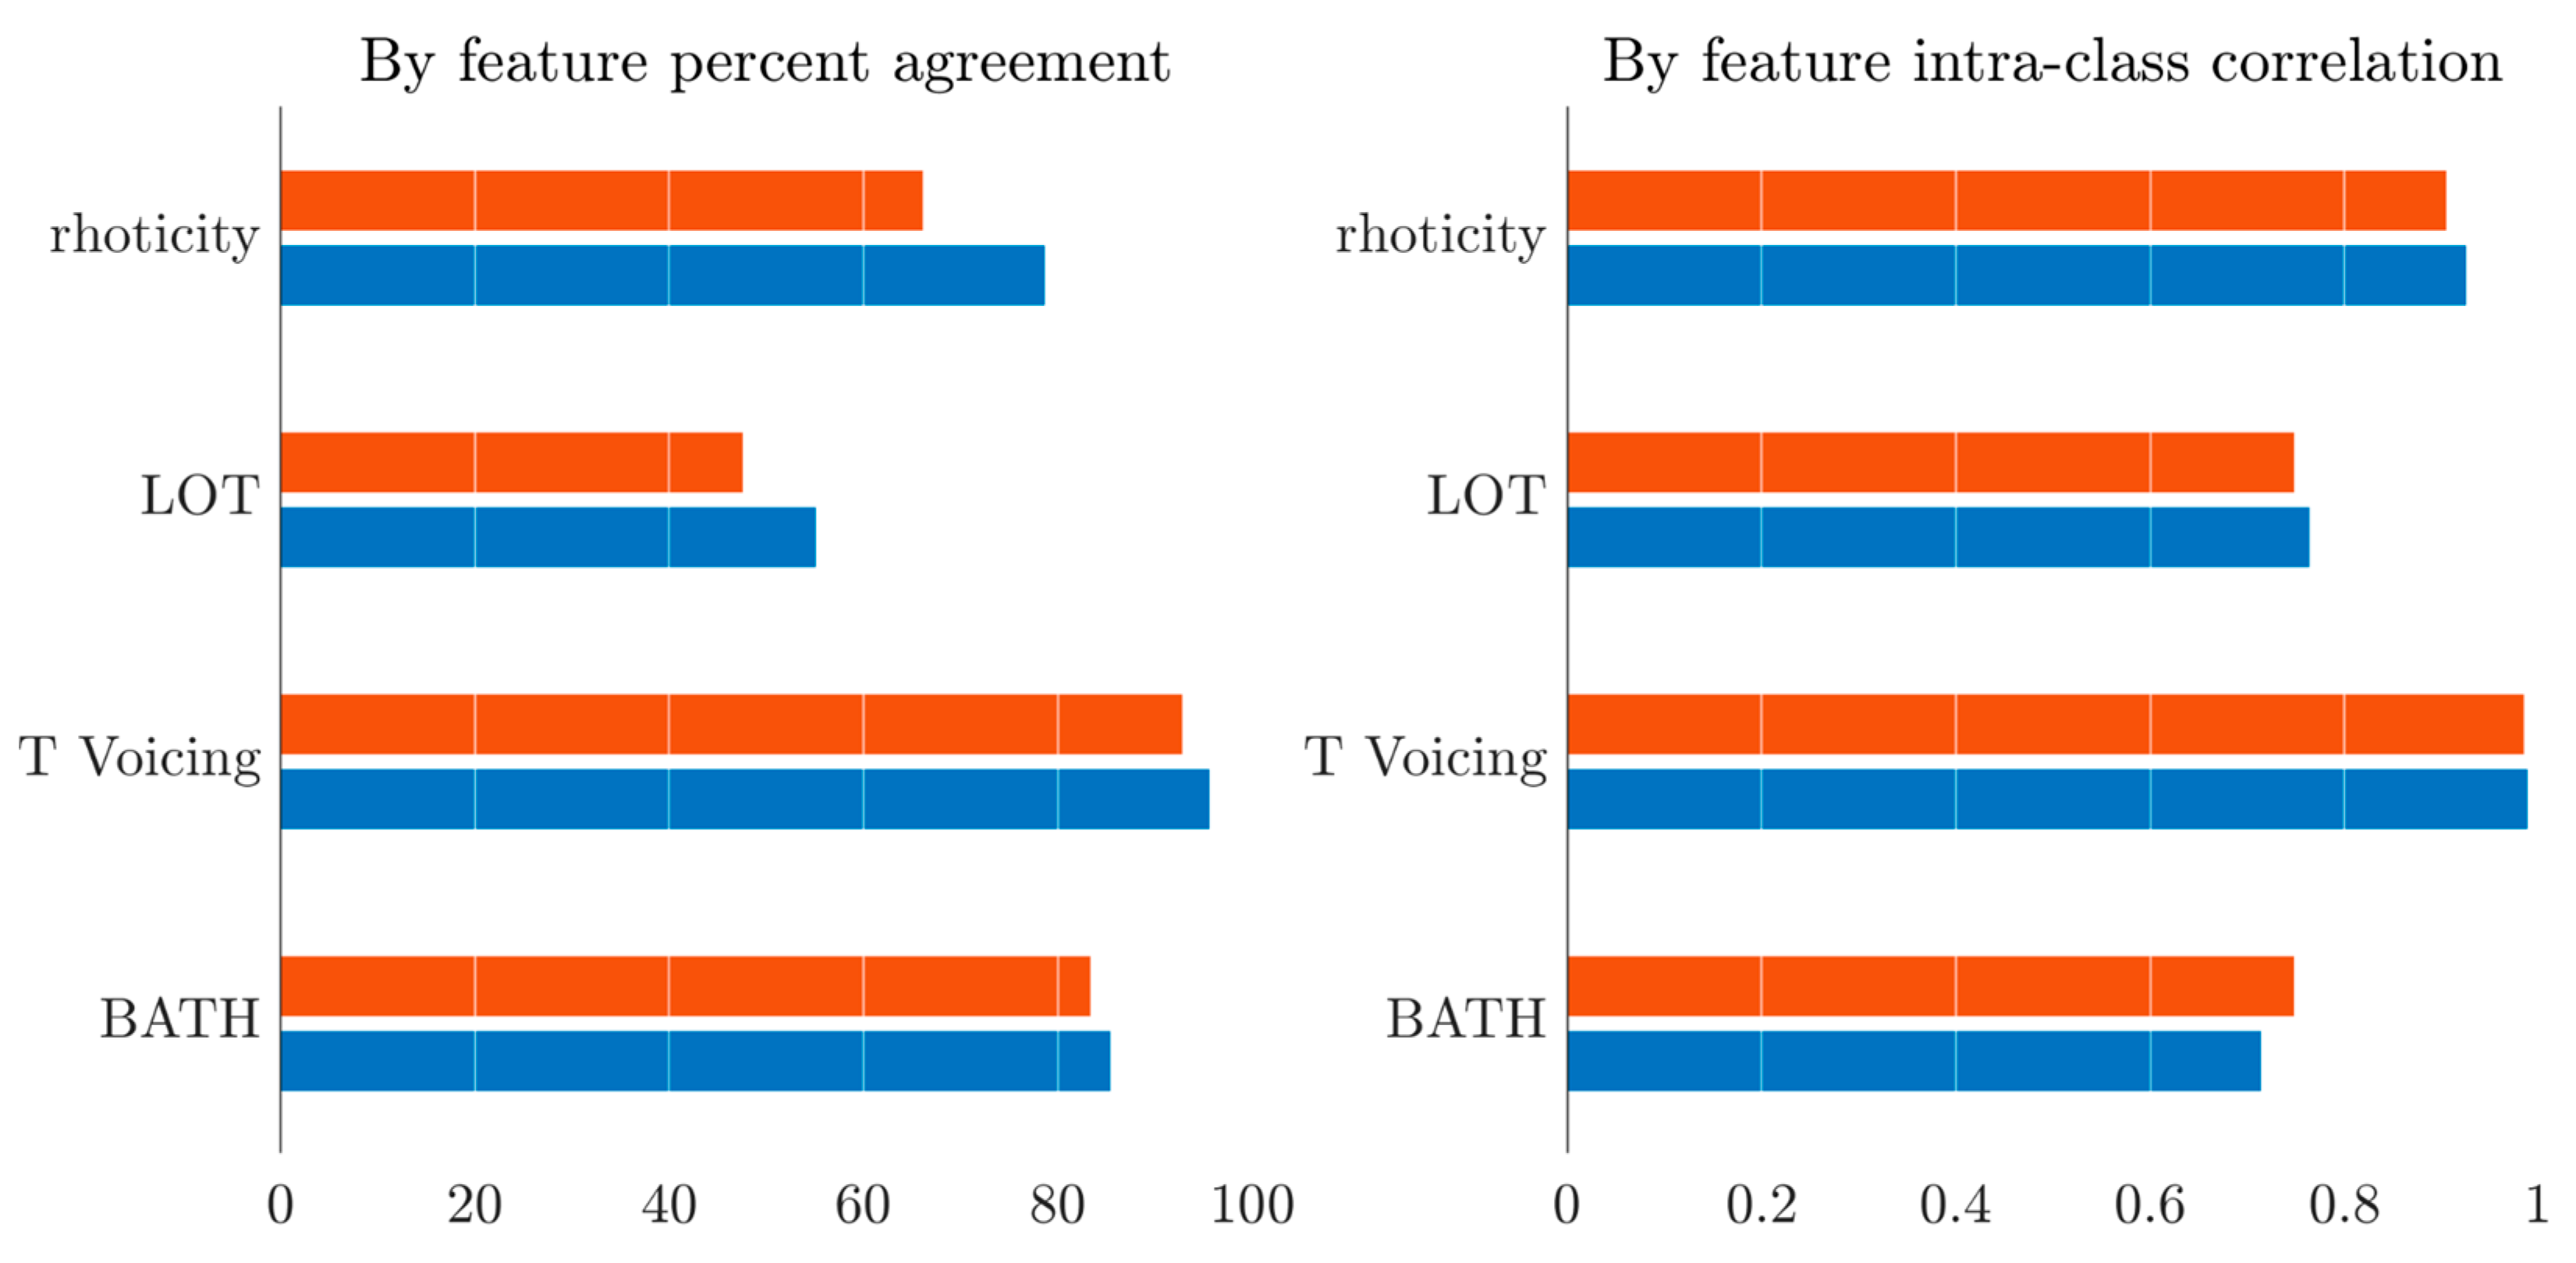
By-feature percent agreement shows more variation: Figure 2 displays percentage agreement and intra-class correlation across all judges for the four features with all responses (red bars) and without zero (question marks) responses (blue bars). Percentage agreement values range from 47.56% for lot including zeros to 95.62% for T Voicing without zeros. All ICCs are significant at the p < 0.001 level.
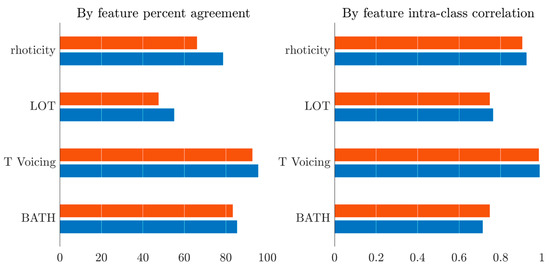
Figure 2.
By-feature percentage agreement and intra-class correlation for all judges with all data (red) and without zero (question mark) responses (blue).
3.1.2. Accent Profiles
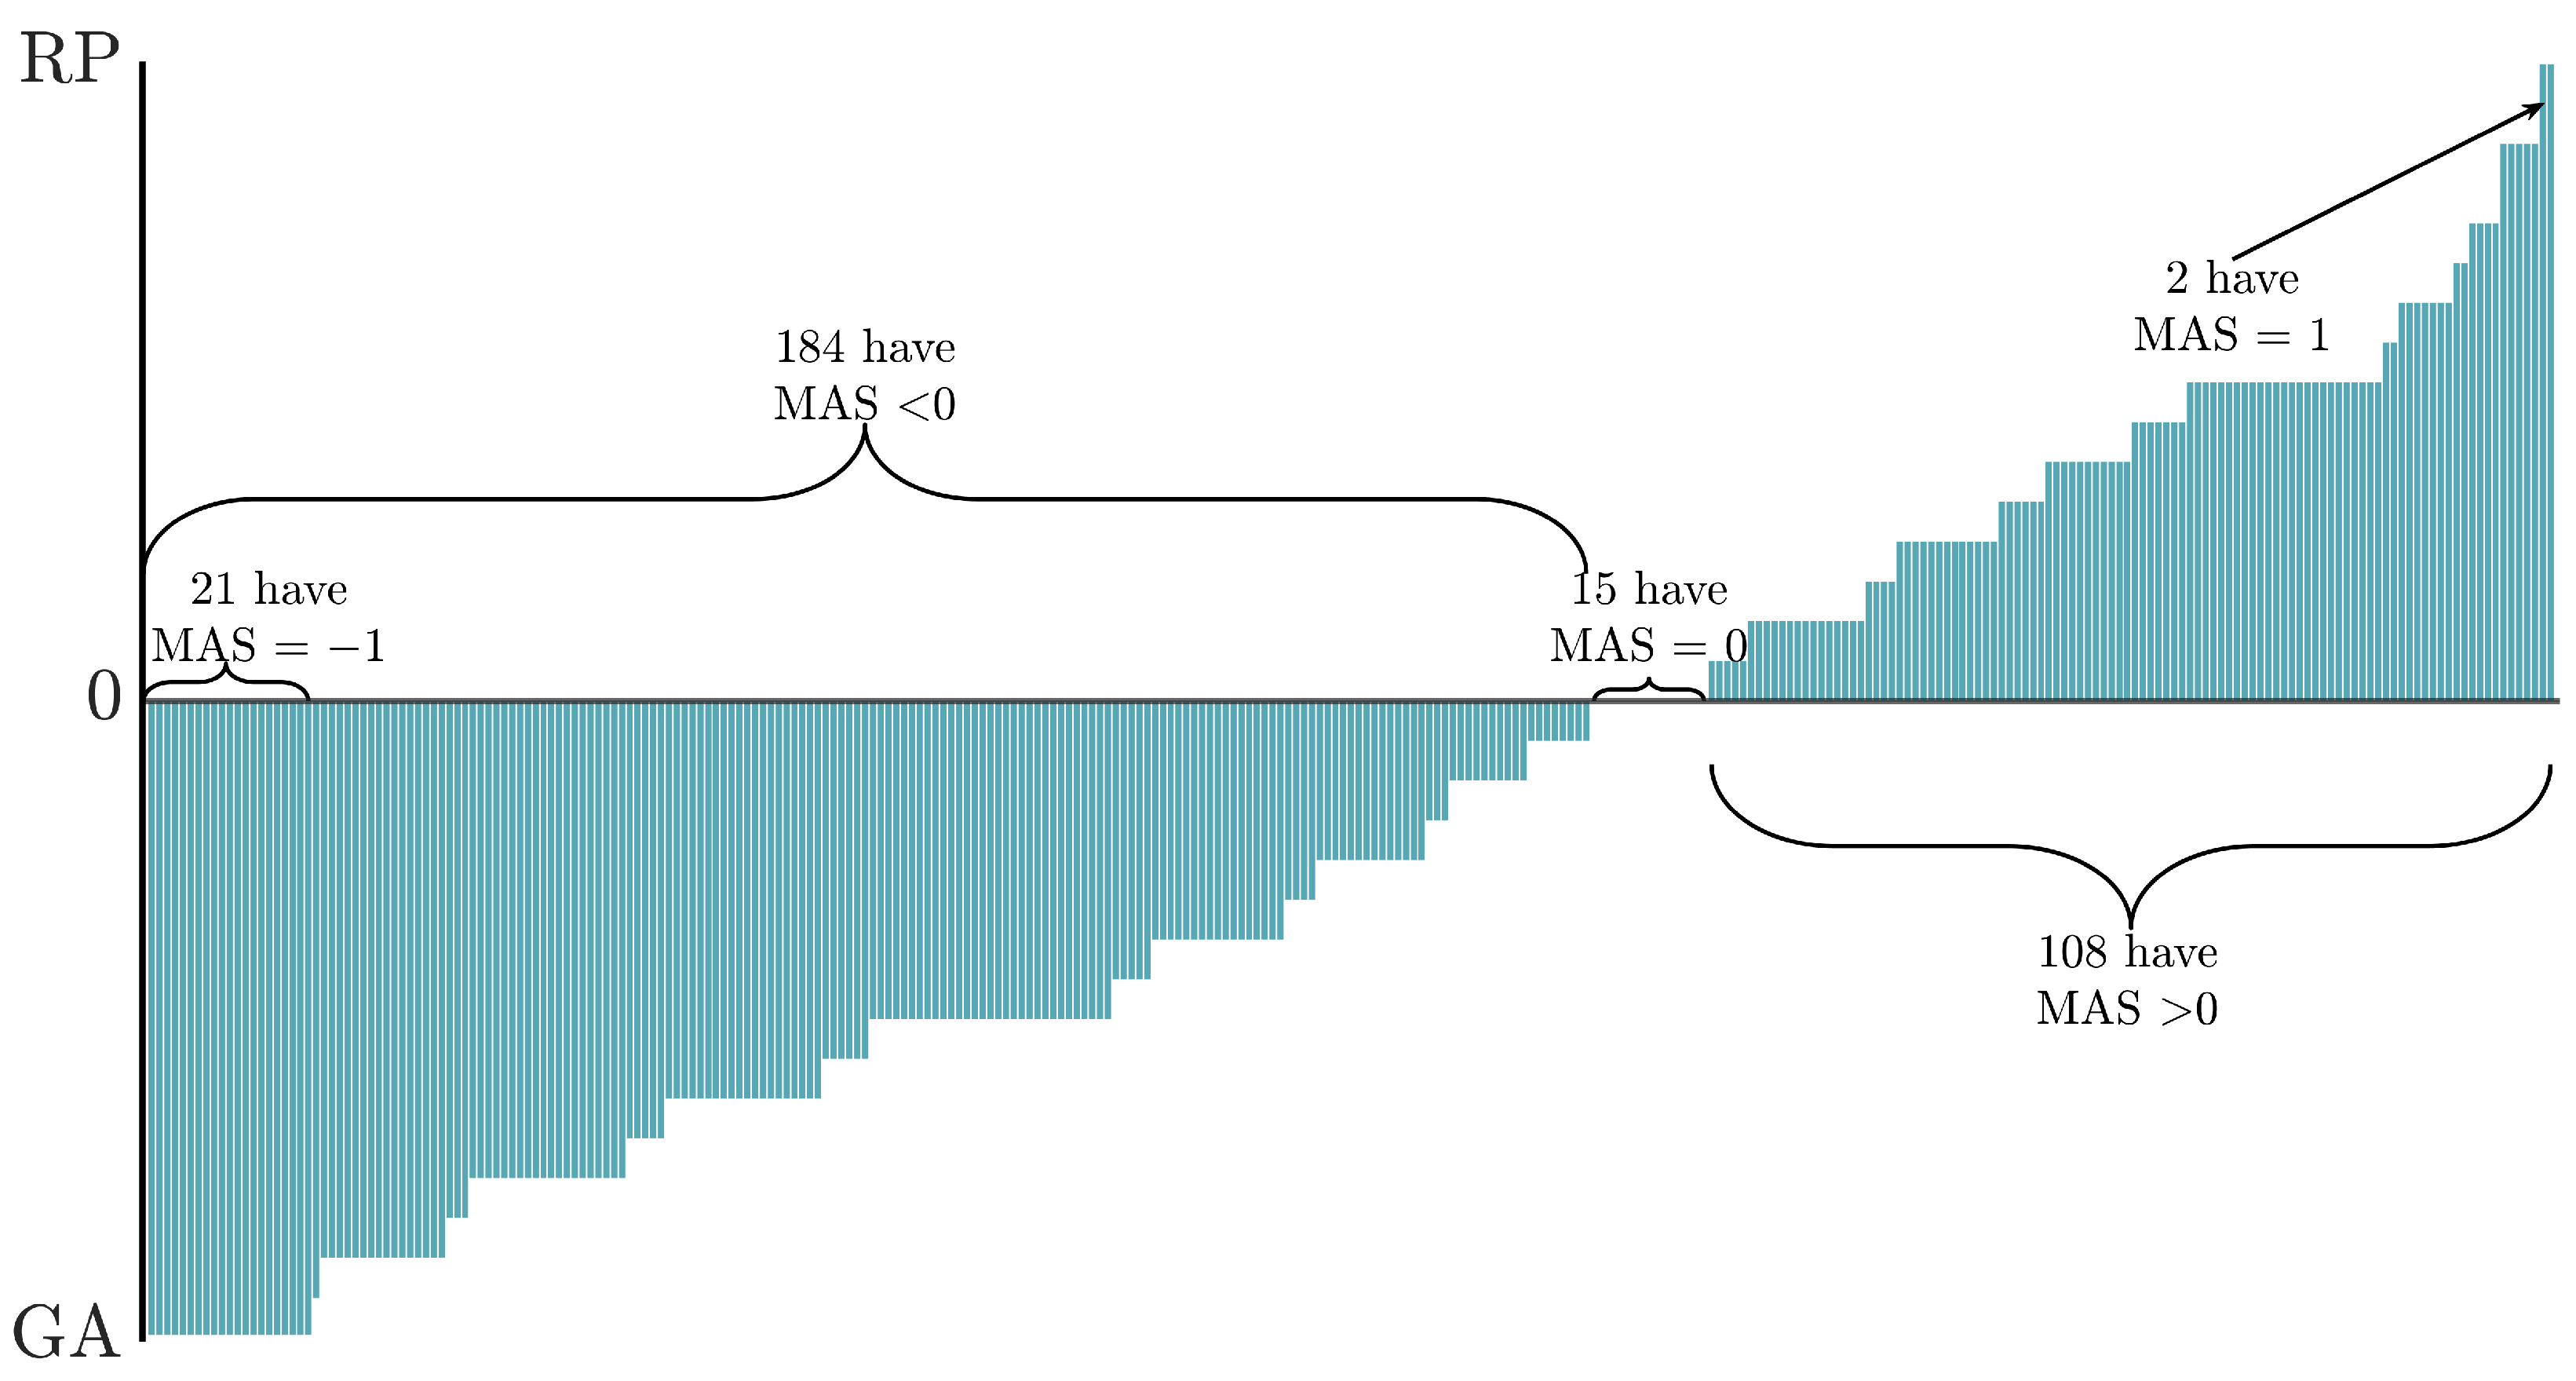
The mean accent scores that were computed for each student are shown in Figure 3: they are sorted on a scale ranging from GA to RP. On the GA side, there are 184 students; on the RP side, 108 students, and 15 of them received a score of 0 that placed them halfway between the two varieties. Twenty-one subjects unanimously achieved a maximally GA mean accent score (including the one American English native); only two subjects were perceived as maximally RP (including one of the speakers who said they were French–English bilingual).

Figure 3.
Students’ accent profiles based on the mean accent score (MAS) across four judges for sentence 8: −1 is maximally GA; 1 is maximally RP. Each bar represents one student.
3.1.3. Native-Likeness
A one-way ANOVA was performed to test the effect of judge on native-likeness ratings. A statistically significant difference was found (F(3,1224) = 34.89, p < 0.0001). Post hoc tests revealed that Judge 1 had lower ratings than the other three. Judge 2 had ratings that were significantly higher than Judge 1, and lower than Judge 3 and 4. The ratings of the latter were not different. The mean native-likeness values for Judge 1 to 4 were (on a five-point scale) 2.22, 2.47, 3.03, and 2.89.
Pairwise correlations between judges’ native-likeness ratings were significant and ranged from 0.65 to 0.74. These coefficients suggest that although we were rather consistent with each other, we intuitively expected that the correlations would be higher. However, overall reliability, as reflected by an ICC of 0.87 (F(306,918) = 9.76, p < 0.001), should be regarded as “good”, according to Koo and Li (2016).
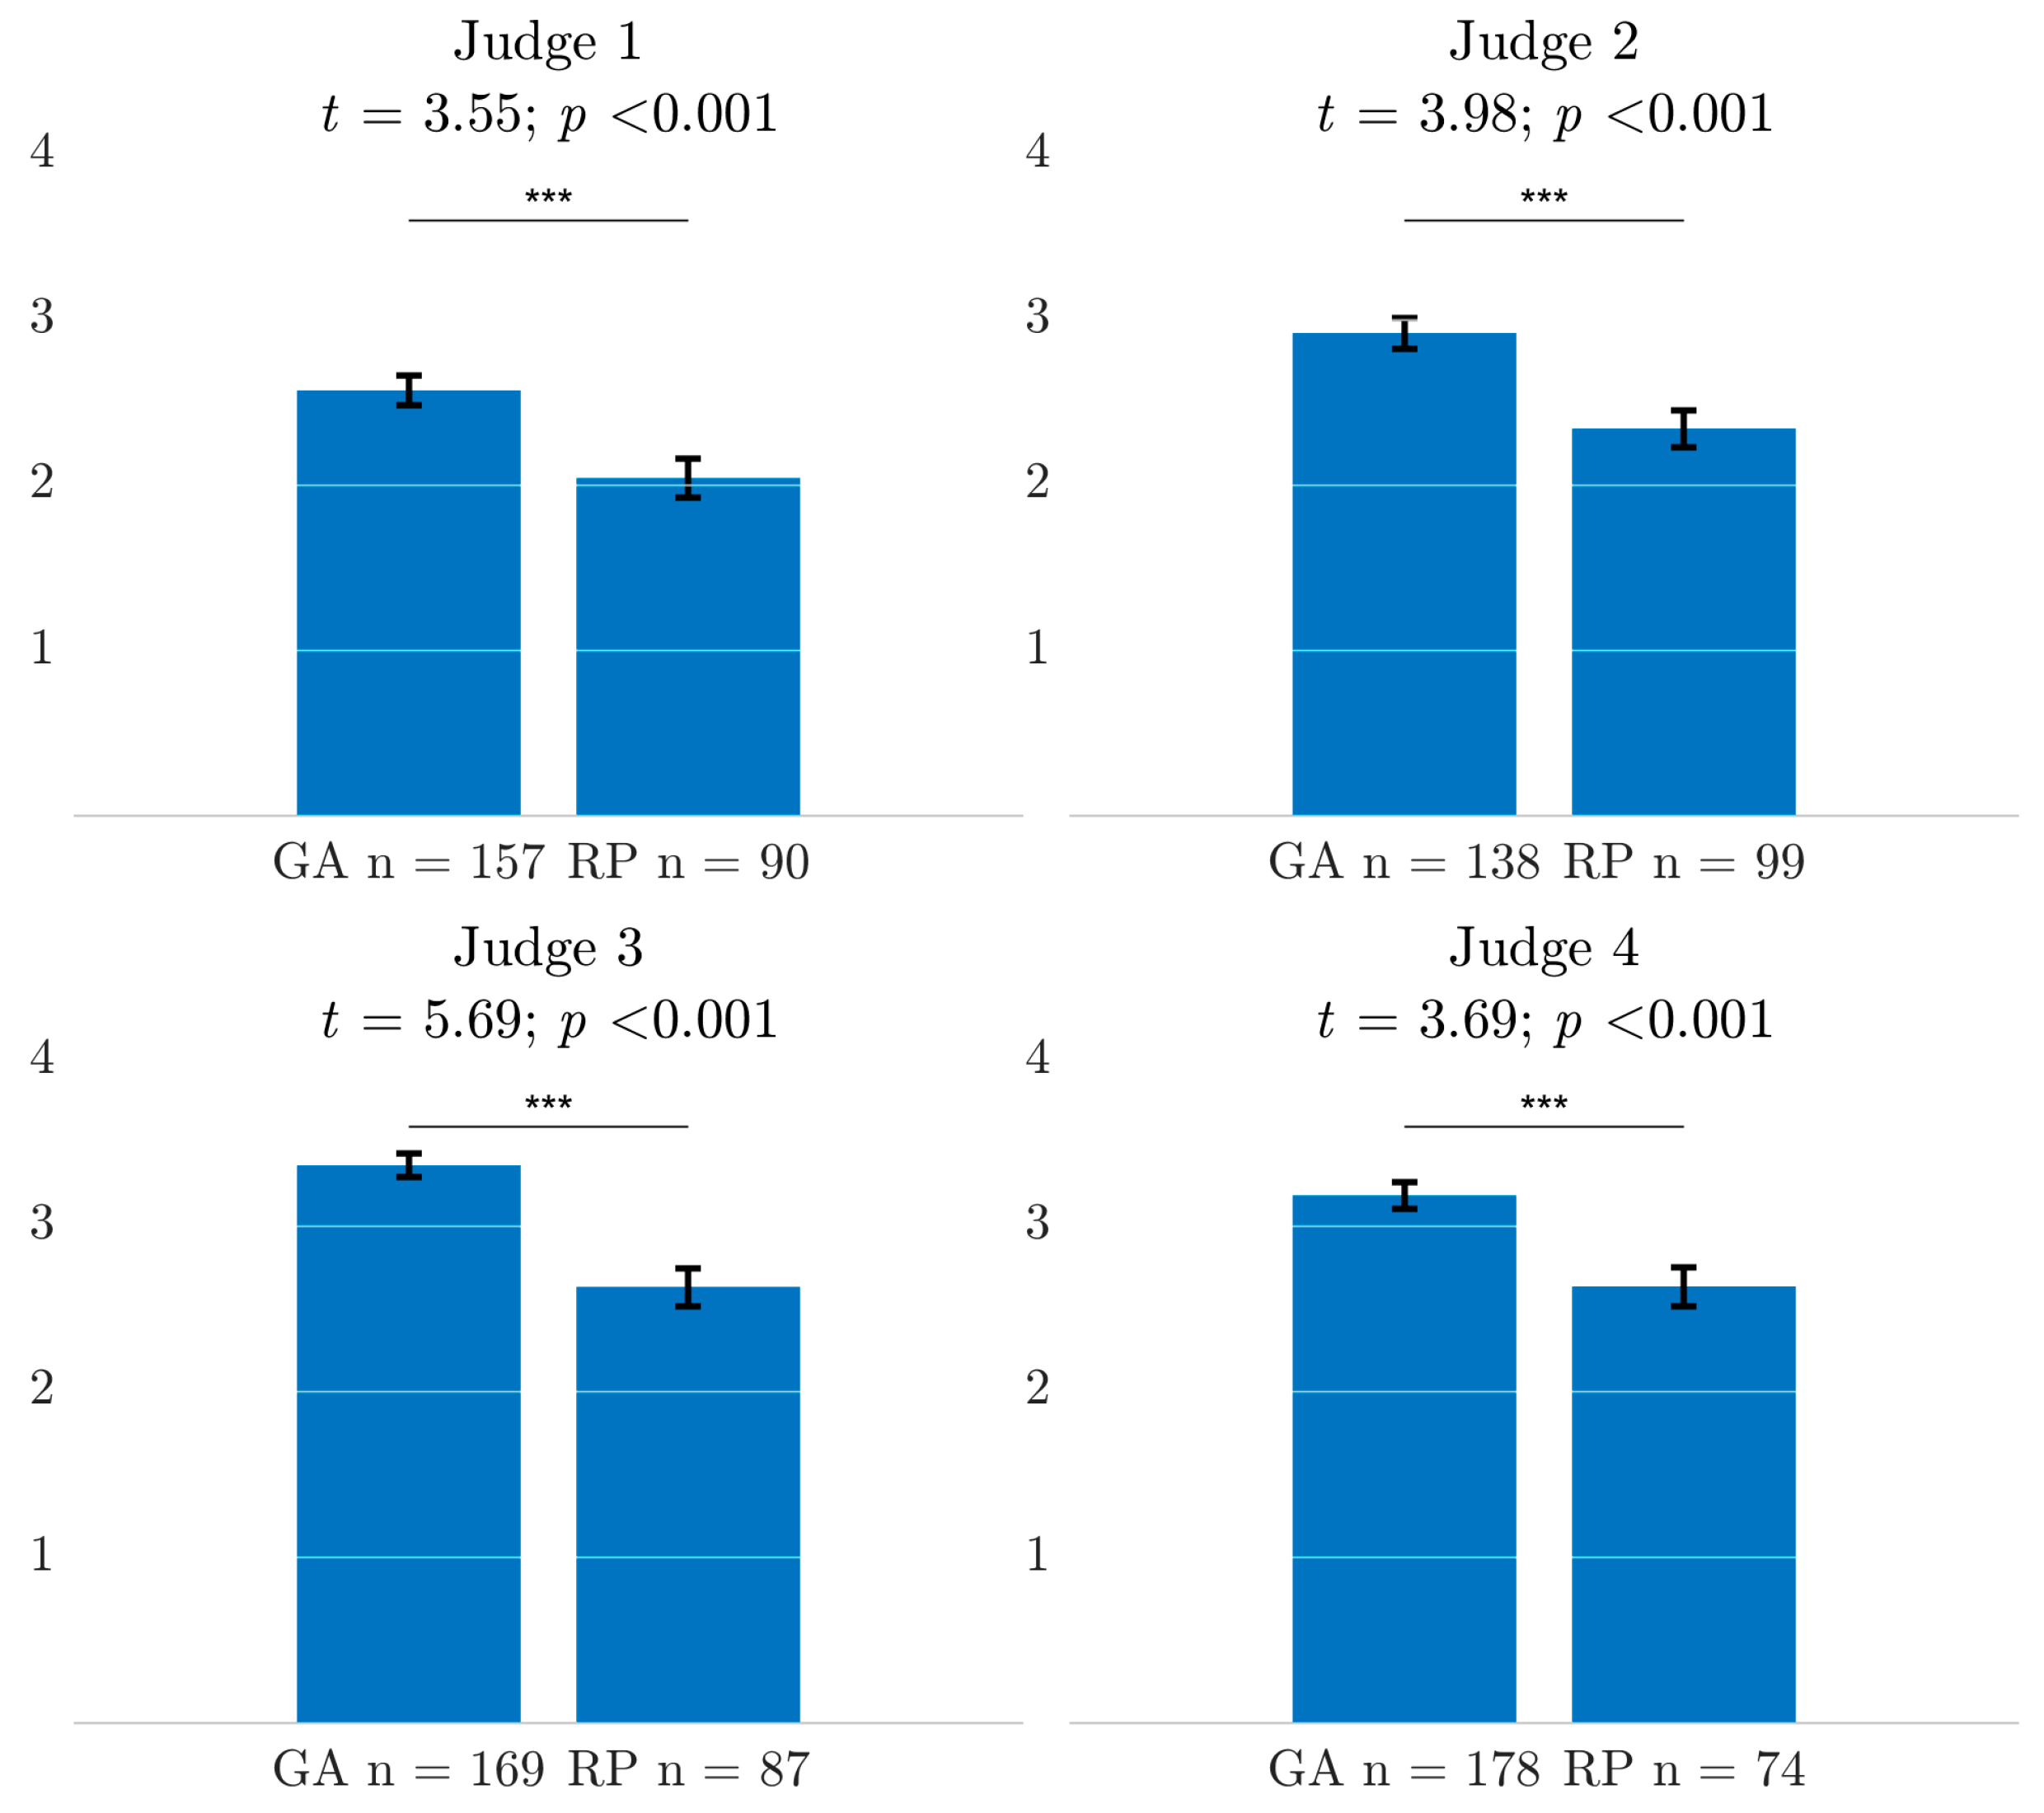
Now, a legitimate question is whether there was an accent bias affecting native-likeness ratings, i.e., whether judges had a tendency to give higher native-likeness ratings to one accent. The students were split into two groups for each judge. The first group contained the students whose productions had been perceived as more GA by the judge, and those who were more RP were in the other group. This was conducted independently for each judge, because the number of students in the GA and RP group was different across judges. A t-test was performed for each judge to evaluate the impact of accent on native-likeness. All tests turned out to be statistically significant; native-likeness ratings were always higher for GA students (see Figure 4).
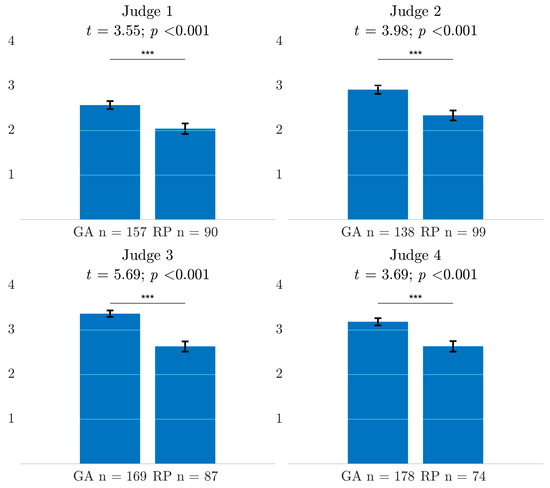
Figure 4.
Native-likeness ratings by each judge for the students they classified as GA (mean accent score < 0) or RP (>0); *** statistically significant at the p < 0.001 level.
3.2. Automatic Speech Recognition
3.2.1. ASR: Results by Model
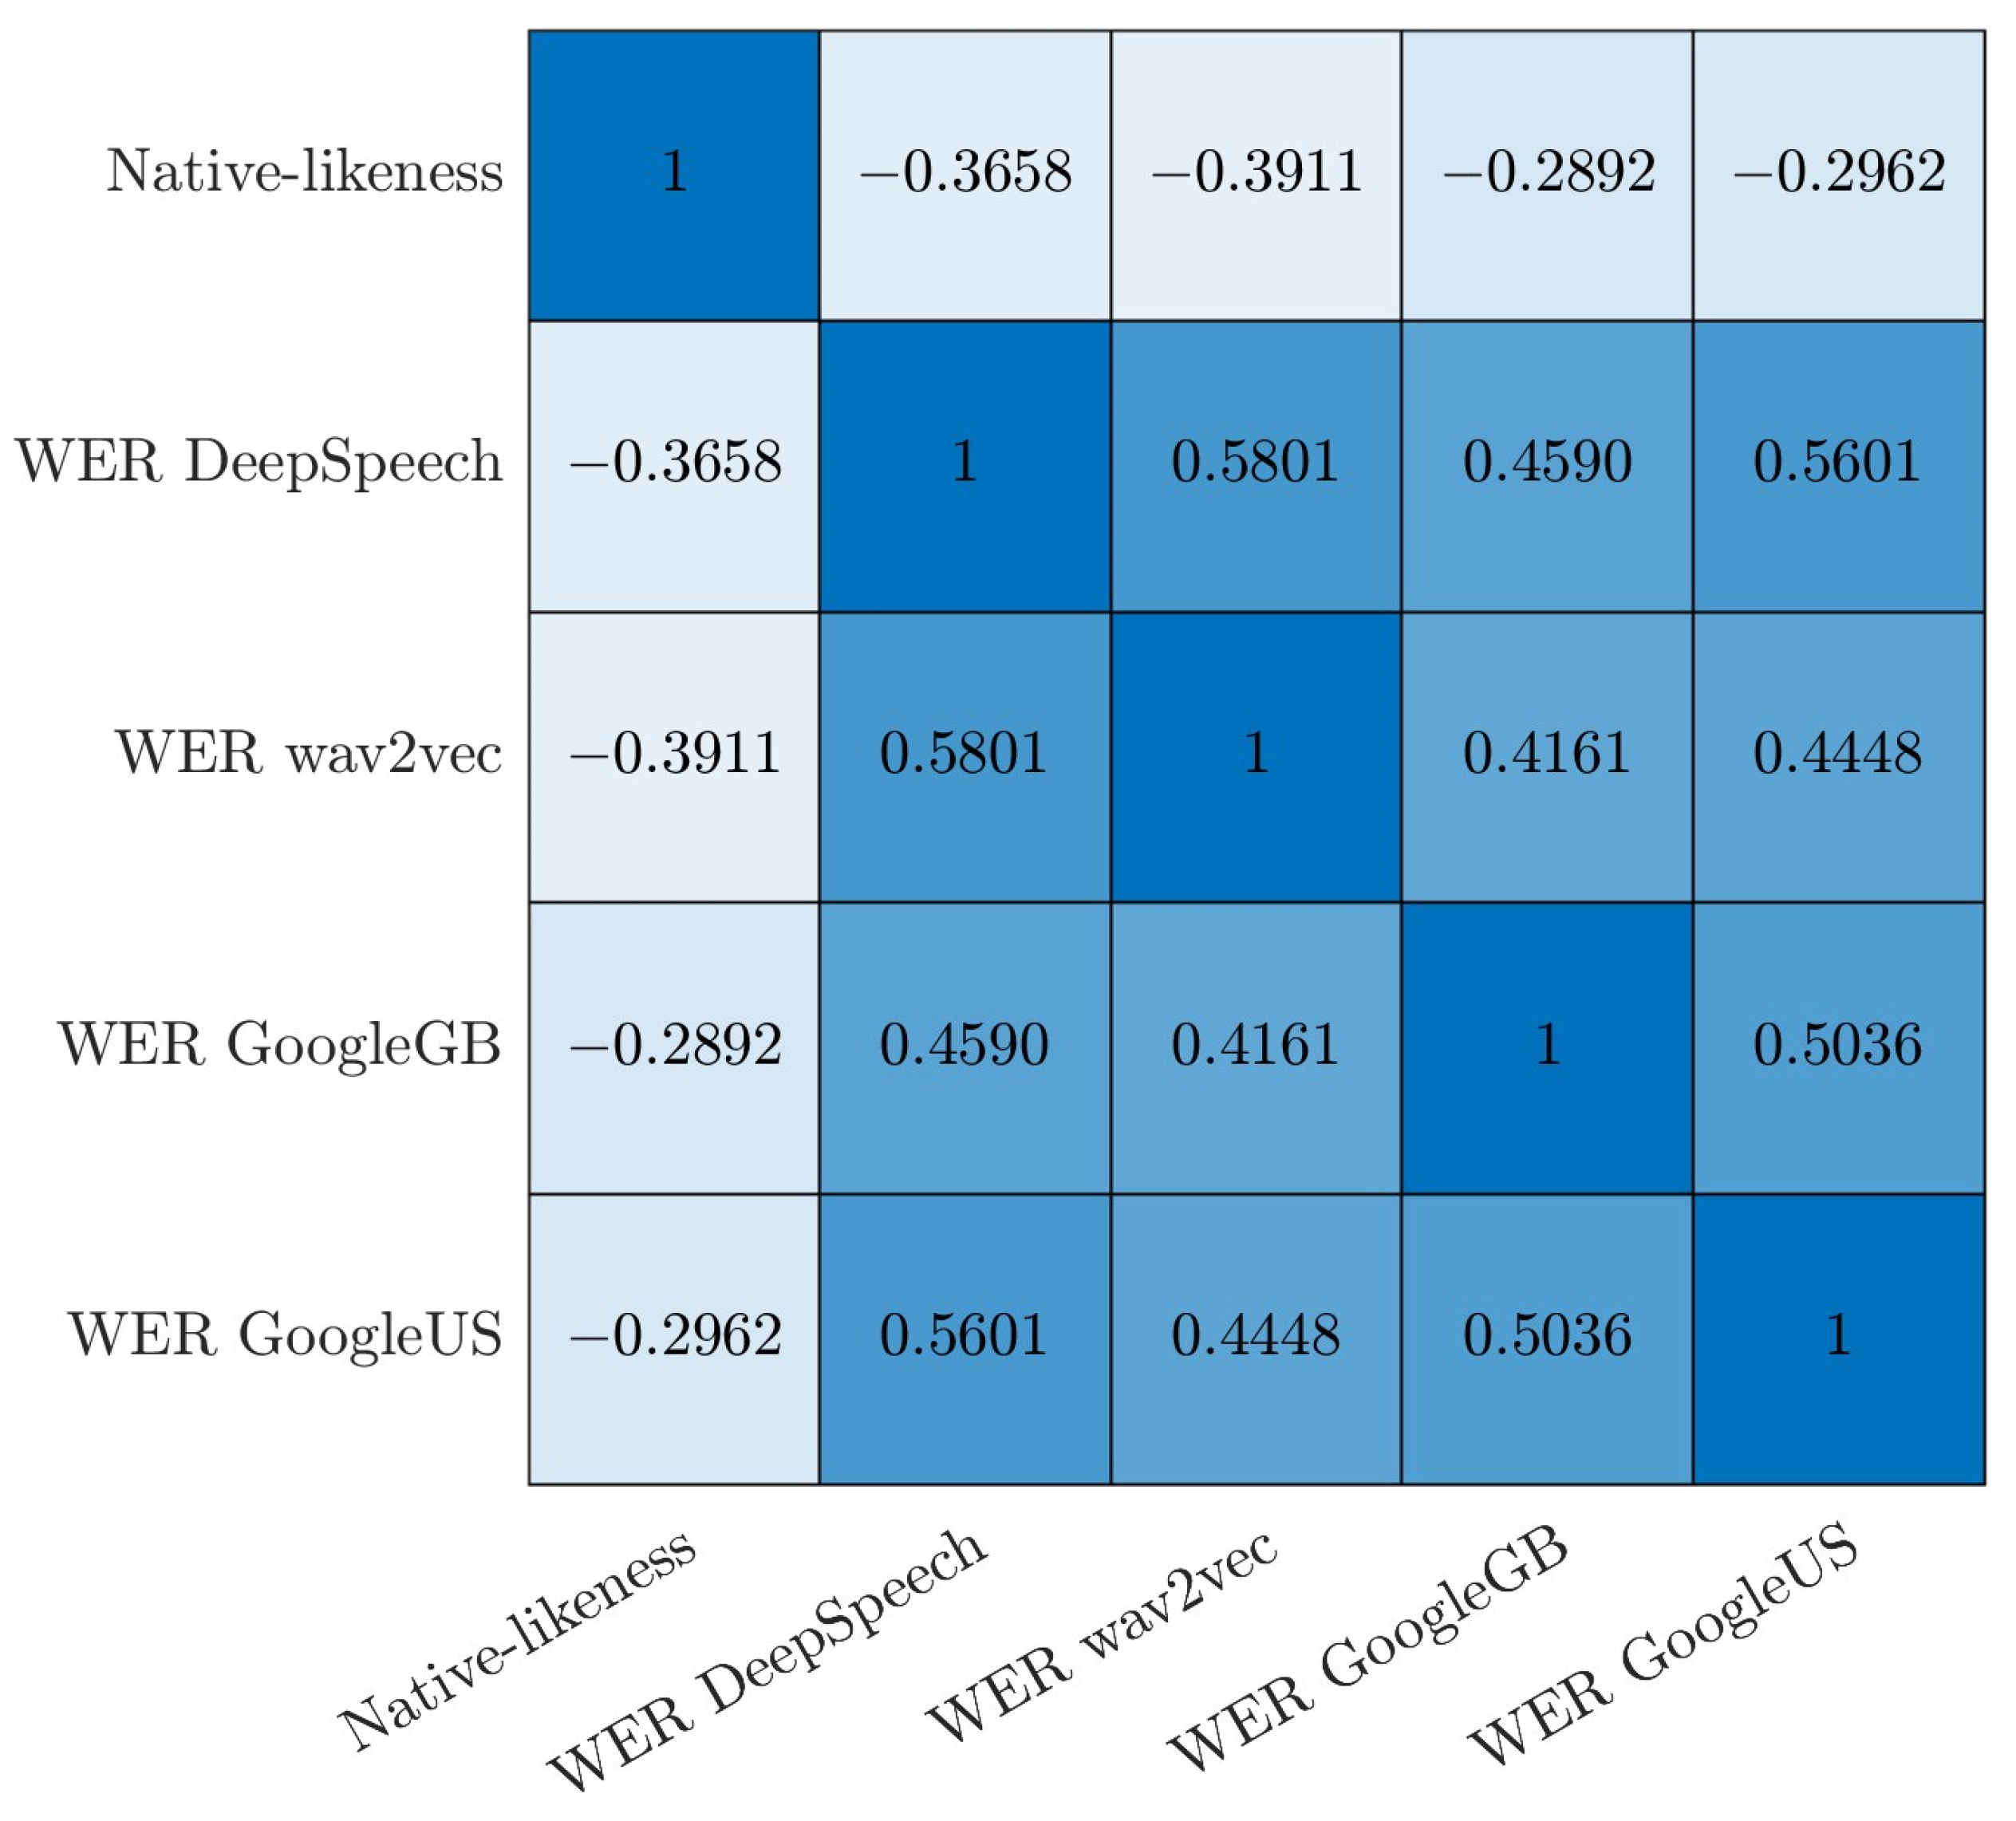
It was expected that mean error rates would correlate negatively with our native-likeness ratings. Mean word error rates were computed for each model (for sentence 8), yielding, in descending order, DeepSpeech: 0.52, GoogleUS: 0.36, GoogleGB: 0.33, and wav2vec: 0.28. While the latter three models exhibited comparable results, DeepSpeech showed particularly high error rates. We concluded that such high error rates—which are partly due to the fact that the model is not forced to output real words—could be informative as far as our students’ actual phonetic productions are concerned (see Section 3.2.2). As Figure 5 illustrates, our predictions were corroborated: WERs were negatively correlated with native-likeness (high WERs correspond to low native-likeness scores). Coefficients ranged from −0.29 to −0.37, and were all statistically significant. In addition to this, Figure 5 shows the correlation of WER between ASR models: all are positive and statistically significant, ranging from 0.42 to 0.58.
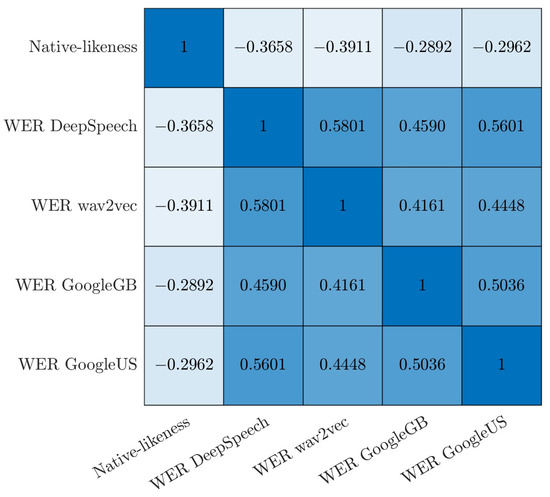
Figure 5.
Correlation matrix showing Pearson coefficients between WERs of ASR models for sentence 8 and perceptual native-likeness ratings.
In order to estimate the generalizability of the findings obtained with sentence 8, they were compared with those of the other 11 sentences. The mean word error rates were computed for each model for all 12 sentences, yielding, in descending order: DeepSpeech: 0.65, GoogleGB: 0.43, wav2vec: 0.41, and GoogleUS: 0.39. It therefore seems that WERs for sentence 8 were relatively small. And, indeed, a linear mixed model with WER as the dependent variable, the sentence as a fixed factor, and the model as a random factor shows a significant effect of the sentence (F(11,14721) = 224.97; p < 0.0001). Post hoc pairwise comparisons confirm that WERs for sentence 8 were significantly lower than those of the other sentences, except sentence 5, with which the difference failed to reach significance. The ICC measuring agreement between the 12 sentences in terms of WER yielded the following scores: DeepSpeech: ICC = 0.80 (F(306,3366) = 6.58, p < 0.001); wav2vec: ICC = 0.80 (F(306,3366) = 6.75, p < 0.001); GoogleGB: ICC = 0.76 (F(306,3366) = 5.35, p < 0.001; GoogleUS: ICC = 0.73 (F(306,3366) = 4.68, p < 0.001). The good agreement values suggest that overall, for each speaker, the WER of any of his/her sentences is consistent with the WER of any other sentence spoken by him/her.
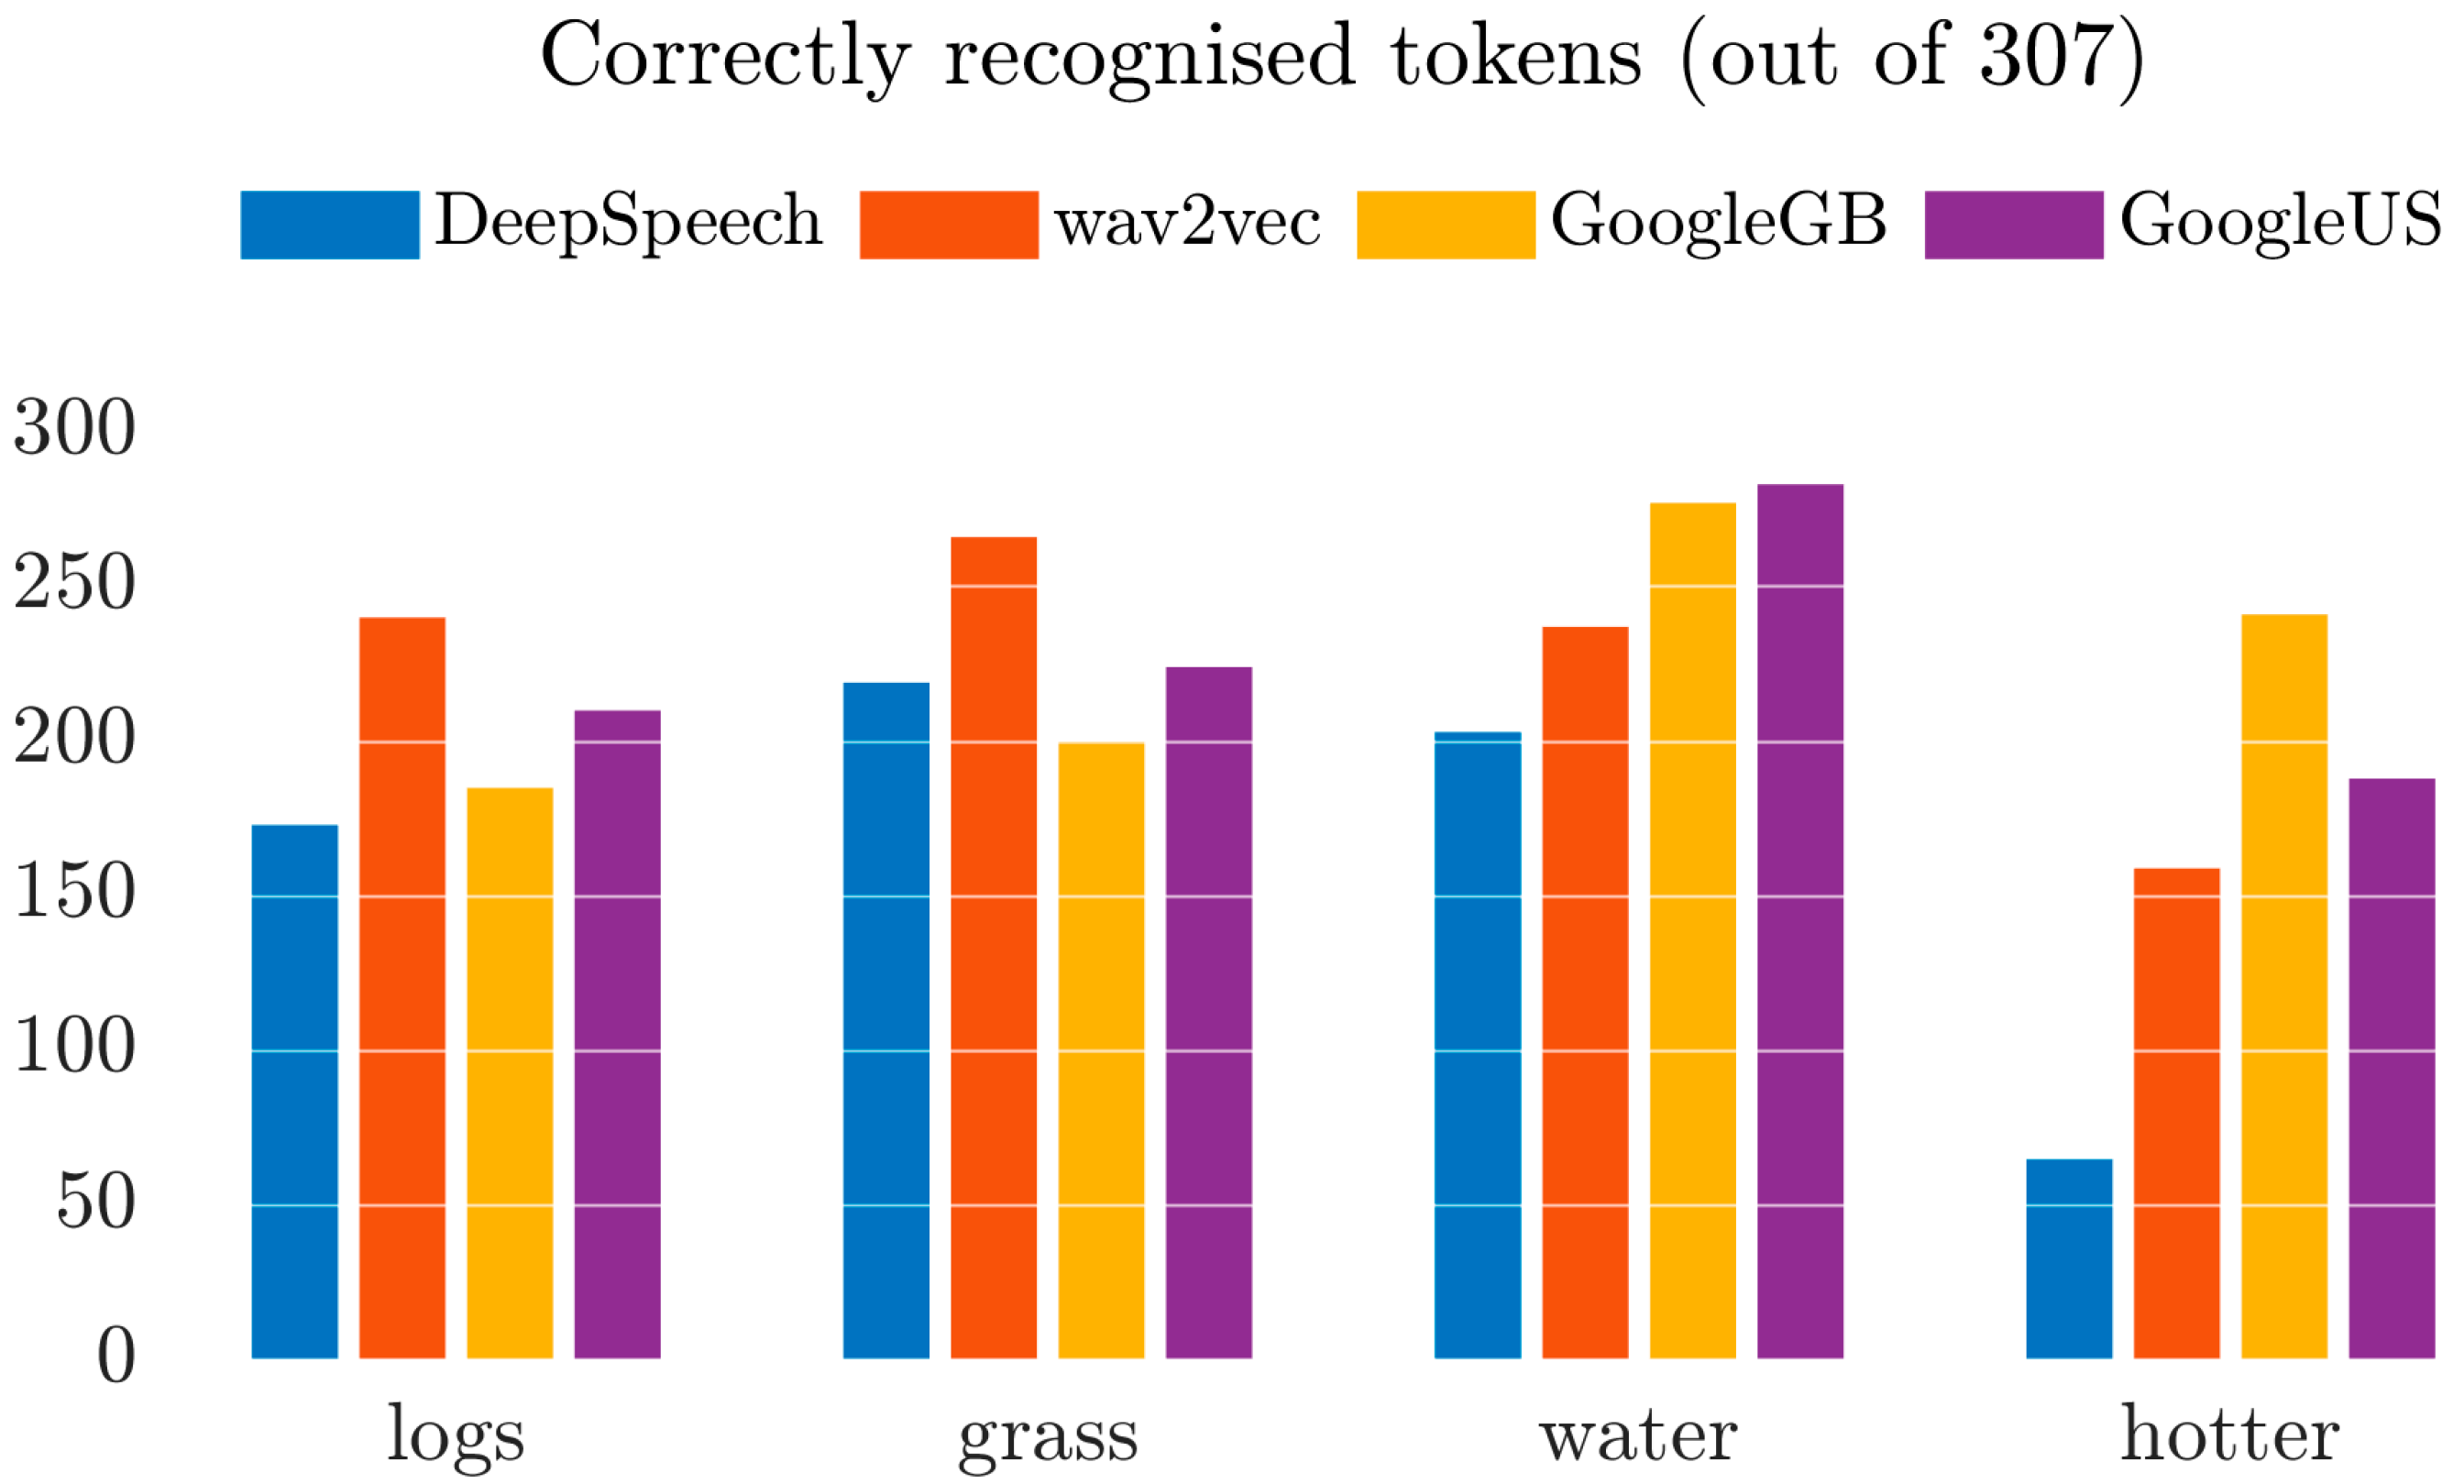
An exploratory analysis of the output of the four models for sentence 8 shows that the four words logs, grass, water, and hotter (representing the features lot, bath, T Voicing, and rhoticity) are unevenly recognized within features and across models, as shown in Figure 6, which provides a count of the number of times the four target words were recognised as such over the total number of students. Visually, hotter was rather poorly recognized, especially with DeepSpeech. The pattern also suggests that, depending on the specific word, different models performed better than others.
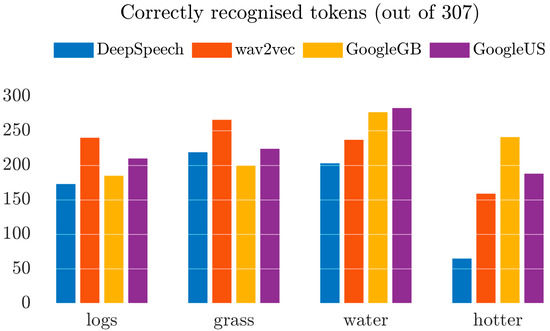
Figure 6.
Number of tokens among the four key words that were correctly identified by the ASR models for sentence 8.
3.2.2. ASR: Results by Feature
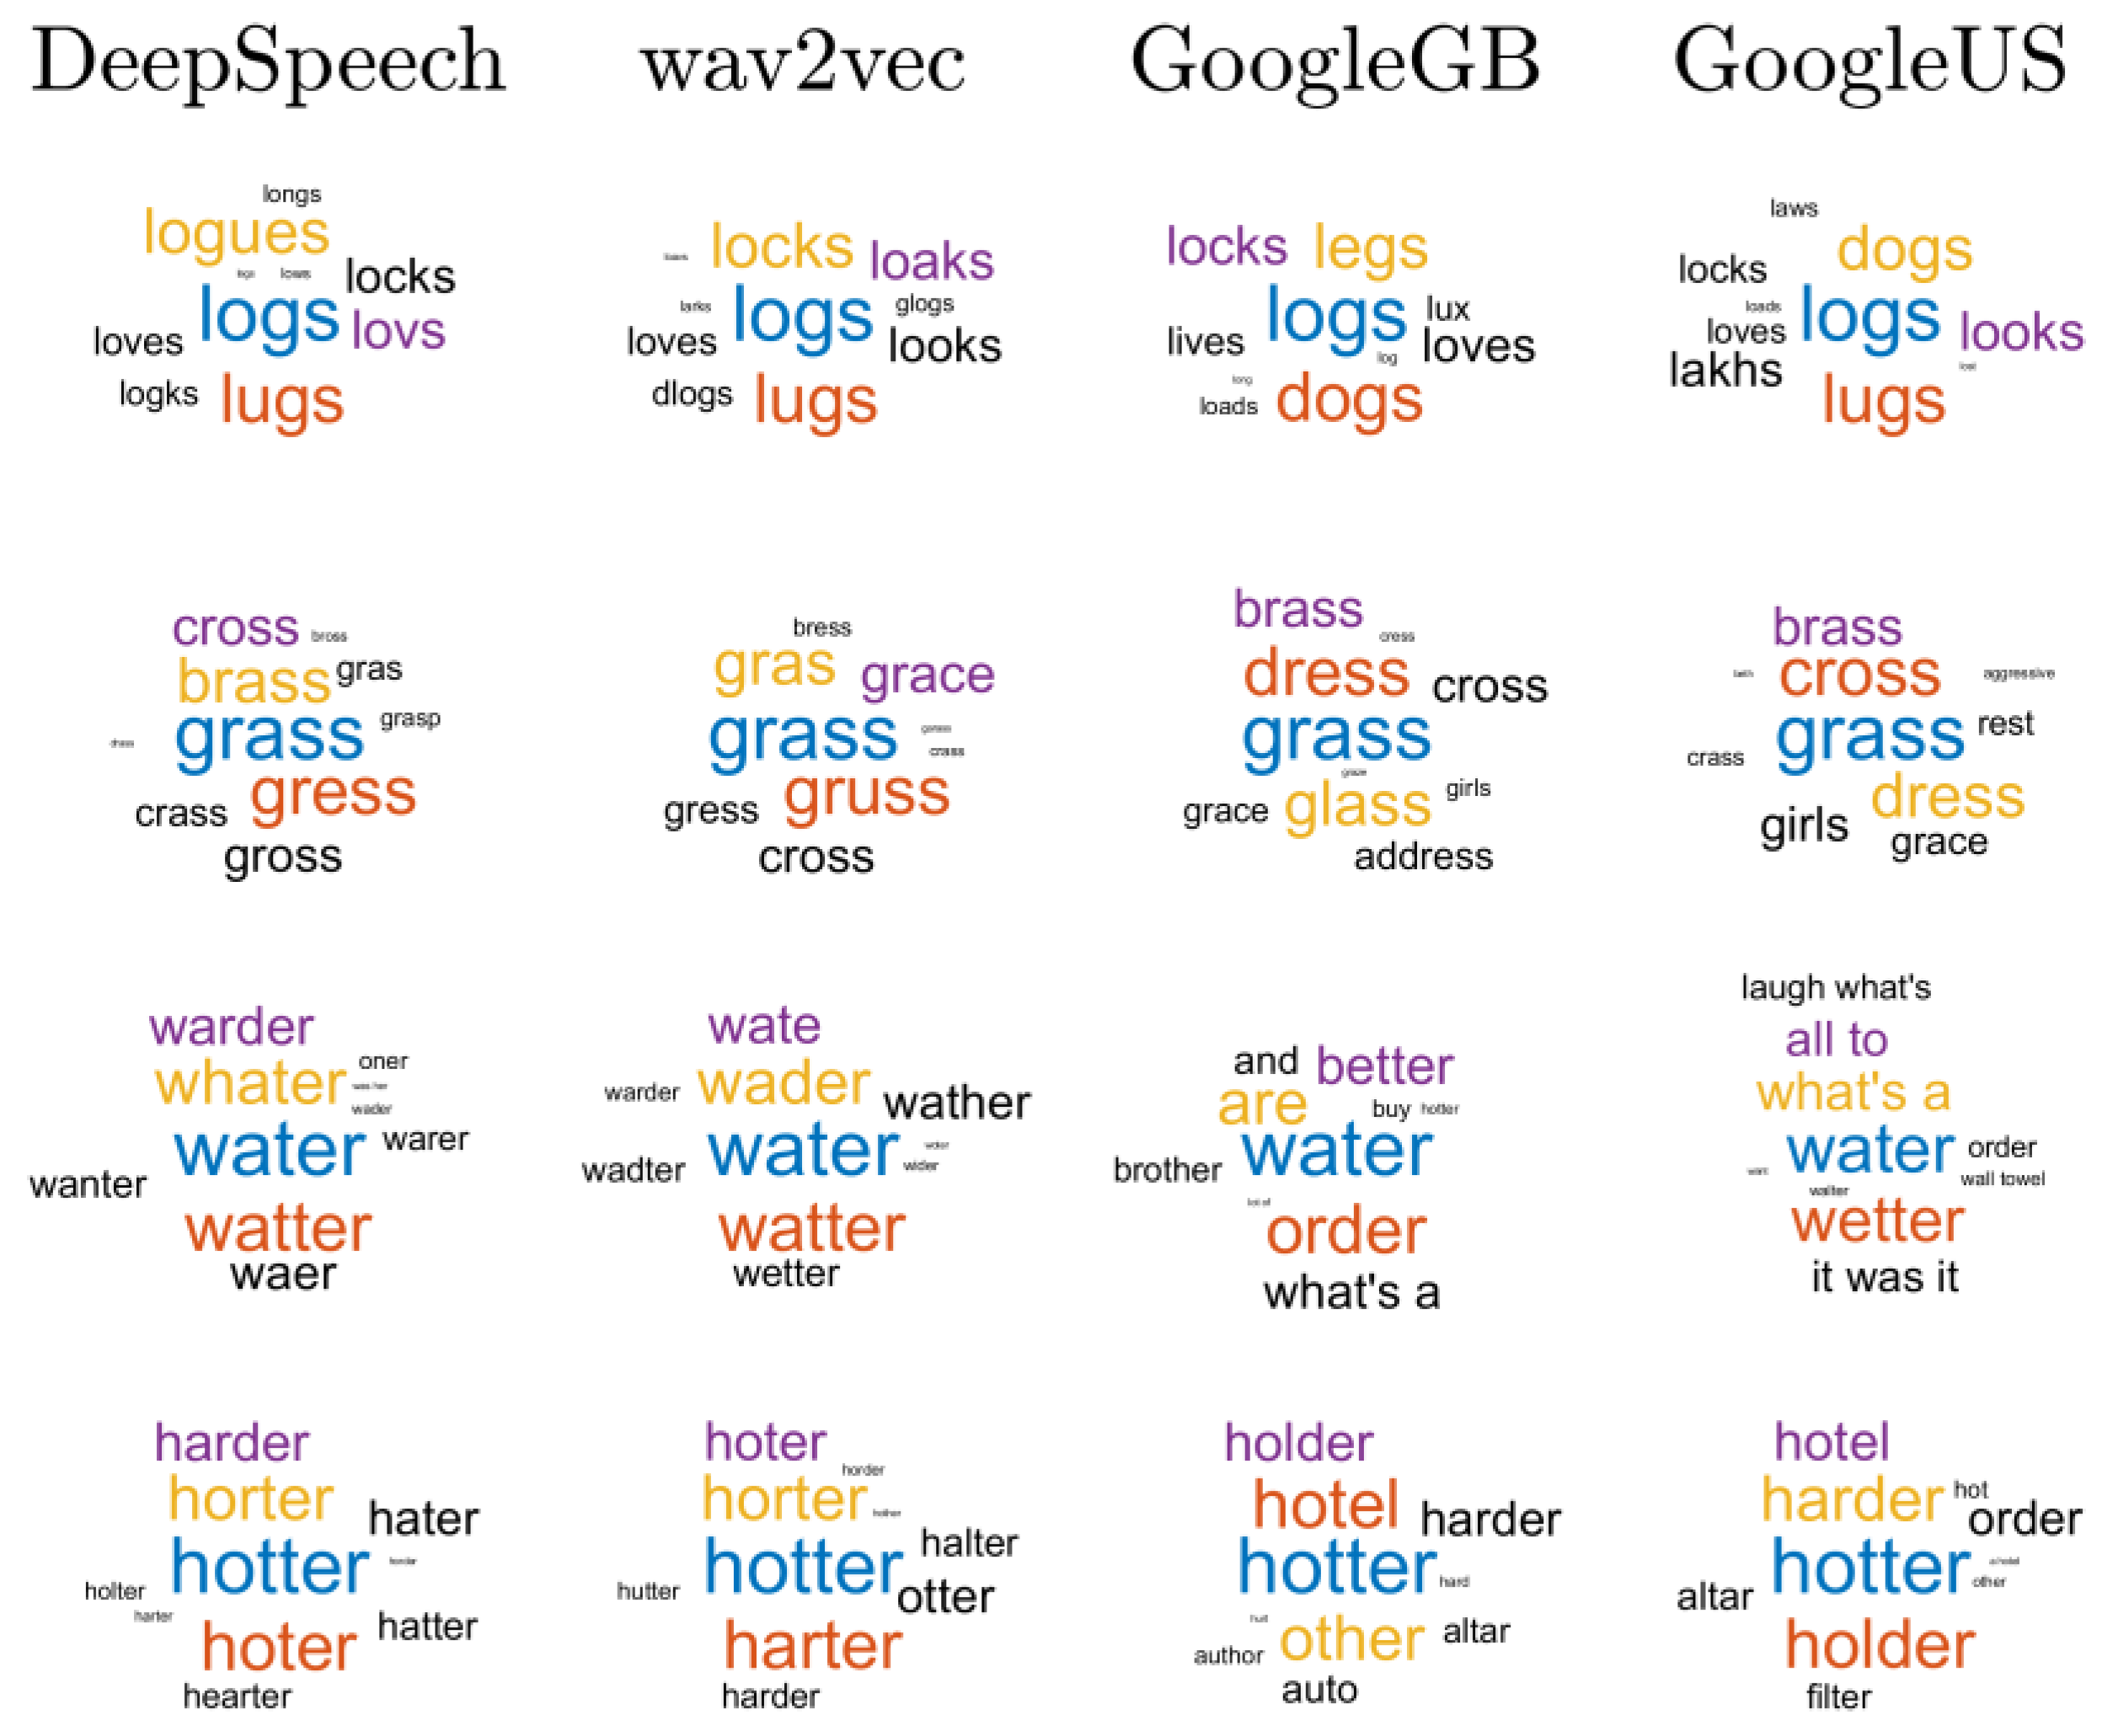
Each of the four phonetic features presents a considerable number of different results in the output of the ASR models. The number of different items varied from 18 for logs with wav2vec to 121 for hotter with DeepSpeech. We consider here the most common deviations from the target words or more isolated conspicuous deviations. Figure 7 shows word clouds of the ten most frequent words output by each model (columns) for each keyword of interest (rows). In all subfigures, the keyword under investigation appears in blue, and with the greatest font size, because it happens to be the most frequent output in every case. All remaining words are errors, and the first, second, and third most common errors appear in red, orange, and purple, respectively.
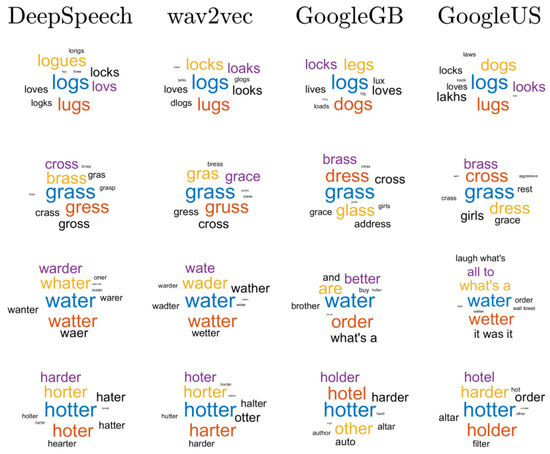
Figure 7.
Word clouds illustrating the output of ASR models for sentence 8. Each row is a keyword, each column, a model. Keywords are in blue. Most frequent errors are in red, orange, and purple. Font size normalised based on rank: keywords, most frequent error, second most frequent error (etc.) have the same size across plots whatever their raw frequency.
In what follows, we look more closely at incorrect outputs. For logs, the most common errors involve the <u> vowel (strut items), typically lugs, and the initial consonant (dogs) depending on the model (see Table 1).

Table 1.
Most common word identification errors in each model for the word logs and number of correct identifications.
Based on our experience, two possible interpretations for the production of lugs-like items rather than logs come to mind: (i) either the students have attempted a US version of the vowel and ended up producing a variant that was not peripheral enough (for instance [ɐ] rather than [ɑ]), or (ii) they produced a French [œ] vowel resulting from /ɔ/-fronting (Armstrong and Low 2008). An extra auditory analysis of DeepSpeech’s 29 lugs-like items was performed, yielding further evidence that they were caused by French [ɔ] or its fronted version [œ]. As for dogs, upon re-listening to the 40 GoogleGB items and the 9 GoogleUS items, we only perceived [l] and cannot, at this point, provide a plausible explanation for this mis-identification.
For grass, the most frequent errors of the two Google models (whose output must be real words) are dress and cross (see Table 2). The <e> vowel of dress rather than <a> of grass could reflect an overly close version of the American vowel (interpreted as [ɛ] rather than [æ]). The expected British vowels for grass ([a] and [ɑː]) are equally eligible for <a> in that context (Wells 1982), so that the target word is rather successfully recognised by the GB model (200 grass in GoogleGB). But this model also has the greatest number of dress items (40). Interestingly, all but one of them were rated −1 (GA accented) by the four judges, which means that most items that fail to be recognised as grass by the GB model have a vowel high enough for the model to classify it as an <e>.

Table 2.
Most common word identification errors in each model for the word grass, and number of correct identifications.
As for the grass tokens identified as cross, none of these productions really involves a traditional RP /ɑː/vowel. Keeping in mind that GoogleUS might have been trained with data from US varieties characterised by some degree of lot-fronting (e.g., Inland North or New York City, Labov et al. 2006), it does not seem unrealistic that a French-accented [a] in grass is not front enough to be identified as trap by GoogleUS, but is indeed back enough to be identified as lot. Therefore, presented with a French [a], GoogleUS will try to match a close enough lot word, and select cross.
For water, there is a profusion of under-represented forms denoting two categories for the /t/. The intervocalic consonant in incorrectly recognised productions of water, we assume, were mostly failed attempts at T Voicing, or had exaggerated friction noise upon release.
A first category emerges with a spelling suggesting that a voiced plosive or a sonorant was produced when attempting to pronounce a GA version of water [wɑɾɚ], with an alveolar tap. The models either have a <d> as in arder, warder, or wider; a nasal as in oner or warmer; an <r> as in worrer or wara; or an <l> as in woler—examples from DeepSpeech. Secondly, we find miscellaneous fricatives (e.g., rather, wadser, wancer, wather, wifeher, wover, or wosher), which could reflect an overly fricated release of the plosive /t/ expected in the RP pronunciation (Roach 2009). Our mean accent ratings support these interpretations: −0.37 (rather GA accented) for what we think DeepSpeech interpreted as “failed” attempts at T Voicing, and 0.7 (clearly RP accented) for the tokens with the spurious intervocalic fricatives.
For hotter, both models constrained to output real English words (i.e., GoogleGB and GoogleUS) struggle to interpret the target words (see Table 3). GoogleUS, for example, has hotel 17 times, but also hot tub and all day. The final unstressed position and intervocalic /t/ might have caused conflicting issues: an overly reduced final syllable yields monosyllabic words in the output (e.g., hard, hot, hole, hat); whereas the (potentially over fricated) plosive /t/ entails sequences of two words (e.g., all day, help there, hold sir, hot tub, or two, out of, with her). Still, in disyllabic items, the presence vs. absence of <r> in the orthographic transcriptions is consistent with our accent ratings: items with final <r> have been rated as rather GA (−0.33 in GoogleGB and −0.39 in GoogleUS), and items without a final <r> as rather RP (0.37 and 0.62, respectively). But GoogleUS has twice as many items without <r> as GoogleGB, and the ratings for those items almost double from one model to the next, suggesting that the absence of realised coda /r/ is more delicate to handle for GoogleUS than for GoogleGB, and that when our students aim at a GA pronunciation (production of coda <r>), both models succeed rather well in transcribing the right word.

Table 3.
Most common word identification errors in each model for the word hotter.
3.2.3. ASR: Results by Accent
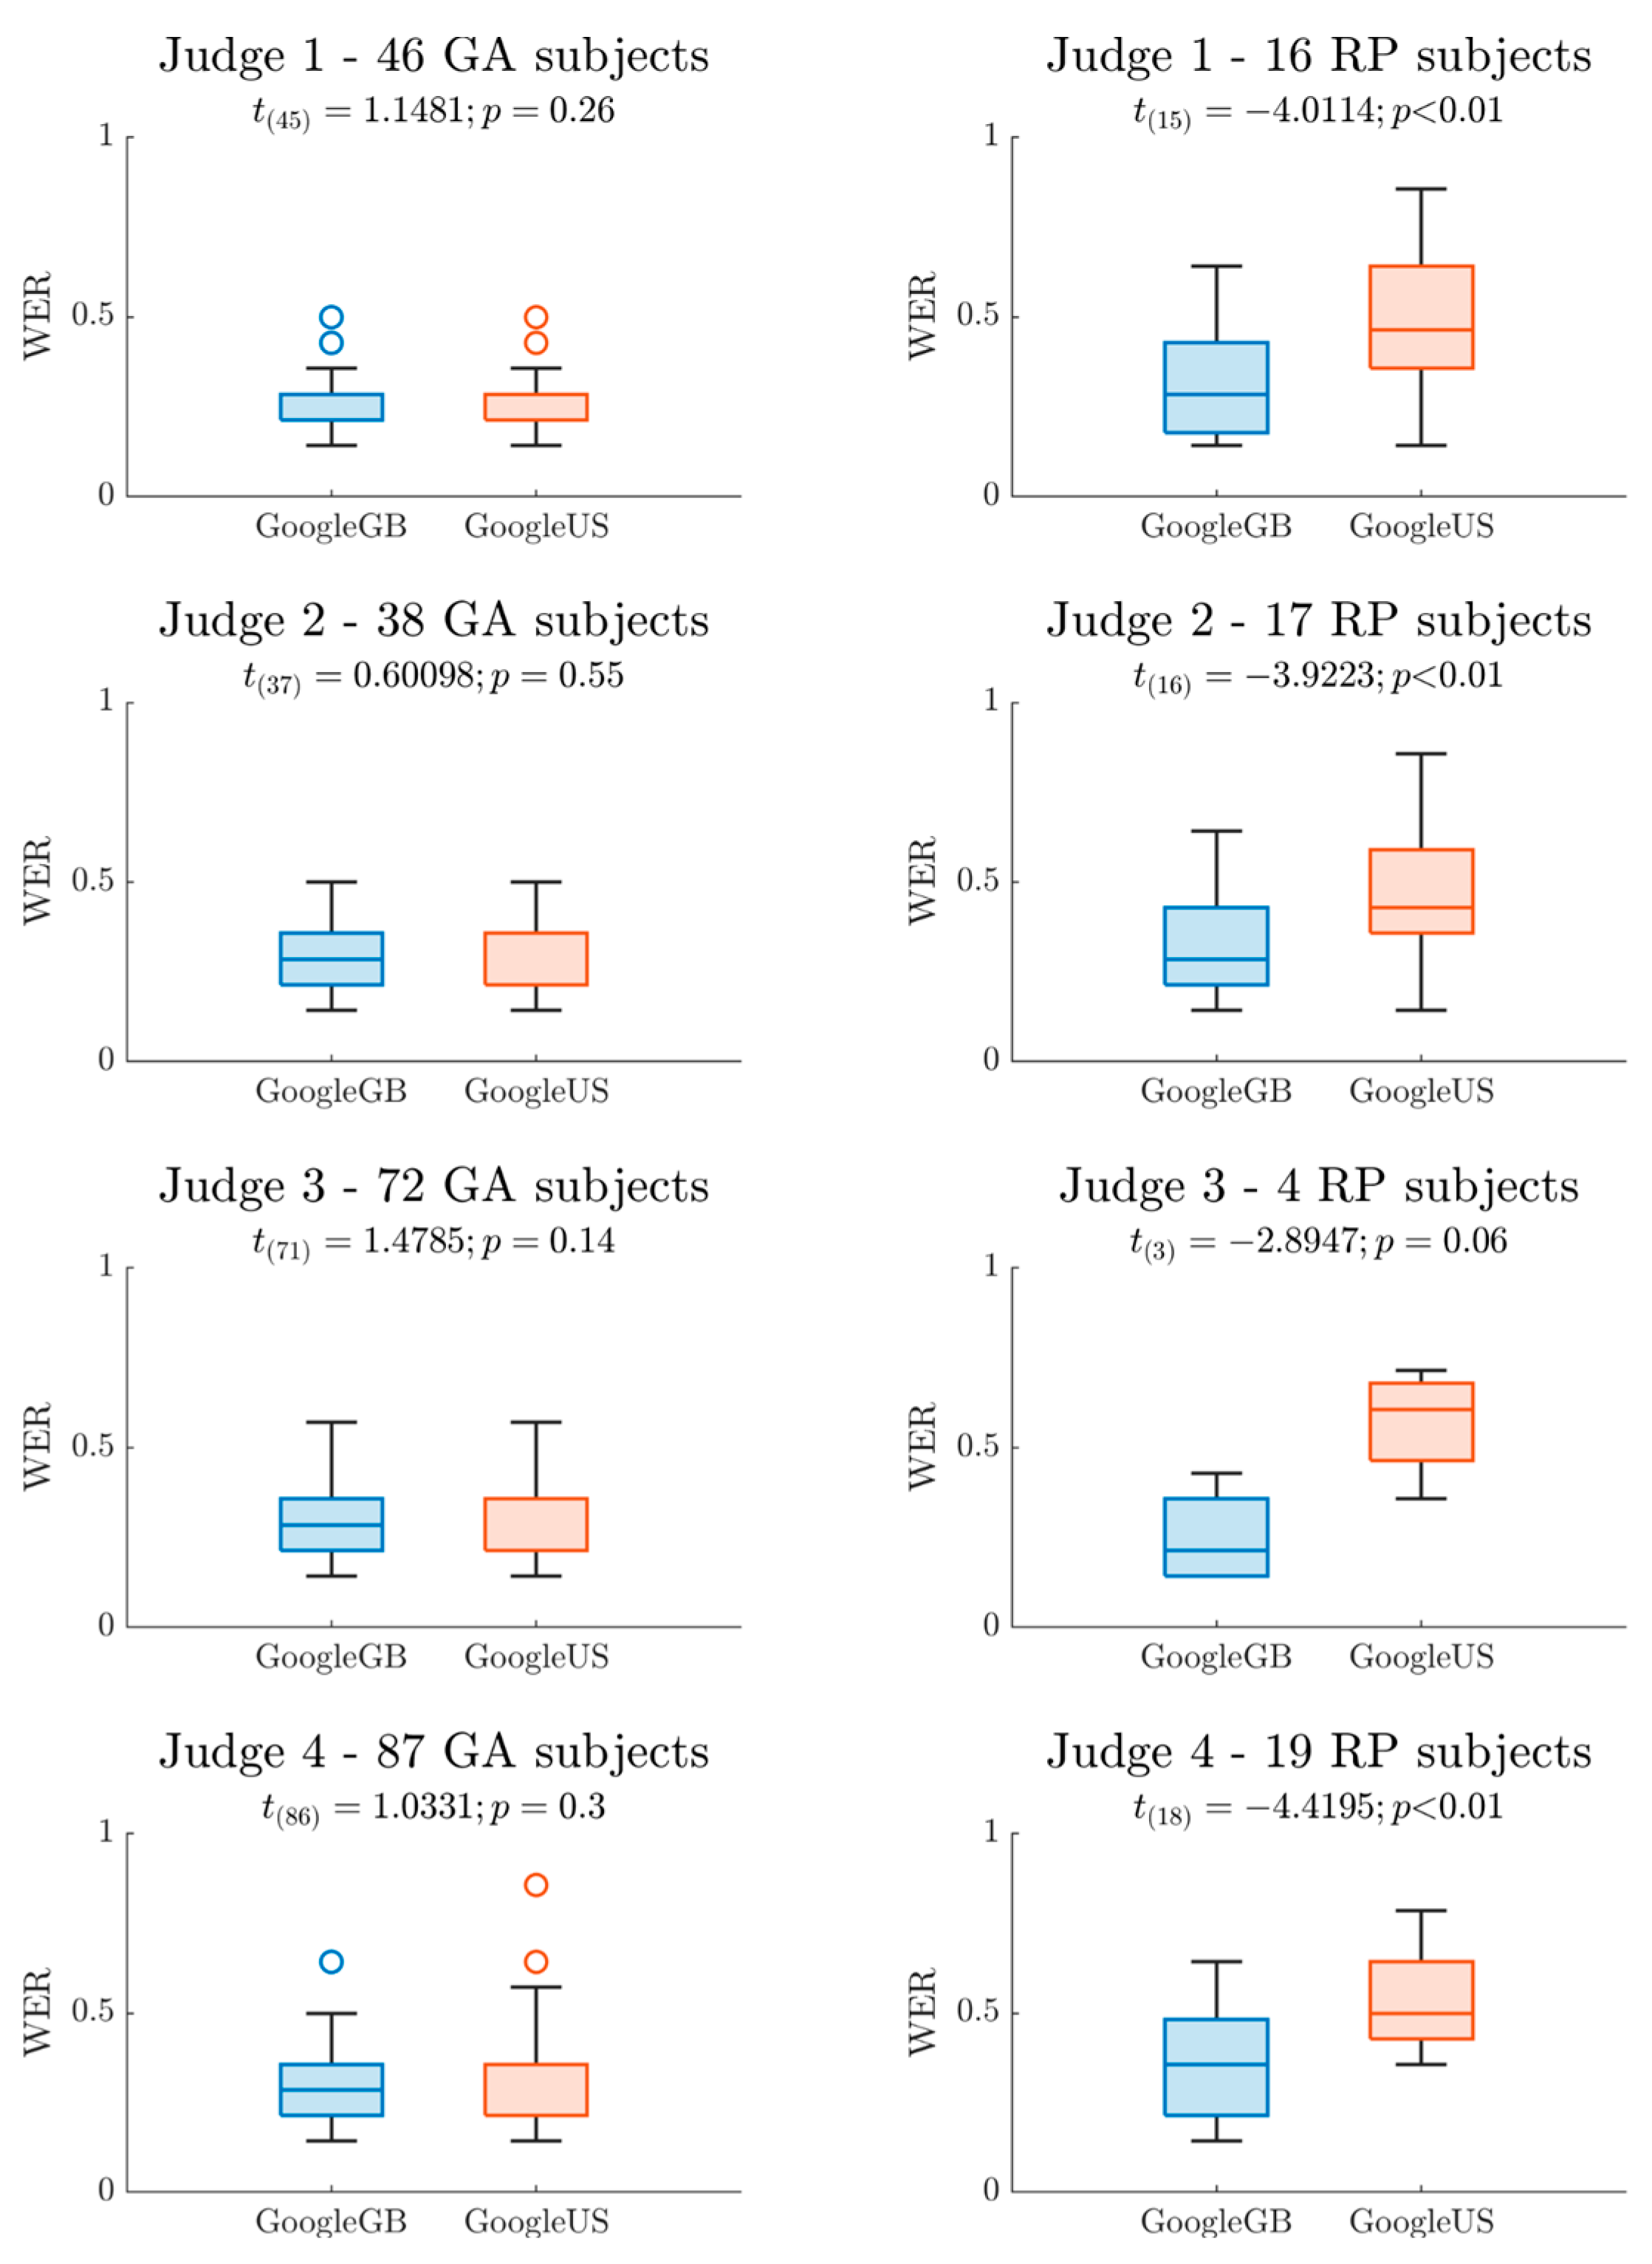
Assuming our auditory ratings of sentence 8 are accurate and GoogleUS or GoogleGB achieve comparable performance when tested on the accent it “specialises” in, we can expect that students with an American accent will achieve a better performance (i.e., lower WER) when their speech is submitted to GoogleUS (and vice versa). We created two groups: a GA group comprising speakers whose mean accent score was ≤ −0.75, and an RP group containing speakers with mean accent scores ≥ 0.75 (−1: maximally GA; 1: maximally RP). There were 61 GA and 11 RP students. A paired t-test was run on the GA group to compare the WERs obtained with GoogleUS and GoogleGB; the result failed to reach statistical significance (t(60) = 0.45, p = 0.66). The same comparison computed with the RP group showed a significant difference (t(10) = −3.19, p = 0.0096) going in the expected direction: WERs were smaller (by 0.2 on average) when GoogleGB was used. This asymmetric pattern seems to hold at the level of individual judges; Figure 8 shows for each judge the WERs of the output of GoogleGB and GoogleUS when sentence 8 from participants identified as mainly GA—left column—or mainly RP—right column—was submitted to ASR.
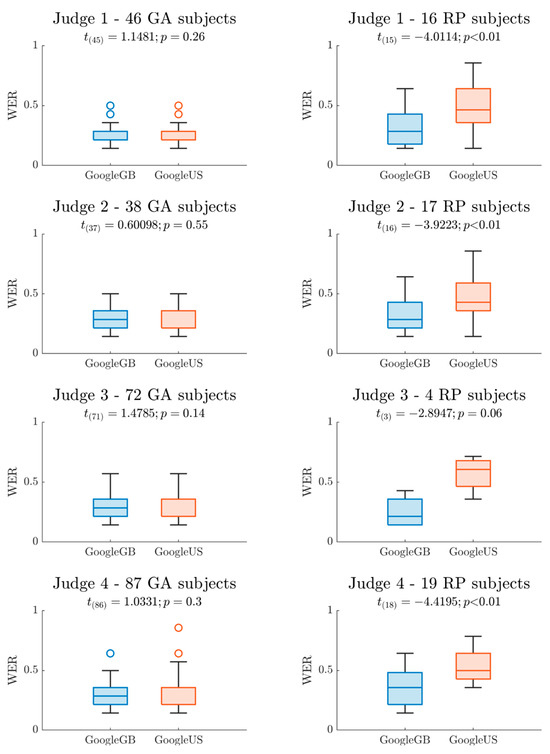
Figure 8.
Word error rates of sentence 8 for GoogleGB (blue) and GoogleUS (red) for the speakers that judges (rows) classified as GA (first column) or RP (second column).
In Figure 8, we can observe a better performance (i.e., lower WER) of GoogleGB on both RP and GA accents, and a worse performance of GoogleUS on more British-sounding data, which can be viewed as an extension of what we observe concerning the ability of each model to handle non-rhotic data. We had a closer look at the 12 sentences of the 11 RP speakers (mean accent score ≥ 0.75) in order to confirm the inferior performances of GoogleUS. Results, summarised in Table 4, show the same tendency, whereby GoogleGB outperforms GoogleUS.

Table 4.
Summary of the output of GoogleGB and GoogleUS on the 12 sentences of the 11 participants who were rated as very RP on sentence 8 (mean accent score ≥ 0.75).
A similar case to grass would be expected in staff (sentence 11); however, this time, the GoogleUS model fails to identify a French-accented [a] as a back vowel (the way it did for cross) in the absence of any similar lot word (e.g., *stoff). The French [a] in this instance is not front enough either to be recognized as [æ], which explains why GoogleUS retrieves three stuff and six tough. Note that, while GoogleUS, which outputs real words, was unable to come up with strut proposals for grass, wav2vec, which works in a more strictly graphophonemic way, produced gruss, as can be seen in Figure 7.
Our results for sentence 8 show that GoogleUS retrieves faulty sequences in order to reconstruct a sequence with a plosive /t/. Further evidence of that can be seen in sentence 12, where daughter is fully recognised by GoogleGB (11/11), and only 5 times in GoogleUS; the others have an intervocalic plosive or fricative, and are as far from the target word as Delta, adults, doctors, deuce, or doses. The same phenomenon occurs for thirty (sentence 8), which GoogleUS transcribes as their two, the two, such a or turkey.
3.3. Automatic Accent Identification
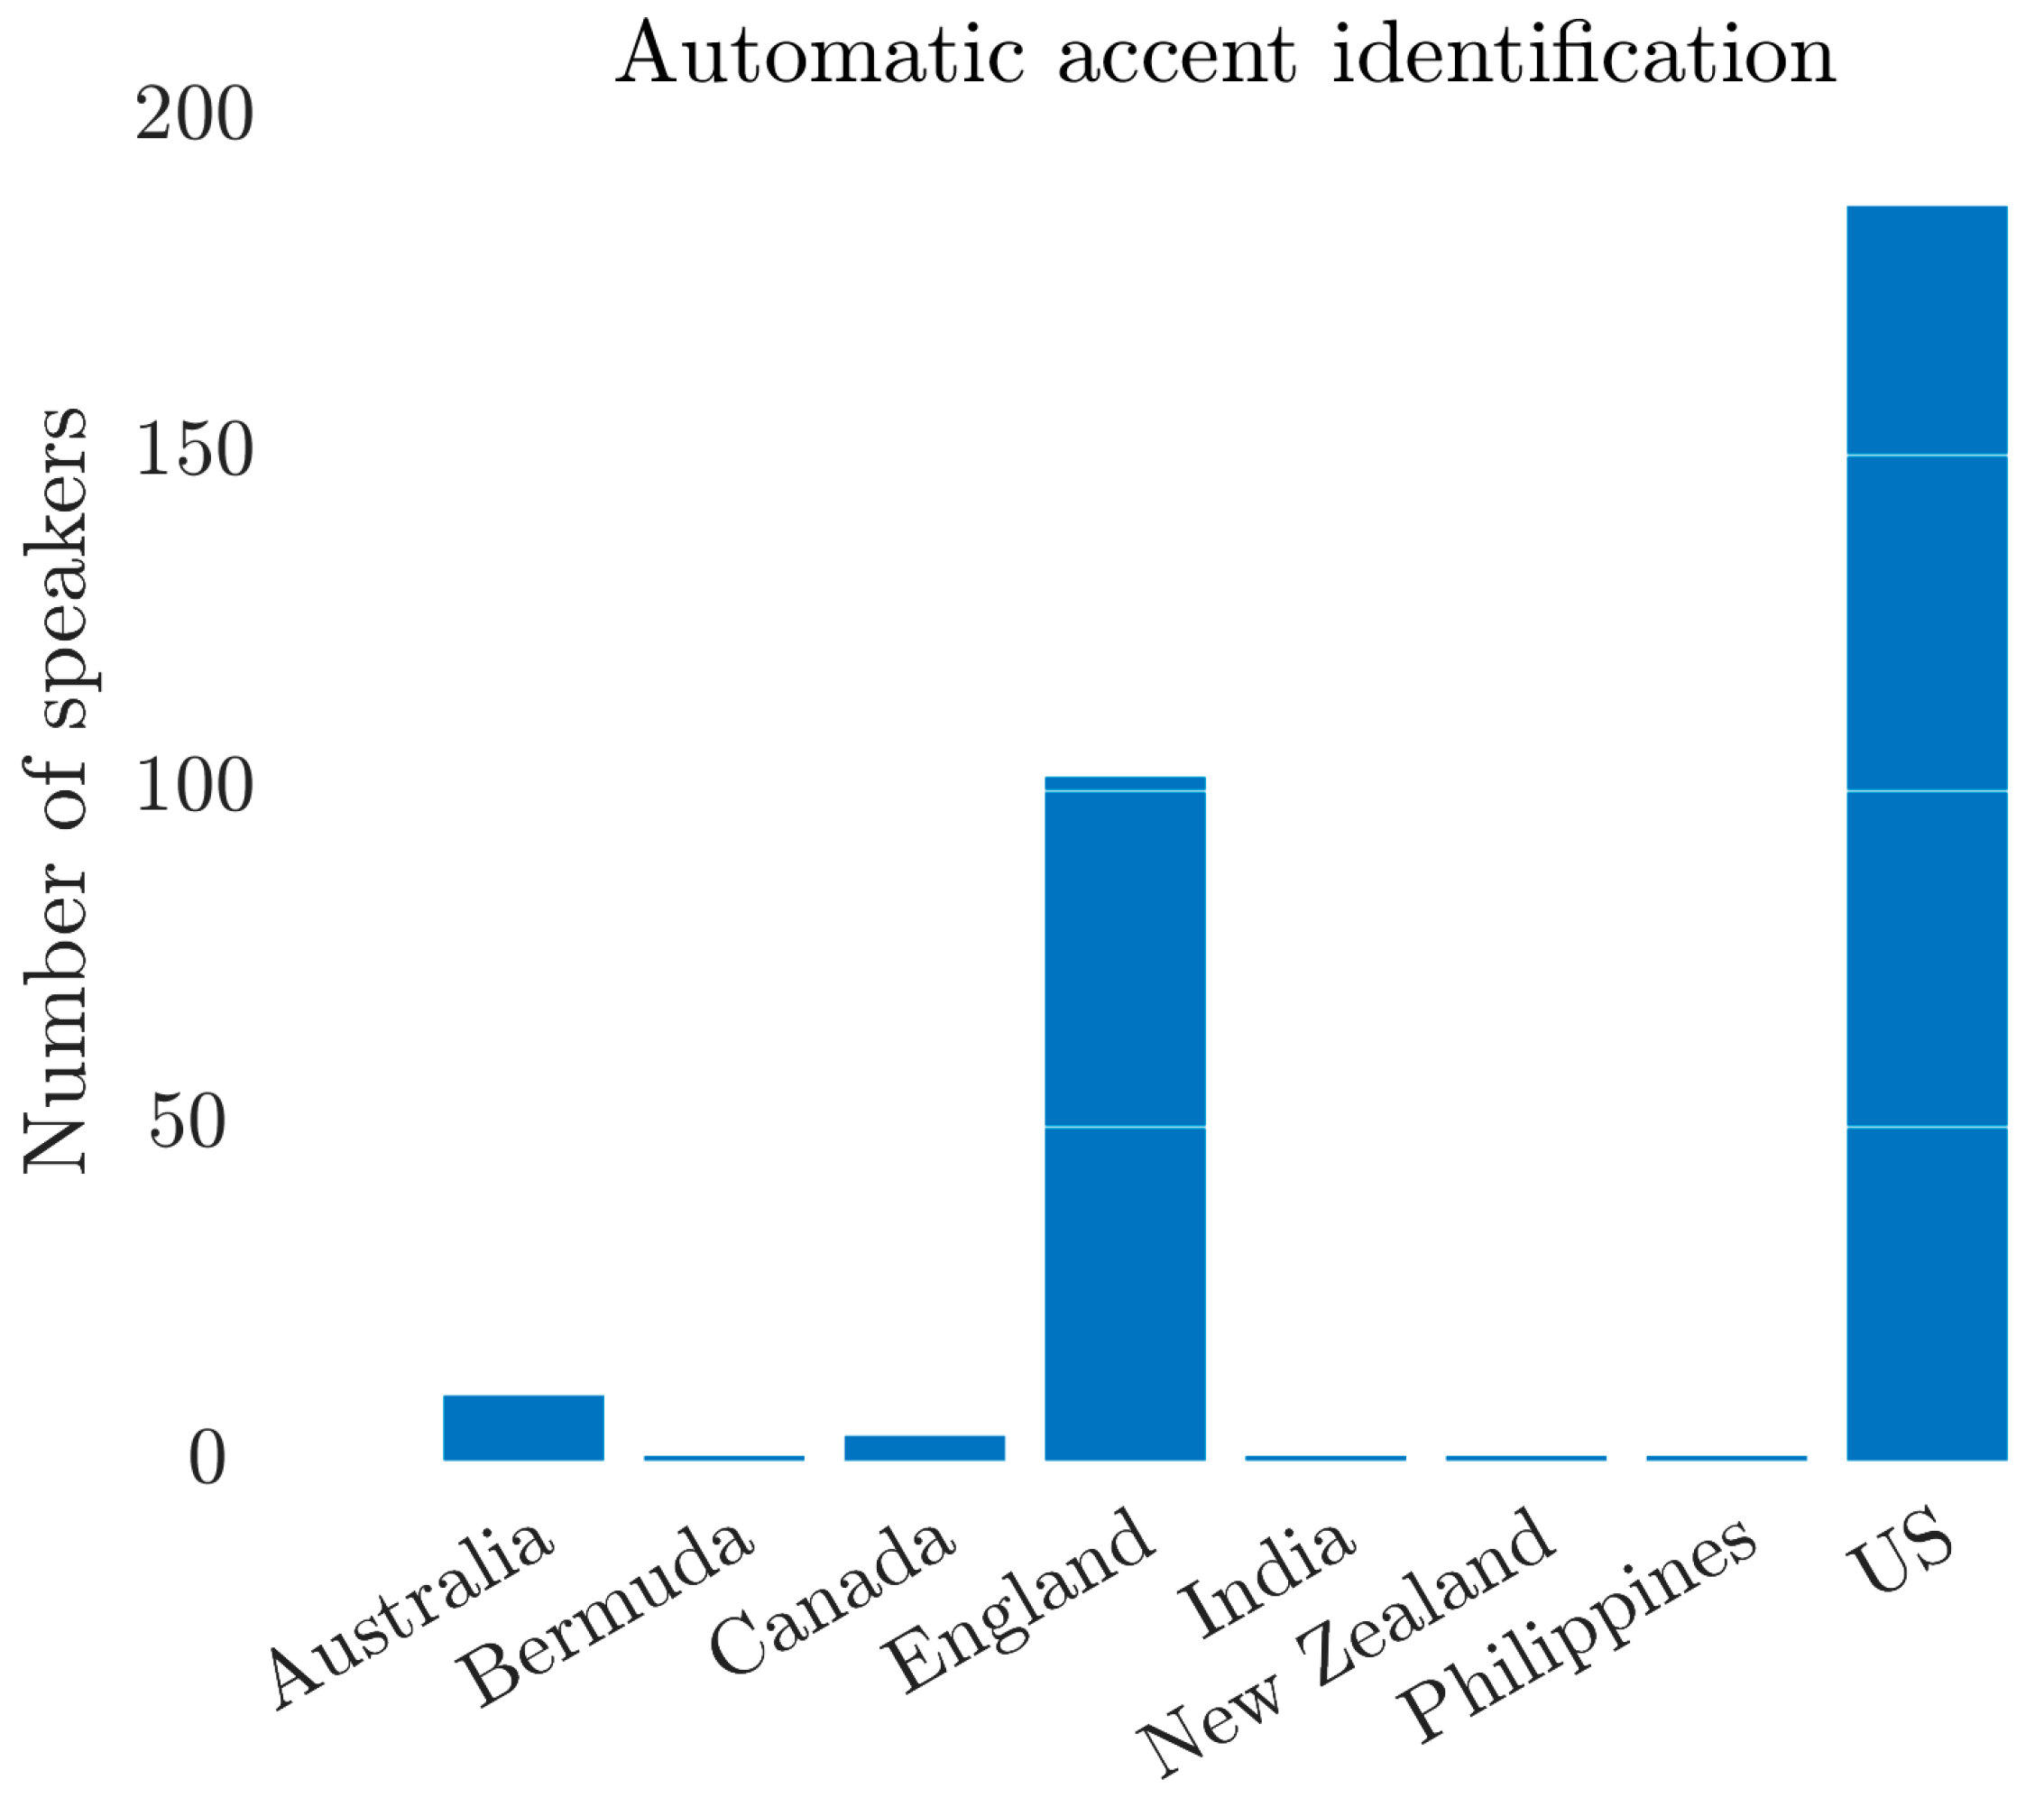
The output of AID is summarised in Figure 9. It shows that over 94% (289/307) of the recordings were classified as either “England” (102) or “US” (187).
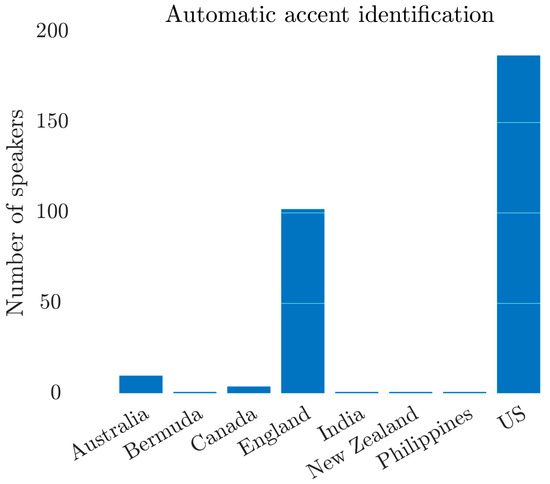
Figure 9.
Automatic accent classification based on 16 accent classes.
In order to estimate the agreement between our auditory assessment and the output of AID, we performed two analyses. For both analyses, speakers for whom the model had output a label other than “England” or “US” were discarded. In the first analysis, the remaining 289 speakers whose mean accent score was below 0 were labelled as “US” (174); those whose mean accent score was above 0 received the “England” label (101), and those with a 0 (14) were removed. In the second analysis, more extreme accent scores were required for accent membership: “England” (11) required 0.75 or above, and “US”, −0.75 or below (among the original 61 participants with a score of −0.75 or below, 4 were not identified as either “England” or “US” by AID, leaving us with 57 “US” speakers). For the first analysis, the percentage of matching labels between perceived and automatic accent identification was 74.18%. In the second analysis, the percentage of agreement reached 94.18%. Keeping only the matches (between perceived and automatic) from the first analysis left us with 62 students classified as RP/England, and 142 students classified as US/GA. In other words, our mean accent scores agree with AID for two thirds of our students (204/307), and among perfect matches, more than two thirds (142/204) are classified as US/GA, and a little less than one third (62/204) as RP/England.
4. Discussion
Our aim was to assess the accents of 307 French learners of English studying in an English department at university using two types of methods: auditory ratings and technologies such as automatic speech recognition and automatic accent identification. We focused on where students’ accents stood on the continuum between British English (which we called RP) and American English (GA). We examined the consistency between the two types of methods, as well as the rate of agreement within each methodology.
We were quite surprised overall to discover that although we are all experienced teachers of English pronunciation working within a unified framework, the initial discussions we had before carrying out the task needed amending while the task was actually being performed. In particular, it soon became obvious that the zeros (question mark responses) actually represented distinct phenomena: phonological errors (e.g., hotter pronounced with the goat vowel), instances where the listener was unable to decide whether the RP or GA variant had been produced, and cases where the production sounded French. Our ratings of the four phonological features in sentence 8 were rather consistent between judges, as confirmed by the high pairwise inter-rater agreement scores. However, when agreement was computed separately for each feature, substantial variation emerged. While, e.g., T Voicing perception was very consistent across judges, the ratings for the lot vowel were particularly non-consensual (note that Roberts (2020) also had trouble with lot with Flemish learners). A possible explanation here is that with the expected transferred vowel from French being much closer to the RP realisation, we focused on the detection of the American variant (with its extra duration and more open and unrounded quality). The salience of the American variant led some of us to regard comparatively smaller departures from the RP target as good-enough RP candidates, while other judges kept listening to fine-grained quality differences. Acoustic analyses constitute a logical follow-up study here.
In addition to these potentially diverging strategies, one important limitation is that some features may have been more difficult to assess in sentence 8. For example, rhoticity was probably harder to detect because of the sentence-final position of hotter. A necessary follow-up will therefore be (i) to redo the auditory assessment after splitting the question mark responses into sub-categories, e.g., a French flag button in the interface, and (ii) to extend the auditory analysis to the other sentences in order to listen to diagnostic features in a variety of prosodic positions.
Speaking of rhoticity, one may wonder whether spelling had an influence on speakers’ productions of coda /r/ in hotter. If this were the case, we would expect many written /r/s to be pronounced, even in students who supposedly have British accents. To test this hypothesis, we took all the students who were unanimously judged to have British realisations of lot and T Voicing (we discarded bath because only two students in the whole dataset had the British variant according to the four judges), and we considered their pronunciation of /r/. Out of the 68 students, only 4 were unanimously rated as having a rhotic pronunciation. This suggests that only 5% of the students who were otherwise consistently RP were influenced by the <r> in the spelling at the end of hotter. One might have expected a stronger influence of the orthographic <r> on a student’s ability to maintain non-rhoticity.
Our perceptual positioning of students on the RP–GA continuum based on mean accent scores led us to classify approximately 60% of them on the GA side, and about 35% on the RP side, while the remaining 5% displayed RP and GA features to the same extent. Only about 7% of the whole cohort exhibited accents that were totally consistent; most speakers actually mixed RP and GA features to varying degrees. This is consistent with previous studies where learners’ productions were analysed (Rindal 2010; Roberts 2020; Yibokou et al. 2019).
Native-likeness ratings showed differences in absolute values between judges, but they were nonetheless correlated. Surprisingly, the ratings were higher for the students we had classified as GA. Whether our students who target a GA accent happen to achieve higher pronunciation accuracy has yet to be investigated. Is it the case that GA is easier than RP for French learners? We can rule out a form of “other accent effect”, whereby the three of us who speak with a British accent would overestimate GA students’ native-likeness: the fourth judge, who speaks with an American accent, follows the same pattern.
Native-likeness ratings were also negatively correlated with word error rates computed on ASR outputs, which lends support to the use of ASR models for the assessment of native-likeness in the context of EFL. The output of the four ASR models showed high pedagogical potential. Using them in parallel is informative because each of them has learned different kinds of generalisations, and their output is not always constrained to real words. In addition, the availability of different varieties (GoogleGB vs. GoogleUS) makes it possible to explore learners’ accents. The models can easily be used to automatically draw attention to specific production errors or slight inconsistencies in learners’ recordings. For instance, the common problem faced by French learners of English in pronouncing [ɔː]–[ɑː]–[ʌ], along with their lack of success in fully grasping the phonetic distinctions between the two target varieties (General American vs. Received Pronunciation), was evident in the results. In the logs output (our lot-vowel keyword), instances of ɔ-fronting were especially prominent. While this is usually inconsequential in French, in that misunderstandings caused by ɔ-fronting have been reported only anecdotally (Malderez 2000 and Fónagy 1989, cited in Armstrong and Low 2008), it becomes problematic in English and triggers errors in ASR outputs, such as lugs instead of logs, and also stuff instead of staff and gruss instead of grass (wav2vec’s most common error). In the grass output (our bath word), another conspicuous French-learner pronunciation issue was the excessive opening of the vowel for a GA accent, or an insufficient backing of the vowel for an RP accent. Our T Voicing word, water, exhibited repeated inaccurate pronunciations of intervocalic /t/(either failed GA T Voicing or overly aspirated RP plosive). And finally, hotter (sentence 8′s rhoticity keyword) showed that the absence or presence of <r> in the ASR models’ outputs was consistent with our ratings. A useful potential development would be to automatize the interpretation of these outputs.
One interesting aspect is that we took advantage of a feature of ASR systems that is generally, and for good reason, seen as undesirable: accent bias. Studies have shown that foreign-accented English (DiChristofano et al. 2022) or regional varieties (Markl 2022; Tatman 2017) yield higher error rates. Our use of such technologies to estimate students’ phonetic compliance with our targeted varieties of English relies on the fact that standard, inner circle (Kachru 1985) native varieties are overrepresented in the training data. With the aim of ASR services being, supposedly, equal access for everyone, one may venture to hope that, with time, more inclusive ASR models will be able to recognise speech from multiple non-native or regional/social stigmatised native varieties with constant accuracy. However, if achieving a native-like pronunciation remains an explicit goal for some in the future (as it currently is in the training of future English teachers in France), assessing learners’ degree of native-likeness and phonetic accuracy will only remain possible if models with traceable training accents keep being available. This is the case, to a certain extent, with GoogleUS and GoogleGB. This is also the case, as far as the native vs. foreign-accented dichotomy is concerned, for DeepSpeech and wav2vec. If we transpose this in terms of the nativeness vs. intelligibility debate in pronunciation teaching (Levis 2005), we believe that ASR models have the potential to let both approaches co-exist so long as, while improving the diversity of their training data, they maintain the availability of accent-specific models.
The AID model we used was in accordance with our auditory assessment, with up to 94% agreement when only the most definite RP or GA speakers (according to our perceptual mean accent scores) were kept for comparison. It is important to note that although the automatic system had been trained on 16 different varieties, the majority of our students (94%) were identified as either “England” or “US”. This finding reinforces our choice (that might have sounded very restrictive at first) to auditorily classify our students in terms of the two reference models. The results show that the use of automatic accent identification for EFL purposes is very promising. Possible extensions include re-training the system to only model the two-class (British vs. American) problem—which would more accurately emulate our auditory rating scheme—and using class-membership probability scores (rather than just categorical labels) to reflect within-speaker inconsistencies.
Now, turning to a question we have deliberately avoided throughout, a recent study involving attitude ratings of 38 native and foreign accents with UK respondents found that French came third in terms of prestige and pleasantness, just after RP and the Queen’s English (Sharma et al. 2022). One would be tempted to assume that perhaps not only should our French students stop aiming at RP or GA, but they should also strive to keep their foreign accent. There is, however, one key aspect to bear in mind: explicit attitude ratings can be extremely biased. For instance, Pantos and Perkins (2013) measured explicit (controlled) and implicit (immediate, automatic) attitudes toward US-accented and Korean-accented English and observed conflicting biases. While listeners implicitly favoured the US-accented, their explicit responses showed a preference for the Korean-accented voice. They were, therefore, as Pantos and Perkins (2013) suggest, able to hypercorrect their explicit responses if they feared that their implicit attitudes could betray a bias that is socially unacceptable. Similar findings were observed in McKenzie and Carrie (2018), where participants who self-identified as Northern English and resided in Newcastle-upon-Tyne were explicitly more positive about Northern (rather than Southern) English accents, but their implicit responses favoured Southern speech. Therefore, in spite of the ubiquitous spread of studies relying on explicit responses, more subtle and implicit measurements, like those in Pantos and Perkins (2013), McKenzie and Carrie (2018), or Pélissier and Ferragne (2022), who used the EEG, prove that accents still matter. The native-likeness vs. intelligibility debate is therefore still open, and we hope to have exemplified the reliability of some auditory and automatic techniques to assess learners’ accents.
Author Contributions
Conceptualization, E.F., A.G.T., H.K. and S.N.; methodology, E.F., A.G.T., H.K. and S.N.; software, E.F.; validation, E.F., A.G.T., H.K. and S.N.; formal analysis, E.F., A.G.T., H.K. and S.N.; investigation, E.F., A.G.T., H.K. and S.N.; resources, E.F., A.G.T., H.K. and S.N.; data curation, E.F., A.G.T., H.K. and S.N.; writing—original draft preparation, E.F., A.G.T., H.K. and S.N.; writing—review and editing, E.F., A.G.T., H.K. and S.N.; visualization, E.F.; supervision, E.F.; project administration, E.F.; funding acquisition, E.F. All authors have read and agreed to the published version of the manuscript.
Funding
Idex Université Paris Cité: ANR-18-IDEX-0001—projet Innovations Pédagogiques SEPALE.
Institutional Review Board Statement
The study was conducted in accordance with the Declaration of Helsinki, and approved by the Ethics Committee of Université Paris Cité (IRB: 00012021-68 approved: 19 September 2021).
Informed Consent Statement
Informed consent was obtained from all subjects involved in the study.
Data Availability Statement
The datasets presented in this article are not readily available because consent to share the audio recordings was not obtained and the datasets are part of an ongoing study.
Conflicts of Interest
The authors declare no conflict of interest.
Appendix A
- (1)
- I knew I ought to have asked google dot com. It’s better and faster than a secretary.
- (2)
- I have the last-minute pleasure to introduce that new volatile character from Marge Butterfly’s novel.
- (3)
- Who cared when the Duke got shot at in a bitter blast up in North New Jersey last January.
- (4)
- Are you sure grasping Harry Potter will turn you into an extraordinary futile sorceress?
- (5)
- Authorities came to the realisation that it was customary for new fragile rappers to snitch in order to better their chances in court.
- (6)
- A lot of producers use samples to enhance their creativity but the generalisation of autotuning now seems mandatory.
- (7)
- The loss of twenty odd ductile brass boxes was reported by security.
- (8)
- A fire with thirty logs and a little grass will make your water hotter.
- (9)
- I’m not hostile to new civilizations; past societies were vastly overrated.
- (10)
- A broad example of Americanization is the nutrition pattern of resorting to fertile brands like McDonalds.
- (11)
- The organization demanded that its staff exercise caution when talking about the missile inventory.
- (12)
- Their daughter thought a depilatory bath was more suitable than is often assumed.
Notes
| 1 | We stick to the historical label, although alternatives such as Southern Standard British English (International Phonetic Association 1999) or General British (Cruttenden and Gimson 2014) would more accurately portray what we are referring to here. However, the term RP is deeply entrenched in the field of English as a Foreign Language. |
| 2 | Standard lexical sets are “a set of keywords, each of which […] stands for a large number of words which behave in the same way in respect of the incidence of vowels in different accents”. (Wells 1982, pp. 119–20). |
| 3 | Intraclass correlations are used here to evaluate the reliability of ratings between judges, or between automatic models. ICC2k is also known as the two-way random effects model measuring absolute agreement between multiple raters or measurements; equations are available in Koo and Li (2016). |
| 4 | https://github.com/mozilla/DeepSpeech/releases/tag/v0.7.1, accessed on 23 January 2024. |
| 5 | The pretrained model we used is available here: https://fr.mathworks.com/matlabcentral/fileexchange/103525-wav2vec-2-0, accessed on 23 January 2024. |
References
- Ahn, Tae Youn, and Sangmin-Michelle Lee. 2016. User experience of a mobile speaking application with automatic speech recognition for EFL learning: Speaking app with ASR. British Journal of Educational Technology 47: 778–86. [Google Scholar] [CrossRef]
- Ardila, Rosana, Megan Branson, Kelly Davis, Michael Henretty, Michael Kohler, Josh Meyer, Reuben Morais, Lindsay Saunders, Francis M. Tyers, and Gregor Weber. 2019. Common Voice: A Massively-Multilingual Speech Corpus. arXiv arXiv:1912.06670. [Google Scholar]
- Armstrong, Nigel, and Jennifer Low. 2008. C’est encœur plus jeuli, le Mareuc: Some evidence for the spread of/ɔ/-fronting in French. Transactions of the Philological Society 106: 432–55. [Google Scholar] [CrossRef]
- Baevski, Alexei, Henry Zhou, Abdelrahman Mohamed, and Michael Auli. 2020. wav2vec 2.0: A Framework for Self-Supervised Learning of Speech Representations. arXiv arXiv:2006.11477. [Google Scholar]
- Baratta, Alex. 2017. Accent and Linguistic Prejudice within British Teacher Training. Journal of Language, Identity & Education 16: 416–23. [Google Scholar] [CrossRef]
- Carrie, Erin. 2017. ‘British is professional, American is urban’: Attitudes towards English reference accents in Spain. International Journal of Applied Linguistics 27: 427–47. [Google Scholar] [CrossRef]
- Cruttenden, Alan, and Alfred Charles Gimson. 2014. Gimson’s Pronunciation of English, 8th ed. London: Routledge. [Google Scholar]
- Cucchiarini, Catia, and Helmer Strik. 2017. Automatic speech recognition for second language pronunciation training. In The Routledge Handbook of Contemporary English Pronunciation. Edited by Okim Kang, Ron I. Thomson and John M. Murphy. London: Routledge, pp. 556–69. [Google Scholar]
- de Wet, Febe, Christa Van der Walt, and Thomas R. Niesler. 2009. Automatic assessment of oral language proficiency and listening comprehension. Speech Communication 51: 864–74. [Google Scholar] [CrossRef]
- Derwing, Tracey M., and Murray J. Munro. 1997. Accent, Intelligibility, and Comprehensibility: Evidence from FourL1s. Studies in Second Language Acquisition 19: 1–16. [Google Scholar] [CrossRef]
- Deschamps, Alain, Jean-Michel Fournier, Jean-Louis Duchet, and Michael O’Neil. 2004. English Phonology and Graphophonemics. Paris: Editions Ophrys. [Google Scholar]
- DiChristofano, Alex, Henry Shuster, Shefali Chandra, and Neal Patwari. 2022. Global Performance Disparities Between English-Language Accents in Automatic Speech Recognition. arXiv arXiv:2208.01157. [Google Scholar]
- Dubravac, Vildana, Amna Brdarević-Čeljo, and Senad Bećirović. 2018. The English of Bosnia and Herzegovina. World Englishes 37: 635–52. [Google Scholar] [CrossRef]
- Ferragne, Emmanuel, Sébastien Flavier, and Christian Fressard. 2013. ROCme! Software for the recording and management of speech corpora. Paper presented at Interspeech, Lyon, France, August 25–29; pp. 1864–65. [Google Scholar]
- Frumkin, Lara A., and Anna Stone. 2020. Not all eyewitnesses are equal: Accent status, race and age interact to influence evaluations of testimony. Journal of Ethnicity in Criminal Justice 18: 123–45. [Google Scholar] [CrossRef]
- Golonka, Ewa M., Anita R. Bowles, Victor M. Frank, Dorna L. Richardson, and Suzanne Freynik. 2014. Technologies for foreign language learning: A review of technology types and their effectiveness. Computer Assisted Language Learning 27: 70–105. [Google Scholar] [CrossRef]
- Hannun, Awni, Carl Case, Jared Casper, Bryan Catanzaro, Greg Diamos, Erich Elsen, Ryan Prenger, Sanjeev Satheesh, Shubho Sengupta, Adam Coates, and et al. 2014. Deep Speech: Scaling up end-to-end speech recognition. arXiv arXiv:1412.5567. [Google Scholar]
- Henderson, Alice, Dan Frost, Elina Tergujeff, Alexander Kautzsch, Deirdre Murphy, Anastazija Kirkova-Naskova, Ewa Waniek-Klimczak, David Levey, Una Cunnigham, and Lesley Curnick. 2012. The English Pronunciation Teaching in Europe Survey: Selected results. Research in Language 10: 5–27. [Google Scholar] [CrossRef]
- International Phonetic Association, ed. 1999. Handbook of the International Phonetic Association: A Guide to the Use of the International Phonetic Alphabet. Cambridge: Cambridge University Press. [Google Scholar]
- Jakšič, Jan, and Pavel Šturm. 2017. Accents of English at Czech Schools: Students’ Attitudes and Recognition Skills. Research in Language 15: 353–69. [Google Scholar] [CrossRef]
- Jenkins, Jennifer. 2006. Current Perspectives on Teaching World Englishes and English as a Lingua Franca. TESOL Quarterly 40: 157. [Google Scholar] [CrossRef]
- Kachru, Braj. 1985. Standards, codification and sociolinguistic realism: The English language in the outer circle. In English in the World: Teaching and Learning the Language and Literatures. Edited by Randolph Quirk and Henry G. Widdowson. Cambridge: Cambridge University Press, pp. 11–30. [Google Scholar]
- Kang, Okim. 2015. Learners’ Perceptions toward Pronunciation Instruction in Three Circles of World Englishes. TESOL Journal 6: 59–80. [Google Scholar] [CrossRef]
- Koo, Terry K., and Mae Y. Li. 2016. A Guideline of Selecting and Reporting Intraclass Correlation Coefficients for Reliability Research. Journal of Chiropractic Medicine 15: 155–63. [Google Scholar] [CrossRef]
- Labov, William, Sharon Ash, and Charles Boberg. 2006. The Atlas of North American English: Phonetics, Phonology and Sound Change. Berlin: Mouton de Gruyter. [Google Scholar] [CrossRef]
- Levis, John M. 2005. Changing contexts and shifting paradigms in pronunciation teaching. TESOL Quarterly 39: 369–77. [Google Scholar] [CrossRef]
- Marian, Viorica, Henrike K. Blumenfeld, and Margarita Kaushanskaya. 2007. The Language Experience and Proficiency Questionnaire (LEAP-Q): Assessing Language Profiles in Bilinguals and Multilinguals. Journal of Speech, Language, and Hearing Research 50: 940–67. [Google Scholar] [CrossRef]
- Markl, Nina. 2022. Language variation and algorithmic bias: Understanding algorithmic bias in British English automatic speech recognition. Paper presented at 2022 ACM Conference on Fairness, Accountability, and Transparency, Seoul, Republic of Korea, June 21–24; pp. 521–34. [Google Scholar] [CrossRef]
- McCrocklin, Shannon. 2015. Automatic Speech Recognition: Making It Work for Your Pronunciation Class. Pronunciation in Second Language Learning and Teaching Proceedings 6: 126–33. Available online: https://www.iastatedigitalpress.com/psllt/article/id/15254/ (accessed on 23 January 2024).
- McKenzie, Robert M., and Erin Carrie. 2018. Implicit–explicit attitudinal discrepancy and the investigation of language attitude change in progress. Journal of Multilingual and Multicultural Development 39: 830–44. [Google Scholar] [CrossRef]
- Meer, Philipp, Johanna Hartmann, and Dominik Rumlich. 2022. Attitudes of German high school students toward different varieties of English. Applied Linguistics 43: 538–62. [Google Scholar] [CrossRef]
- Mering, Andy. 2022. Mid-Atlantic English in the EFL Context. Baden-Baden: Tectum—Ein Verlag in der Nomos Verlagsgesellschaft mbH & Co. KG. [Google Scholar] [CrossRef]
- Modiano, Marko. 1996. The Americanization of Euro-English. World Englishes 15: 207–15. [Google Scholar] [CrossRef]
- Ngo, Thuy Thi-Nhu, Howard Hao-Jan Chen, and Kyle Kuo-Wei Lai. 2023. The effectiveness of automatic speech recognition in ESL/EFL pronunciation: A meta-analysis. ReCALL 36: 4–21. [Google Scholar] [CrossRef]
- Panayotov, Vassil, Guoguo Chen, Daneil Povey, and Sanjeev Khudanpur. 2015. Librispeech: An ASR corpus based on public domain audio books. Paper presented at 2015 IEEE International Conference on Acoustics, Speech and Signal Processing (ICASSP), South Brisbane, Australia, April 19–24; pp. 5206–10. [Google Scholar] [CrossRef]
- Pantos, Andrew J., and Andrew W. Perkins. 2013. Measuring Implicit and Explicit Attitudes Toward Foreign Accented Speech. Journal of Language and Social Psychology 32: 3–20. [Google Scholar] [CrossRef]
- Pennington, Martha C., and Pamela Rogerson-Revell. 2019. English Pronunciation Teaching and Research: Contemporary Perspectives, 1st ed. London: Palgrave Macmillan. [Google Scholar] [CrossRef]
- Pélissier, Maud, and Emmanuel Ferragne. 2022. The N400 reveals implicit accent-induced prejudice. Speech Communication 137: 114–26. [Google Scholar] [CrossRef]
- Phan, Huong Le Thu. 2020. Vietnamese learners’ attitudes towards American and British accents. European Journal of English Language Teaching 6: 97–117. [Google Scholar] [CrossRef]
- Rindal, Ulrikke. 2010. Constructing identity with L2: Pronunciation and attitudes among Norwegian learners of English. Journal of Sociolinguistics 14: 240–61. [Google Scholar] [CrossRef]
- Roach, Peter. 2009. English Phonetics and Phonology: A Practical Course, 4th ed. Cambridge: Cambridge University Press. [Google Scholar]
- Roberts, Gillian. 2020. Language attitudes and L2 pronunciation: An experimental study with Flemish adolescent learners of English. English Text Construction 13: 178–211. [Google Scholar] [CrossRef]
- Ryan, Spring, and Tabuchi Ryuji. 2021. Assessing the Practicality of Using an Automatic Speech Recognition Tool to Teach English Pronunciation Online. STEM Journal 22: 93–104. [Google Scholar] [CrossRef]
- Sharma, Devyani, Erez Levon, and Yang Ye. 2022. 50 years of British accent bias: Stability and lifespan change in attitudes to accents. English World-Wide 43: 135–66. [Google Scholar] [CrossRef]
- Tatman, Rachael. 2017. Gender and Dialect Bias in YouTube’s Automatic Captions. Paper presented at the First ACL Workshop on Ethics in Natural Language Processing, Valencia, Spain, April 4; pp. 53–59. [Google Scholar] [CrossRef]
- Tejedor-García, Cristian, David Escudero-Mancebo, Enrique Cámara-Arenas, César González-Ferreras, and Valentín Cardeñoso-Payo. 2020. Assessing Pronunciation Improvement in Students of English Using a Controlled Computer-Assisted Pronunciation Tool. IEEE Transactions on Learning Technologies 13: 269–82. [Google Scholar] [CrossRef]
- Thomson, Ron I., and Tracey M. Derwing. 2015. The Effectiveness of L2 Pronunciation Instruction: A Narrative Review. Applied Linguistics 36: 326–44. [Google Scholar] [CrossRef]
- Toffoli, Denyze, and Geoff Sockett. 2015. L’apprentissage informel de l’anglais en ligne (AIAL): Quelles conséquences pour les centres de ressources en langues? Recherche et Pratiques Pédagogiques En Langues de Spécialité—Cahiers de l’APLIUT 34: 147–65. [Google Scholar] [CrossRef]
- Torrent, Mélanie. 2022. Rapport du Jury de l’agrégation Externe d’anglais. Ministère de l’Education Nationale et de la Jeunesse: Available online: https://media.devenirenseignant.gouv.fr/file/agreg_externe/39/5/rj-2022-agregation-externe-lve-anglais_1428395.pdf (accessed on 23 January 2024).
- Trofimovich, Pavel, and Talia Isaacs. 2012. Disentangling accent from comprehensibility. Bilingualism: Language and Cognition 15: 905–16. [Google Scholar] [CrossRef]
- Tsang, Art. 2020. Are learners ready for Englishes in the EFL classroom? A large-scale survey of learners’ views of non-standard accents and teachers’ accents. System 94: 102298. [Google Scholar] [CrossRef]
- Walker, Robin. 2010. Teaching the Pronunciation of English as a Lingua Franca. Oxford: Oxford University Press. [Google Scholar]
- Wells, John C. 1982. Accents of English. Cambridge: Cambridge University Press. [Google Scholar]
- Xiao, Wenqi, and Moonyoung Park. 2021. Using Automatic Speech Recognition to Facilitate English Pronunciation Assessment and Learning in an EFL Context: Pronunciation Error Diagnosis and Pedagogical Implications. International Journal of Computer-Assisted Language Learning and Teaching 11: 74–91. [Google Scholar] [CrossRef]
- Yibokou, Kossi Seto, Denyze Toffoli, and Béatrice Vaxelaire. 2019. Variabilité inter-individuelle et intra-individuelle dans la prononciation d’étudiants français qui pratiquent l’Apprentissage informel de l’anglais en ligne. Lidil 59. [Google Scholar] [CrossRef]
- Zuluaga-Gomez, Juan, Sara Ahmed, Danielius Visockas, and Cem Subakan. 2023. CommonAccent: Exploring Large Acoustic Pretrained Models for Accent Classification Based on Common Voice. arXiv arXiv:2305.18283. [Google Scholar]
Disclaimer/Publisher’s Note: The statements, opinions and data contained in all publications are solely those of the individual author(s) and contributor(s) and not of MDPI and/or the editor(s). MDPI and/or the editor(s) disclaim responsibility for any injury to people or property resulting from any ideas, methods, instructions or products referred to in the content. |
© 2024 by the authors. Licensee MDPI, Basel, Switzerland. This article is an open access article distributed under the terms and conditions of the Creative Commons Attribution (CC BY) license (https://creativecommons.org/licenses/by/4.0/).

