Abstract
Heritage language variation and change provides an opportunity to examine the interplay of contact-induced and language-internal effects while extending the variationist framework beyond monolingual speakers and majority languages. Using data from the Heritage Language Variation and Change in Toronto Project, we illustrate this with a case study of Tagalog (r), which varies between tap, trill, and approximant variants. Nearly 3000 tokens of (r)-containing words were extracted from a corpus of spontaneous speech of 23 heritage speakers in Toronto and 9 homeland speakers in Manila. Intergenerational and intergroup analyses were conducted using mixed-effects modeling. Results showed greater use of the approximant among second-generation (GEN2) heritage speakers and those that self-report using English more. In addition, the distributional patterns remain robust and the approximant appears in more contexts. We argue that these patterns reflect an interplay between internal and external processes of change. We situate these findings within a framework for distinguishing sources of variation in heritage languages: internal change, identity marking and transfer from the dominant language.
1. Introduction
The field of heritage language research is concerned with describing how and why heritage language speakers differ from monolinguals and other bilinguals. Studies of heritage language sound systems have demonstrated that even though heritage speakers tend to have advantages over L2 learners in production (and perception) because of their early exposure to the heritage language (e.g., Amengual 2016; Au et al. 2008; Oh et al. 2003), they nonetheless exhibit differences from monolingual speakers (Chang et al. 2011; Godson 2004; Nagy and Kochetov 2013). However, the majority of the studies are experimental in nature, rely on elicited speech, and are often carried out with little attention to the complex interaction of sociolinguistic factors that shape language use patterns and performance. The Heritage Language Variation and Change in Toronto Project (HLVC, Nagy 2009, 2011), in contrast, applies a variationist sociolinguistic framework to the study of heritage languages. The HLVC Project identifies and analyzes sociolinguistic variation and change in the spontaneous speech of ten heritage languages in Toronto, a city where half the population has a mother tongue other than English. The HLVC Project adopts the Canadian government’s definition of heritage languages, which are non-official mother-tongue languages, whose speakers hold ties to the culture/heritage. This definition, as Nagy (2015, p. 310) notes, is “independent of how the language is spoken and independent of proficiency in the majority language.”
The present study uses HLVC data to analyze Tagalog rhotics, a cluster of phones represented as (r), following sociolinguistic practice. Spontaneous speech of heritage speakers in Toronto and homeland speakers in Manila is examined. We compare variable patterns between two generations of heritage speakers, defined with respect to the speaker’s family’s immigration from the Philippines to Canada: first-generation (GEN1) speakers are born and raised in the homeland, immigrated to Toronto as adults (18 years old), and have been living in Toronto for at least 20 years. Second-generation (GEN2) speakers are born and raised in Toronto (or arrived before the age of 6) and have parents who count as GEN1. We also consider a sample of (older and younger) homeland speakers. An intergenerational comparison can provide evidence of on-going apparent time change while comparison between heritage and homeland patterns can help distinguish types of change.
Differences in heritage language grammars are often explained in terms of contact. However, given that heritage languages are also native languages (Rothman and Treffer-Daller 2014), we also consider language-internal explanations. In the present study, we analyze the heritage language data from the perspective of variationist sociolinguistics and language contact, in which linguistic outcomes are assumed to arise from the interplay of multiple linguistic, social, or contact-related factors that influence speakers’ choices. One advantage of the variationist method is the simultaneous consideration of multiple factors using multivariate regression modeling. We can identify which factors are influential (via significant effects) and how they condition the variation (via constraint rankings). We argue that different processes of variation and change are reflected in how linguistic and social factors interact, thereby allowing us to identify the underlying processe(s) driving variability and change in the heritage variety. The present study illustrates this framework (and its limitations) for teasing apart these sources of variation with respect to Tagalog (r).
1.1. Cross-Linguistic Variation in Rhotics
Rhotics, or r-sounds, constitute a diverse group of sounds varying in place and manner of articulation. These include trills, taps (or flap), approximants, and fricatives. Further, many languages exhibit multiple variants of /r/. Dutch /r/, for example, demonstrates as many as twenty different realizations (Sebregts 2014). In general, however, Ladefoged and Maddieson (1996, p. 215) contend that rhotics are prototypically realized as “trills made with the tip or blade of the tongue (IPA r).” This is echoed by Barry (1997, p. 38), who notes the primacy of trills within the rhotic class, and that other rhotic sounds represent lenited forms or cases of “non-attainment of the adjustment required for the trills.”
Trills are produced with the tongue tip vibrating against the teeth or alveolar ridge, lasting two or three occlusions. Taps, on the other hand, are produced by making brief contact between the tongue tip and either the teeth or alveolar ridge. Lindau (1985, p. 166) notes that trills can be viewed as a series of taps. In this way, taps and trills can be distinguished by the number of occlusions: taps only have one occlusion while trills have at least two. Another rhotic variant is the approximant, typically produced by creating a constriction in the vocal tract within the postalveolar or mid-palatal region by raising the tongue body. They may also be produced with a bunched tongue configuration and lip rounding (Ladefoged and Maddieson 1996, p. 234).
Production of rhotics demonstrate much variability and has been shown to be constrained by linguistic and social factors. For example, in Spanish, the realization of the trill may be conditioned by phonological context (Bradley 2006) and word position (Henriksen and Willis 2010). In Santomean Portuguese, Bouchard (2019) found an on-going change whereby younger speakers demonstrate greater use of fricative variants in all positions of a word compared to their older counterparts. Finally, in English, the presence or absence of rhotics in coda position may be associated with region, formality, socioeconomic status, and gender (Labov 1966).
Given their articulatory complexity, rhotics tend to be relatively difficult phonemes to acquire. Previous studies have shown that rhotics are typically acquired at later stages—between the ages of two and three (McLeod 2007) and adult-like production may develop much later (e.g., Carballo and Mendoza 2000 for Spanish). The acquisition patterns of rhotics may also be different between monolingual and bilingual speakers (Kehoe 2018) and even between early and advanced L2 learners (Face 2006).
1.2. The Relationship between Rhotics
Since there are multiple variants of (r), there have been attempts at capturing the relationship between them. Lindau (1985) suggests that at the phonetic level, there seems to be a “family resemblance” between the members classified as rhotic. While each member shares a particular property with another member, no single property is shared across all of them. Building on this family resemblance model, Sebregts (2014) argues that synchronic patterns can be explained through diachronic developments: the connection between variants can be seen as not family resemblances, but rather as family relationships. This follows from Barry (1997, p. 41), who argues that taps, trills, and approximants are “articulatory siblings in different stages of development.” In particular, the trill, which is articulatorily complex, is the base form of rhotics, and other variants developed from this sound and can be viewed as “simplification.”
This process of simplification may be linked to lenition (or weakening), which can be defined as a reduction in the degree of constriction (Kirchner 1998) and can manifest as spirantization, debuccalization, approximantization, or in extreme cases, deletion. Lenition is commonly implicated in historical sound changes (Crowley and Bowern 2010). In the case of Dutch /r/, Sebregts (2014) argues that lenition may be a key phonological process driving diachronic change reflected in synchronic variation. He proposes that taps can be treated as lenited forms of trills and that approximants are lenited forms of taps. The variants differ in terms of degree of stricture, where the taps are characterized more by closure and approximants by approximation. Originating in casual speech, over time, these lenited forms spread through the speech community (cf. Pierrehumbert 2001). Building on Sebregts’s (2014) work, Rennicke (2015) offers a model of rhotic lenition for Brazilian Portuguese, placing trills, taps, and approximants along a similar trajectory. Furthermore, based on examples from numerous languages, Kirchner (1998) shows that lenition is more likely in word final and coda positions compared to word initial and onset positions. Indeed, Rennicke (2015) showed that lenited variants of rhotics are favored more in coda positions than any other context.
1.3. Tagalog (r)
Before describing Tagalog (r), a note on Tagalog syllable structure and phonotactics is needed. Schachter and Otanes (1972) describe Tagalog as having a canonical C(C)V(C) syllable structure. Clusters are generally restricted, with onset clusters being limited to only two consonants. In indigenous Tagalog words, the second consonant is always a glide, /w/ or /j/. Clusters whose second consonant is either /l/ or /r/ are typically loanwords and coda clusters are likewise limited to loanwords (mostly of English origin).
Tagalog has one rhotic phoneme, which can surface as a tap or a trill. These two allophones are noncontrastive and interchangeable in Tagalog, although Schachter and Otanes (1972, p. 24) state that the trill is particularly used in “emphatic” speech.1 The approximant [ɹ] is another rhotic variant reported in Tagalog (Chen et al. 2016; Lesho 2018; Rentillo and Nuñez 2011). Previous studies generally attribute the development of the approximant variant of Tagalog (r) to contact with English. The Philippines was an American colony between 1898 and 1946. During this time, English became the official language and was introduced in the education system. One consequence of this is the expansion of phonemic/phonetic categories of Philippine languages to accommodate English loanwords. Lesho (2018) examined the acoustic properties of Philippine English as spoken by middle-class speakers in Metro Manila (the nation’s capital region). All speakers in her sample produced the rhotic with approximant qualities, such as a lowered F3 and absence of occlusions, across phonological contexts (e.g., simple or complex onsets, word-internal coda or word-final). More importantly, she reports that “the approximant seems to be spreading across sociolects and even influencing other Philippine languages” (p. 362).
Aligning with Lesho’s report, Philip Rentillo (personal communication, May 2020) notes that the approximant has become more widespread among educated Filipinos. The use of this variant has become a marker of the conyo sociolect, most often associated with middle-class, socially mobile, often private-school educated speakers (Borlongan 2015).2 The term itself is also used to describe this particular social group or persona. Reyes (2017, p. 215) notes that conyo as an “elite label” did not gain prominence until the 1990s, coinciding with the increase in commercialization and the rise in “middle-class anxieties over the display of modern emblems of privilege”. While the use of the conyo sociolect is often linked to younger speakers, older speakers also exhibit its use to varying degrees in part as a marker of higher social standing.
There is growing metalinguistic evidence that the approximant variant has gained social meaning. Borlongan (2015) notes that the use of the approximant [ɹ] realization of (r) in Tagalog words is a characteristic feature of the conyo sociolect. This feature has been discussed in many commentaries and parodies in various social media platforms. For example, a Youtube video created by Jericho Arceo (2018) titled, “Things About CONYO PEOPLE”, describes notable traits of this social group—the way they dress, act, and speak. In his discussion of words that conyo men typically use, namely dude, or their Tagalog equivalents chong and pare, he highlights how these words should be pronounced, including this relevant directive in (1):
- At ‘yung “pare”hindi siya [parɛ]—pang kanto ‘yon; dapat [pɛɹɛ]—small, soft ‘r’ (5:46–5:49)‘And “pare”, it’s not [parɛ]—that’s for the streets; it must be [pɛɹɛ]—small, soft ‘r’’
Focusing on the word pare (lit. ‘pal’), he says that (r) should be pronounced as [pɛɹɛ]; that is, with an approximant variant which he describes as a “small, soft ‘r’.” He contrasts this with [parɛ] with a trill, which he claims is pang kanto (lit. “for the street corner”), implying that this variant is seen as unrefined.
In spite of the growing awareness surrounding this variant, only one study has probed this variation in Tagalog. Rentillo and Nuñez (2011) investigated the use of (r) in Metro Manila and explored the extent to which English (L2) influences Tagalog (L1) rhotics among middle class, bilingual Filipino students at a private university. Forty-eight participants read a word list containing Tagalog words (indigenous and Spanish loanwords). Their results show that the tap had an overall higher frequency (64%) followed by the approximant (30%) and the trill (6%), which was produced far less than the other variants. The distribution, however, was conditioned by position within the word, as shown in Figure 1. Concerning the approximant variant, they found that it was highly favored in word-final and medial coda contexts, followed by word-initial and medial onset contexts; and disfavored in onset clusters.
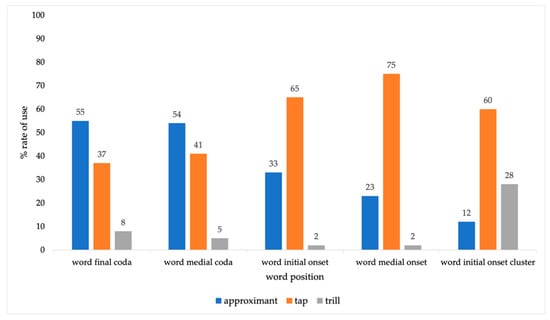
Figure 1.
Frequency of the (r) variants by word position, n = 3351 (showing data from Rentillo and Nuñez 2011).
Philip Rentillo (personal communication, May 2020) speculates that increase in approximant use may have been influenced by exposure to English, or perhaps by the prestige associated with English. This study provides important insights into rhotic variability in Tagalog, and points to the increased use of the approximant variant in the speech of homeland Tagalog speakers (albeit from a restricted age group and social background), and the influential roles of word position and loanword status.
In diasporic communities there are also reports of the approximant variant in Tagalog speech. One study in Vancouver, Canada, aimed at developing phonological assessment and analysis tools for Tagalog, examined the phonological patterns of a four-year old Heritage Tagalog-speaker (Chen et al. 2016). The researchers found that the child exhibited relative mastery of Tagalog phonology and had few mismatches (related to vowels) between observed and target productions. Crucially, the participant always produced Tagalog (r) with an approximant quality. In some cases, the child produced an [ɹ̝], wherein the tongue body creates frication, perhaps to approximate a trill production. These findings suggest that the child has not yet acquired the tap/trill, which stand in contrast to the developmental patterns in monolinguals whereby Tagalog (r) is normally mastered by age four (e.g., Riguer and Panganiban 2004; Silva 1985).
1.4. Accounts of Variation and Change in Heritage Languages
As previously mentioned, heritage language sound systems exhibit a great deal of variability. In this section, we discuss three possible explanations of phonetic variability in heritage languages: transfer from English, identity marking, and language-internal change. We then argue that these three possibilities may be teased apart through intergroup comparisons of social, linguistic, and contact-based factors.
1.4.1. Transfer from English
One possible account of heritage language variability is language transfer, whereby a particular feature from the dominant language (i.e., English) is transferred to the heritage language. In the present study, we consider two possible processes, the first of which is replacement of Tagalog (r) with the English approximant [ɹ]. Previous research shows that linguistic systems of bilinguals may interact bidirectionally (Cook 2003; Grosjean 1989; Zampini and Green 2001), and there is a wealth of research showing the different outcomes of cross-linguistic influence (cf. Flege 1987; Fowler et al. 2008; Kang and Guion 2006). In Flege’s (1995) Speech Learning Model, the acquisition of L2 sounds depends on whether they are perceived as “new”, “similar”, or “identical” to corresponding L1 sounds. L2 sounds perceived as new or similar, in particular, are hypothesized to be difficult to acquire because they require novel properties to be learned.
The extent of transfer in heritage languages may be affected by the amount of input (e.g., Kehoe 2018; Lleó 2018; Menke 2018; Cummings Ruiz and Montrul 2020). In general, heritage speakers receive less input than their homeland peers. This is because even though heritage speakers may be exposed to the heritage language from childhood at home, they are increasingly exposed to the dominant language in the community as they age. This situation of reduced input may result in a heritage language system that is different from the homeland variety. Extending Flege’s (1995) hypothesis above and drawing from research on the acquisition of sociolinguistic variation (Labov 1989; Roberts 1994; Smith et al. 2009), we argue that acquisition of sounds not only involves acquiring phonetic distinctions, but also the relevant distributional properties governing variant choice. Even if heritage speakers acquire the phonetic distinction between tap/trill and approximant and show variability, they may be unable to fully acquire the distributional patterns of Tagalog (r), due to reduced input. In this case, they might be influenced by English (r), which does not vary between tap/trill and approximant. Here, we might expect heritage speakers to exhibit overall increased and less-unconstrained use of the approximant.
Another factor that influences the extent of transfer is exposure. In particular, we consider the case of attrition, whereby a particular feature is acquired but is somehow “lost” over time (de Leeuw 2019). Attrition is evidenced when speakers show changes in how particular phones are realized as a result of acquisition of and long-term exposure to an additional language in adulthood (cf. Flege and Hillenbrand 1984; Major 1992; Ulbrich and Ordin 2014; Mayr et al. 2012; de Leeuw et al. 2018). Applying a similar line of reasoning as above, we argue that attrition can also be reflected in the “loss” or weakening of the constraints governing the distribution of Tagalog (r), and so we might expect heritage speakers with long-term exposure to English to also show an overall increased and less-constrained use of the approximant.
1.4.2. Identity Marking
Sociolinguistic studies have shown that speakers can—either consciously or subconsciously—manipulate phonetic variables in order to construct and express various aspects of their social identities (e.g., Eckert 2000; Labov 1972). In fact, Hay and Drager (2007, p. 89) argue that “very fine phonetic detail is used for the construction of social identity,” perhaps even more so if they are linked to particular social meanings. For heritage speakers, ethnic identity may be a relevant factor in predicting variable patterns (cf. Giles and Johnson 1987), yet the relationship between ethnic identity and language variation has not been explored in great detail in heritage language contexts. Oh and Au (2005) explored the extent to which factors related to sociocultural background influence mastery of learning a Heritage Spanish among Latino college students. The researchers found that those who strongly identify with Latino culture, engaged in Latino cultural activities, and used Spanish more frequently outside of classroom settings had more native-like accents. More recently, Kissling (2018) examined heritage speakers of Spanish and found that heritage speakers who self-identified with the Latinx/Hispanic ethnicity and culture produced rhotics that aligned more closely with native speaker norms (rather than with L2 learner forms). Therefore, we might expect that heritage speakers that have stronger affiliation with the heritage language and culture, and/or greater use of the heritage language are more likely to approximate homeland norms. Conversely, speakers with weaker ties to the heritage language and culture, and/or less use of the heritage language may diverge from homeland norms.
1.4.3. Language-Internal Development
Language variation and change in contact situations are not necessarily due to contact or acquisition processes (Poplack and Levey 2010, p. 412). We must also consider the possibility of a language-internal account. Language-internal processes have highly regular effects motivated by structural properties and inherent principles governing the language (Hickey 2012). Given that heritage languages are also native languages (Rothman and Treffer-Daller 2014), it is reasonable to expect that heritage languages may also undergo variation and change due to internal motivations. This may occur before or after immigration and so heritage speakers may (or may not) display similar patterns as their homeland counterparts. Kang and Nagy (2016) for example, found that Heritage Korean in Toronto exhibits a tonogenesis-related VOT merger, a change in progress that is also found in Homeland Korean in Seoul.
Another example comes from a study of Heritage Portuguese in Germany. Rinke et al. (2018) compared two generations of immigrant/heritage speakers to two age-matched generations of monolingual speakers in the use of null object constructions in spontaneous speech. They found that both groups of younger speakers exhibit greater use of null objects compared to their respective older counterparts. However, the semantic-pragmatic conditioning (i.e., the features [propositional] and [animacy]) shows that younger heritage speakers omit objects that are non-propositional and animate at higher rates than their younger monolingual counterparts. The authors suggest that the younger heritage speakers may be extending the use of null objects along the referential hierarchy proposed by Cyrino et al. (2000) for Brazilian Portuguese. The proposal involves a diachronic pathway with respect to the animacy of null objects: the less referential an object is (e.g., 3rd person and non-human), the more likely it is to be null. Rinke et al. (2018) argue that the heritage speakers in their study may be reflecting and advancing a diachronic change in Brazilian Portuguese. We also consider language-internal development. As discussed above, languages may develop multiple variants of rhotics (independent of contact with English), and new variants may emerge through the lenition of existing forms. Here, the second possible process we consider is that Tagalog (r) surfaces as a lenited form, approximant [ɹ]. Notice that this constitutes a second process—distinct from transfer—in which an approximant variant may surface.
1.5. Framework for Distinguishing Sources of Variation and Change in Heritage Languages
Here, we sketch a framework that applies a comparative variationist approach (Poplack and Meechan 1998; Poplack and Tagliamonte 2001) to the study of heritage language systems by considering the patterning of linguistic, social, and contact-based factors in different inter-group comparisons. The goal is to distinguish patterns of these factors that correspond to the explanations of phonetic variability presented in the previous section. Extending the strategy introduced in Nagy (2011), we focus first on establishing generational patterns in the homeland and heritage varieties (Stage 1 in Figure 2). We then compare homeland and heritage speakers (Stage 3 in Figure 2).3 In all comparisons, we consider the role of gender, and for heritage speakers, we also consider contact-based factors related to identity and language use/preferences. Intergenerational and intergroup comparisons can reveal on-going changes in apparent time. Homeland comparison helps isolate the effects of language contact. The effects of gender and contact-based factors help to identify other types of change.
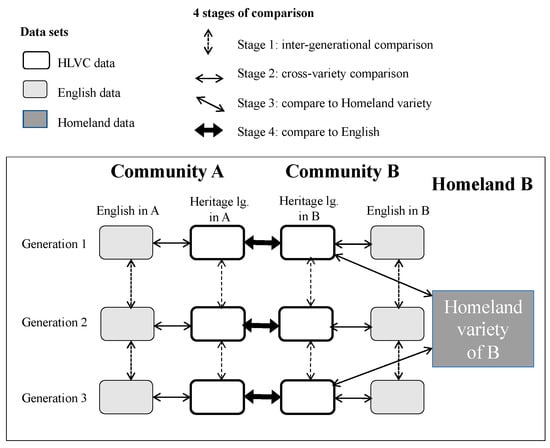
Figure 2.
Four kinds of comparison (updated from Nagy 2011).
We illustrate this framework with respect to (r). We must first establish that there is variability in the production of (r) in both homeland and heritage varieties. There is already evidence of variation in the homeland (Rentillo and Nuñez 2011), and while Chen et al. (2016) provide evidence of variation in heritage language communities, their study is based on one Tagalog-speaking child; patterns from a larger sample of heritage speakers are needed to confirm this trend.
Once presence of systematic variability is established, we can begin to search for evidence of on-going change. In light of Rentillo and Nuñez’s (2011) findings, we expect variability in the use of (r) in the homeland, but their work does not indicate whether there are different patterns between older and younger homeland speakers, reflecting change in progress. Such evidence is key for determining whether the same type of change, if any, is exhibited and transmitted across generations of heritage speakers.
One crucial inter-group comparison involves homeland speakers and GEN1 heritage speakers. We want to know whether GEN1 speakers, who acquired Tagalog in the homeland but experience long-term exposure to English in Toronto, differ from the homeland speakers. Differences between these groups in the distribution of (r) may reflect either transfer effects or a language-internal change that developed post-migration.
The next comparison involves GEN1 and GEN2 heritage speakers. If we see a generational difference, we can interpret that as evidence of a change in progress, but this does not allow us to definitively say that the change is attributable to contact or language-internal motivations, since both accounts predict an increase in the use of the approximant variant. Therefore, we look to other sources of evidence to better understand the process involved, examining the distribution of contexts in which the approximant is favored (the constraint hierarchy).
Aspects of (ethnic) identity construction may influence (r). In the present study, these are measured through the construct of ethnic orientation (EO), defined by Noels (2014, p. 89) as “loosely connected cluster of thoughts, feelings and behaviors pertaining to a person’s orientation towards their ancestral ethnic group and/or any other relevant ethnic group”. Nagy et al. (2014) showed that EO is an important factor in modeling variability in heritage languages, but different aspects of EO correlate with variation in different languages. In the present study, we focus on two aspects, namely ethnic identity and self-reported language use/preferences. These are measured by quantifying responses from an Ethnic Orientation Questionnaire (see Section 2). If ethnic identity correlates with (r), then we find support for the identity account. If only language use/preference is correlated with (r), then we may posit that transfer is at play. Again, we must consider the constraint hierarchy within each EO-defined group, as well as the rate of use of the approximant.
The last inter-group comparison involves gender. As a macro-social category, gender has been implicated in linguistic change, particularly in studies of English. If gender is a significant predictor of variation, then the patterns observed may be socially meaningful. In on-going changes, it is often the case that women favor incoming prestige variants in changes from above; and women favor innovative variants in changes from below. In the Philippines, the approximant variant of Tagalog (r) is prestigious due to its associations with the middle class, upwardly mobile and educated. It may also be taken as the innovative form, as the approximant variant has not been attested in earlier descriptions of Tagalog. In both cases, we expect greater use of the approximant variant among women than men. Furthermore, within the Filipino community in Canada, immigrant experiences are gendered (Kelly 2014; Mais 2012). For example, GEN1 women tend to work in places necessitating more diverse interactions compared to GEN1 men (e.g., healthcare and clerical fields for women, manufacturing for men). In this case, women might have a greater stake in asserting their Filipino or Canadian identities through linguistic choices. If gender does not emerge as significant, then this would lend support to other accounts of change.
In every comparison, we consider the effects of the linguistic factors that are hypothesized to govern the distributional patterns of (r). This serves two purposes: first, we are able to control for their effects, allowing us to measure the effects of social factors in spite of distributional differences (i.e., different groups of speakers producing (r) more in one context than others). Second, it is not sufficient to consider only rate differences, known to be easily affected by contextual or stylistic effects. Labov (1982) argues that the constraints associated with variant choice are the crucial components in diagnosing linguistic change. It is the hierarchy of effects of linguistic factors that show which subsets of speakers behave the same or differently. If transfer is a source of the variability, then we expect the roles of the linguistic factors to diminish (cf. Labov 2007) from one generation to the next (or in correlation with the language use/preferences score), as English does not exhibit the same type of conditioning as Tagalog. We would additionally expect an overall increase in rate of use of the approximant across all levels of the linguistic factors. On the other hand, if the change is internally motivated, then the linguistic factors should exert an effect as language-internal processes interact with the structural properties of the language, but EO should not.
In summary, a variationist sociolinguistic analysis may provide a nuanced perspective of heritage language variation and change via simultaneous consideration of the roles of social, contact-based, and linguistic factors. Furthermore, by comparing the effects of these factors between various subgroups, we can determine whether there are on-going changes, and if so, whether these changes are best attributed to contact or language-internal motivations. Table 1 below lists the sources of change in the first column. The remaining columns indicate the expected patterns for each type of inter-group comparison: “same” indicates that in this type of change, we predict no inter-group difference (with respect to the rate of use of one variant or the constraint hierarchy governing alternation between variants), while “different” indicates that inter-group difference is expected. Thus, each type of change has a unique profile or signature, that is, a unique combination of inter-group differences (or social factor effects). In the body of this paper, we present the necessary comparisons to indicate which groups exhibit the same rates and constraint hierarchies for Tagalog (r), and which differ, in order to amass evidence in support of one of these types of change over the other.

Table 1.
Profiles of each source of variation and change according to rate and constraint-hierarchy patterns of inter-group difference.
2. Materials and Methods
The data for this study come from the Tagalog corpus of the HLVC Project. The sample includes 23 heritage speakers and 9 homeland speakers. The speakers are distributed as in Table 2, which also shows the age (mean and standard deviation) of each group. All participants engaged in a sociolinguistic interview (Labov 1984) conducted in Tagalog, and the heritage speakers additionally responded to an Ethnic Orientation Questionnaire (available at http://ngn.artsci.utoronto.ca/pdf/HLVC/short_questionnaire_English.pdf (accessed on 3 November 2021); cf. Hoffman and Walker 2010). The questionnaire queries aspects of ethnic identity, language use and preferences, culture, and experiences with discrimination. Interviews were approximately an hour in length and conducted in person using a Zoom H4n digital recorder and Audio Technica AT899C lavalier microphone.4
Table 2.
Participant sample. Mean age (and standard deviation), in years, shown for each group.
The sociolinguistic interviews were transcribed in ELAN (Wittenburg et al. 2006). Up to 100 consecutive tokens of (r), represented by orthographic “r” in the transcripts, were extracted from each speakers’ sociolinguistic interview beginning 15 minutes into the conversation.5 Obtaining 100 tokens was not always possible given differences in duration of the interviews. Tokens in both Tagalog and English loanwords in a Tagalog matrix clause (not part of a larger English phrase) were included. Only the first five instances of each lexical item, per speaker, were included. Derivatives of roots were counted separately, such that trabaho ‘to work’, nag-trabaho ‘worked’, magtatrabaho ‘will work’ could contribute up to 15 tokens.
To determine whether (r) patterns among heritage speakers might be attributed EO, we quantify the heritage speakers’ responses to the Ethnic Orientation Questionnaire (EOQ). Responses to the EOQ are coded 0, 1, or 2, with higher scores reflecting greater orientation towards Filipino identity and Tagalog, and lower scores indicating orientation towards Canadian identity and English. We focus on two measures of ethnic orientation: the first measure, ethnic identity (eo-id), is related to how the participant explicitly expresses their ethnic identity. For this, we averaged response scores from questions A1–5. These questions provide insights not only about the heritage speakers’ self-identification, but also the kind of social interactions and networks they have that may influence how they perceive themselves along ethnic lines. The second measure, language use/preferences (eo-lg), combines responses to questions B3-5, C1-5. These questions address heritage speakers’ use of and preference for Tagalog (or English) and the language they are exposed to on a regular basis around family (since childhood) and friends—practices that we (might) assume have remained the same in adulthood.
For each measure, we classified speakers into two subgroups: “high EO” and “low EO”. As shown in Table 3, we used the median scores to create two groups; that is, those above the median were coded as “high EO” and those below the median were coded as “low EO”.6
Table 3.
Ethnic-orientation-based subgroups of heritage-speaker data compared (n = 1933).
A total of 2947 tokens were extracted from the interviews (but see discussion below regarding an exclusion). The tokens were coded auditorily by three Tagalog speakers for the dependent variable (tap/trill versus approximant) and the independent variables (see next paragraph). Tokens that were auditorily ambiguous were examined in PRAAT (Boersma and Weenink 2021). These were coded as a tap/trill if there was a reduction in the amplitude of the waveform and the presence of one or more occlusions (silences) in the relevant part of the spectrogram. The approximant variant is identified by continuous formants throughout the duration, sometimes accompanied by a lowered F3. Tokens that remained ambiguous (<10% of the tokens) were resolved by the first author. An inter-rater reliability test on a subset of the data, using the kripp.alpha() function in the irr package (Gamer et al. 2019), produced a Krippendorff alpha value of 0.85, indicating reliable agreement among all three coders.
We then coded for the following factors. The first is generation, differentiating between homeland, GEN1, and GEN2 speakers. For the homeland speakers, we additionally coded for age group, classifying speakers as either older (39 years old and above) or younger (below 39 years old); this corresponds to the definition of GEN1 and GEN2 heritage speakers, respectively. The factor gender categorizes speakers based on perceived gender (either male or female). The two ethnic orientation measures, eo-id and eo-lg, each has two levels, namely high and low. Finally, two linguistic factors were examined. Tokens were coded for word position (medial onset, word initial, onset cluster, medial coda, coda cluster, and word final) in order to account for the varying positions from which tokens were extracted, as well as to examine the role of word position reported in Rentillo and Nuñez (2011). We included loan and classified tokens as being a Tagalog or English word.7 Tokens in coda cluster positions (n = 218) were realized categorically as approximants and were subsequently excluded from analysis.8
The remaining 2729 tokens were analyzed distributionally and by fitting mixed-effects logistic regression models using the glmer() function of the lme4 package (Bates et al. 2015) in R (R Core Team 2021). Mixed-effects models are ideal for sociolinguistic studies dealing with uneven distributions across factors and factor levels and are able to tease apart the effects of each factor while holding others constant. Regression models were built separately for each comparison group in Table 1.9 For the homeland-only group, the factors tested were age group, gender, word position, and loan. For homeland vs. GEN1 and GEN1 vs. GEN2 comparisons, the factors tested were the same except that generation was included instead of age group. Similarly, for comparisons involving measures of ethnic orientation, the factors tested remained the same except that either eo-id or eo-lg were included instead of generation. For all models, we included interactions between generation (or age group for the homeland-only model) and each of the other factors (gender, word position, and loan) to identify constraint differences between groups. The interaction between loan and word position was also included to examine how patterns regarding word position may vary by loan status; but for the present analysis we are primarily concerned with establishing patterns with respect to generation and therefore focus our discussion on generational trends. All categorical factors were simple coded, which means that output coefficients represent the measure of change in the response for each unit of change in the predictor relative to the reference level (while holding other predictors constant). Finally, by-speaker intercepts were included to account for any speaker idiosyncrasies or outliers. The significance threshold was set at p < 0.05.
3. Results
The overall rate of approximant use in each variety is presented in Table 4. Speakers of the heritage and homeland varieties use the approximant at almost identical rates.
Table 4.
Overall rates of use of the approximant variant between heritage and homeland varieties.
Table 5 provides the distribution of the approximant across the social and linguistic factors, while Table 6 provides the distribution according to the two measures of contact. The intergenerational difference in the heritage variety is apparent: the rate of use of the approximant variant among the GEN2 is double that of GEN1. In contrast, the age-based difference in the homeland variety is relatively small. Meanwhile, the gender-based difference is bigger in the homeland than the heritage variety. While females use the approximant at a higher rate than males in the homeland, the same trend is not apparent in the heritage variety: there is no indication of gender-based differentiation among GEN1 speakers, and among the GEN2, it is the male speakers who use the approximant more than their female peers.
Table 5.
Rates of use of the approximant according to social and linguistic factors (n = 2729).
Table 6.
Rates of use of the approximant according to ethnic orientation, for heritage speakers (n = 1933).
With respect to the linguistic factors, we see consistent distributional patterns in the three varieties. The approximant variant is preferred in both coda contexts, followed by onset cluster, and less preferred in word initial and medial onset environments (the exception is GEN2 speakers, who show categorical use of the approximant in word initial context). With respect to loan status, English loans generally favor the approximant variant while Tagalog words disfavor it.
Finally, the two measures of contact show a consistent pattern whereby high EO (i.e., Filipino- and Tagalog-oriented) speakers demonstrate lower rates of the approximant use than low EO (i.e., Canadian- and English-oriented) speakers. The difference between two groups is greater in the case of language use and preferences.
3.1. Establishing Homeland Patterns
The mixed effects logistic regression model for the homeland-only dataset is shown in Table 7.10 The reference level for each factor is given in the parentheses.
Table 7.
Mixed-effects model for homeland speakers (n = 796). Positive estimate values indicate a favoring environment for the approximant. Significance code: <0.001 ‘***’.
There is no age-based difference in overall rate of use of the approximant in the homeland variety. There are also nonsignificant effects of gender and its interaction with age group. However, there is a main effect of loan as well as an interaction between loan and age group, indicating that the difference between Tagalog and English loans varies between the age groups. A post-hoc analysis of this interaction using TestInteraction() function of the phia package (De Rosario-Martinez 2015) shows even though both age groups show greater use of the approximant in English loans, this effect is greater among younger speakers (older: = 17.7, p < 0.001; younger: = 66.0, p < 0.001). The main effect of word position reaches significance in two comparisons. Medial coda and word final positions demonstrate greater use of the approximant than medial onset position (the position with the lowest rate of approximant use, see Table 5). There is no age-based difference across word position; in other words, the effect of each word position is similar for older and younger homeland speakers.
The lack of main effects of age group and gender has established that in the homeland, there is no evidence of on-going change in the rates of use of the approximant variant. The patterns are conditioned by loan status and word position, but only the former shows age-based differentiation. This is evidence of a constraint-related change in the homeland variety.
3.2. Homeland versus GEN1 Patterns
We move on to compare homeland patterns with those of GEN1. Since we are interested in how GEN1 might differ as a result of having long-term exposure to English (the dominant language in Toronto) compared to homeland speakers in general, we collapse older and younger speakers. The results of the mixed effects regression model are presented in Table 8.
Table 8.
Mixed-effects model for homeland and GEN1 speakers (n = 2085). Positive estimate values indicate a favoring environment for the approximant. Significance codes: <0.001 ‘***’; <0.01 ‘**’; <0.05 ‘*’.
The model indicates a nonsignificant effect of generation, indicating that there is no difference between homeland and GEN1 speakers in rates of approximant use. That this difference just misses the significance threshold is an important observation, given how much lower the raw percentage is for GEN1 than Homeland speakers (see Table 5). However, generation shows significant interactions with loan and word position, indicating that the effects of these two linguistic factors differ between homeland and GEN1 speakers. Post-hoc comparisons (Table A1) testing the effect of word position and loan separately for homeland and GEN1 speakers reveal that they show the same types of effects: medial coda and word final contexts show greater use of the approximant compared to medial onsets, and that English loans favor the approximant more than Tagalog words. What differs is the magnitude of the effects: homeland speakers exhibit bigger effects than GEN1 speakers. In sum, homeland and GEN1 speakers do not differ in the rate of use of the approximant variant, but the patterns with respect to the linguistic factors (i.e., constraint hierarchies) suggest ongoing structural changes.
3.3. GEN1 versus GEN2 Patterns
In this section, we show that within the heritage variety, there are generational differences in the rate of use and in the constraint hierarchy. Interpreting these in apparent time will provide additional evidence for the presence of change in the Heritage Tagalog linguistic system. The mixed effects logistic regression model is shown in Table 9.
Table 9.
Mixed-effects model for GEN1 and GEN2 speakers (n = 1852). Positive estimate values indicate a favoring environment for the approximant. Significance codes: <0.001 ‘***’; <0.01 ‘**’; <0.05 ‘*’.
The results indicate a main effect of generation: GEN2 speakers use the approximant at a significantly higher rate than GEN1 speakers. Neither gender nor its interaction with generation emerges as significant. Crucially, generation again interacts with both word position and loan. This means that the effects of these two linguistic factors differ between GEN1 and GEN2 speakers. Post-hoc analyses (Table A2) looking at the effects of word position and loan for each generation separately reveal that among GEN1 speakers, there is greater rate of use of the approximant in medial coda (Est. = 2.19, p < 0.001) and word final (Est.= 1.78, p < 0.001) context compared to medial onset position. GEN2 speakers similarly exhibit greater use of the approximant in medial coda (Est. = 3.82, p < 0.001) and word final (Est. = 2.08, p < 0.001) contexts, but in contrast to GEN1 speakers, also show greater approximant use in onset cluster (Est. = 1.31, p < 0.001) contexts. Both speaker groups show significant difference between English loans and Tagalog words, with greater use of the approximant in the former compared to the latter (GEN1: Est. = 1.32, p < 0.001; GEN2: Est. = 3.48, p < 0.001). Overall, the multivariate analysis of the heritage speakers reflects a change in progress in the rates of use of the approximant. As with the previous comparison, the two linguistic factors interact with generation, suggesting an intergenerational change in the structure of the grammar as well. However, while we observed a decrease in magnitude between HOM and GEN1 for both linguistic factors’ effects, we see that they both increase between GEN1 and GEN2.
3.4. Ethnic Orientation: Ethnic Identity and Language Use/Preferences
Let us now consider the two ethnic-orientation measures. The first, eo-id, captures self-reported ethnic identity. For this analysis, we fit the heritage speaker data to a model comparing speakers with high and low EO measures (see Table 3). The results are presented in Table 10. There is no main effect of ethnic identity. In other words, being more or less oriented towards Filipino identity does not influence overall rates of use of the approximant variant. Nonetheless, the interaction between eo-id and word position suggests that the effect of word position varies between high and low EO speakers. Post-hoc analyses (Table A3) reveal that for high EO speakers, there is greater use of the approximant variant in medial coda (Est. = 2.04, p < 0.001) and word final (Est. = 1.77, p < 0.001) contexts compared to medial onset contexts. On the other hand, for low EO speakers, there is greater use of the approximant variant in onset cluster (Est. = 1.36, p < 0.001), medial coda (Est. = 3.12, p < 0.001), and word final (Est. = 2.02, p < 0.001) contexts.
Table 10.
Mixed-effects model for heritage speakers (n = 1852), comparing speakers with high EO versus low EO scores for ethnic identity. Positive estimate values indicate a favoring environment for the approximant. Significance codes: <0.001 ‘***’; <0.05 ‘*’.
The second measure, eo-lg, reflects self-reported language use and preferences. For this analysis, we fit the heritage speaker data to a model comparing speakers with high and low language use and preference measures (again see Table 3). The results are in Table 11. This time, we do see a main effect of the eo-lg score: English-oriented speakers (Low EO) favor the use of the approximant compared to Tagalog-oriented speakers (High EO). Moreover, eo-lg interacts with both word position and loan. A post-hoc analysis (Table A4) looking at the effect of word position and loan separately for high and low EO speakers reveal that, compared to medial onset contexts, high EO speakers use the approximant at greater rates in onset cluster (Est. = 0.52, p = 0.02) medial coda (Est. = 2.07, p < 0.001) and word final (Est. = 1.73, p < 0.001) contexts, whereas low EO speakers use the approximant at greater rates only in medial coda (Est. = 3.36, p < 0.001) and word final (Est. = 2.20, p < 0.001) contexts. Both groups show that English loans favor the use of the approximant variant compared to Tagalog words, but this effect is bigger for low EO speakers (Est. = 2.72, p < 0.001; high EO: Est. = 1.52, p < 0.001).
Table 11.
Mixed-effects model for heritage speakers (n = 1852), comparing speakers with high EO versus low EO scores for language use/preferences. Positive estimate values indicate a favoring environment for the approximant. Significance codes: <0.001 ‘***’; <0.01 ‘**’; <0.05 ‘*’.
To review, these results reveal that among heritage speakers, use of the approximant is influenced by language use/preferences but not by ethnic identity. Heritage speakers who report using and or preferring English are more likely to use the approximant variant than those who prefer Tagalog. Additionally, the linguistic constraints operate differently in the two groups, as with the cross-generational comparisons.
4. Discussion
In an effort to differentiate between possible sources of change in heritage language phonology, we analyzed variation and change in the choice between tap/trill versus approximant variants in Tagalog. Using variationist sociolinguistic methodologies, we tested for the influence of social and linguistic factors simultaneously to determine the extent to which overall rates of use of the approximant and the linguistic constraints operate differently across relevant comparison groups. We consider this profile of inter-group differences and similarities to determine whether variation and change in the heritage variety can best be attributed to transfer, identity marking, or internal motivations (either pre- or post-migration)—each of which possesses a unique profile in terms of the combination of social effects.
We begin by reproducing Table 1 as Table 12, adding a row showing the profile for Tagalog, as established by the analyses in Section 3. Tagalog’s profile matches that of transfer. However, Tagalog’s profile also matches internal (post-migration) except in the expectation for language use/preferences. We therefore consider these two processes in an effort to put forward the possibility that there may be an interplay between the two processes.
Table 12.
Profiles of each source of variation and change, according to patterns of inter-group differences showing that Tagalog approximant variation is best matched to transfer from English and internal change (post-migration).
Let us first consider the GEN1 speakers. Despite showing a lower raw rate of approximant use compared to homeland speakers, this difference just misses the significance threshold in the multivariate analysis. However, relying only on rates masks an important change: even though the factors that condition the linguistic variation are the same for homeland and GEN1 speakers, the effect sizes differ. That is, GEN1 speakers show smaller magnitudes, which we can interpret to mean that their use of the (r) is becoming less constrained. Thus, even though both speaker groups are the “same” in rates, they are “different” in constraints. We mark this state of affairs in Table 12 with “?”. This evidence provides partial support for transfer in the GEN1.
Transfer may also explain patterns in GEN2 and among heritage speakers reporting using more English. For the GEN2 speakers, we might attribute these patterns to the quantity of input. It is often the case that input in the heritage language decreases among GEN2 speakers as they become exposed to the ambient language of the host community. This is the case in our data, as EO scores for language use/preferences are generally lower (indicating less use of Tagalog) for GEN2 than GEN1. Thus, GEN2 speakers may acquire different distributional patterns related to Tagalog (r) as well as incorporating distributional patterns for English. Furthermore, since the tap/trill and the approximant variants are not contrastive in Tagalog, there is no communicative pressure to form separate categories for English (ɹ) and Tagalog (r) (cf. MacKay et al. 2001); hence, it is possible that speakers who report using more English may (sometimes) produce English-like approximants when speaking Tagalog. Finally, since transfer has often been reported to operate without the influence of social factors, sociolinguistic indexicality, or identity-marking, it is perhaps not surprising that there is a lack of rate differences between high and low EO (ethnic identity) speakers as well as male and female speakers.
However, again, relying on rates to provide support for transfer ignores the structural patterns that also emerge from the data. That is, the effects of the linguistic constraints, particularly word position, remain robust. If transfer were the sole driver of change, we would expect the role of word position to diminish (because Toronto English (ɹ) does not show distributional constraints), but this is not what we find. Heritage speakers, just like their homeland counterparts, remain affected by linguistic constraints. In fact, the magnitude of the effect (i.e., estimate values) of word position is consistently bigger for GEN2, English-oriented, and even Canadian-oriented heritage speakers. It appears then that heritage speakers’ production of (r) is still very much influenced by structural properties of Tagalog despite having greater contact with English. Thus, in addition to transfer, we must also consider the possibility of a language-internal development. That is, from one generation to the next, the Tagalog tap/trill variants are being lenited to approximants at higher rates (internal change), in addition to some being replaced by English [ɹ] (transfer).
The approximant variant consistently occurs more frequently in coda positions. Given the cross-linguistic tendency for rhotics in onsets to be more consonant-like, but more vowel-like in rhymes (Howell 1991), this result is not surprising. Moreover, the results presented here show the approximant variant—the lenited form—is favored in medial coda and word final contexts, in line with previous studies showing that lenition processes are more frequent in coda contexts (Kirchner 1998; Rennicke 2015); but crucially, we also find evidence of the approximant spreading to onset clusters. This further bolsters the possibility that the change we see is due, at least in part, to language-internal motivation.
The variation in Tagalog (r) may be interpreted in the same way as Rennicke’s (2015) analysis of Brazilian Portuguese: the synchronic variation and the increased use of the approximant reflect a lenition change in progress. Following Flores and Rinke (2020, p. 25), who argue that “heritage speakers may boost and further develop tendencies of language (internal) evolution inherent to variable phenomena”, we argue that the process of lenition is amplified by the GEN2 speakers and the spread of the approximant variant to onset cluster contexts may be interpreted as advancing the internal development (cf. Rinke et al. 2018). Accordingly, heritage speakers are leading a change that may eventually appear in the homeland (or is present there to a lesser degree). This supports Polinsky and Scontras’ (2020, p. 51) view that “heritage speakers as a group may offer a snapshot of change that normally spans several generations … they can allow us to observe a diachronic change within a single generation.” Also, we echo Flores and Rinke (2020) that although reduced input may trigger the behavior, it is nonetheless an underlyingly language-internal process.
This then raises the question of how lenited forms spread over time. Sebregts (2014, p. 187, citing Pierrehumbert 2001) suggests that
[a]s these slightly lenited productions enter the set of exemplars of both the speaker and the listener, they shift the distribution of exemplars ever so slightly in the direction of more lenited realisations. Assuming that a lenition bias forms part of any speaker’s speech performance, then over time more and more lenited realisations of a category will become its central values.
It may be that when interacting in Tagalog, GEN2 speakers, and those who report using English more often, are exposed more to lenited variants (i.e., approximants) and may not have access to as rich a set of input as their homeland counterparts. Therefore, approximant variants overtake tap/trill variants, and overtime, spread in the community.
Rhotics in many languages have a wide range of phonetic realizations, some more articulatorily complex than others. It is thus reasonable to expect language-internal variation inherent to the rhotic system, and we need not attribute it to cross-linguistic influence (Kupisch 2020). This argument implies that the approximant variant is already part of the Tagalog system rather than being introduced through contact (with English), as argued in previous studies. Indeed, Chen et al. (2016, p. 614) acknowledge the possibility that there may also be non-contact explanations, stating that “children speaking languages with tap and trill sometimes use the approximant.” Future studies could substantiate this claim with historical data showing that Tagalog (r) has historically had approximant realizations in addition to the canonical tap and trill realizations.
The preceding discussion suggests that contact languages may show signs of both transfer and internal change. This is a profile not yet captured in our framework. The dichotomy between externally and internally motivated changes has been challenged (cf. Dorian 1993) and indeed, language-external (i.e., contact-related) and language-internal factors may interact and lead to different linguistic outcomes in heritage languages. For example, Rao (2014) reported that heritage speakers with more use of Spanish (a contact-related factor) produced the oral stop /b/ as an approximant (a case of lenition, a language internal process) at a greater and more target-like rate than heritage speakers that used Spanish less often. This suggests a link between rate of lenition and amount of heritage language use and may explain why we found a difference between Tagalog- and English-oriented heritage speakers. Moreover, in the case of Tagalog (r), the approximant may be either a lenited variant of Tagalog or use of English (ɹ). Similar forms or structures from multiple input sources may lead to their increased use in the contact language (cf. Baptista 2021). Our results therefore support a case of multiple causation, which in turn, might explain why we see rapid changes—within a span of one generation—in the heritage system.
In terms of on-going change, the lack of gender-based differences could mean that the change that we are seeing in the heritage variety is in the early stages (cf. Cheshire 2002) or that it is not prestige-related. The latter seems unlikely, given the status of the variants (see Section 1.3). However, it has been noted that social factors may behave differently in minoritized languages than in dominant Western languages (Stanford and Preston 2009, p. 8), and in language contact situations. Blainey (2013, p. 35), citing examples from regional French varieties, also noted that sociolinguistic variables such as sex, class, ethnic identity may no longer be influential in language use patterns. In heritage language contexts, contact-based factors such as language attitudes may be more important than social factors like gender. In any case, we lack evidence to support Tagalog (r) variation being a product of identity-marking.
As a final point, this study contributes to literature on rhotics and phonology more generally, particularly in analyzing variable patterns in a lesser-studied variety, contributing to the discussion of how rhotics can be recognized by their distributional patterns (cf. Howell 1991). In addition, we have shown that rhotics can undergo rapid changes (cf. Wiese 2001) and that phonetic realizations of rhotics can be heterogeneous without necessarily disrupting synchronic rules or leading to a reorganization of the phonological system (see Chabot 2019). The study has shown that there are no new contexts in which rhotic variants appear in the heritage variety; that is, the approximant variant is also seen across all contexts in the homeland variety. Instead, the variant simply increases in use, particularly in onset cluster position.
5. Conclusions
This study examined patterns in Toronto Heritage Tagalog (r). In considering heritage languages from the perspective of language contact, and by adopting the variationist method, we have proposed and applied a framework to tease apart different sources of variation and change. Here, we have focused on uncovering the processes that underlie change (Thomason 2020, p. 35), and have shown, though a series of intergroup comparisons, that heritage speakers show increased use of the approximant variant, particularly GEN2 speakers and those who are more English-oriented. Based on rates alone, the patterns may be explained by transfer. However, in considering the constraint hierarchy governing the distribution of the variants, a language-internal change by way of lenition is also plausible. We suggest an interplay between external and internal processes of change. Ongoing work, in which the (r) variable is examined in additional heritage languages, will provide scope to replicate this assessment (Stage 2 in Figure 2).
In closing, previous, often experimental, studies on heritage language phonetic variation mainly rely on more controlled utterances (e.g., from word lists, picture naming tasks, reading passages, etc.). Additionally, social factors like age and gender, while controlled for, are generally ignored in explaining variable patterns in favor of other (equally important) factors like onset of bilingualism and language dominance. In an attempt to address these gaps, this paper has shown that a comparative sociolinguistic framework, as further specified here, as well as the analysis of spontaneous speech, may be insightful in better understanding how linguistic, social, and contact-based factors conspire to give rise to variability and change among heritage speakers.
Author Contributions
Conceptualization and methodology were developed by P.U., under N.N.’s supervision. Formal analysis conducted by P.U, under N.N.’s supervision. Both authors collaboratively drafted and edited all sections of the paper; funding acquisition, N.N. All authors have read and agreed to the published version of the manuscript.
Funding
This research was funded by SSHRC grants to N.N., grant numbers 410-2009-2330 and 435-2016-1430.
Institutional Review Board Statement
The study was conducted according to the guidelines of the Declaration of Helsinki, and approved by the Research Ethics Board of The University of Toronto (protocol 24041, approved 30 April 2009).
Informed Consent Statement
Informed consent was obtained from all participants in the study.
Data Availability Statement
The data presented in this study are available on request from N.N. The data are not publicly available due to confidentiality restrictions.
Acknowledgments
We would like to thank Philip Rentillo, Ivan Bondoc, Derek Denis, and Jessamyn Schertz for their insightful feedback during various stages of the project, as well as the anonymous reviewers, whose comments and suggestions further clarified the paper. We acknowledge the many research assistants and volunteers that contribute to the HLVC Project. They are listed at (https://ngn.artsci.utoronto.ca/HLVC/3_2_active_ra.php, https://ngn.artsci.utoronto.ca/HLVC/3_3_former_ra.php).
Conflicts of Interest
The authors declare no conflict of interest.
Appendix A
Table A1.
Post-hoc analysis for HOM vs. GEN1 comparison, evaluating the effect of word position and loan for Homeland and GEN1 speakers separately. Significance code: <0.001 ‘***’.
Table A1.
Post-hoc analysis for HOM vs. GEN1 comparison, evaluating the effect of word position and loan for Homeland and GEN1 speakers separately. Significance code: <0.001 ‘***’.
| Homeland (n = 796) | GEN1 (n = 1289) | |||||||
|---|---|---|---|---|---|---|---|---|
| Est | SE | z | Pr(>|z|) | Est | SE | z | Pr(>|z|) | |
| (Intercept) | −0.02 | 0.32 | −0.06 | 0.95 | −0.65 | 0.18 | −3.59 | <0.00 *** |
| word position (vs. medial onset) | ||||||||
| word initial | 0.34 | 0.46 | 0.73 | 0.46 | 0.30 | 0.36 | 0.83 | 0.40 |
| onset cluster | 0.09 | 0.25 | 0.35 | 0.72 | 0.19 | 0.20 | 0.95 | 0.34 |
| medial coda | 2.60 | 0.38 | 6.75 | <0.001 *** | 2.16 | 0.25 | 8.60 | <0.001 *** |
| word final | 3.52 | 0.50 | 6.99 | <0.001 *** | 1.74 | 0.23 | 7.70 | <0.001 *** |
| loan (vs. Tagalog) | ||||||||
| English | 2.33 | 0.25 | 9.43 | <0.001 *** | 1.44 | 0.18 | 8.22 | <0.001 *** |
Table A2.
Post-hoc analysis for GEN1 vs. GEN2 comparison, evaluating the effect of word position and loan for GEN1 and GEN2 speakers separately. Significance codes: <0.001 ‘***’; <0.01 ‘**’.
Table A2.
Post-hoc analysis for GEN1 vs. GEN2 comparison, evaluating the effect of word position and loan for GEN1 and GEN2 speakers separately. Significance codes: <0.001 ‘***’; <0.01 ‘**’.
| GEN1 (n = 1241) | GEN2 (n = 611) | |||||||
|---|---|---|---|---|---|---|---|---|
| Est. | SE | z | Pr(>|z|) | Est. | SE | z | Pr(>|z|) | |
| (Intercept) | −0.50 | 0.18 | −2.76 | 0.01 ** | 2.01 | 0.46 | 4.41 | <0.001 *** |
| word position (vs. medial onset) | ||||||||
| onset cluster | 0.20 | 0.20 | 1.01 | 0.31 | 1.31 | 0.38 | 3.47 | <0.001 *** |
| medial coda | 2.19 | 0.25 | 8.66 | <0.001 *** | 3.82 | 0.83 | 4.59 | <0.001 *** |
| word final | 1.78 | 0.23 | 7.78 | <0.001 *** | 2.08 | 0.66 | 3.15 | <0.001 *** |
| loan (vs. Tagalog) | ||||||||
| English | 1.42 | 0.18 | 8.00 | <0.001 *** | 3.48 | 0.32 | 10.79 | <0.001 *** |
Table A3.
Post-hoc analysis for eo-id (ethnic identity) comparison, evaluating the effect of word position for High EO (Filipino-oriented) and Low EO (Canadian-oriented) heritage speakers separately. Significance code: <0.001 ‘***’.
Table A3.
Post-hoc analysis for eo-id (ethnic identity) comparison, evaluating the effect of word position for High EO (Filipino-oriented) and Low EO (Canadian-oriented) heritage speakers separately. Significance code: <0.001 ‘***’.
| High EO (n = 892) | Low EO (n = 960) | |||||||
|---|---|---|---|---|---|---|---|---|
| Est. | SE | z | Pr(>|z|) | Est. | SE | z | Pr(>|z|) | |
| (Intercept) | −0.12 | 0.27 | −0.44 | 0.66 | 0.45 | 0.49 | 0.91 | 0.36 |
| word position (vs. medial onset) | ||||||||
| onset cluster | −0.10 | 0.22 | −0.44 | 0.66 | 1.36 | 0.26 | 5.16 | <0.001 *** |
| medial coda | 2.04 | 0.31 | 6.64 | <0.001 *** | 3.12 | 0.41 | 7.59 | <0.001 *** |
| word final | 1.77 | 0.29 | 6.18 | <0.001 *** | 2.02 | 0.33 | 6.15 | <0.001 *** |
| loan (vs. Tagalog) | ||||||||
| English | 1.85 | 0.21 | 8.92 | <0.001 *** | 2.30 | 0.24 | 9.64 | <0.001 *** |
Table A4.
Post-hoc analysis for eo-lg (language use/preferences) comparison, evaluating the effect of word position and loan for High EO (Tagalog-oriented) and Low EO (English-oriented) speakers separately. Significance codes: <0.001 ‘***’; <0.05 ‘*’.
Table A4.
Post-hoc analysis for eo-lg (language use/preferences) comparison, evaluating the effect of word position and loan for High EO (Tagalog-oriented) and Low EO (English-oriented) speakers separately. Significance codes: <0.001 ‘***’; <0.05 ‘*’.
| High EO (n = 984) | Low EO (n = 868) | |||||||
|---|---|---|---|---|---|---|---|---|
| Est. | SE | z | Pr(>|z|) | Est. | SE | z | Pr(>|z|) | |
| (Intercept) | −0.47 | 0.26 | −1.80 | 0.07 | 1.02 | 0.44 | 2.34 | 0.02 * |
| word position (vs. medial onset) | ||||||||
| onset cluster | 0.52 | 0.23 | 2.29 | 0.02 * | 0.49 | 0.25 | 1.91 | 0.06 |
| medial coda | 2.07 | 0.29 | 7.16 | <0.001 *** | 3.36 | 0.50 | 6.72 | <0.001 *** |
| word final | 1.73 | 0.26 | 6.74 | <0.001 *** | 2.20 | 0.41 | 5.35 | <0.001 *** |
| loan (vs. Tagalog) | ||||||||
| English | 1.52 | 0.20 | 7.54 | <0.001 *** | 2.72 | 0.25 | 10.94 | <0.001 *** |
Notes
| 1 | Schachter and Otanes (1972) do not provide acoustic data to support this. |
| 2 | The term conyo is derived from coño, a pejorative Spanish term for the female genitalia and commonly used as a curse word in many Spanish-speaking nations. While we understand that this term is used frequently in metalinguistic commentary, we also acknowledge the harmful connotations of this term. |
| 3 | Regarding Stage 2, the HLVC Project has on-going analysis of (r) in Toronto Heritage Russian, Italian, and Portuguese. As for Stage 4, English has only the approximant so comparison of variability is vacuous. |
| 4 | One homeland speaker was recorded using Cleanfeed (and supervised using Zoom) during the COVID-19 pandemic. |
| 5 | In the case of shorter interviews (for two heritage speakers), token extraction began earlier. |
| 6 | Speakers with the median score were grouped to produce the most even number of tokens between the groups. |
| 7 | We initially included Spanish as one of the levels for loan. However, our preliminary analysis revealed that Tagalog words and Spanish loans patterned the same and were therefore collapsed into one category. |
| 8 | Tokens of (r) in coda clusters are always English loanwords such as (credit) card; coda clusters do not occur in native Tagalog words (Schachter and Otanes 1972, p. 28). |
| 9 | We did not build separate model comparing males and females since the factor gender is tested in all the other models. |
| 10 | We are unable to examine the interaction between loan and word position because there are no tokens of Tagalog (r) in word final position in the Homeland data. |
| 11 | Note that statistical models related to heritage speakers (GEN1 vs. GEN2, High vs. Low EO speakers) exclude “word initial” tokens (n = 81) because these tokens for GEN2 speakers are categorically realized as approximant. Thus, in the following sections, only four levels of word position are compared. |
References
- Amengual, Mark. 2016. Acoustic correlates of the Spanish tap-trill contrast: Heritage and L2 Spanish speakers. Heritage Language Journal 13: 88–112. [Google Scholar] [CrossRef]
- Arceo, Jericho. 2018. Things about Conyo People. Available online: https://www.youtube.com/watch?v=bDZhIA8eodg&t=348s (accessed on 23 May 2020).
- Au, Terry Kit-fong, Janet S. Oh, Leah M. Knightly, Sun-Ah Jun, and Laura F. Romo. 2008. Salvaging a childhood language. Journal of Memory and Language 58: 998–1011. [Google Scholar] [CrossRef] [Green Version]
- Baptista, Marlyse. 2021. Out of many voices, one language. Paper presented at New Ways of Analyzing Variation 49, Austin, TX, USA, October 23; Austin: University of Texas at Austin. [Google Scholar]
- Barry, William J. 1997. Another R-tickle. Journal of the International Phonetic Association 27: 35–45. [Google Scholar] [CrossRef]
- Bates, Douglas, Martin Maechler, Ben Bolker, and Steven Walker. 2015. Fitting linear mixed-effects models using lme4. Journal of Statistical Software 67: 1–48. [Google Scholar] [CrossRef]
- Blainey, Darcie. 2013. First to Come, Last to Go: Phonological Change and Resilience in Louisiana Regional French. Doctoral dissertation, Tulane University, New Orleans, LA, USA. [Google Scholar]
- Boersma, Paul, and David Weenink. 2021. Praat: Doing Phonetics by Computer, Version 6.1.50. Available online: http://www.praat.org/ (accessed on 20 June 2021).
- Borlongan, Ariane M. 2015. Conyo English: Explorations of Philippine English sociolects. Paper presented at the 21st Conference of the International Association for World Englishes, Instanbul, Turkey, October 8–10. [Google Scholar]
- Bouchard, Marie-Eve. 2019. Ongoing change in post-independence São Tomé: The use of the rhotics as a marker of national identity among young speakers of Santomean Portuguese. Language Variation and Change 31: 21–42. [Google Scholar] [CrossRef]
- Bradley, Travis G. 2006. Phonetic realizations of /sr/ clusters in Latin American Spanish. In Selected Proceedings of the 2nd Conference on Laboratory Approaches to Spanish Phonetics and Phonology. Edited by Manuel Díaz-Campos. Somerville: Cascadilla Proceedings Project, pp. 1–13. [Google Scholar]
- Carballo, Gloria, and Elvira Mendoza. 2000. Acoustic characteristics of trill productions by groups of Spanish children. Clinical Linguistics & Phonetics 14: 587–601. [Google Scholar]
- Chabot, Alex. 2019. What’s wrong with being a rhotic? Glossa 4: 38. [Google Scholar] [CrossRef] [Green Version]
- Chang, Charles B., Yao Yao, Erin F. Haynes, and Russel Rhodes. 2011. Production of phonetic and phonological contrasts by heritage speakers of Mandarin. Journal of the Acoustical Society of America 129: 3964–80. [Google Scholar] [CrossRef] [PubMed] [Green Version]
- Chen, Rachelle Kay, B. May Bernhardt, and Joseph P. Stemberger. 2016. Phonological assessment and analysis tools for Tagalog: Preliminary development. Clinical Linguistics and Phonetics 30: 599–627. [Google Scholar] [CrossRef]
- Cheshire, Jenny. 2002. Sex and gender in variationist research. In The Handbook of Language Variation and Change. Edited by J. K. Chambers, Peter Trudgill and Natalie Schilling-Estes. Oxford: Blackwell, pp. 423–43. [Google Scholar]
- Cook, Vivian. 2003. Effects of the Second Language on the First. Buffalo: Multilingual Matters Ltd. [Google Scholar]
- Crowley, Terry, and Claire Bowern. 2010. An Introduction to Historical Linguistics. New York: Oxford University Press. [Google Scholar]
- Cummings Ruiz, Laura D., and Silvina Montrul. 2020. Assessing rhotic production by bilingual Spanish speakers. Languages 5: 51. [Google Scholar] [CrossRef]
- Cyrino, Sonia Maria Lazzarini, Maria Eugênia L. Duarte, and Mary Aizawa Kato. 2000. Visible subjects and invisible clitics in Brazilian Portuguese. In Brazilian Portuguese and the null Subject Parameter. Edited by Mary A. Kato and Esmeralda Vailati Negrão. Frankfurt: Iberoamericana, pp. 55–73. [Google Scholar]
- de Leeuw, Esther. 2019. Phonetic attrition. In The Oxford Handbook of Language Attrition. Edited by Monika S. Schmid and Barbara Köpke. Oxford: Oxford University Press, pp. 204–17. [Google Scholar]
- de Leeuw, Esther, Aurela Tusha, Hui Zhao, Kyle Helke, and Alice Greenfield. 2018. A case of extreme phonetic attrition in the Germanic rhotic. In Mind Matters in SLA. Edited by Clare Wright, Thorsten Piske and Martha Young-Scholten. Bristol: Multilingual Matters, pp. 162–82. [Google Scholar]
- De Rosario-Martinez, Helios. 2015. Package ‘phia’. Available online: https://cran.r-project.org/web/packages/phia/phia.pdf (accessed on 28 August 2020).
- Dorian, Nancy. 1993. Internally and externally motivated change in language contact settings: Doubts about the dichotomy. In Historical linguistics: Problems and Perspectives. Edited by Charles Jones. London: Routledge, pp. 131–55. [Google Scholar]
- Eckert, Penelope. 2000. Linguistic Variation as Social Practice. Oxford: Blackwell. [Google Scholar]
- Face, Timothy L. 2006. Intervocalic rhotic pronunciation by adult learners of Spanish as a second language. In Selected Proceedings of the 7th Conference on the Acquisition of Spanish and Portuguese as First and Second Languages. Edited by Carol A. Klee and Timothy L. Face. Somerville: Cascadilla Proceedings Project, pp. 47–58. [Google Scholar]
- Flege, James. E. 1987. The production of “new” and “similar” phones in a foreign language: Evidence for the effect of equivalence classification. Journal of Phonetics 15: 47–65. [Google Scholar] [CrossRef]
- Flege, James E. 1995. Second language speech learning: Theory, findings, and problems. In Speech Perception and Linguistic Experience: Issues in Cross-Language Research. Edited by Winifred Strange. Timonium: York Press, pp. 233–72. [Google Scholar]
- Flege, James E., and James Hillenbrand. 1984. Limits on phonetic accuracy in foreign language speech production. The Journal of the Acoustical Society of America 76: 708–21. [Google Scholar] [CrossRef]
- Flores, Cristina, and Esther Rinke. 2020. The relevance of language-internal variation in predicting heritage language grammars. Bilingualism: Language and Cognition 23: 25–26. [Google Scholar] [CrossRef]
- Fowler, Carol A., Valery Sramko, David J. Ostry, Sarah A. Rowland, and Pierre Hallé. 2008. Cross language phonetic influence on the speech of French-English bilinguals. Journal of Phonetics 36: 649–63. [Google Scholar] [CrossRef] [Green Version]
- Gamer, Matthias, Jim Lemon, Ian Fellows, and Puspendra Singh. 2019. Package ‘irr’. Available online: https://cran.r-project.org/web/packages/irr/irr.pdf#page.16 (accessed on 20 February 2021).
- Giles, Howard, and Patricia Johnson. 1987. Ethnolinguistic identity theory: A social psychological approach to language maintenance. International Journal of the Sociology of Language 68: 69–99. [Google Scholar] [CrossRef]
- Godson, Linda. 2004. Vowel production in the speech of Western Armenian heritage speakers. Heritage Language Journal 2: 44–69. [Google Scholar] [CrossRef]
- Grosjean, François. 1989. “Neurolinguists, beware!” The bilingual is not two monolinguals in one person. Brain and Language 36: 3–15. [Google Scholar] [CrossRef]
- Hay, Jennifer, and Katie Drager. 2007. Sociophonetics. Annual Review of Anthropology 36: 89–103. [Google Scholar] [CrossRef]
- Henriksen, Nicholas C., and Erik W. Willis. 2010. Acoustic characterization of phonemic trill production in Jerezano Andalusion Spanish. In Selected Proceedings of the 4th Conference of Laboratory Approaches to Spanish Phonology. Edited by Marta Ortega-Llebaria. Sommerville: Cascadilla Proceedings Project, pp. 115–27. [Google Scholar]
- Hickey, Raymond. 2012. Internally and externally motivated language change. In The Handbook of Historical Sociolinguistics. Edited by Juan Manuel Hernández-Compoy and Juan Camilo Conde-Silvestre. Malden: Blackwell, pp. 387–407. [Google Scholar]
- Hoffman, Michol F., and James A. Walker. 2010. Ethnolects and the city: Ethnic orientation and linguistic variation in Toronto English. Language Variation and Change 22: 37–67. [Google Scholar] [CrossRef]
- Howell, Robert B. 1991. Old English Breaking and Its Germanic Analogues. Tübingen: Max Niemeyer. [Google Scholar]
- Kang, Kyoung-Ho, and Susan G. Guion. 2006. Phonological systems in bilinguals: Age of learning effects on the stop consonant systems of Korean-English bilinguals. Journal of the Acoustical Society of America 119: 1672–83. [Google Scholar] [CrossRef]
- Kang, Yoonjung, and Naomi Nagy. 2016. VOT merger in Heritage Korean in Toronto. Language Variation and Change 28: 249–272. [Google Scholar] [CrossRef]
- Kehoe, Margaret. 2018. The development of rhotics: A comparison of monolingual and bilingual children. Bilingualism: Language and Cognition 21: 710–31. [Google Scholar] [CrossRef] [Green Version]
- Kelly, Philip. 2014. Understanding Intergenerational Social Mobility: Filipino Youth in Canada. Institute for Research on Public Policy: Study 45. Montreal: Institute for Research on Public Policy. [Google Scholar]
- Kirchner, Robert Martin. 1998. An Effort-based Approach to Consonant Lenition. Doctoral dissertation, University of California Los Angeles, Los Angeles, CA, USA. [Google Scholar]
- Kissling, Elizabeth M. 2018. An exploratory study of Heritage Spanish rhotics: Addressing methodological challenges of heritage language phonetics research. Heritage Language Journal 15: 25–70. [Google Scholar] [CrossRef]
- Kupisch, Tanja. 2020. Towards modelling heritage speakers’ sound systems. Bilingualism: Language and Cognition 23: 29–30. [Google Scholar] [CrossRef]
- Labov, William. 1966. The Social Stratification of English in New York City. Washington, DC: Center for Applied Linguistics. [Google Scholar]
- Labov, William. 1972. Sociolinguistic Patterns. Philadelphia: University of Pennsylvania Press. [Google Scholar]
- Labov, William. 1982. Building on empirical foundations. In Perspectives on Historical Linguistics. Edited by Winfred P. Lehmann and Yakov Malkiel. Amsterdam: John Benjamins, pp. 17–92. [Google Scholar]
- Labov, William. 1984. Research methods of the project on linguistic change and variation. In Language in Use: Readings in Sociolinguistics. Edited by John Baugh and Joel Sherzer. Englewood Cliffs: Prentice Hall, pp. 28–53. [Google Scholar]
- Labov, William. 1989. The child as linguistic historian. Language Variation and Change 1: 85–97. [Google Scholar] [CrossRef] [Green Version]
- Labov, William. 2007. Transmission and diffusion. Language 83: 344–87. [Google Scholar] [CrossRef] [Green Version]
- Ladefoged, Peter, and Ian Maddieson. 1996. The Sounds of the World’s Languages. Oxford: Blackwell. [Google Scholar]
- Lesho, Marivic. 2018. Philippine English (Metro Manila acrolect). Journal of the International Phonetic Association 48: 357–70. [Google Scholar] [CrossRef]
- Lindau, Mona. 1985. The story of R. In Phonetics Linguistics. Edited by Victoria A. Fromkin. Orlando: Academic Press, pp. 157–68. [Google Scholar]
- Lleó, Conxita. 2018. Aspects of the phonology of Spanish as a heritage language: From incomplete acquisition to transfer. Bilingualism: Language and Cognition 21: 732–47. [Google Scholar] [CrossRef]
- MacKay, Ian R. A., James E. Flege, Thorsten Piske, and Carlo Schirru. 2001. Category restructuring during second-language speech acquisition. Journal of the Acoustical Society of America 110: 516–28. [Google Scholar] [CrossRef]
- Mais, Julia Kathleen. 2012. Behind the Resume: Influences on the Educational and Employment Trajectories of 1.5 and Second Generation Filipino-Canadians in Vancouver. Master’s thesis, York University, Toronto, ON, Canada. [Google Scholar]
- Major, Roy C. 1992. Losing English as a first language. The Modern Language Journal 76: 190–208. [Google Scholar] [CrossRef]
- Mayr, Robert, Sacha Price, and Ineke Mennen. 2012. First language attrition in the speech of Dutch-English bilinguals: The case of monozygotic twin sisters. Bilingualism: Language and Cognition 15: 687–700. [Google Scholar] [CrossRef]
- McLeod, Sharynne. 2007. The International Guide to Speech Acquisition. Clifton Park: Thomson Delmar Learning. [Google Scholar]
- Menke, Mandy R. 2018. Development of Spanish rhotics in Spanish-English bilingual children in the United States. Journal of Child Language 45: 788–806. [Google Scholar] [CrossRef] [PubMed]
- Nagy, Naomi. 2009. Heritage Language Variation and Change in Toronto. Available online: https://ngn.artsci.utoronto.ca/HLVC/ (accessed on 24 August 2021).
- Nagy, Naomi. 2011. A multilingual corpus to explore variation in language contact situations. Rassegna Italiana di Linguistica Applicata 43: 65–84. [Google Scholar]
- Nagy, Naomi. 2015. A sociolinguistic view of null subjects and VOT in Toronto heritage languages. Lingua 164: 309–327. [Google Scholar] [CrossRef]
- Nagy, Naomi, and Alexei Kochetov. 2013. Voice onset time across the generations: A cross-linguistic study of contact-induced change. In Multilingualism and Language Diversity in Urban Areas. Acquisition, Identities, Space, Education. Edited by Peter Siemund, Ingrid Gogolin, Monika Edith Schulz and Julia Davydova. Amsterdam: John Benjamins, pp. 19–38. [Google Scholar]
- Nagy, Naomi, Joanna Chociej, and Michol F. Hoffman. 2014. Analyzing ethnic orientation in the quantitative sociolinguistic paradigm. Language & Communication 35: 9–26. [Google Scholar]
- Noels, Kimberly. 2014. Language variation and ethnic identity: A social psychological perspective. Language & Communication 35: 88–96. [Google Scholar]
- Oh, Janet, and Terry Kit-fong Au. 2005. Learning Spanish as a heritage language: The role of sociocultural background variables. Language, Culture, and Curriculum 18: 229–41. [Google Scholar] [CrossRef]
- Oh, Janet S., Sun-Ah Jun, Leah M. Knightly, and Terry Kit-fong Au. 2003. Holding on to childhood language memory. Cognition 86: B53–B64. [Google Scholar] [CrossRef]
- Pierrehumbert, Janet B. 2001. Exemplar dynamics: Word frequency, lenition and contrast. In Frequency and the Emergence of Linguistic Structure. Edited by Joan Bybee and Paul Hopper. Amsterdam: John Benjamins, pp. 137–57. [Google Scholar]
- Polinsky, Maria, and Gregory Scontras. 2020. A roadmap for heritage language research. Bilingualism: Language and Cognition 23: 50–55. [Google Scholar] [CrossRef]
- Poplack, Shana, and Marjory Meechan. 1998. How languages fit together in code-mixing. International Journal of Bilingualism 2: 127–38. [Google Scholar] [CrossRef]
- Poplack, Shana, and Sali Tagliamonte. 2001. African American English in the Diaspora. Oxford: Blackwell. [Google Scholar]
- Poplack, Shana, and Stephen Levey. 2010. Contact-induced grammatical change. In Language and Space: An International Handbook of Linguistic Variation. Edited by Peter Auer and Jürgen Erich Schmidt. Berlin: Mouton de Gruyter, pp. 391–419. [Google Scholar]
- R Core Team 2021. R: A Language and Environment for Statistical Computing. Available online: http://www.R-project.org/ (accessed on 10 January 2021).
- Rao, Rajiv. 2014. On the status of the phoneme /b/ in heritage speakers of Spanish. Sintagma 26: 37–54. [Google Scholar]
- Rennicke, Iiris. 2015. Variation and Change in the Rhotics of Brazilian Portuguese. Doctoral dissertation, University of Helsinki, Helsinki, Finland. [Google Scholar]
- Rentillo, Philip, and Jan Ralph Nuñez. 2011. Transfer effects of English to Tagalog phonology among Filipino college students. Paper presented at the Globalization and localization in Computer-Assisted language Learning Conference, Manila, Philippines, October 27–29. [Google Scholar]
- Reyes, Angela. 2017. Inventing postcolonial elites: Race, language, mix, excess. Journal of Linguistic Anthropology 27: 210–31. [Google Scholar] [CrossRef]
- Riguer, Katherine L., and Kristel Ann B. Panganiban. 2004. The Study of Phonemic Acquisition Among Normally Developing Filipino Children Aged 2–5 Years Old. Undergraduate thesis, University of the Philippines, Quezon City, Philippines. [Google Scholar]
- Rinke, Esther, Cristina Flores, and Pilar Barbosa. 2018. Null objects in the spontaneous speech of monolingual and bilingual speakers of European Portuguese. Probus 30: 93–119. [Google Scholar] [CrossRef]
- Roberts, Julie. 1994. Acquisition of Variable Rules: (-t,d) Deletion and (ing) Production in Preschool Children. Doctoral dissertation, University of Pennsylvania, Philadelphia, PA, USA. [Google Scholar]
- Rothman, Jason, and Jeanine Treffer-Daller. 2014. A prolegomenon to the construct of the native speaker: Heritage speaker bilinguals are natives too! Applied Linguistics 35: 93–98. [Google Scholar] [CrossRef] [Green Version]
- Schachter, Paul, and Fe Otanes. 1972. Tagalog Reference Grammar. Berkeley: University of California Press. [Google Scholar]
- Sebregts, Koen. 2014. The Sociophonetics and Phonology of Dutch r. Doctoral dissertation, Utrecht University, Utrecht, The Netherlands. [Google Scholar]
- Silva, Peggy-Anne S. 1985. The Acquisition of Sounds in 153 Filipino Subjects between Ages of Two Years and Fourth Months and Four Years and Eleven Months. Undergraduate Thesis, University of the Philippines, Quezon City, Philippines. [Google Scholar]
- Smith, Jennifer, Mercedes Durham, and Liane Fortune. 2009. Universal, dialect-specific pathways of acquisition: Caregivers, children, and t/d deletion. Language Variation and Change 21: 69–95. [Google Scholar] [CrossRef] [Green Version]
- Stanford, James, and Dennis Preston. 2009. Variation in Indigenous Minority Languages. Philadelphia: John Benjamins. [Google Scholar]
- Thomason, Sarah G. 2020. Contact explanations in linguistics. In The Handbook of Language Contact. Edited by Raymond Hickey. Hoboken: Wiley Blackwell, pp. 33–49. [Google Scholar]
- Ulbrich, Christiane, and Mikhail Ordin. 2014. Can L2-English influence L1-German? The case of post-vocalic /r/. Journal of Phonetics 45: 26–42. [Google Scholar] [CrossRef]
- Wiese, Richard. 2001. The unity and variation of (German) /r/. In ‘r-atics: Sociolinguistic, Phonetic and Phonological Characteristics of /r/. Edited by Hans Van de Velde and Roeland van Hout. Brussels: Etudes & Travaux, pp. 11–26. [Google Scholar]
- Wittenburg, Peter, Hennie Brugman, Albert Russel, Alex Klassmann, and Han Sloetjes. 2006. ELAN: A Professional Framework for Multimodality Research. In Proceedings of Fifth International Conference on Language Resources and Evaluation. Edited by Nicoletta Calzolari, Khalid Choukri, Aldo Gangemi, Bente Maegaard, Joseph Mariani, Jan Odijk and Daniel Tapias. Genoa: European Language Resources Association, pp. 1556–59. [Google Scholar]
- Zampini, Mary L., and Kerry P. Green. 2001. The voicing contrast in English and Spanish: The relationship between perception and production. In One Mind, Two Languages: Bilingual Language Processing. Edited by Janet Nicol. Oxford: Blackwell, pp. 23–48. [Google Scholar]
Publisher’s Note: MDPI stays neutral with regard to jurisdictional claims in published maps and institutional affiliations. |
© 2021 by the authors. Licensee MDPI, Basel, Switzerland. This article is an open access article distributed under the terms and conditions of the Creative Commons Attribution (CC BY) license (https://creativecommons.org/licenses/by/4.0/).