1. Introduction
Airports serve as both an origin and a destination for air travel. Compared with operation aloft, aircraft are prone to congestion on the airport surface due to the restriction of the ground areas, resulting in flight delays and spreading to other processes of flight operation [
1]. The controlling workload and security risk will increase when a large number of aircraft operate at the same time. With the increasing complexity of the flight zone which contains runways, taxiways, and gates, the efficiency of ground movement scheduling has become another restriction on airport capacity [
2]. Reconstruction or expansion of the surface structure requires a lot of time, manpower, and material resources, although it can effectively relieve the current predicament. Therefore, the problem of airport ground movement optimization has attracted many scholars to put forward reasonable aircraft scheduling strategies that ensure high efficiency and security.
The surface operation of aircraft is a systematic process. For an arrival flight that has just landed, it slows down and leaves the runway from the designated fast lane, and taxis to the designated gate. For a departure one, it pushes back and starts up first, then taxis to wait outside the designated runway, and finally enters the runway and accelerates until leaving the ground. Each step above needs to be carried out under the command of the controller [
3].
Currently, the available research on surface operation scheduling can be divided into single and multi-resource optimization [
4]. The optimization of a single resource is to treat each process of surface operation as independent problems, among which the most involved are gate assignment [
5], taxi path scheduling [
6], speed control [
7,
8], etc. However, some assumptions deviating from the real operation have been made to explore the method, verify the strategy, and simplify the calculation.
Determining the starting or end point of taxiing, gate assignment plays a decisive role in path scheduling [
9], and different pushback delay times may determine different taxiing paths [
10]. Therefore, it is unreasonable to consider one problem completely separately and ignore the other two. Yu, C. firstly proposed the necessity of joint optimization of gate assignment and taxi scheduling [
11]. More and more scholars began to study the scheduling optimization of multi-resources on the surface, and comprehensively consider the above processes [
12,
13]. The range of the feasible region is adjusted through the connection and constraints between multiple processes to obtain a more practical surface scheduling scheme. Especially, the problem of joint scheduling of gates and taxiways is one of the most important and complex topics in surface management [
11].
Table 1 lists articles from 2018 that discuss flight gate assignment and taxiing scheduling.
As mentioned above, there are many different objective functions, with multi-objective models predominating. In terms of solution methods, the heuristic approach is dominant, contributing to solving single- and multi-objective problems. However, there are not many research studies involving joint movement optimization, especially the lack of consideration of these three problems.
The gate assignment problem is to assign gates for all flights to park temporarily. Aircraft will carry out boarding and alighting passengers, refueling, catering, and maintenance at the parking spaces. A variable of the matching degree between aircraft and gate is introduced, and it involves the following three aspects:
The size of assigned gate shall be able to carry the aircraft. Due to the limitation of the area and supporting facilities, some gates cannot accept large aircraft. Although the gates suitable for large aircraft can also accept small aircraft, this assignment strategy should be minimized, otherwise it will cause waste of surface resources and greatly affect efficiency [
28];
The assigned gate shall be as close to the terminal as possible [
19]. In the research of gate assignment, the flight bridge approach rate is one of the most critical indicators. All gates are divided into near and far gates. The aircraft parked at near gates can make passengers pass quickly by the corridor bridge. When the aircraft is parked at remote gates, passengers need to take the ferry. One of the principles of gate assignment is to improve the aircraft bridge approach rate as much as possible;
The assigned gate shall be located in the area of the airline to which the flight belongs as far as possible. Generally, some airlines have the gates they lease or prefer, especially for airlines that take an airport as their base, as well as other large airlines [
29]. Due to the lack of detailed leasing information about gates, we infer their ownership from history statistics by counting the occupancy rate of airlines on each of gates.
The taxiing path scheduling problem is to assign the optimal taxiing path for all aircraft. In this research, the taxiing range is from the runway exit to the apron entrance for arrival aircraft and from the apron exit to the runway entrance for departing aircraft. The indicators to assess a certain route include taxi time [
30], estimated numbers of taxiing conflicts [
31], and turns. Reducing taxi time can alleviate delay and improve operation efficiency. At the same time, given an unchanged engine power, the reduction of time means lower fuel consumption and exhaust emissions [
20]. Less expected taxiing conflicts can reduce the probability of unsafe events and avoid accidents. A decreased number of turns can simplify pilot operations, avoid the deceleration process during turning, and thus improve the operation efficiency. Pushback time delay is to delay the pushback for a period of time after the expected time, so as to prevent the aircraft from stopping to wait or detouring on the taxiway due to collision [
32]. The waiting and detouring will result in additional fuel and severer blockage, also increasing the probability of unsafe events or even accidents.
In addition, it is worth noting that the issue of environmental protection has been widely concerned all over the world. As an important part of the transportation industry, air transport also needs to take measures to reduce exhaust emissions [
17]. However, due to the diversity of surface resources, some factors, such as the impact of taxiing speed, taxiing thrust and other processes on the surface operation, are still ignored in existing related studies [
33].
In order to realize the connection between several problems, bilevel programming is applied, which was initially used to study market competition in an unbalanced economy [
34]. It studies the interaction between two decision-makers with different objectives in an orderly and non-cooperative manner [
35]. The upper-level has the priority, and the lower one responds according to its own interests under the upper-level solution. At present, bilevel programming has been widely applied to solve optimization problems [
36] but is rarely used in air traffic programming, especially surface scheduling optimization. Several related studies have also greatly simplified the problem and model, meaning insufficient reliability in actual operations [
16,
37].
In this research, we propose a framework that integrates three different surface operation optimization problems: gate assignment, taxi path scheduling, and pushback time delay. Bilevel programming and the heuristic algorithm are used to solve the problem. The upper-level programming is used to solve the gate assignment problem, and the lower-level programming contains the two problems of taxi path scheduling and pushback time delay. In order to describe the effect of gate assignment more comprehensively, we consider the wingspan limit, the distance from the gates to the terminal, and the airline to which the gates belong. Additionally, an auxiliary variable is introduced to calculate the fitness of the upper-layer programming through the taxi time obtained by the lower-level in order to reflect the connection between the upper-level and lower-level. The lower-level planning uses the heuristic algorithm and Dijkstra algorithm to obtain the scheme with the shortest taxiing time and the least number of conflicts and calculates the optimized fuel consumption and four kinds of exhaust emissions. Finally, we conduct experiments in three typical experimental scenarios of Pudong Airport, design an experimental control group to simulate the historical actual operation, and compare the results before and after optimization. The results show that in different experimental scenarios, the optimization effects of upper-level planning and lower-level planning are different. The proposed framework can improve the effects of gate assignment, while reducing taxi time, number of collisions, fuel consumption, and exhaust emissions.
This research contributes surface scheduling optimization by proposing a joint ground movement scheduling framework based on bilevel programming. The framework incorporates multiple technologies including gate assignment, taxi scheduling, and pushback time delay to comprehensively consider the interaction of different scheduling processes. This helps to expand the scope of the feasible area, reduce the decision-making steps, and make the attempt for integrated scheduling of airport operation. Another contribution of this research is that we designed the method for optimization according to the idea of general bilevel programming and heuristic algorithm by introducing an auxiliary variable and the calculation of matching. At the same time, the concepts of safety, efficiency, as well as environmental concerns are all reflected in the framework.
The remainder of this paper is organized as follows. In
Section 2, we describe the experimental data and model formulas. In
Section 3, the preparation and conduct of the experiment are introduced followed by contrast results and discussions. Finally,
Section 4 presents the conclusion of the work and identifies potential research opportunities.
2. Materials and Methods
2.1. Model Formulation
The model is based on the following assumptions:
All other surface resources are available except the area occupied by flights. Ignore the reduction of runway length, occupation of special vehicles or other conditions that make the runway, taxiway, or gates unavailable.
The runways used and take-off/landing time of all flights are known, and the stands of flights that already stop in the airport are known before the time period start.
The aircraft engine thrust is assumed to be constant during taxiing.
2.1.1. Notation and Variables
Notation and variables are as shown in
Table 2:
2.1.2. Objective
The objectives of the upper-level programming model are the minimum operation time difference (auxiliary variable, which is similar to delay and is the difference between the time end taxiing (the block time for arrival flights and departure time for departure flights) and the time start taxiing (the unblock time for departure flights and arrival flights) and the maximum matching of gates and aircraft.
The objectives of the lower-level model are minimum taxi time and minimum potential conflicts:
The taxi time obtained at the lower-level will be used as the parameter for calculating the fitness of the upper-level model.
The objective function is subject to meeting the constraints.
Equations (5) and (6) provide that each flight is assigned to exactly one gate at its arrival time.
Equations (7)–(9) provide that the departure aircraft shall start taxiing no earlier than the estimated departure time and reach the holding point outside the runway no later than the estimated departure time. Additionally, it is required to start taxiing at the estimated landing time for the approaching aircraft. Since the higher priority is the approaching aircraft, the time when it ends taxiing is not restricted.
Equation (10) ensures that the minimum safety time interval shall be maintained between the former and latter flights. The minimum safety separation standards are shown in
Table 3.
2.1.3. Fuel Burn and Emission
The fuel burn and exhaust emissions calculation method recommended by ICAO is used based on the fuel flow rate and emission index under different operating modes in the EEDB. The calculation formula is as follows:
The indexes of some aircraft types when engine operating status is idle are shown in
Table 4.
2.2. Solution Algorithm
One of bilevel programming’s drawbacks is its high complexity, which results in long computation times and the inability to match the needs of actual applications. Although many kinds of optimization algorithms can be used to solve this kind of problem, due to the complexity of bilevel programming design, it is unrealistic to use integer programming, depth search algorithm, breadth search algorithm, or other algorithms to solve this kind of problem, which will take a lot of time. On the contrary, although the heuristic algorithm has the chance to fall into the local optimal solution, in view of its calculation speed, the heuristic algorithm is selected as the solution algorithm [
38].
In this research, a multi-objective bilevel programming method based on the genetic algorithm is designed with a detailed description in Algorithm 1. The Dijkstra algorithm for scheduling the shortest path is explained in Algorithm 2.
| Algorithm 1. Bilevel programming method for joint ground movement optimization for flight |
| Input: | Characteristics of flight () and gates (); airport surface network . |
| Output: | The scheme of gate assignment, taxi path, and pushback delay time for flight . |
| 1 | Initialization: assign a gate for arrival flight and schedule the pushback time for the corresponding departure flight. |
| 2 | Dijkstra algorithm is used to generate shortest path. Calculate the matching degree, taxi time, and potential conflicts. |
| 3 | Search for the optimization with the minimum taxi time and number of conflicts through the iterative of the lower-level. |
| 4 | Calculate matching degree and generate new gate assignment scheme. |
| 5 | If the model does not converge: go to 3. Otherwise: generate the optimization for flight . |
| Algorithm 2. The Dijkstra algorithm for scheduling the shortest path for departure flight |
| Input: | Source node () and airport surface network including nodes and edges. |
| Output: | The shortest path for flight from its source to destination. |
| 1 | Initialization: for each node in , = , = undefined. |
| 2 | Set = 0, is a set of nodes in . |
| 3 | Set = node in with the minimum . |
| 4 | If = : go to 7; otherwise, remove from , go to 5. |
| 5 | For each node adjacent to : . If : set = , = ; remove from ; otherwise, do not update, do not update and . |
| 6 | If is not empty: go to 3; otherwise: go to 7. |
| 7 | Return . |
2.3. Case Airport and Data Sources
After the method is proposed, it is necessary to use appropriate data to verify the reliability of the method. Shanghai Pudong International Airport (hereinafter referred to as Pudong Airport) was chosen as the simulation object of the experiment because of its large number of flights and complex structure.
The grade index in the flying area of Pudong airport is 4F, which means that it can receive large aircraft such as A380s and B747s. Taxiways, aprons, and facilities for various types of aircraft are also available. Four runways are used for civil aviation (16L/34R, 16R/34L, 17L/35R, and 17R/35L) and another one is designated for the test flight. There are three terminals (T1, T2, and satellite hall), nine aprons (No.1-No.8 aprons and satellite aprons, of which No.3, No.4, and No.6 are cargo aprons and the others are passenger aprons), and 320 gates (including 163 terminal gates and 157 distant gates).
Other data we need include the flight historical data, structure of the flying area, aircraft engine parameters, and restrictions and rules of aircraft operating on runways, taxiways, and gates.
The flight historical data were obtained from the Operation Control Center of Pudong Airport, which includes flight number, aircraft type, estimated and actual take-off/landing time, estimated and actual block/unblock time, runway, and gate used. The structure of the flying area can be obtained from the airport design drawing provided by the Aviation Management Office of Pudong airport, which includes the code, location, and classification of the airport runways, taxiways, and gates. The aircraft engine parameters can be found in the EEDB database downloaded from the official website of the European union aviation safety agency, including the fuel flow rate and the emission index of carbon monoxide (CO), hydrocarbon (HC), and nitrogen oxide (NOX) of various types of engines under different engine modes. It is necessary when we want to quantitatively estimate the fuel burn and environmental impact of aviation. In addition, restrictions and rules of aircraft are also required to ensure that the simulation experiment is close to the real operation, which were obtained from the Aeronautical Information Publication published by the Civil Aviation Administration of China, including taxiway operation direction, wingspan limit of the gate, and range of apron, etc.
Digitizing the airport structure and flight operation is an important step when we discuss the ground movement optimization problem (as they have been implemented in [
6]). The most common method is to build an airport model. In this research, we abstract the Pudong airport as a node-edge network, where the runways and taxiways (including the main taxiways, turn-offs, by-pass taxiways, etc.) are abstracted as the edges, and some crucial places (including the entrance and exit of the runways and gates, taxiway crossings, turnings, etc.) are abstracted as the nodes.
Figure 1 depicts the node-edge network of Pudong airport, with the green line encircling the apron for passenger flights and the yellow line encircling the apron for cargo flights, but passenger planes may be assigned to both types of the apron in some situations.
An apron contains multiple gates. The airport information specifies the entrance and exit of some aprons but not all aprons have such provision, which is not conducive to programming. Therefore, we subdivided all aprons into 20 areas based on the existing 9 aprons, each of which is provided with an entrance and an exit. The adjacency matrix is then used to characterize the network. A total of 376 nodes were marked on the basis of
Figure 1, and the distances between them were measured, which reflects in the weight of edges, yielding an adjacency matrix with 376 rows and 376 columns. The matrix below depicts a section with 10 rows and 10 columns.
where the elements represent the distance between the two nodes (unit: meter). In addition, the numbers in black (except 0) indicate that there is a straight segment between the two nodes, the numbers in red indicate that there is a turning segment between the two nodes, the
indicates that the two nodes are not directly connected, and number of 0 indicates the two nodes are the same.
Since the COVID-19 pandemic began to spread after December 2019, resulting in a significant decrease in the number of flights, we decided to use the operation data of Pudong airport from January to June 2019 for the simulation experiment.
In this research, we consider three indicators in the gate assignment problem. The distance between the gates and the terminals can be obtained simply, and the other two require statistics and analysis of data sources.
According to the limit of aircraft wingspan by gates, we set the grade for all parking areas. For example, gate 25 requires that the wingspan of the aircraft shall not exceed 36 m, so it is graded 1. The wingspan of an A320 is 34.1 m and is also graded 1, which means an A320 and gate 25 can be perfectly matched in terms of their size. Similarly, we set the grade for each gate and aircraft. In order to simplify the complexity of the problem, the size of gates and aircraft within a certain span are set to the same grade in this research.
The airlines are also important in gate assignment. We analyze the flights of airlines that operate frequently at Pudong Airport (such as China Eastern Airlines, China Southern Airlines, Air China, Spring Airlines, Juneyao Airline, etc.). If more than 70% of the time at a gate is spent with the flight of the airline, we believe that the gate belongs to the airline. Through these three indicators, we can accurately measure the quality of the gate assignment strategy.
3. Result and Discussion
An average of fifty flights per hour operate at Pudong Airport based on our statistics, close to the number proposed by Xue, D [
39]. Therefore, the typical flight volumes of three operating situations are selected for simulation, which are Idle (20 flights, including 10 arrivals and 10 departures), Normal (50 flights, including 27 arrivals and 23 departures), and Peak (76 flights, including 36 arrivals and 40 departures).
During the simulation experiment, the speed of the aircraft in the straight segment is specified as 8 m/s and in the turning taxiing segment it is 5 m/s [
7].
Although the heuristic method has the advantage of faster computation speed when compared to other algorithms, we cannot ignore its downside of premature convergence. To ensure the algorithm’s performance, Non-dominated Sorting Genetic Algorithm (NSGA-II) was used to acquire a pareto front in multi-objective optimization problems, and the computation speed was improved due to the use of rapid non-dominated sorting. We conducted the following experiment to determine the appropriate iteration number, population size, and probability of crossover and mutation to enable the algorithm to accomplish global optimization and retain high performance [
40]. Take the matching gate and aircraft degree, for example (the calculation of the other objective—time difference—should refer to the results of the lower-level).
Step 1: Assume that the population size, crossover probability, and mutation probability are 200, 0.9, and 0.5, respectively. Set the number of iterations as 10, 50, 100, 200, 300, 400, and 500.
Step 2: Assume that the crossover probability and mutation probability are 0.9 and 0.5, respectively. Set the number of iterations as the best found in step 1. Set the population size as 10, 50, 100, 200, 300, 400, and 500.
Step 3: Assume that the mutation probability is 0.05. Set the number of iterations and population size as the best found in step 1 and step 2. Set the crossover probability range from 0.5 to 1 in 0.05 increments.
Step 4: Set the number of iterations, population size, and crossover probability as the best found in step 1, step 2 and step 3. Set the mutation probability range from 0 to 0.5 in 0.05 increments.
Each set of experiments was repeated ten times and found parameter settings with good convergence performance and short CPU time. The results show that when the population number is 100, the number of iterations is 100, the crossover probability is 0.95, and the mutation probability is 0.05, the convergence performance of the algorithm and the CPU time are acceptable.
Figure 2 shows the curve of optimization and CPU time as the number of iterations and population increases.
Operation results are obtained under three operation situations. Since there is no one solution to make all optimization objectives reach the optimum at the same time, the algorithm generates an optimal solution set. Taking the number of flights in the Peak scenario as an example, the distribution of the Pareto optimal solution generated by upper-level programming is shown in
Figure 3.
The matching of aircraft and gate is taken as the most important index, and the solution with the highest matching in the Pareto optimal solution set is taken as the optimal solution in this problem, which is the point in the lower right corner in
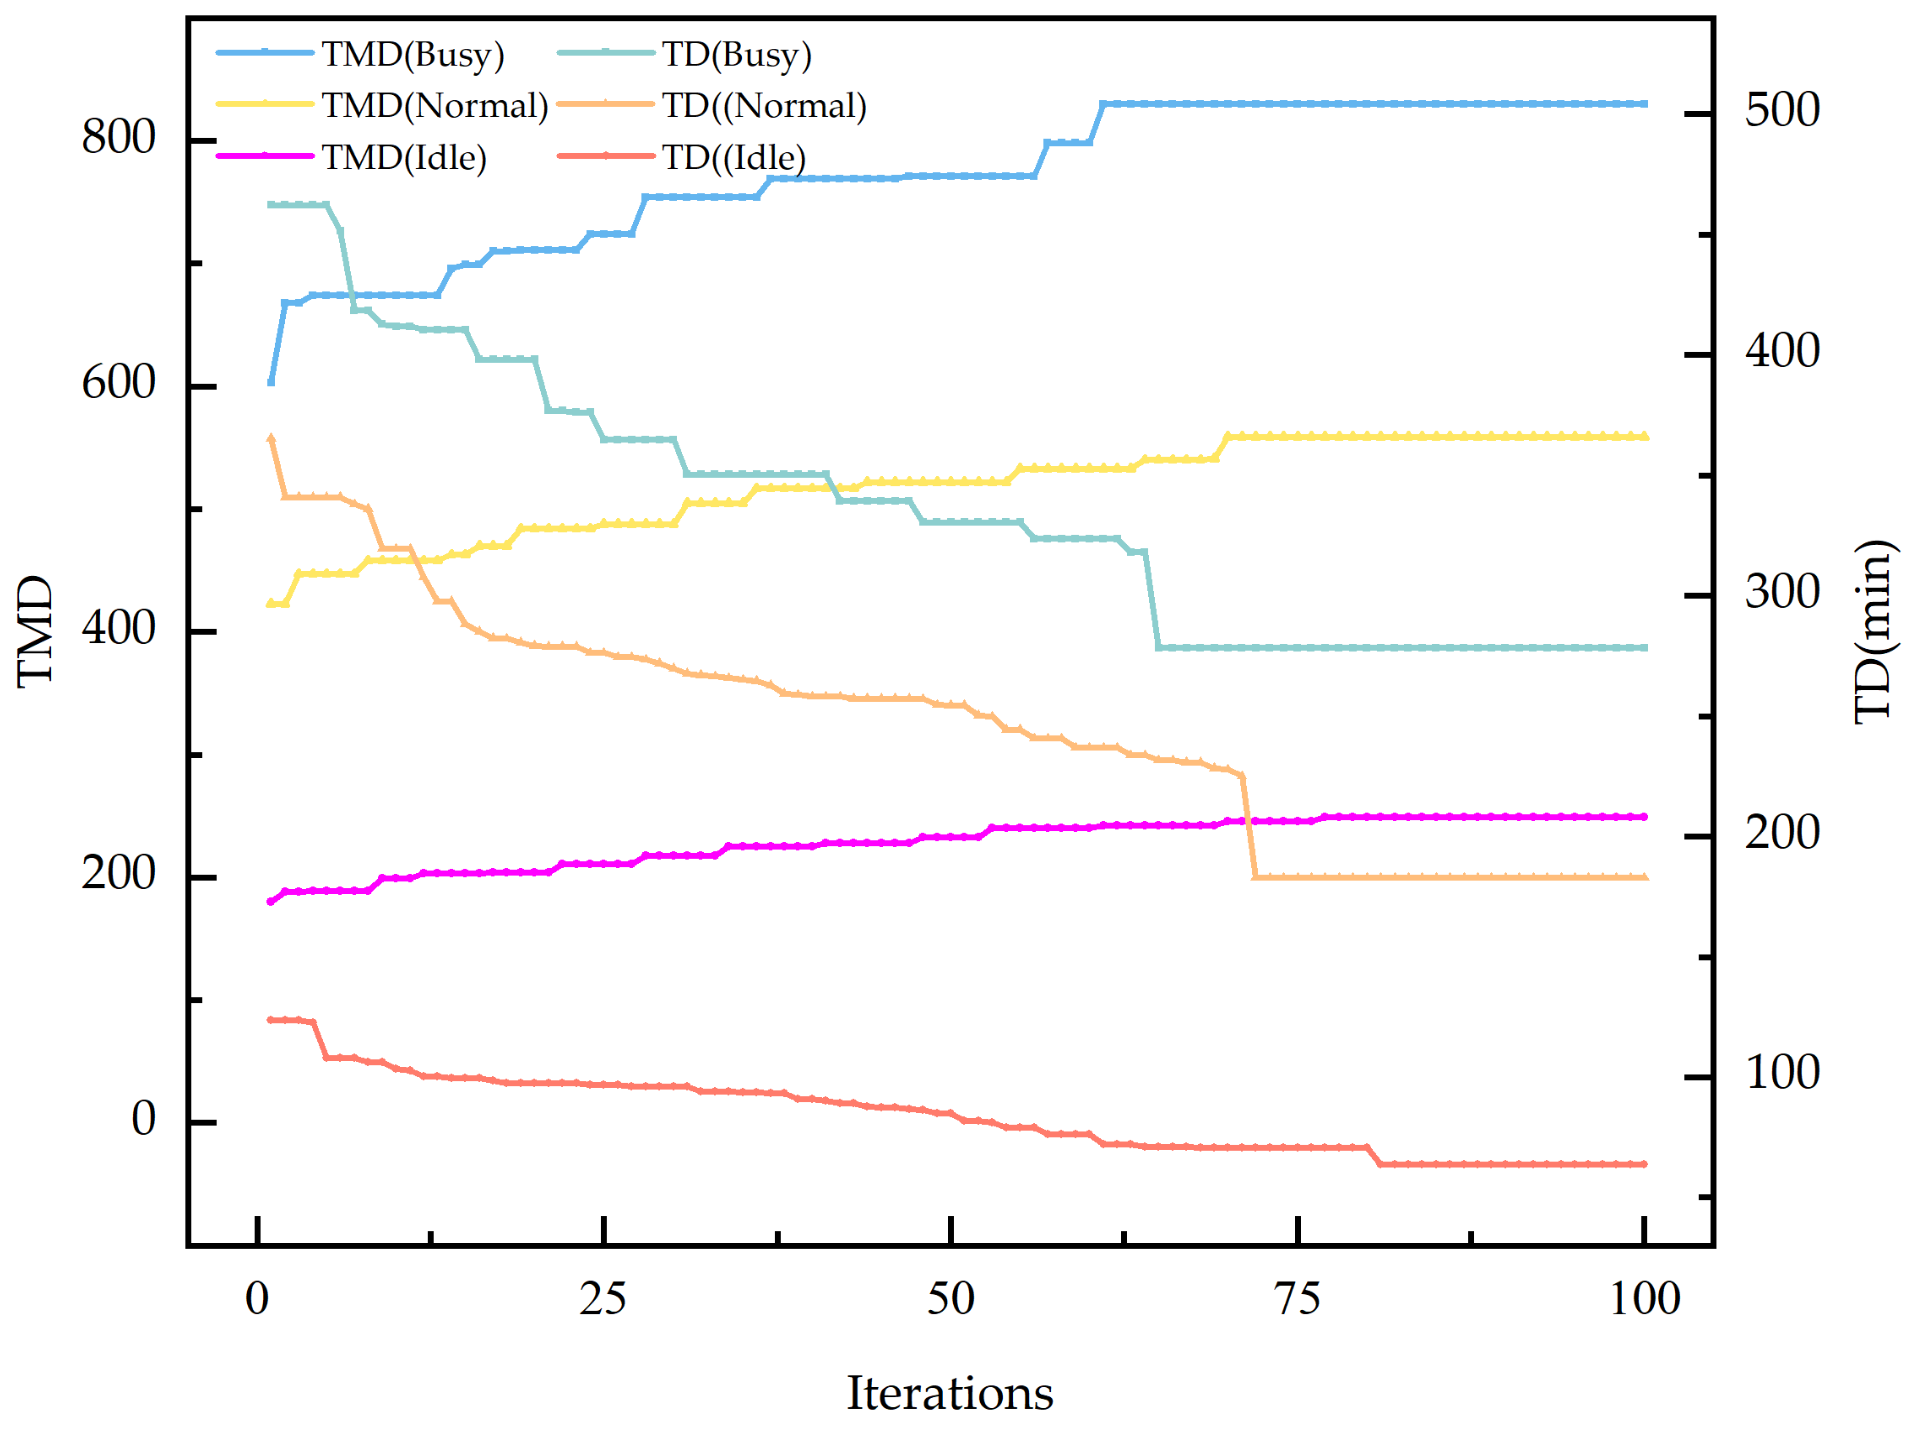
Figure 3. The iteration curves of the two optimization objectives under three experiment situations are shown in
Figure 4.
It can be seen from
Figure 4 that when the experimental scenario is in the Peak period, the upper-level converges fastest (the two targets converge in generation 66 and generation 65, respectively), while the Idle period converges slowest (the two targets converge in generation 78 and generation 82, respectively). Because in the Idle period there are many available gates and taxiways, and the feasible region is the largest, the efficiency of finding the optimal solution is the lowest, and even premature convergence may occur.
3.1. Analysis of the Upper-Level Result
The result of the upper-level programming is the gate assignment scheme, which is measured by the matching (TMD). The gate index is equivalent to a scoring table, of which the value has no specific meaning, but its relative size can reflect whether the aircraft is more suitable to be assigned to these gates. Taking the Peak scenario as an example, the comparison of MD (including TMD, MDS, MDD, and MDA) before and after optimization is shown in
Figure 5. All indicators of gates have been improved, among which the distance indicator, as one of the most important indicators to measure the advantage of gate assignment, has the most obvious optimization effect. The bridge approach rate of all flights in the Peak scenario was optimized from 56.58% to 97.37%, that in the Normal scenario was optimized from 68% to 98%, and that in the Idle scenario was optimized from 30% to 100%. (Generally, there are more parking spaces available in the Idle scenario, and the index will be larger. In our study, the particularity of the data source is ignored, and only the optimized results are concerned.)
The average indicators before and after optimization under the three scenarios are shown in
Table 5. The results show that the average TMD, MDS, MDD, and MDA in each scenario are improved by using the bilevel programming algorithm, indicating that more aircraft are assigned to gates suitable for it.
In particular, the indicators under the three scenarios after optimization are analyzed as shown in
Figure 6. It is found that the average value in the Idle scenario is the largest. It can be concluded that with the reduction of the number of flights, the average value of various indicators of the optimized gate increases, and the optimization effect is better.
3.2. Analysis of the Lower-Level Result
The results of the lower-level programming are the taxi path and the pushback delay time. The taxi-in time, taxi-out time, total taxi time, and optimization rate of all flights before and after optimization are shown in
Figure 7. It can be seen that the optimization rate of taxi-in time is always higher than the taxi-out time.
Table 6 and
Figure 8 show the average values of taxi-in time, taxi-out time, and total taxi time under the three scenarios after optimization. It is found that the reduction of taxi-in time and taxi-out time is the largest in the Normal scenario. It can also be seen from the optimization rate in
Figure 7 that the optimization rate in the Normal scenario is higher, which reflects that the model operates better in the Normal scenario. In the Idle scenario, the optimal may not be achieved under the parameters we set.
Figure 9 shows fuel burn and emissions of CO
2, CO, HC, and NO
X before and after optimization under different three scenarios.
In the Normal scenario, the optimization rate of taxi time, fuel consumption, and emissions are the largest means of the best optimization effect.
The taxiway programming scheme is measured by the number of potential conflicts. which is calculated through the conflict detection method. The interval composed of the time when the flight arrives at a node and this time plus the time calculated by the minimum safe distance between the front and back flights is used as the time window of the node occupied by this flight (for the same former flight, the corresponding occupation time windows of different types of latter flights are different). When the latter flight arrives at a node that is occupied by another flight, conflict is expected.
Table 7 summarizes the number of potential conflicts before and after optimization. The number of potential conflicts after optimization is reduced obviously.
To sum up, the framework proposed in this research can effectively improve the safety and efficiency of surface operation, which is reflected in the fact that the scheme can make the aircraft prefer to be assigned to gates suitable for them. More flights are assigned to near gates where the wingspan matches and belongs to the airline after optimization. In addition, the pushback delay time and taxi path set for the flight can reduce the taxi time and potential taxi conflicts, while reducing fuel consumption and emissions of CO2, CO, HC, and NOx. In different experimental scenarios, the efficiency of the framework in upper-level programming and lower-level programming is different. In the Idle scenario, gate assignment can achieve higher efficiency, while in the Normal scenario, the solutions of taxi time, fuel consumption, emissions, and conflicts are better.
4. Conclusions
Surface operation is an important part of aviation transportation and needs to be optimized. However, the current research still has some pending problems such as insufficient consideration of multiple processes. In order to further improve the rationality of gate assigned and reduce taxi time and conflict of taxi scheduling, this research proposes a joint ground movement multi-objective optimization framework based on bilevel programming as an auxiliary tool to help the controllers obtain the optimized gate assignment scheme, taxi path, and pushback delay time. For the gate assignment, taxiway path scheduling, and pushback time delay problems, NSGA-II and Dijkstra algorithms were adopted, with the objectives of maximum Matching degree between flights and gates, minimum taxi time, and minimum potential conflict, respectively. Using the data from Shanghai Pudong Airport, the framework operates in three scenarios. The results show that the framework proposed can improve the Matching degree of gate assignment, while reducing taxi time, potential conflict, fuel burn, and emissions in all scenarios. The optimization efficiency in the two levels differs in different scenarios.
Although widening the range of feasible solutions, the algorithm inevitably has a deficiency in searching for the global optimal solution, resulting in a reduction in the operation speed. Additionally, only two types of taxiing speeds are considered in this research when modeling. In the future, the changes of taxiing speed and engine power in the taxiing process can be added to the framework to realize speed control optimization.


