Article

Climate Impact Mitigation Potential of Novel Aircraft Features

Faculty of Aerospace Engineeering, Delft University of Technology, Kluyverweg 1, 2629 HS Delft, The Netherlands
*
Author to whom correspondence should be addressed.
Aerospace 2022, 9(8), 436; https://doi.org/10.3390/aerospace9080436
Submission received: 9 June 2022 / Revised: 30 July 2022 / Accepted: 1 August 2022 / Published: 8 August 2022
(This article belongs to the Special Issue Aircraft Emissions and Climate Impact)

Abstract

:
This work presents a transpacific airliner designed for minimal climate impact, incorporating several novel design features. These include open rotor engines, sustainable aviation fuels, natural laminar flow airfoils, and riblets. The design’s configuration and mission have been optimised simultaneously using a combination of standard preliminary techniques, experimental data, a multi-point mission analysis, and a model of average temperature response. It is demonstrated that, on an 8000 km mission, the design offers an 89.8% reduction in average temperature response relative to an Airbus A330-200, at the expense of a 7.3% increase in direct operating cost. The sensitivity of these results is investigated by comparing the performance over a range of operating conditions. In addition, several alternative designs incorporating only some of the above-mentioned features are analysed, allowing for an assessment of their individual contribution. Finally, a life-cycle average temperature response analysis is presented to place the climate impact of operation, manufacturing and end-of-life procedures in context.

1. Introduction

The aviation industry is under increasing pressure to reduce its contribution to global warming. This is particularly challenging for long-range aircraft, which account for 44% of aviation’s kerosene consumption [1], but for which battery-electric propulsion is unfeasible and hydrogen propulsion is in its infancy. Hence, there is an urgent need for long-range aircraft which can satisfy near-future environmental regulations, whilst still operating profitably.
The climate impact of an aircraft can be measured by its average temperature response ( A T R ), which indicates the global mean surface temperature change associated with operating that aircraft over a given time frame. A number of studies have examined different strategies for reducing the A T R of commercial transport aircraft. Ref. [2] considered modifications to the operation of an Airbus A330-200 and demonstrated that, by flying at a 30% lower cruise altitude and 8% lower cruise speed, a 42% reduction in A T R could be achieved with only a 10% penalty in cash operating cost ( C O C ). It was estimated that changes to the airframe geometry could further increase the A T R reduction to 53%. Later, ref. [3] applied a multi-objective optimisation procedure to a single-aisle, medium-range airliner, resulting in a low-altitude, low-speed and low-sweep design with an A T R reduction potential of 45% relative to a baseline aircraft. Ref. [4] studied the potential of optimising mission parameters and implementing climate impact mitigating technologies for reducing the A T R of Boeing 737–800 derivatives. It was concluded that an initial A T R reduction of 10–35% could be achieved by optimising mission parameters alone, and by applying open rotor engines, natural laminar flow (NLF) airfoils and synthetic kerosene, the reduction could be increased to 45–75%. For a conceptual 150-passenger, short-haul airliner, ref. [5] reports a 76.5% lower A T R footprint with a direct operating cost ( D O C ) increase of 12.8% relative to a baseline aircraft. It was also shown that the economic profitability improved on shorter routes for the same climate impact reduction. More recently, Ref. [6] compared the impact of synthetic aviation fuels (SAFs) and liquid hydrogen on aircraft A T R performance. In this study, aircraft operating on liquid hydrogen realised an A T R reduction of 99% for a 70% increase in C O C , whereas aircraft operating on SAFs realised a lower A T R reduction of 86% for a 26% increase in C O C . Finally, other studies have considered less orthodox A T R -reducing measures, such as harvesting energy from wake vortices of adjacent aircraft during formation flight. Such a measure could result in A T R reductions of up to 26% over a span of 50 years [7].
This work adds to these studies by combining mission optimisation, clean-slate airframe design and novel technologies to produce a 250-passenger, long-range aircraft optimised for minimal A T R with a tolerable increase in D O C . To place its performance in context, it is compared to a standard Airbus A330-200 powered by CF6-80E1 turbofan engines. In the next section, the novel technologies considered in this work are introduced. This is followed by a description of the design methodology and analysis tools, as well as a sensitivity study on A T R and D O C as a function of varying mission parameters. Finally, the outcomes of a life-cycle climate impact analysis are presented, and the novel technologies are ranked by their climate and cost effectiveness.

2. Novel Design Features

This section introduces the novel design features employed in the current aircraft design, explains why they deserve consideration, and describes what has limited their widespread application.

2.1. Open-Rotor Engines

Open rotor engines consist of a gas-generator core driving a single or two counter-rotating, unducted fans for operation at high subsonic Mach numbers up to 0.8 [4]. Their key design features include very high bypass ratios and low fan pressure ratios. These result in high propulsive efficiencies, whilst avoiding the weight and drag penalties of large nacelles. Ref. [8] reports fuel burn reduction potentials on the order of 25–30% compared to current turbofan engines. Counter-rotating configurations tend to be more efficient due to the cancellation of swirl losses. These also have a reduced fan diameter for a given thrust requirement. This comes at the cost of increased noise levels, although studies like [9] suggest that future advanced open rotor engines will meet ICAO Chapter 4 noise standards, improving public acceptance. Promising approaches to mitigating the noise footprint of counter-rotating designs include, amongst others: increasing the number of blades per rotor and the inter-rotor spacing; using low-thickness, high-camber and high-aspect ratio blades; and cropping the aft-rotor blade tips [10]. Moreover, current research into geared, variable-pitch fans, such as for the Rolls-Royce UltraFan, should lead to increases in shaft power transmission efficiency and lower blade loadings [11]. Finally, with the recent announcement of the CFM RISE program [12], the development of commercial open rotor engines has gained new momentum.

2.2. Synthetic Aviation Fuels

Synthetic aviation fuels (SAFs) have the potential to reduce the environmental impact of aviation in the short term. Unlike hydrogen or liquefied natural gas, drop-in biofuels require only moderate modifications to existing engine designs, and to the fuel production and supply infrastructure [13]. The climate impact reduction potential of SAFs results from the CO2-absorbing feedstock they are produced from, as well as their slightly different chemical composition, making them almost free of aromatics, sulfur and bound nitrogen [14]. The latter leads to lower particulate emissions, reducing the likelihood of contrail formation [13], although the slightly higher water content may negate this benefit. The magnitude of the achievable gains depends on the type of feedstock, production method and blend ratio with conventional fuel. Results also vary between studies [14,15,16]. Out of the five SAFs certified by the American Society for Testing and Materials (ASTM), namely FTK/BTL, SIP, HEFA, ATJ-SPK and ATJ-SKA [14], Fischer-Tropsch kerosene (FTK) seems particularly advantageous due to its myriad of possible feedstocks. These include municipal and agricultural waste, energy crops and algal biomass, which do not compete with food production or promote deforestation [13]. It is also the only SAF produced at a large commercial scale today by companies such as Shell, Sasol and Solena [17]. The most optimistic studies anticipate a price equivalency of FTK with Jet A-1 as early as 2030, and a market share of 73.4% by 2050 [18]. Currently, the ASTM D7566 standard imposes an upper bound of 50% on the blend ratio of FTK with Jet A-1. Although this threshold will likely be relaxed in the future [17], the current study still abides by this standard. According to [19], this implies a fuel cost of 1.8 times the price of Jet A-1. However, assuming a carbon capture efficiency of 85% [16], and that all non-CO2 emissions are indifferent between FTK and Jet A-1 [20], this implies a 43% decrease in CO2 emission per kg of burnt fuel. In addition, the calorific value of FTK ( 44.3   M J / k g ) is marginally higher than that of Jet A-1 (43 M J / k g ), reducing the amount of emitted CO2 per unit of thrust [17].

2.3. Natural Laminar Flow Airfoils

Natural laminar flow airfoils are designed to provide an initially favourable pressure gradient to improve boundary layer stability and delay the onset of transition. Their use can potentially reduce fuel consumption by up up to 10–15% [21]. However, the use of NLF airfoils can lead to higher operational costs due to their sensitivity to environmentally-induced roughness, such as insect contamination. Significant contamination can lead to premature transition, and a potential reduction of fuel savings by 45–60%. The effect of environmentally-induced roughness can be mitigated through dedicated inspection and cleaning procedures. These introduce extra costs, which depend on the time of year and contamination rate. These costs must be balanced against the price of the fuel saved to ensure a decrease in D O C [21]. Historically, the high operating speeds of commercial airliners have deterred the mass adoption of NLF airfoils, which have a lower critical Mach number than conventional airfoils. However, previous studies suggest that A T R is optimised at lower-than-conventional cruise speeds, making NLF an attractive technology for the current study.

2.4. Riblets

Even with the application of NLF technology, large parts of the airframe will still be subjected to the increased drag of turbulent boundary layers. This can be partially mitigated by the use of riblets. Riblets are micro-grooves aligned in the streamwise direction which have been shown to reduce the turbulent skin-friction drag at full-scale conditions by up to 5% [22,23]. In the past, traditional manufacturing and maintenance procedures meant that riblets were not economically feasible for conventional aircraft. However, with the advent of new manufacturing processes such as direct contactless microfabrication, these costs have been steadily decreasing, thus reducing the negative impact on D O C [24,25]. Riblets are now reaching commercial maturity, as demonstrated by the recently proposed application of a BASF co-developed riblet film to Lufthansa Cargo’s complete fleet of Boeing 777F freighters [26]. The resulting decrease in total drag is expected to be greater than 1%. It is anticipated that applying riblets to a low-speed, low- A T R design is at least equally effective, since riblet drag reduction is slightly improved at lower Reynolds numbers [22].

3. Methodology

An aircraft design incorporating all of the novel design features mentioned in Section 2 was established using the widely-known and well-accepted Roskam Class I-Class II iterative design process [27]. The following sections describe this process in more detail, as well as the methodology behind the aerodynamic and engine performance analysis, and the climate impact and cost evaluation.

3.1. Preliminary Sizing Process

The aircraft sizing process began with Roskam’s Class I method, in which the M T O W followed from the fuel fraction method, the maximum load factor was obtained by constructing a flight envelope, and the maximum take-off power and wing surface area were selected from a power-loading and wing-loading diagram, constrained using FAR and CS-25 regulations [27].
The results of the Class I method then served as inputs for Roskam’s Class II method, which was used to improve the accuracy of the O E W estimate by means of system-level sizing relations. To obtain a final O E W estimate, the Class II O E W was fed back into the Class I sizing routine, closing the iterative loop. The final O E W was determined once the relative difference between the Class I and II estimates was found to be less than 1%.
The Class II sizing method facilitated the construction of a centre-of-gravity-excursion plot, based on which the empennage sizing was performed. By creating a scissor plot, the longitudinal location and surface area of the horizontal tail were minimised. The vertical tail was instead sized for the one-engine-inoperative condition using Torenbeek’s method [28]. Following this, the control surfaces were sized to ensure that the design met CS-25 requirements pertaining to the dynamic eigenmodes.
The remainder of the sizing process was concerned with the fuselage and propulsion system, including the fuel tanks, cabin interior, landing gear, and internal systems. Each of these systems was sized using the methodologies proposed by Roskam [27]. At each stage in the design process, checks were made to ensure that the aircraft adhered to the key design requirements listed in Appendix A.

3.2. Direct Operating Cost Evaluation

The Roskam cost model for commercial airliners was used to estimate the D O C of the current design [29]. This method divides the D O C into in-flight costs, D O C f l t (crew, fuel, oil and insurance), maintenance costs, D O D m a i n t (labour and material costs), depreciation, D O C d e p r , fees, D O C l n r (landing, navigation and registry fees) and financing, D O C f i n :
D O C = D O C f l t + D O C m a i n t + D O C d e p r + D O C l n r + D O C f i n .
For consistency, the majority of the cost data was adopted from [29], with the exception of the fuel costs, since the price ratio of SAFs to Jet A-1 has plummeted since the publication of [29] (see Section 2).
To ensure that the design is economically viable, an estimate was made of the maximum increase in D O C which can be tolerated by the market. Historical data suggests a 5–10% profit margin in the aviation industry [30] with an initial cost pass-on rate of 50–60% [31]. Assuming a demand elasticity of −1.15% [32], a D O C increase of 15% would lead to a 17.2% reduction in passenger demand for a 100% pass-on rate, or a 10.3% reduction for a 60% pass-on rate. The latter figure is in line with historical examples, which show that airlines can handle demand drops of around 10% [31]. The aviation industry has maintained a consistent 5.3% growth rate per annum, especially with the recent increase in air flight participation from less economically-developed nations [30]. Given these predictions, a 10% reduction in demand would be negated within 3 years, even in the absence of intergovernmental initiatives or decreases in carbon tax credit expenditures [33]. Thus, for the current design it is assumed that D O C increases of up to 15% are bearable.

3.3. Open-Rotor Engine Model

The largest proportion of an aircraft’s life-cycle climate impact is incurred during its operating life, primarily by its propulsion system. This raises the need for a detailed engine cycle model to accurately determine the thrust-specific fuel consumption (TSFC) and combustor inlet temperature ( T 3 ) and pressure ( p 3 ) during each mission segment. For this purpose, the variable-bypass-ratio engine model in [20] was used. It has a modular structure, which allows the engine core to be augmented with different bypass models for the open rotor configuration of the current aircraft design, as well as for the CF6-80E1 turbofan engines of the A330-200. Ref. [20] contains a schematic of the model stations, which are identical for both engine types, except for the gearbox, which is only employed by the open rotor configuration to limit the blade tip speed. The open rotor component efficiencies assume 2010 technology levels, whereas the CF6-80E1 model is based on publicly available real-engine data.
For the engine core analysis, a one-dimensional, steady, perfect gas flow at every cycle station was assumed. Furthermore, the diffusers and nozzles were taken to be adiabatic, and component polytropic efficiencies were assumed to be constant. The gas properties were taken to be constant too, but with different values up- and downstream of the combustor, and installation losses were modelled as thrust penalties [20]. The mathematical framework, which is based on a power and momentum balance across components, is outlined in [34]. The engine was sized for the critical one-engine-inoperative (OEI) climb-out condition using a “rubber engine sizing” approach, where a design mass flow rate ( m ˙ 0 , d e s ) and fan diameter (Dfan) were initially assumed and iteratively corrected until the installed thrust satisfied the critical take-off thrust requirement. Other user inputs include the bypass ratio ( B P R ), the overall pressure ratio ( O P R ), and the turbine inlet temperature ( T E T ). For off-design operation (different Mach number, altitude and throttle setting), all component efficiencies were assumed to equal their design point values, and that the maximum thrust is limited by the design point T E T and O P R , as well as by the design disk power loading, P f a n / A f a n , in the case of the open rotor engines [20].
The counter-rotating, open rotor bypass model is based on the principle of superposition of the velocity fields produced by the two rotors. It assumes a constant density and blade efficiency within each rotor plane, and that the tangential velocity component induced by the front rotor is fully cancelled by the rear rotor. The dimensionless axial and tangential velocities induced by each rotor in its own rotational plane, at a distance r from the axis of rotation, are denoted as a i ( r ) = u a , i / V 0 and a i ( r ) = u t , i / ( Ω 1 r ) , respectively. It was assumed that each rotor also induces an axial and tangential velocity on the other rotor, denoted as a j ( i , r ) and a j ( i , r ) , respectively. Equation (2) defines the dimensionless velocities for each rotor ( i = 1 corresponds to the front rotor, i = 2 to the aft rotor), as well as explicit expressions for a i and a i based on general momentum theory [35], where x i is the dimensionless radial coordinate:
i = 1 a i = a 1 a j = 0 , i = 2 a i = a 2 a j = 2 a 1 , x i = Ω i r V 0 ,
a i = x i 2 η ( 1 η ) 1 + x i 2 η 2 , a i = 1 η 1 + x i 2 η 2 .
The Prandtl loss function ( κ i ) quantifies the momentum loss due to radial swirl at the blade tips of the ith rotor, and is related to the local flow angle ( ϕ i , r = R ). Moreover, the circulation ( Γ i ) induced within the ith rotor plane is defined below [35]:
κ i = 2 π cos 1 exp B 1 r R 2 sin ϕ i , r = R , tan ϕ i = V 0 ( 1 + a i ) Ω r 1 a i , Γ i = 4 π V 0 2 a i ( 1 + a 1 + a 2 ) B Ω 1 ( Ω i Ω 1 a i a j ) .
The net propulsive force due to the ith rotor can be decomposed into an axial thrust component per unit radius ( F i ) and a tangential torque component per unit radius ( Q i ):
F i = 4 π r ρ V 0 2 a i 1 + a 1 + a 2 κ i B ϵ i ρ Γ i V 0 1 + a 1 + a 2 , Q i = 4 π r 2 ρ V 0 Ω 1 r 1 + a 1 + a 2 a i κ i + B ϵ i ρ Γ i Ω 1 r 2 Ω i Ω 1 a i a j .
The specific bypass thrust ( F d u a l / m ˙ d u a l ) and the specific bypass power ( P d u a l / m ˙ d u a l ) equal:
F d u a l m ˙ d u a l = ξ R R F 1 + F 2 ρ d r ξ R R 2 π r V 0 1 + a 1 + a 2 d r , P d u a l m ˙ d u a l = ξ R R Ω 1 Q 1 + Ω 2 Q 2 ρ d r ξ R R 2 π r V 0 1 + a 1 + a 2 d r .
The total installed thrust ( T i n s t ) of the engine core and the counter-rotating fans, and the T S F C , follow from:
T i n s t = F m ˙ 0 η i n s t F d u a l m ˙ d u a l α α + 1 + T c o r e m ˙ 0 , T S F C = m ˙ f T i n s t .
Finally, the engine dimensions, dry weight and nacelle parasitic drag were estimated by means of semi-empirical relations comprehensively outlined in [20].

3.4. Aerodynamic Model

A modular aerodynamic model was used to analyse the aerodynamic performance of the novel design features. The total drag of each major aircraft component was estimated using their respective coefficient of skin friction, form factor, interference factor, wetted surface area, and laminar-to-turbulent fraction (f). The model was based on the Class II approach of Raymer [36], with the modifications to account for the use of riblets, open rotor engines, and NLF airfoils described in the following.

3.4.1. Modifications for Riblets

The drag reduction ( D R ) as a result of using riblet technology depends on two Reynolds numbers; the first of these is the Reynolds number based on the riblet us size, g + = g / δ v , where g is the square root of the cross-sectional area of the riblet groove and δ v is the viscous length scale, that is the smallest size of turbulent eddies in the flow. The second is the friction Reynolds number, R e τ = δ / δ v , where δ is the local boundary layer thickness. The dependency on R e τ can be embedded into the skin-friction coefficient of the equivalent smooth wall ( C f , s ) by introducing the Hama roughness function ( Δ U + ) [22],
D R Δ U + 2 C f , s , C f , s = ( 2 l o g 10 R e x 0.65 ) 2.3 ,
where R e x is the local boundary layer Reynolds number. The Hama roughness function is a measure of the momentum deficit induced by the riblets, relative to the baseline smooth wall, and is fairly independent of the Reynolds number. Negative values of Δ U + indicate a drag reduction and positive values indicate a drag increase.
Previous studies on D R as a function of g + at R e τ = 17 , 000 (typical of an aircraft wing) suggest that riblets are most effective at g + 11 , corresponding to Δ U + 1 [37]. Under these conditions, a 4.5 % reduction in skin-friction drag is anticipated [37]. For the current study, the riblet-induced drag reduction was computed assuming the use of trapezoidal riblets, which provide Δ U + 1 . The  D R was estimated using (7).
To account for spatial restrictions imposed by, for example, maintenance and connection joints, it was assumed that the riblet coverage would be limited to 70% of the wetted turbulent surface area. Consequently, the computation of the equivalent coefficient of skin-friction was divided into three components, corresponding to regions with laminar boundary layers and regions with turbulent boundary layers with and without riblets. The modified value for the total skin-friction coefficient was computed using:
C f , e = C f , l a m × f + C f , t u r b × 1 D R 100 × 0.7 + C f , t u r b × 0.3 × ( 1 f ) .

3.4.2. Modifications for Open-Rotor Engines

In the wake of an open rotor engine in tractor configuration, components experience a drag increase known as scrubbing drag. As proposed in [38], this was modelled using an increased dynamic pressure ( q s c r u b ). Correspondingly, the nacelle skin-friction drag was computed using:
q s c r u b = 1 2 ρ ( V + Δ V ) 2 , C D , 0 , n a c e l l e = 1 S r e f × F F × C f × S w e t × q s c r u b q .
The area of the upper wing surface affected by scrubbing was assumed to equal the product of the wing chord length at the installation location of the open rotor engine ( c s c r u b ) and the diameter of the rotor blade. The area of the lower wing surface affected by scrubbing was assumed to equal the product of c s c r u b and the difference between the diameter of the rotor blade and the diameter of the nacelle. The modified treatment of the lower wing surface was to account for the attachment of the propulsion system. Consequently, the total scrubbed area ( A s c r u b ) was defined as the sum of the upper and lower scrubbed areas. The corresponding drag increase due to the interference of the rotor wake was computed using:
Δ C D , 0 , w i n g = 1 S r e f ( Δ q 1 ) × A s c r u b × C f × 1.3 .
In both (9) and (10), the laminar-to-turbulent boundary layer fraction was taken as 0%, since these regions are entirely immersed in the open rotor engine’s turbulent wake.

3.4.3. Modifications for NLF Airfoils

The effect of using an NLF airfoil was accounted for by modifying the laminar-to-turbulent boundary layer fraction in the Class II drag model. For conventional swept wings, a value of 10% is typically considered a valid assumption [36]. Previous research by NASA’s Dryden Flight Research Centre, however, showed the potential for the flow over a 30 deg swept wing at a Reynolds number of 30 million to remain 60% laminar in cruise [39]. For the current aircraft design, the portion of the wing behind the open rotor engine was assumed to be 100% turbulent. For the remaining unscrubbed portion of the wing, the NASA Dryden estimate of a 60% laminar-to-turbulent fraction was used. Although the current design operates at a higher Reynolds number of 60 million, it also has zero wing sweep, which minimises the cross-flow instability transition mechanism. The total turbulent wing surface area was therefore computed as the sum of A s c r u b and 40% of the unscrubbed wing surface area. This lead to an estimate of 40% for the portion of the wing area which is laminar at cruise.

3.5. Aircraft Climate Impact Evaluation

Ref. [20] summarises common metrics adopted by researchers to quantify the effects of anthropogenic climate change and uses these to derive desirable properties of a metric for comparing different aircraft designs. Firstly, an appropriate metric should measure a tangible physical quantity, which is understood by researchers and non-experts alike, such as global temperature change. Secondly, it should account for changes in aircraft (fleet) operations over time, such as varying fleet size and utilisation. Thirdly, time-integrated metrics are less sensitive to short-term atmospheric perturbations than snapshot metrics, and thus preferred. Finally, it should account for short-lived and long-lived climate impacts alike, such as the decay rates of different climate agents, by applying temporal weighting.
Based on the aforementioned criteria, the average temperature response was chosen for the current analysis. It is expressed in units of temperature for a given time horizon (H), here chosen to be 100 years to account for both short- and long-lived climate impacts [3]. The  A T R is a function of Δ T ( t ) , the global mean surface temperature change:
A T R H = 1 H 0 H Δ T ( t ) d t , Δ T ( t ) = t 0 t G T t t · R F * t d t .
Δ T ( t ) itself comprises the climate impulse response function ( G T ( t ) ) and the normalised radiative forcing ( R F * ). Several climate impulse response functions, G T ( t ) = j α j e τ j t , with  α i τ j being the equilibrium response of mode j, have been developed by fitting results from more comprehensive climate models [40]. The coefficients, α i and τ i , of the single-mode response function G T ( t ) used herein were adopted from [41], resulting in:
G T ( t ) = 2.246 36.8 e t / 36.8 , R F * ( t ) = i all species E f f i · R F i ( t ) R F 2 × CO 2 .
In the above, R F * ( t ) represents the sum of radiative forcings of all species, each multiplied by their respective efficacy ( E f f ), and normalised by the value that would result from doubling the atmospheric CO2 concentration ( R F 2 × CO 2 = 3.7   W   m ) [3]. E f f is a dimensionless parameter comparing the surface temperature change from equal forcings of species i and CO2 (the efficacy of CO2 is by definition equal to one). Refs. [3,20] derive R F i for the species i = CO2, CH4, O3l, O3s, H2O, SO4, soot and contrails using a linearised temperature response model. To validate the model’s implementation, the analysis conducted in [3] for a constant number of A T R -optimised aircraft (Scenario 1, Section B) was reproduced. The results are shown compared to data from [3] in Figure 1. The curves of cumulative A T R demonstrate a good level of agreement, with the error increase shown for the lower abscissa range resulting from the small ordinate values.

3.5.1. A T R Evaluation for a Specific Design

Since A T R depends on both the quantity and location of released emissions, a future emission scenario was constructed based on the design’s utilisation rate ( U ( t ) , measured in flights per year), and the design’s emissions ( e i , the quantity of species i released per flight). In particular, e i = mission E I i , j W fuel , j was derived by assuming a piecewise constant emission index ( E I i , j ) and fuel consumption ( W f u e l , j ) during the jth mission segment. The annual emissions of species i follow from E i ( t ) = e i U ( t ) , showing that savings can be achieved by reductions in either fuel burn (quantity) or emissions index, the latter being a function of altitude [20]. The fuel consumption during the jth mission segment was determined using the engine model outlined previously. The emissions index was derived from the mass of emitted species per unit mass of fuel. The  E I ’s of CO2, H2O, SO4, and soot are a function of the fuel composition only and thus treated as constants [20], whereas E I N O x was assumed to vary with the operating condition. Finally, it was assumed that the emission rates remain constant throughout the airliner’s design life of 35 years, after which they drop to zero.

3.5.2. Limitations of the Climate Impact Model

The current climate impact model can capture the variation in R F with altitude for a selection of emission agents at a low computational cost. The model’s parameters are calibrated to the results of sophisticated global climate models such as described in [40], thus accurately quantifying the global mean response to radiative emissions. Although the R F due to long-lived species like CO2 is independent of emissions’ location, short-lived species like O3 remain concentrated near flight routes, causing temperature response fluctuations between regions. Therefore, the current model may overestimate the temperature increase in less air-traffic-dense regions, and vice versa. Besides regional variations, the model also does not account for temporal fluctuations in R F due to contrails, whose sign varies both seasonally and diurnally [20]. Given the significant uncertainty about the climate impact of contrail-induced cirrus clouds, the current model only considers the effect of linear contrails [3], thus providing a lower bound on the climate effect of contrails. Moreover, any coupling between species is ignored, such as between NOx and SOx through OH [42]. Finally, certain model parameters are snap-shots in time and will be underestimated in the future, an example being the CO2 background concentration of 380 ppmv. In conclusion, whilst the accuracy of the current climate model may be limited in absolute terms, differences in climate impact reduction potential between technologies, as well as between aircraft operated on the same route, are well captured.

4. Results and Discussion

This section begins by highlighting the differences between the two aircraft considered in this work, as well as motivating the design choices which led to the current airframe design. However, the focus lies on studying the sensitivity of A T R and D O C to cruise altitude and Mach number, and comparing the findings with data from the literature. Finally, an assessment is made of the climate- and cost-effectiveness of different novel technology combinations, and of the aircraft throughout its entire life cycle.

4.1. Comparison of Aircraft Configurations

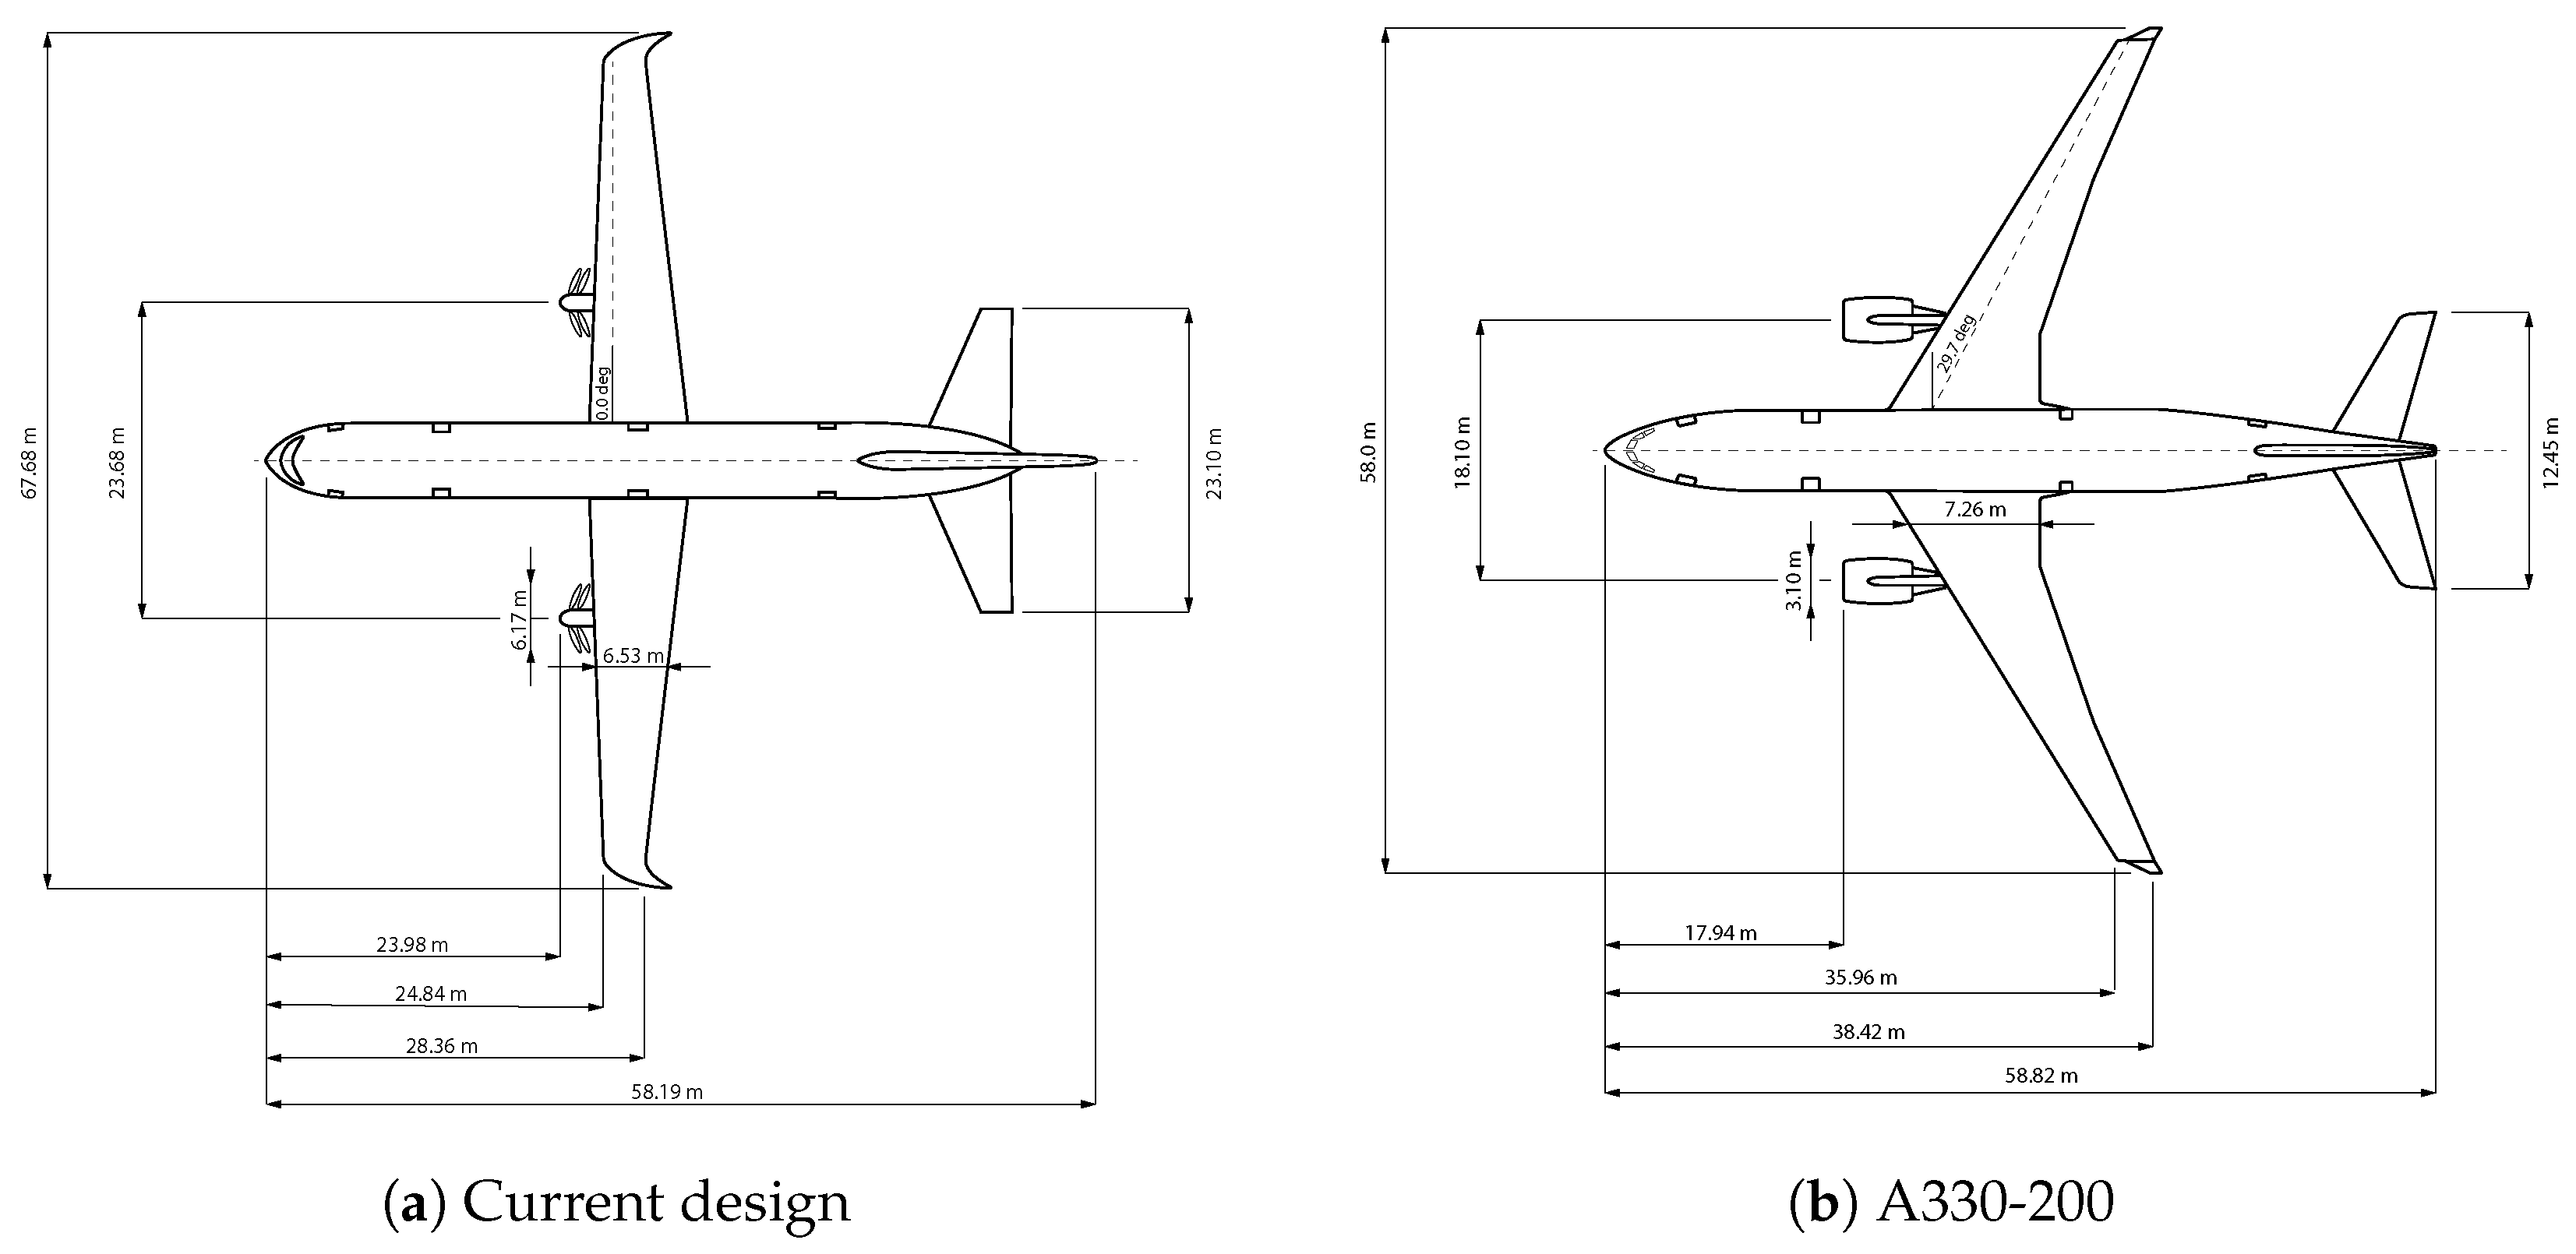
Figure 2 contrasts the main airframe dimensions of the current design and the A330-200. As summarised in Table 1, notable characteristics of the former include a zero quarter-chord sweep ( Λ c 4 ) and high-aspect-ratio ( A R ) wing using a NACA 63(3)-418 NLF airfoil. The choice of airfoil was made using a trade-off between the NASA NLF-series, and the NACA 6- and 7-series airfoils, which considered C d at the design C l , the boundary layer transition point, C m , C l , m a x , the critical Mach number, and the stall characteristics.
The decision to adopt a zero-sweep wing stems from the motivation for the chosen cruise Mach number. It was purposefully set to Mach 0.63, just below the critical Mach number of the NACA 63(3)-418 airfoil to prevent the formation of shock waves, which would trigger a transition to turbulence in the boundary layer aft of the shock. Although it is possible to increase the critical Mach number by introducing wing sweep, it was decided not to do so to minimise crossflow instabilities, resulting in premature boundary layer transition. Conversely, the A330-200 employs a Λ c 4 of 29.7 deg to raise the critical Mach number, and a lower A R to reduce the parasitic drag.
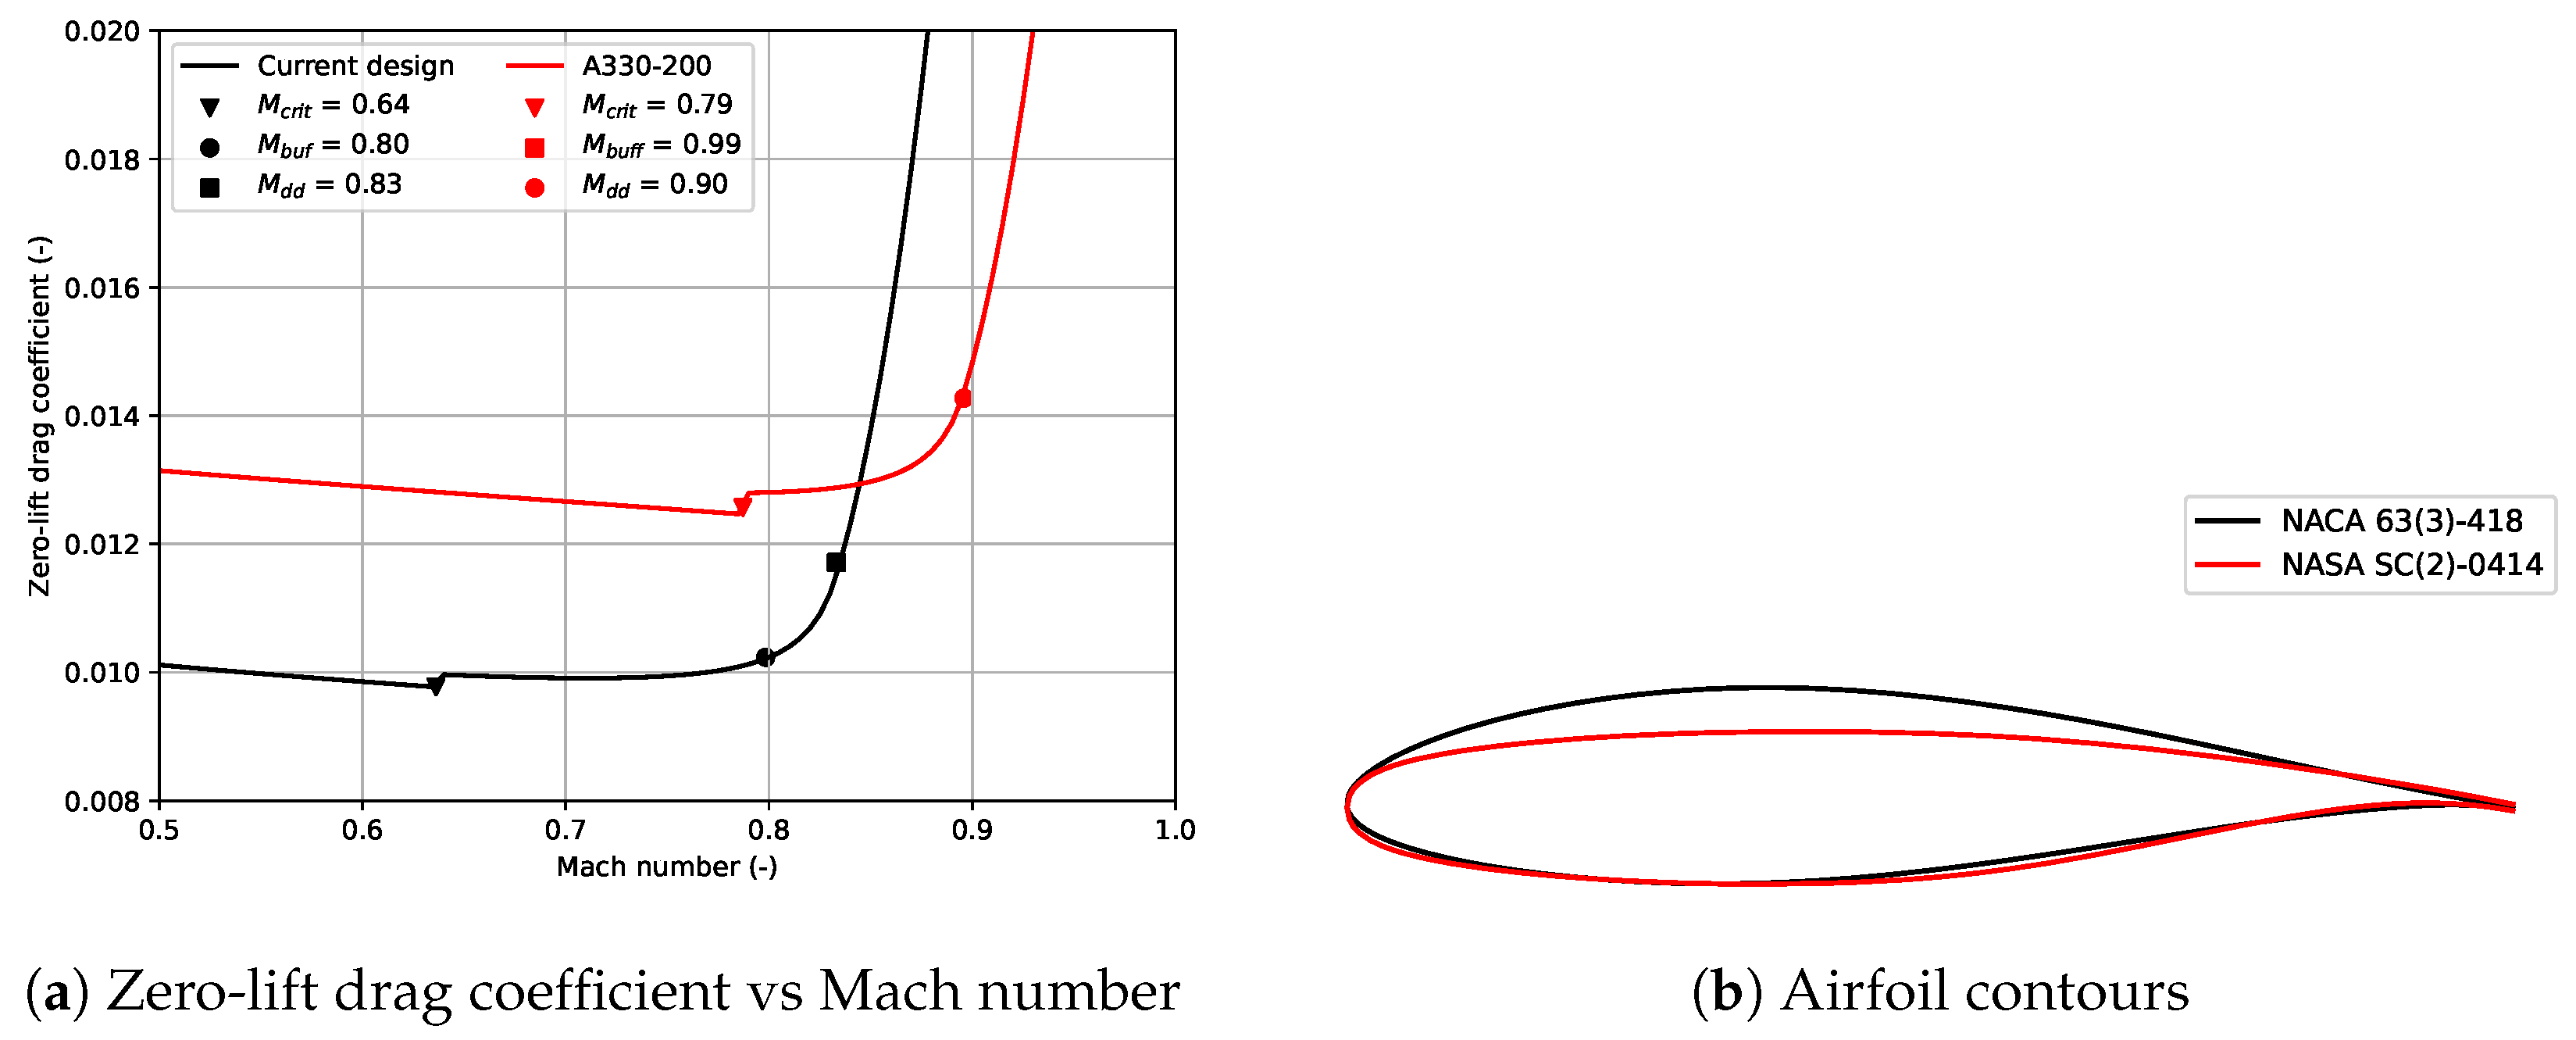
Unlike the current design, today’s airliners such as the A330-200 are not limited by the critical Mach number. In fact, they frequently fly faster than the critical Mach number to reduce D O C , and are instead limited by either the drag divergence Mach number or the buffet Mach number. The buffet Mach number is defined as the freestream Mach number such that the local Mach number at the point of minimum C p along the airfoil is 1.2 [43], whereas the drag divergence Mach number is computed using the Korn Equation [44]. Figure 3 displays the zero-lift drag coefficient as a function of Mach number for both the current design’s airfoil and a supercritical airfoil, which resembles those used by aircraft similar to the A330-200. The critical, buffet, and drag divergence Mach numbers are also highlighted.
Figure 3 provides further motivation for setting the cruise Mach number to 0.63, since it is the Mach number which minimises the zero-lift drag coefficient. The motivation to adopt an NLF airfoil rather than a supercritical one is also justified since, for lower speeds, the zero-lift drag coefficient is approximately 20% lower.
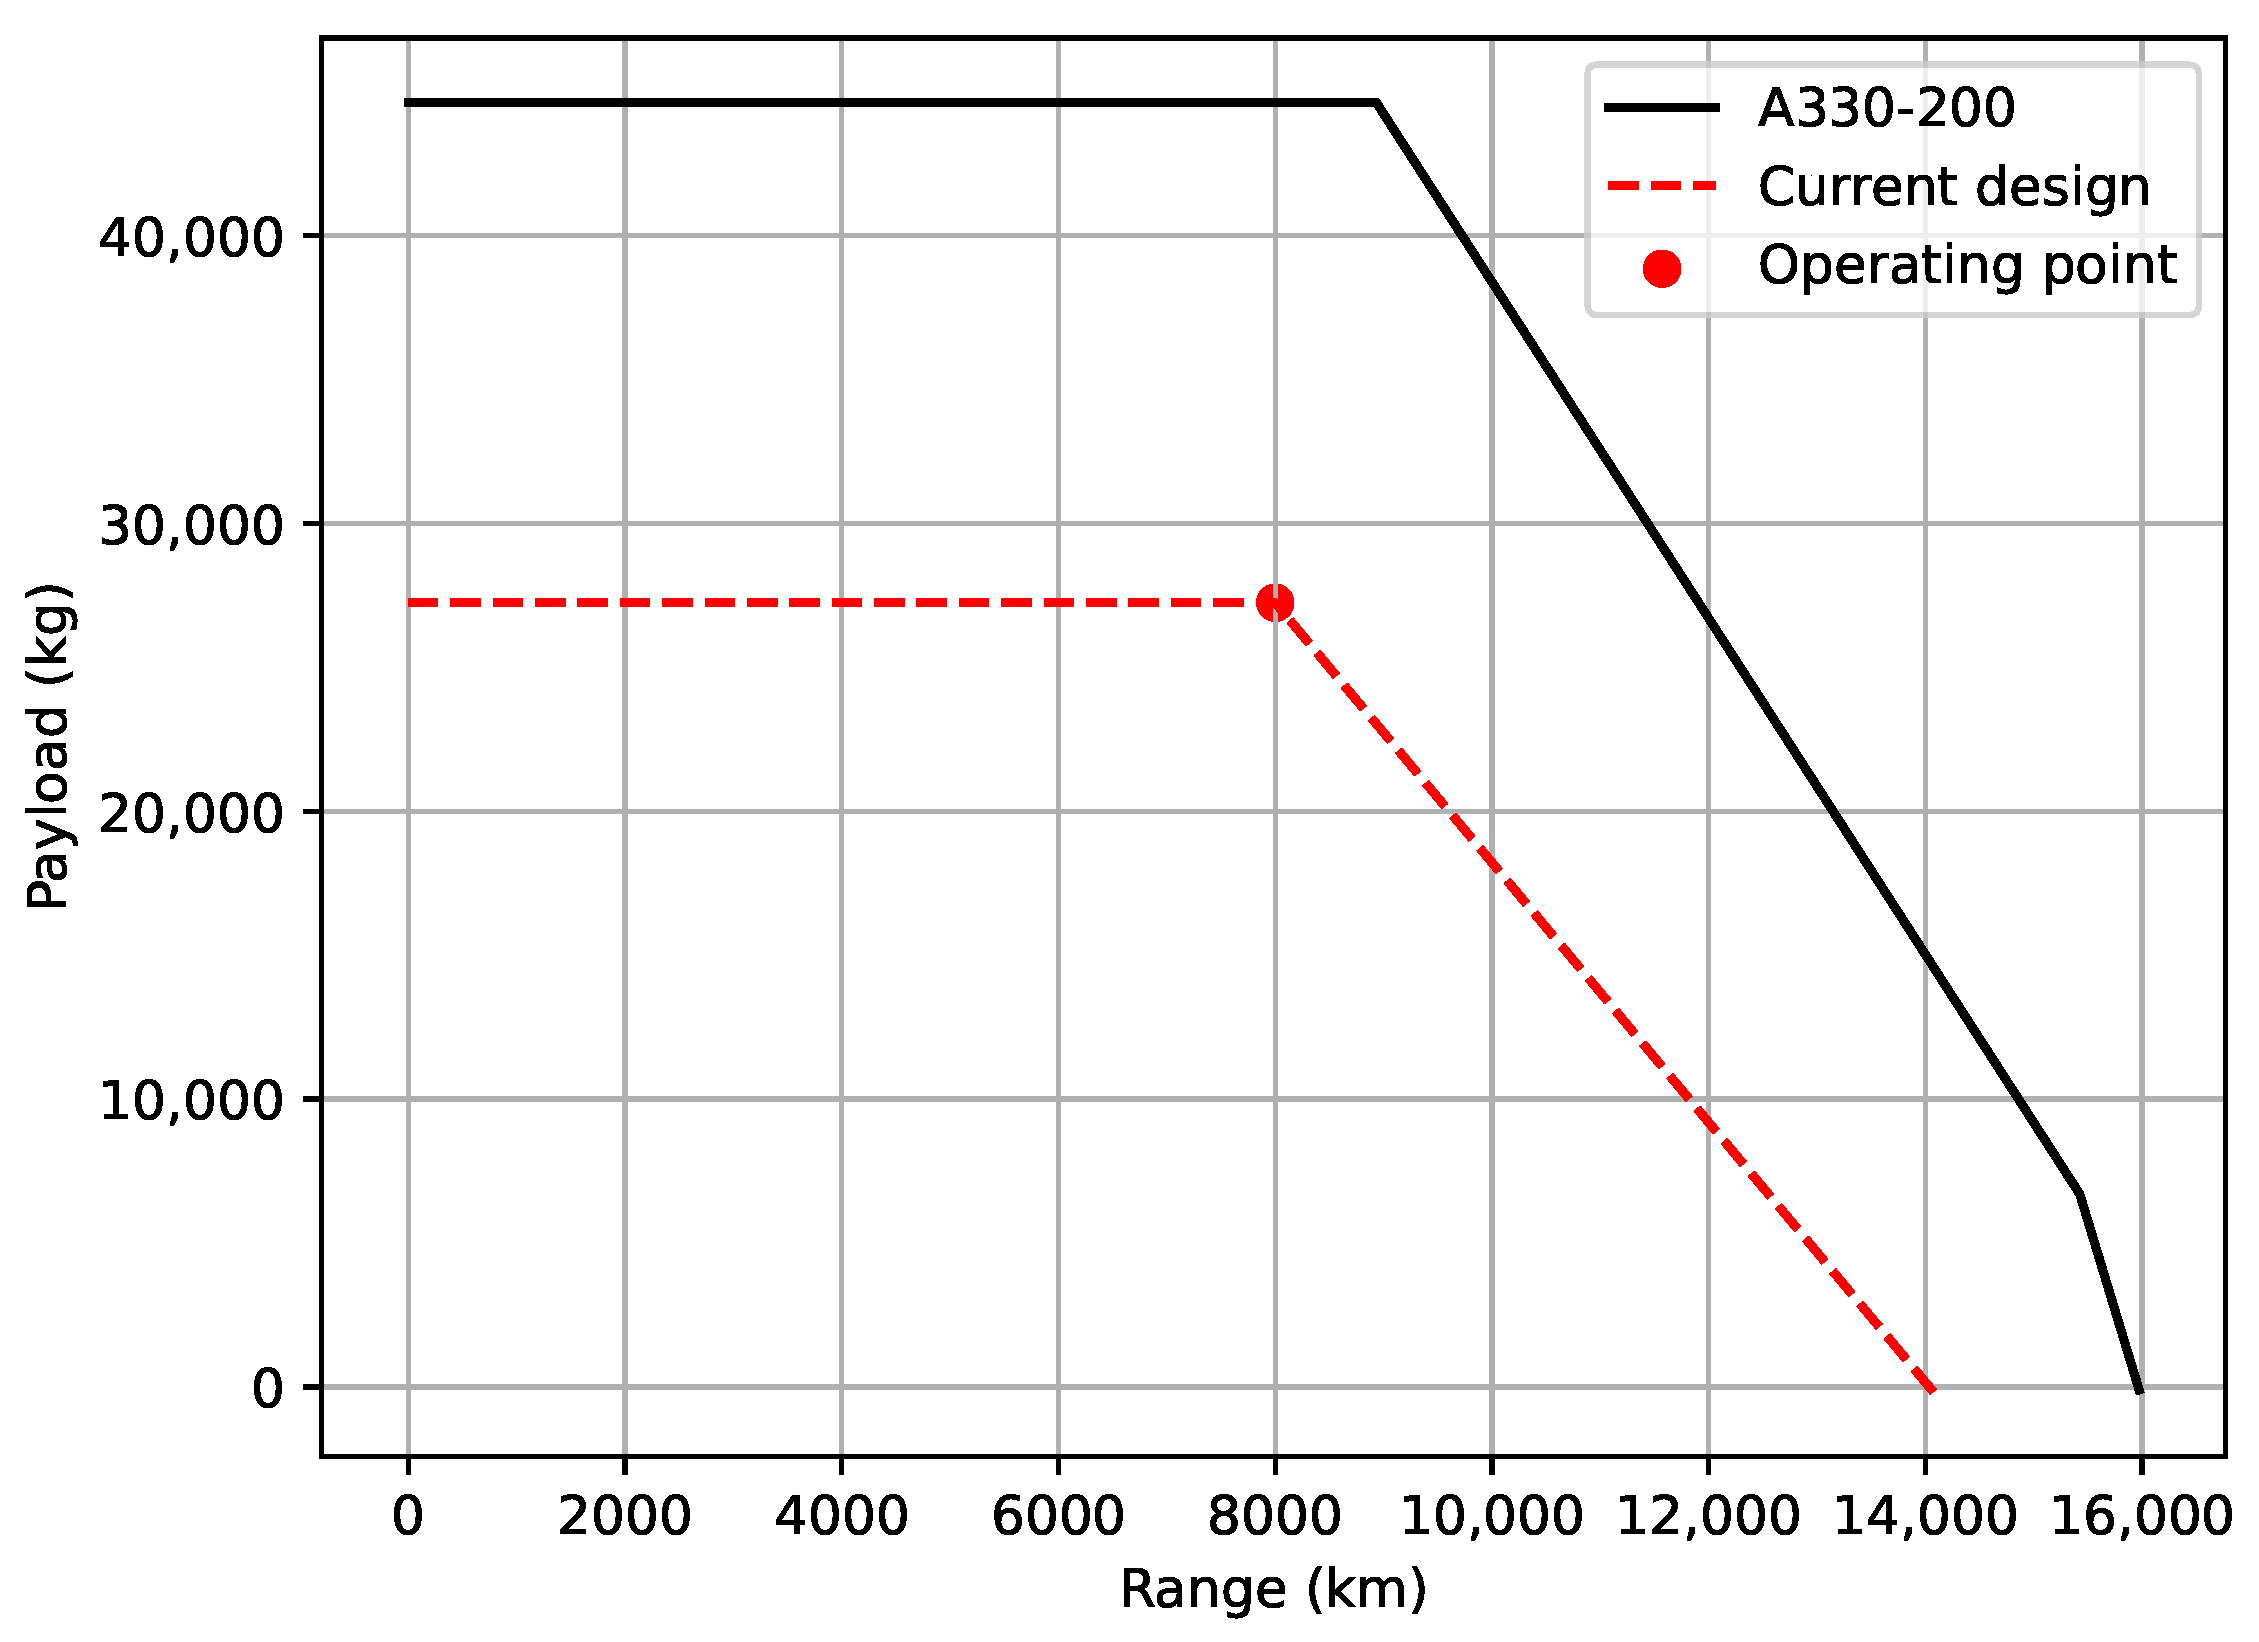
In its most dense cabin layout, the A330-200 can carry up to 406 passengers [45], however, in this study a three-class configuration with 253 seats [2] was chosen to improve the comparability with the current design. Consequently, the A330-200 operates significantly below its load-carrying capability, as visualised by the payload-range diagram in Figure 4. This is acceptable insofar as the aim of this work is to quantify the climate impact mitigation potential of a clean-slate aircraft design carrying 250 passengers relative to an existing airliner on the same route. It should be mentioned that unlike the A330-200, the current design’s ferry range is not constrained by the maximum fuel tank volume. This is due its larger wing span, zero sweep, thicker airfoil (see Figure 3) and reduced fuel burn. Both graphs were generated with SUAVE’s payload_range() function, which, in the case of the A330-200, agrees well with the “Aircraft Characteristics—Airport and Maintenance Planning” manual [46].
Table 2 compares the performance of the counter-rotating open rotor engines and the CF6-80E1 turbofan engines. With reference to Figure 2, the open rotor engines are installed in tractor configuration due to concerns about noise and blade loading at high angles of attack [38]. The open rotor architecture results in a significantly higher bypass ratio ( B P R ) and warrants a larger fan diameter ( D f a n ) to limit the disk power loading. For modern turbofan standards, a moderate overall pressure ratio ( O P R ) was chosen to limit the production of thermal NOx, with adverse effects on cycle efficiency [3]. As mentioned in Section 3, the open rotor engine length ( L t o t ) and dry weight ( W d r y ) were derived from semi-empirical relations in [20], which produced values similar to those of the CF6-80E1. In both cases, the sea-level static thrust ( T s t , s l ) is driven by certification requirements for one-engine-inoperative climb-out.

4.2. Comparison of Mission Profiles

The performance of the two aircraft is compared on the transpacific route Tokyo-Vancouver (about 8000 k m ). The chosen route is congruent with the presumption that future long-range airliners will aim to maximise energy per revenue passenger kilometre rather than range, since the latter results in a higher unused capacity on average, as seen for the A330-200 in Figure 4. The graphs of altitude and Mach number as a function of the flight time, shown in Figure 5, were obtained from SUAVE, a conceptual-level aircraft design tool [48]. The throttle setting was treated as an output parameter, determining the fuel mass flow rate, which in turn served as an input for the engine model presented in Section 3. Mission design constraints included a maximum block time of 16 h, and a fuel margin accounting for a 200 nm diversion segment, as well as a 30 min loiter phase at 1500 ft altitude [28]. As suggested previously, the current design’s cruise Mach number was set to 0.63; just below the NLF airfoil’s critical Mach number. In contrast, the A300-200 operates at Mach 0.82. The cruise altitudes are also dissimilar; 5000 m for the current design and 11,250 m for the A300-200.
A summary of mission and aircraft performance data for the trajectories displayed in Figure 5 is provided in Table 3, where x ¯ denotes the time-average of quantity x. The lower cruise Mach number increases the block time of the current design, whereas the lower mass of burnt fuel ( m f u e l ) is a direct consequence of the reduced T S F C , as well as the drag-optimised airframe design. Due to the absence of a nacelle, the open rotor engines achieve higher overall efficiency ( η t o t ) than the turbofan engines.

4.3. Comparison of A T R Spectra

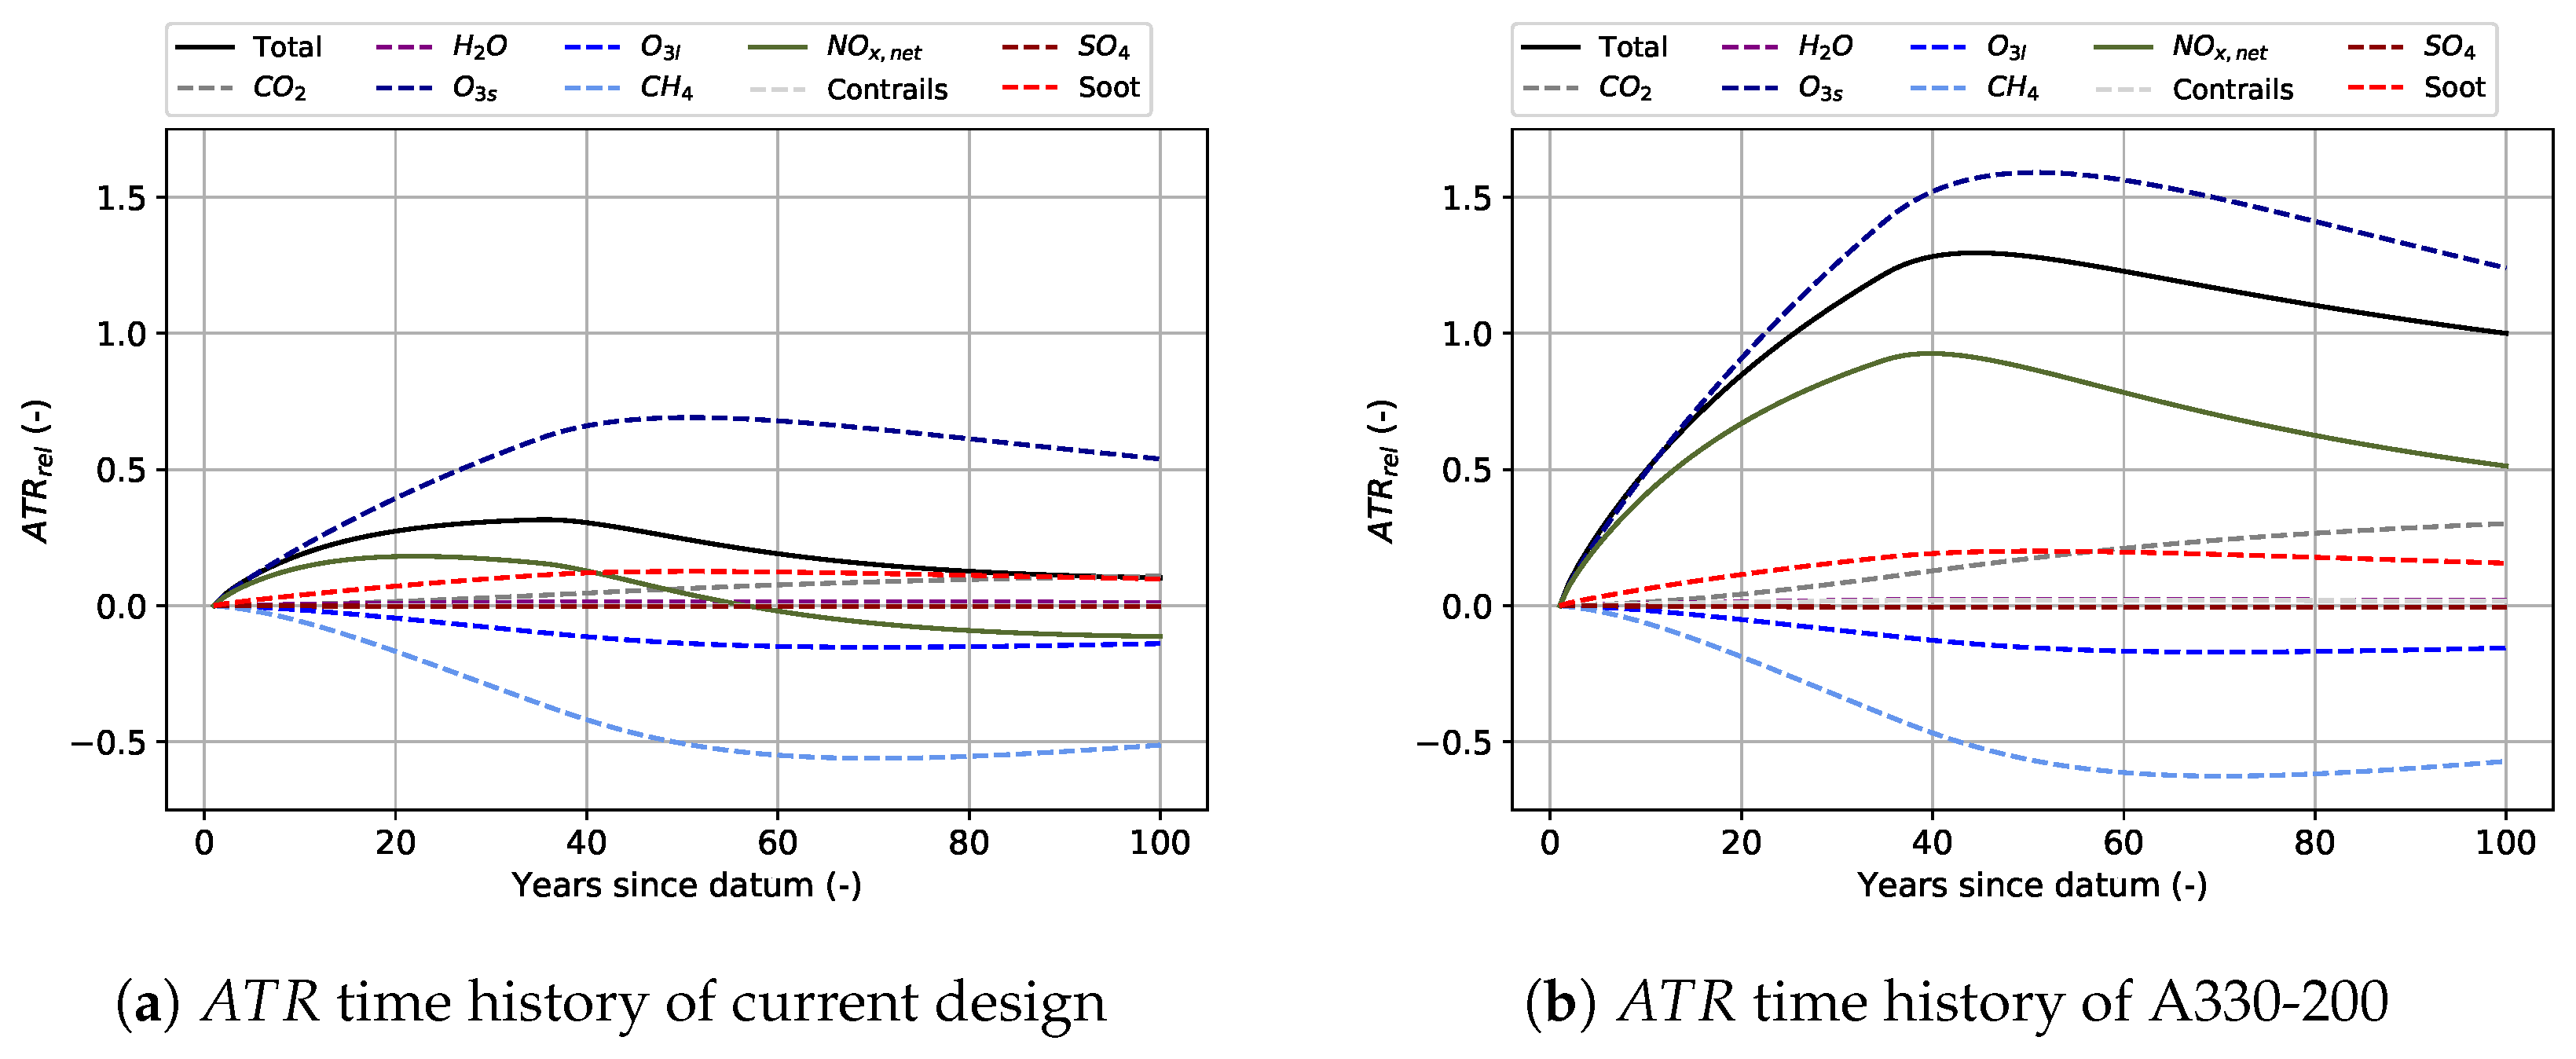
Figure 6 compares the contributions of various climate agents to the total A T R per km for the design-point configuration and mission profile described above. Results are shown for a single aircraft operating for 35 years and 12.49 average daily airborne hours, corresponding to 400 annual flights. Most notably, O3l, CH4 and SO4 have a cooling effect, whereas CO2, H2O, O3s and soot have a warming effect, and the total A T R peaks slightly after the end of the operating lifetime (35 years). The shape of the solid black line is governed by the relative magnitude of the two dominant emission agents, namely O3s and CH4, which, together with O3l, constitute the solid olive-green curve. In comparison, the A T R contribution of CO2 is driven by the overall fuel burn, where the lower carbon footprint of the FTK fraction increases the A T R C O 2 reduction (−63.9%) relative to the m f u e l reduction (−36.7%) reported in Table 3. A similar behaviour is observed for the contributions of H2O, SO4 and soot. Finally, for similar core exhaust temperatures, the higher cruise altitude of the A330-200 increases the likelihood of contrail formation according to the Schmidt-Appleman criterion [3]. However, if the uncertain effects of contrail-induced cirrus clouds are neglected, the A T R contribution of contrails in Figure 6 is very small. The remainder of this chapter shall only be concerned with the single-valued total A T R after 100 years.

4.4. Performance Sensitivity to Mission Parameters

This section explores the sensitivity of A T R and D O C to variations in cruise Mach number and altitude. To limit the computational cost, it was first assumed that the full mission is performed in cruise. After having determined the optimum combination of cruise Mach number and altitude, more accurate values of A T R and D O C were then computed for the mission profiles presented in Figure 5. A range of Mach numbers from 0.4 to 0.9 was considered, where the lower bound was constrained by the maximum allowable block time, and the upper bound was set by the drag divergence Mach number of the A330-200 displayed in Figure 3. Due to a lack of aviation NOx emissions data at lower altitudes, and the significant NOx forcing levels at higher altitudes, an altitude range from 5000 m to 9000 m was considered. Note that O3 production due to aircraft NOx emissions only occurs above 5 k m , whereas aviation-induced O3 below 5 k m is due to advection from higher altitudes [49].
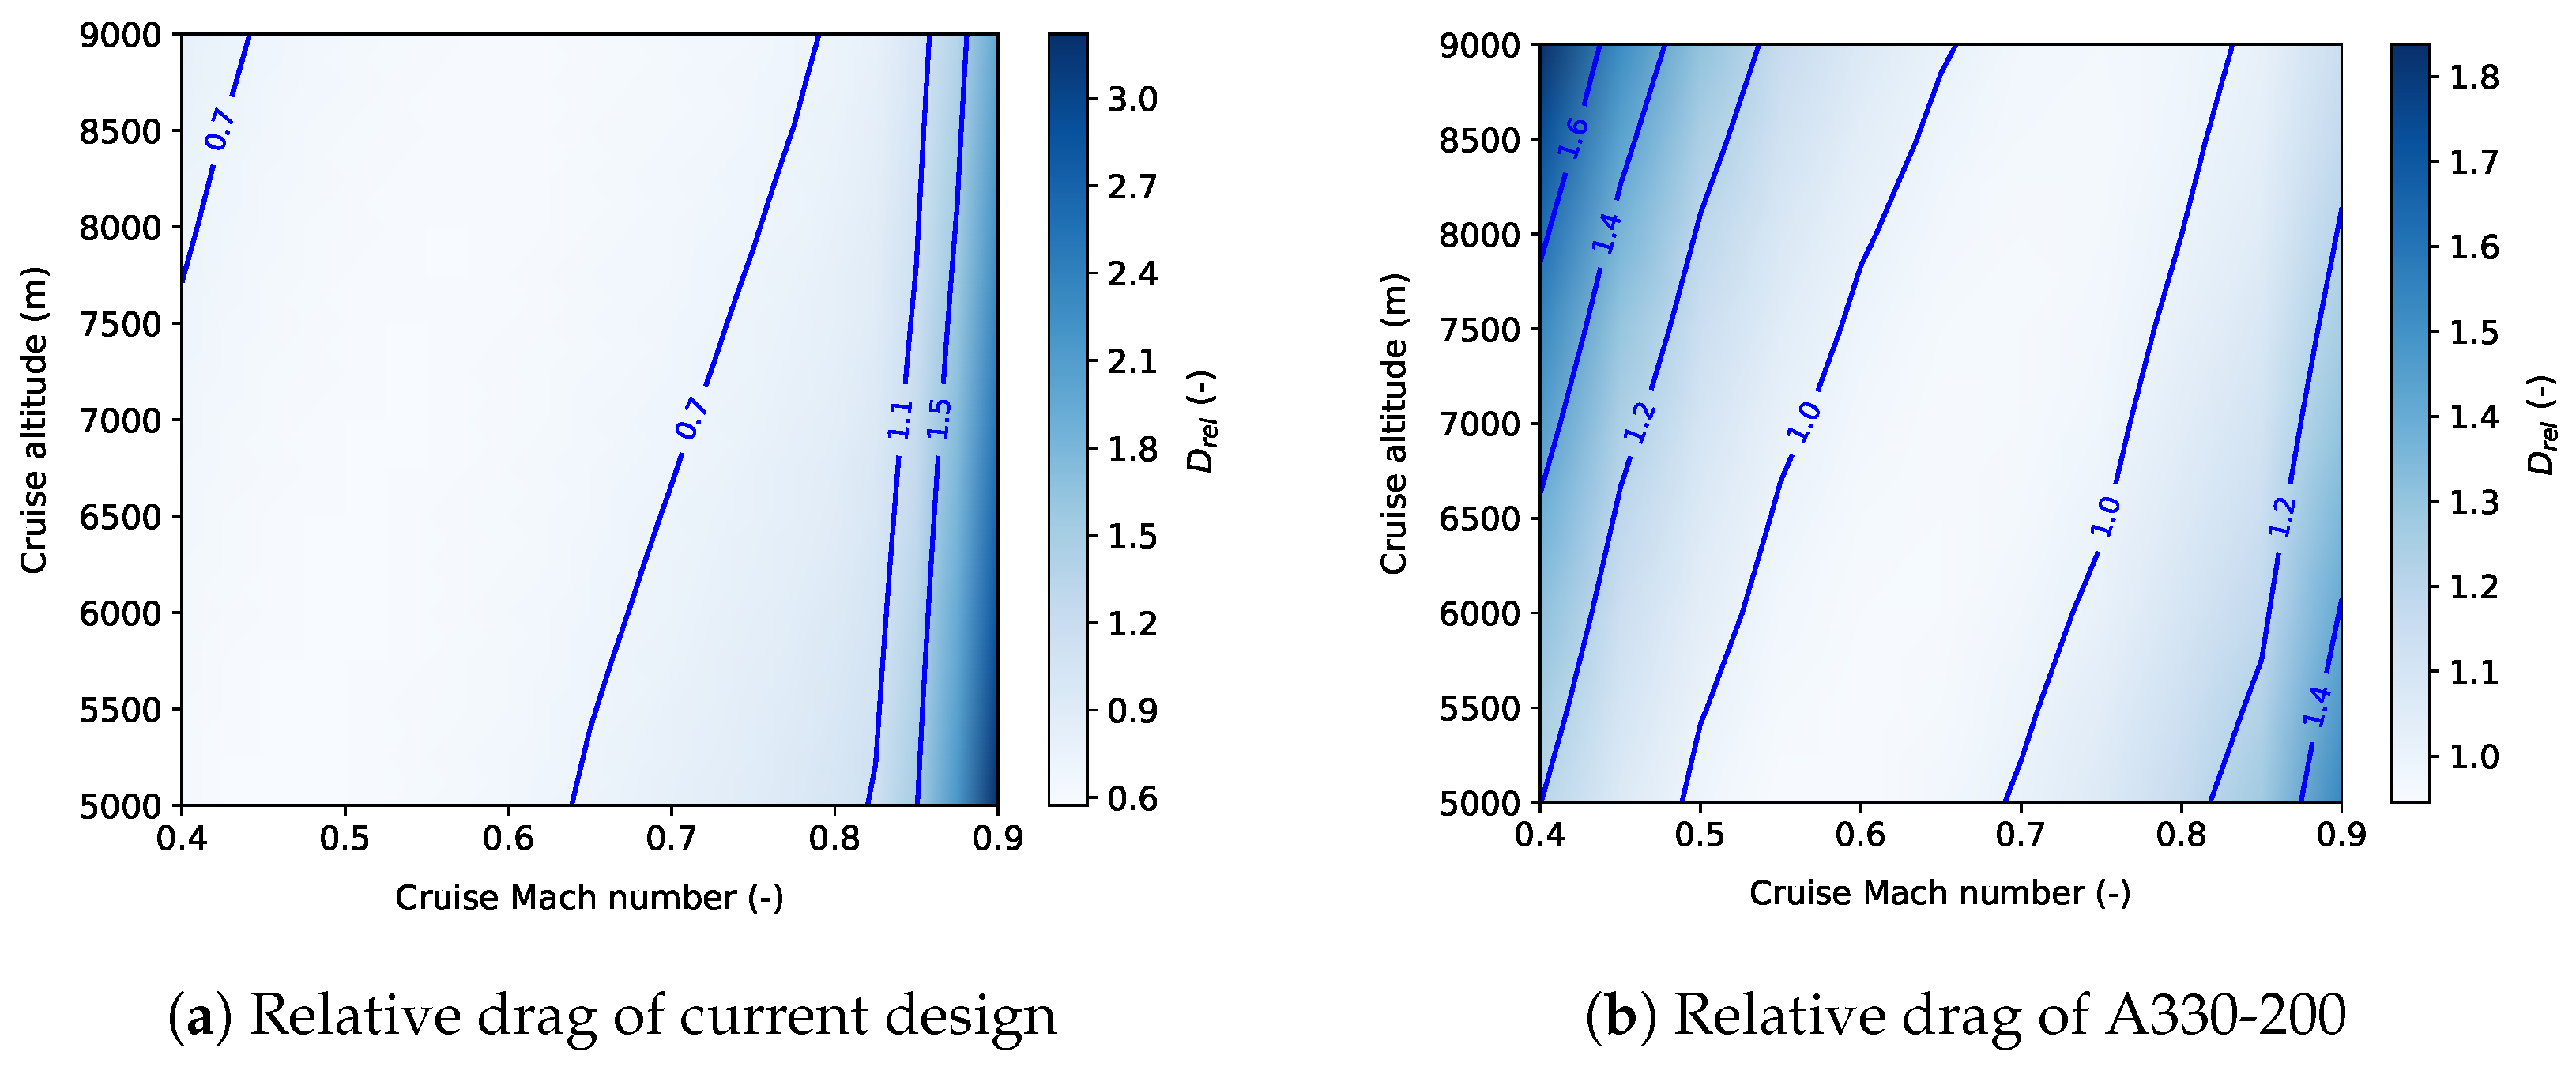
The drag and thrust-specific fuel consumption contribute to A T R and D O C via the burnt fuel mass, m f u e l = T S F C · D r a g · R a n g e / ( M · a ) . The drag ( D r e l ) in Figure 7 is expressed relative to the A330-200 operating at Mach 0.82 and 11,250 m altitude. In Figure 7a, a moderate increase in parasitic drag is observed at the critical Mach number of 0.64, whereas the penalty from exceeding the divergence Mach number of 0.83 is more substantial. At 5000 m altitude, the maximum C l / C d is achieved at Mach 0.46, and varies with altitude along the contour lines. The induced drag rise in the upper left corner results from the higher angle of attack required to balance the lower air density. Analogously, Figure 7b displays the relative drag variation for the A330-200, where the critical Mach number equals 0.79, the divergence Mach number is 0.9, and the maximum C l / C d at 5000 m occurs at Mach 0.6. Due to the non-zero quarter-chord sweep and supercritical airfoil, the drag rise at low Mach numbers and high altitudes is more substantial. It is thus concluded that the current design with zero sweep, an NLF airfoil and riblets, is better suited for operation at low Mach numbers and altitudes than the A330-200.
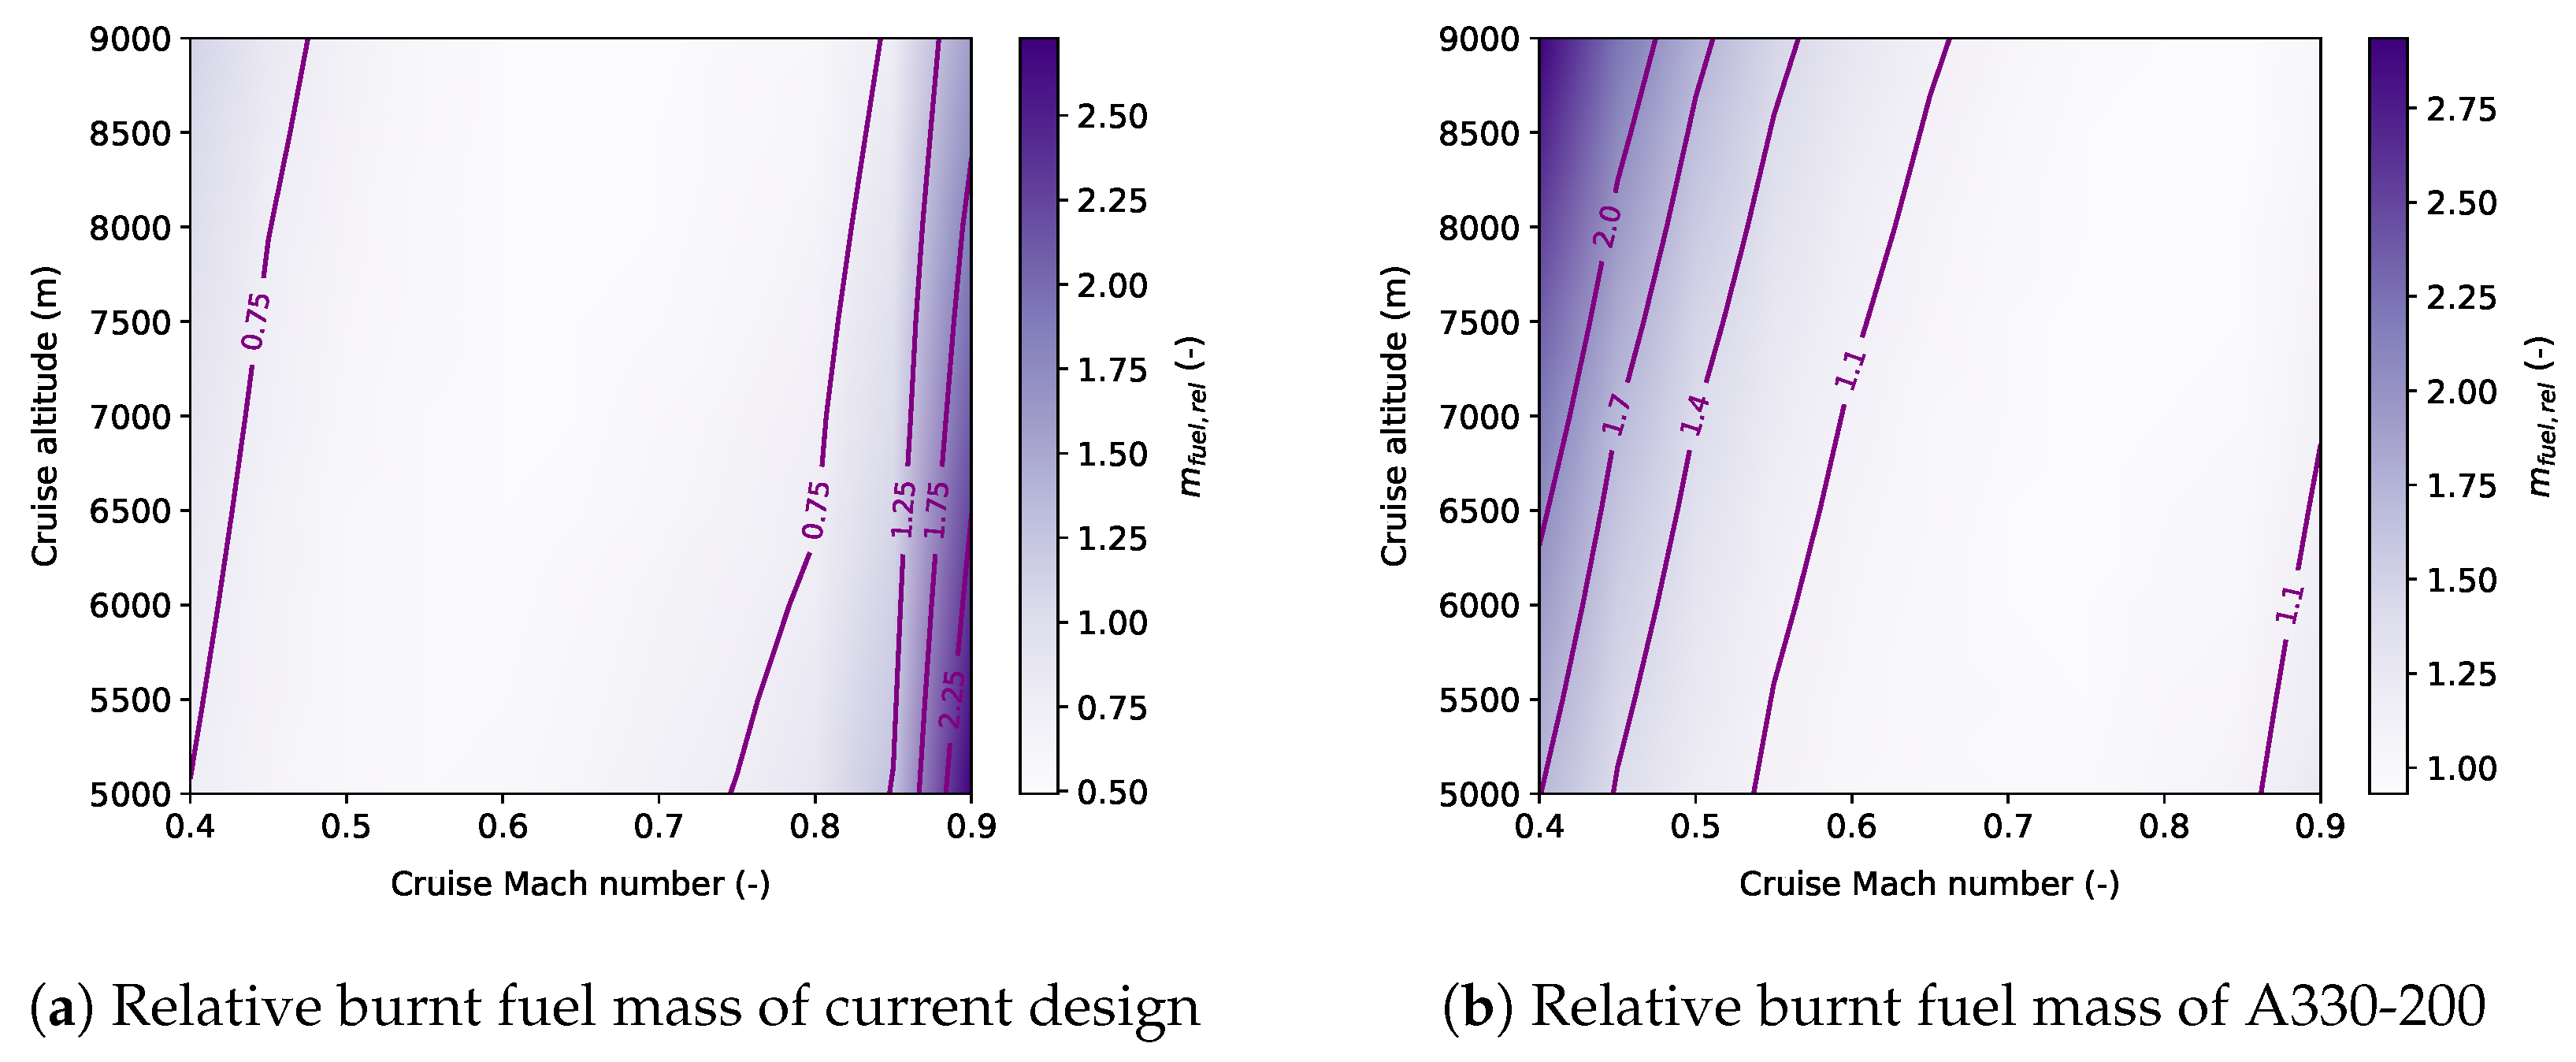
The relative T S F C in Figure 8a is largest at high Mach numbers and low altitudes, where P f a n / A f a n exceeds its design value and the blade tips suffer from major shock losses. Under these operating conditions, T S F C r e l is similar to the CF6-80E1 engines. At higher altitudes, where the ambient air density is lower, the disk power loading and T S F C reduce concomitantly, as does the thrust. Below Mach 0.65, T S F C r e l is almost invariant with altitude and Mach number. Analogously, the T S F C r e l of the CF6-80E1 turbofan engines increases with both altitude and Mach number, and approaches unity towards the design point in the upper right corner. This would suggest that the A330-200 should operate at a lower Mach number and altitude, however, Figure 9b reveals that the higher drag at lower Mach numbers and altitudes, combined with longer flight times, would increase the overall fuel consumption. In fact, the A330-200 and similar airliners are purposefully designed for high Mach numbers and high altitudes to maximise unit range, defined as the distance flown per unit quantity of fuel.
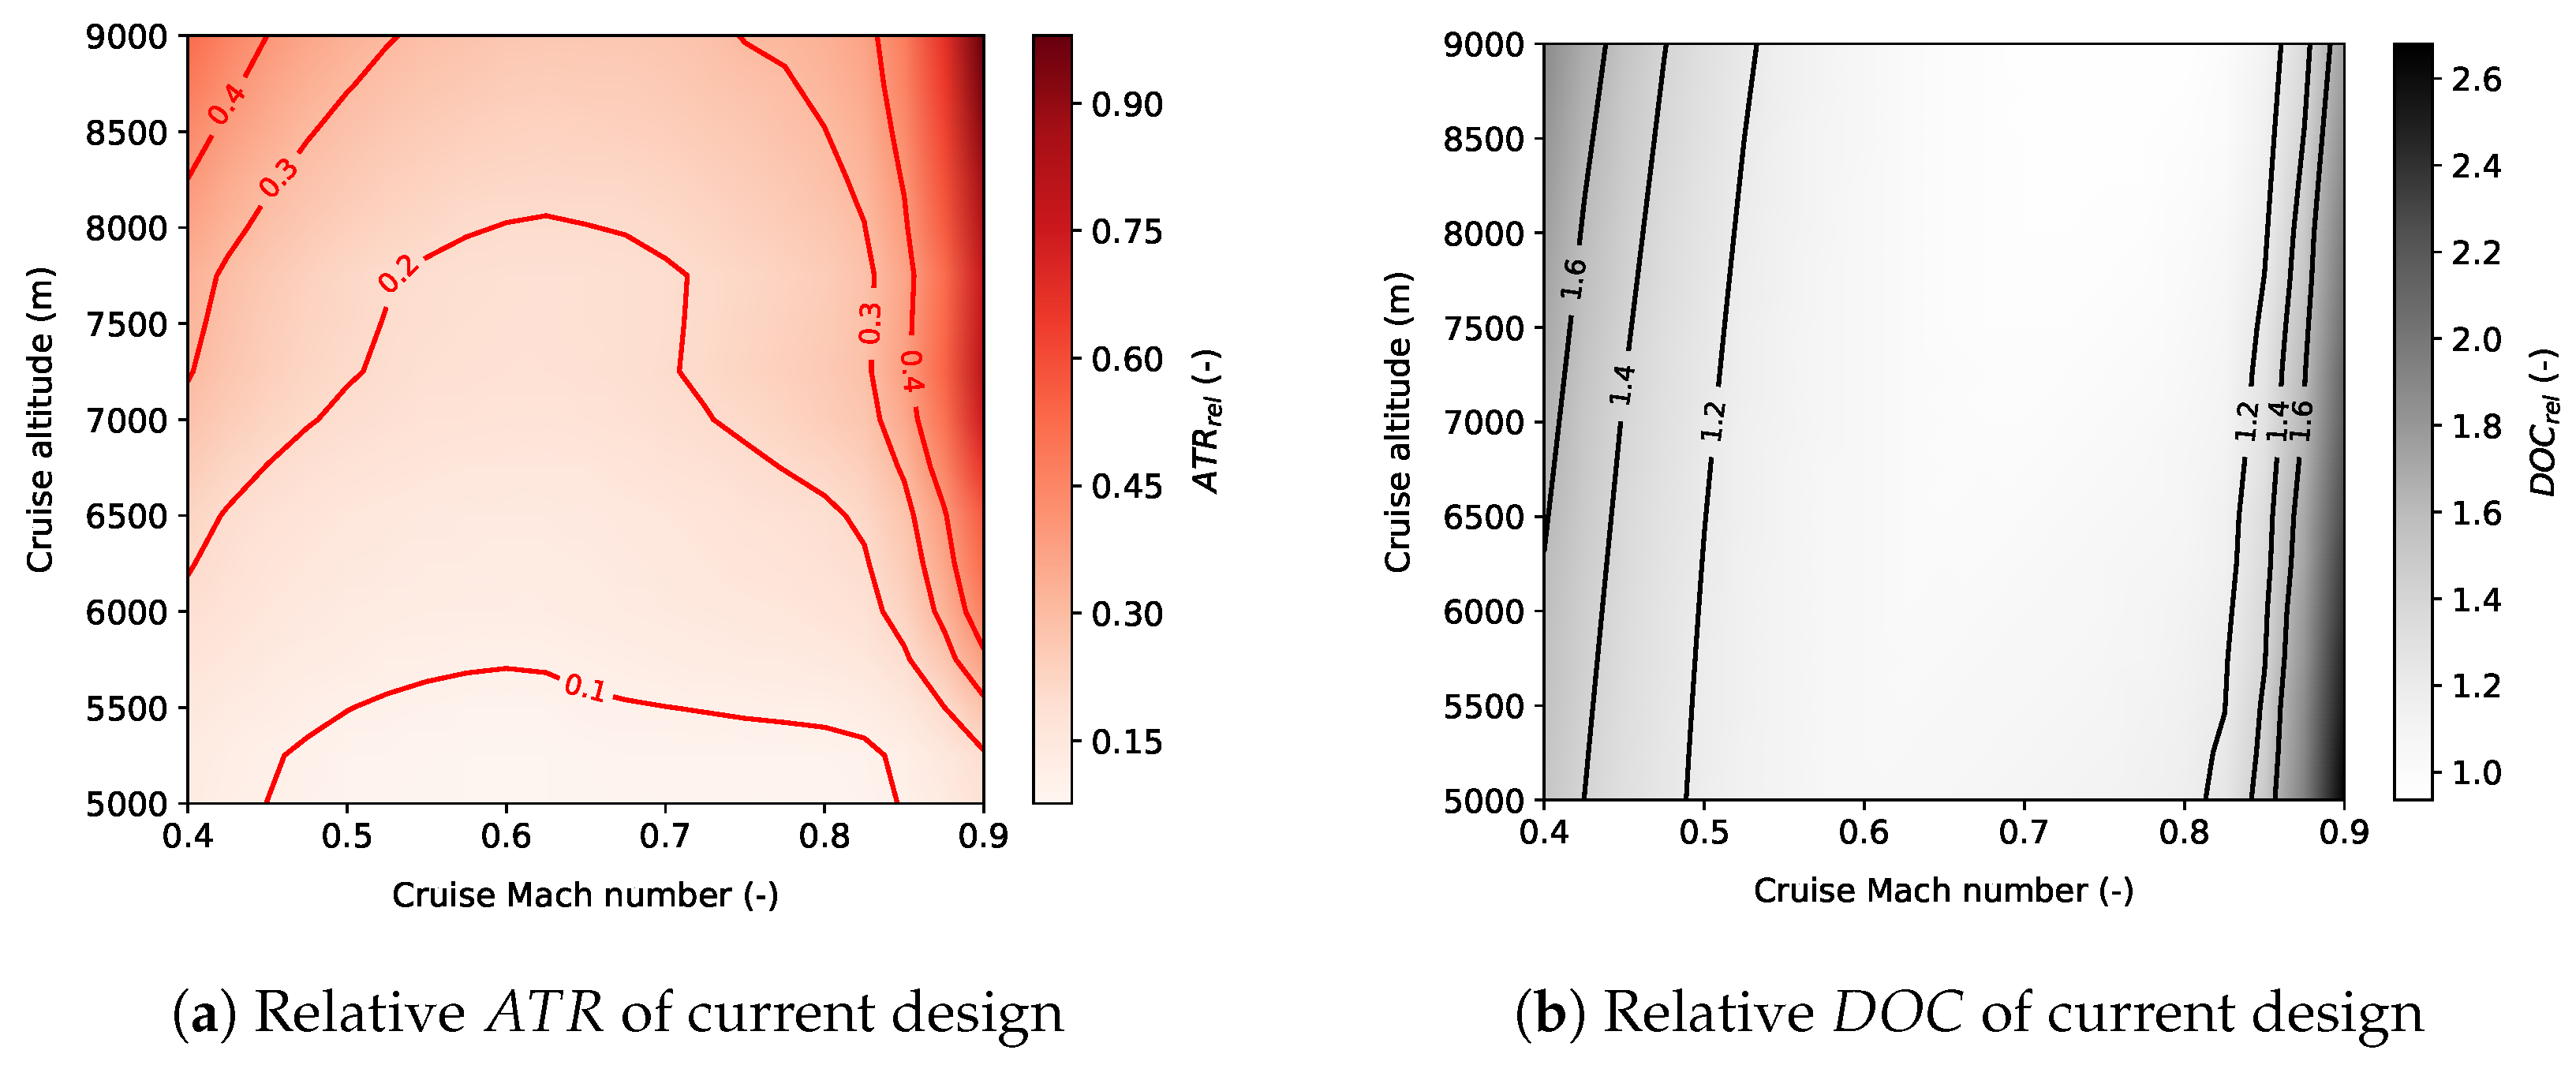
As mentioned previously, the sensitivity study on A T R and D O C shown in Figure 10 only encompasses the cruise phase, however, Section 4.6 will prove that the incurred loss in accuracy is small. Figure 10a suggests that the current design performs best with regards to A T R at low altitudes and intermediate Mach numbers (0.6–0.7), which agrees with the envisioned operating regime of open rotor engines, ranging between turboprops and turbofans. Drag divergence effects and open rotor performance limitations incur a steep A T R rise above Mach 0.83, whereas the rise at low Mach numbers and high altitudes is more gentle. To summarise, the general trend is that the altitude dependency of NOx-based O3s and contrails leads to an A T R rise with altitude at any Mach number.
The relative D O C in Figure 10b is dominated by time-dependent costs, including air navigation charges, and crew, fuel and oil costs. Hence its reduction with Mach number up to drag divergence. In contrast, D O C r e l is almost invariant with altitude, except at very low and very high Mach numbers, where either the induced or parasitic drag component degrades the economic profitability. Moreover, a trade-off exists between a higher drag at low altitudes and a higher ground speed for the same Mach number, the overall effect being a reduction in time-dependent costs.
An “optimum” operating point was selected under constraints of maintaining 40% laminar flow (prohibiting operation above the critical Mach number) and of restricting operation to altitudes predictable by the climate model (above 5000 m [49]). For the resulting cruise Mach number of 0.63 and cruise altitude of 5000 m , a maximum A T R reduction of 90% is realised, at the cost of a 5% D O C increase relative to the A330-200. By current standards, this operating point is unconventional; practical implications of this choice on the passengers, airlines, airports and air traffic control are discussed in Section 4.7.
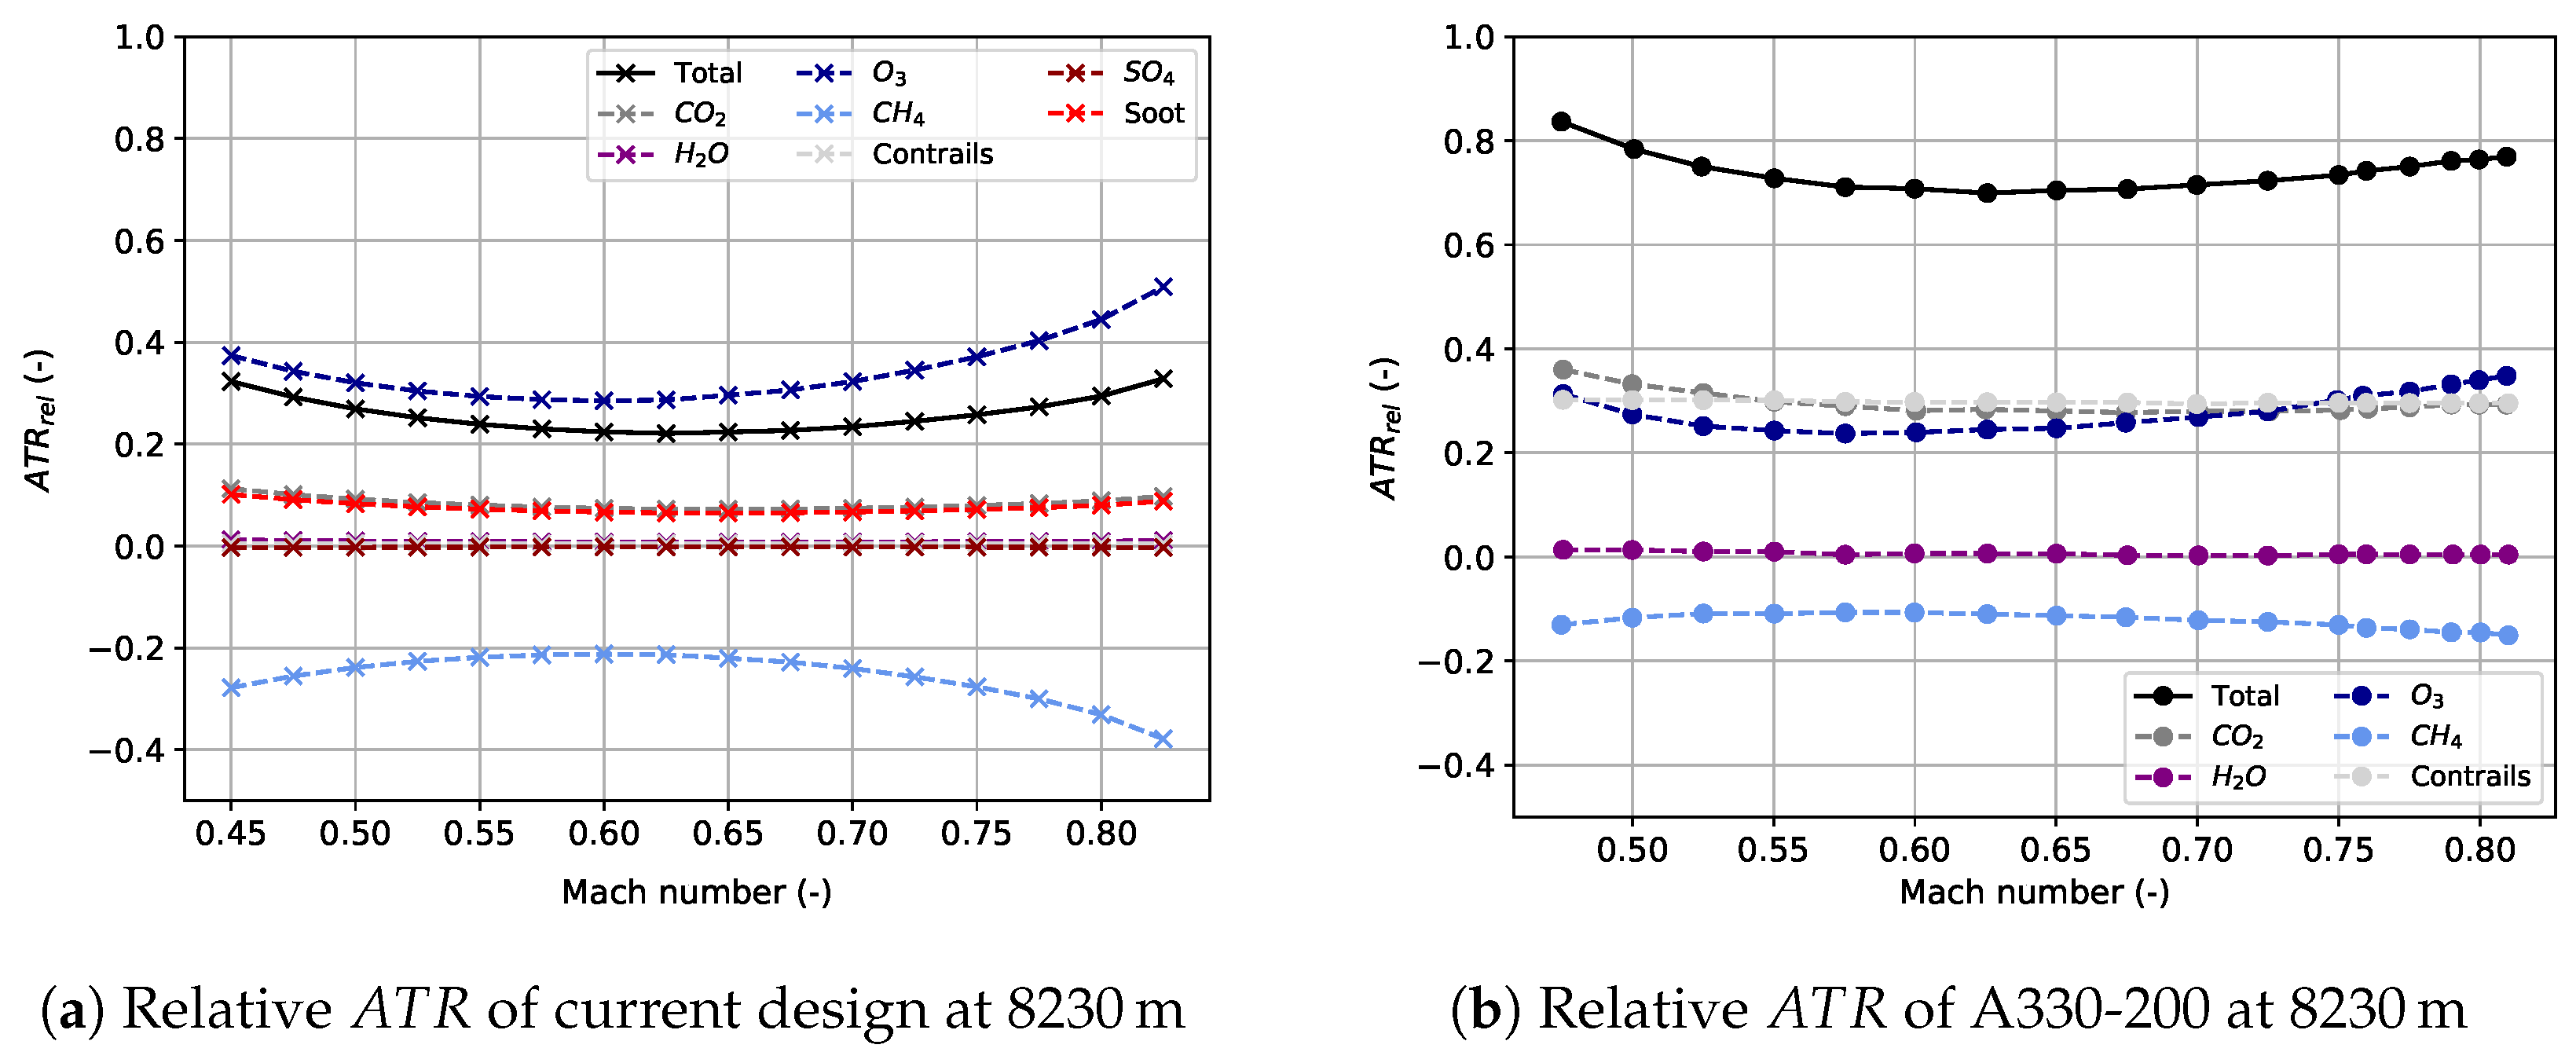
By fixing the altitude or Mach number to a reference value, and performing a sweep over the other parameter, more accurate information about the behaviour of individual A T R and D O C constituents can be obtained. In the following, comparisons are made with the results for an A330-200 on the 6650 k m route from Detroit to Frankfurt (0.725 cruise Mach number and 8230 m cruise altitude) presented in [2].
Figure 11 and Figure 12 depict the variation of A T R as a function of Mach number and altitude, respectively. The A T R contributions of all climate agents (dashed lines) sum up to the total A T R (solid black line), and are expressed relative to the A330-200 operating at Mach 0.82 and 10,973 m altitude [2]. The total A T R graph in Figure 11a is bucket-shaped, with a minimum at Mach 0.63, resulting in the lowest fuel burn. The amount of emitted CO2, H2O, SO4, and soot scales with the burnt fuel mass, hence the corresponding lines follow the trend observed in Figure 9a. At constant altitude, the climate forcing of the NOx depletion products O3 and CH4 (blue graphs) solely depends on the amount of emitted NOx, which is minimised at Mach 0.575. The dominance of O3 compared to Figure 12 is a direct consequence of the lower CO2 footprint.
Unlike in Figure 11a, the total A T R in Figure 12a depends on both the amount of emissions and the climate impact per unit mass. The total A T R increases steadily with altitude, owing to the dominance of NOx-depleted warming O3, whereas the cooling impact of CH4 diminishes with altitude. In both Figure 12a,b, the contribution from CO2 reduces with altitude, although less so for the current design, whose open rotor engines operate inefficiently at high altitudes. Moreover, the climate impact model in Section 3 assumes an altitude-invariant contribution of H2O, whereas according to [2] the atmospheric lifetime of H2O increases with altitude. This assumption does not affect the accuracy of the A T R gain reported in this study, since the altitude-dependency of A T R H 2 O in Figure 12 is negligible below 8000 m . Overall, the A T R gain of the current design is higher than that of the A330-200 under the same operating conditions, underpinning the climate impact reduction potential of open rotor engines, SAFs, riblets and NLF airfoils. Nonetheless, Figure 11b and Figure 12b have shown that considerable A T R gains can be achieved even without modifying the aircraft, merely by flying lower and slower (up to 61.9% at Mach 0.55 and 4220 m altitude [2]). However, as will be demonstrated hereafter, this incurs a substantial D O C penalty (30.2% for the aforementioned conditions [2]).
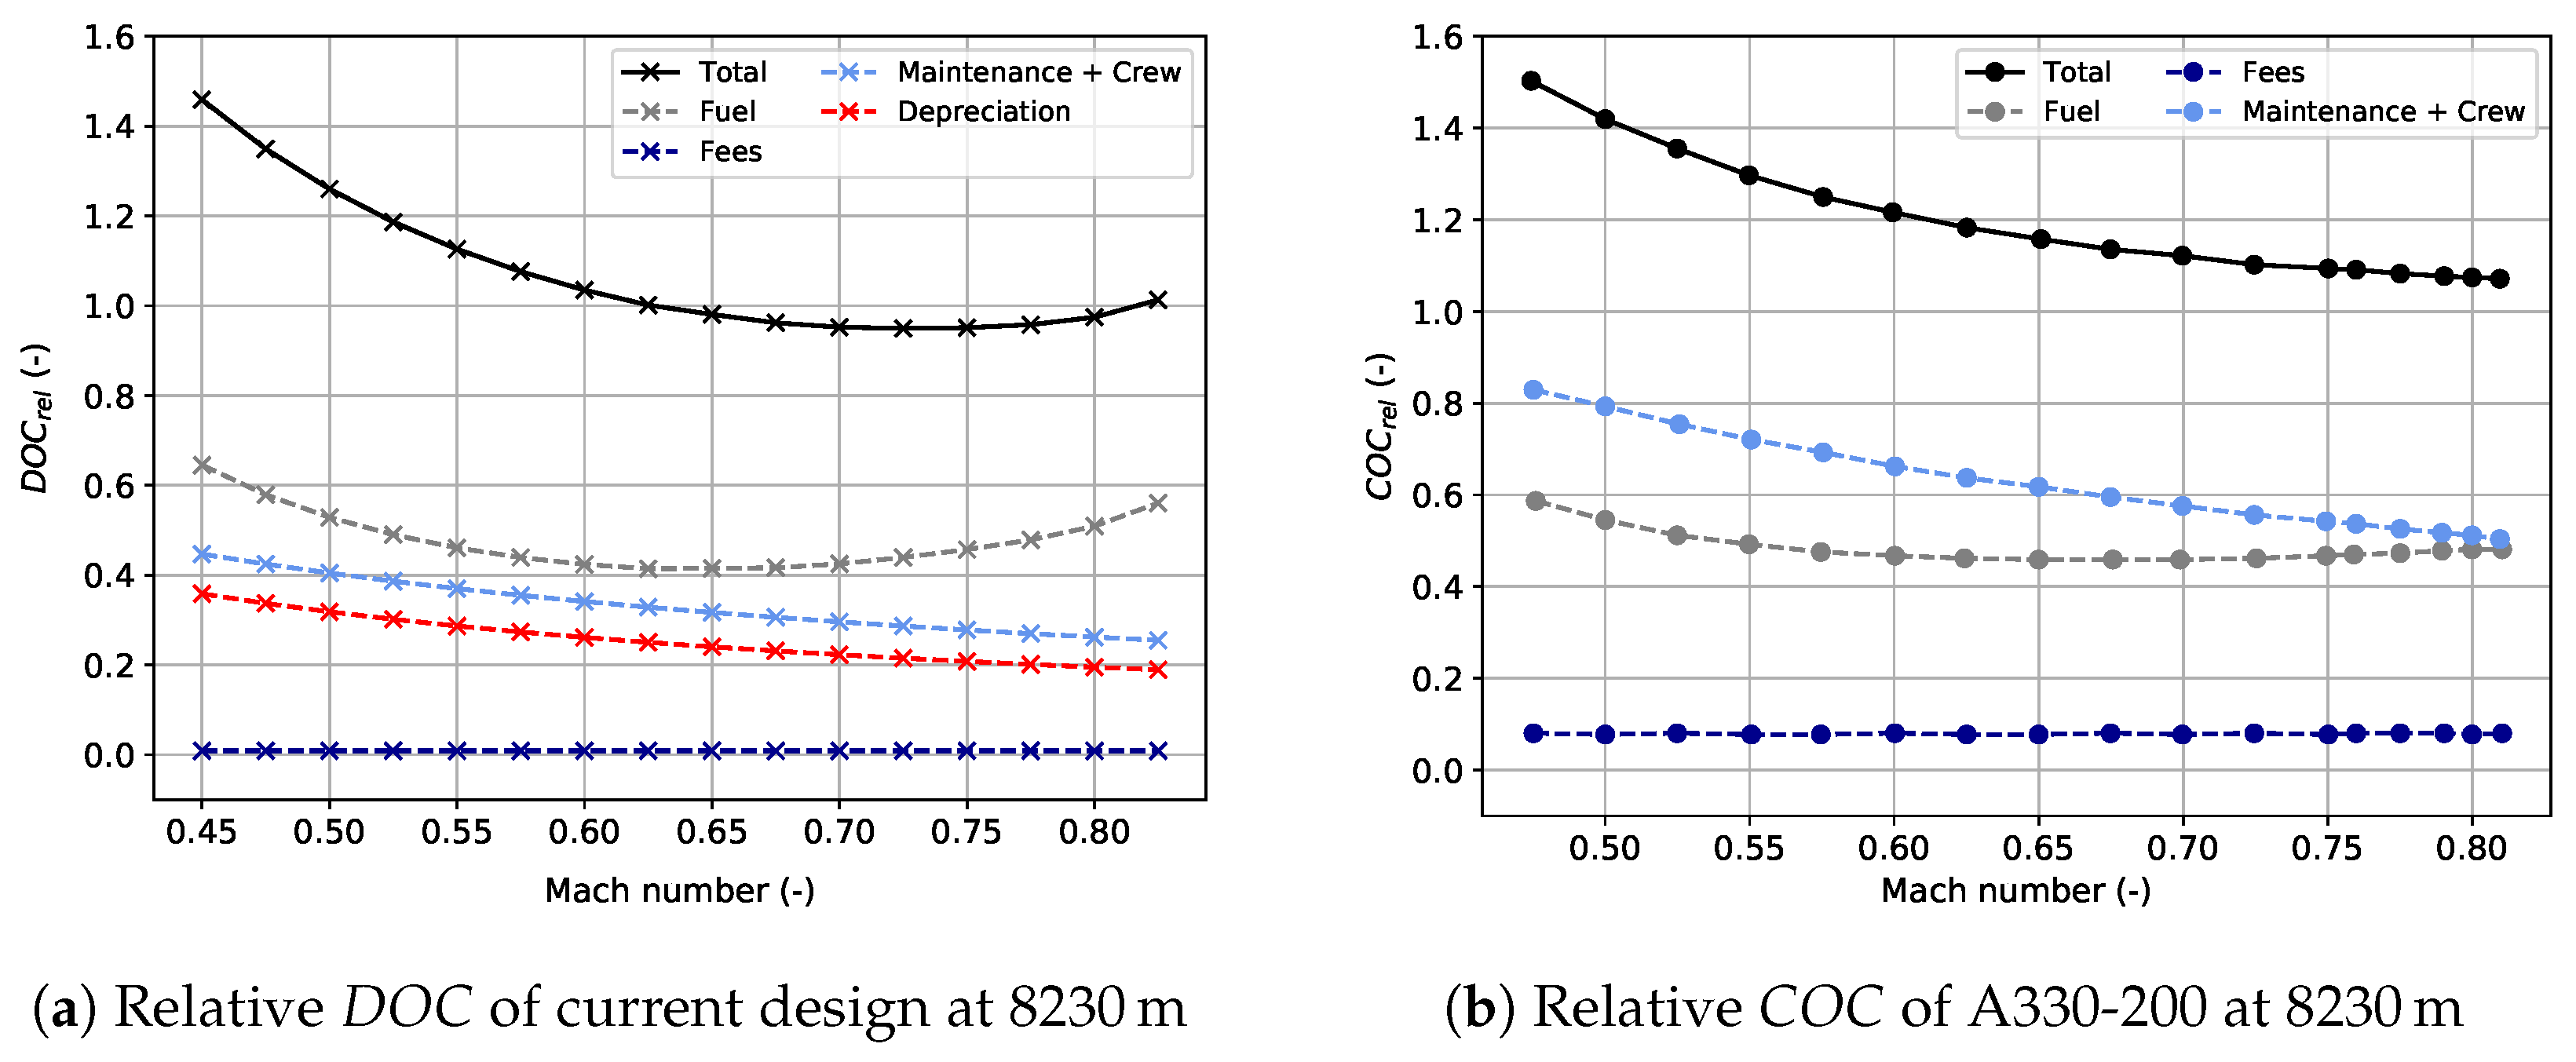
An analogous comparison of the D O C components (dashed lines) is made in Figure 13 and Figure 14, where the sum of fuel, maintenance and crew costs, as well as navigation charges, landing fees, and depreciation constitute the total relative D O C (solid black line). For the purpose of this comparison, the relative cash operating cost ( C O C r e l ) used in [2] is considered equivalent to D O C r e l . Both the current design and the A330-200 in Figure 13 follow the trend of time-dependent costs (maintenance, crew and depreciation). In particular, the fuel costs scale directly with fuel burn, which exhibits a minimum at Mach 0.65 for the current design, and at Mach 0.68 for the A330-200. This difference is both due to the different propulsion systems and airfoils. Similarly, the D O C contributions from depreciation, maintenance, and crew costs reduce with increasing Mach number, as more revenue-generating flights can be conducted within the same flight hours. Finally, navigation charges and landing fees solely depend on the M T O W and distance flown [2], hence they are invariant with Mach number and altitude.
Minor differences in the altitude-dependency of D O C are observed between Figure 14a and Figure 14b. The time-dependent D O C components of the A330-200 exhibit marginal increases with altitude due to the increased mission time for longer climb and descent segments, as well as the lower ambient temperatures, translating into a lower ground speed for the same Mach number. These effects are absent in the current design due to the constant-cruise mission assumed in this sensitivity study. In general, however, the time-dependent costs mainly depend on Mach number, as was previously shown in Figure 10b. These results demonstrate that operating the A330-200 at lower cruise Mach numbers and/or altitudes incurs a substantial D O C penalty. In contrast, the current design suggests that, by redesigning the airframe and implementing novel technologies, the increase in D O C can be limited, whilst achieving much larger reductions in climate impact.

4.5. Life-Cycle Climate Impact

Hitherto only the operational (OP) A T R footprint has been considered. To provide an estimation of the life-cycle A T R footprint, the contributions from manufacturing (MAN) and end-of-life (EOL) processes must be included. The amount of CO2 produced during manufacturing and EOL was obtained from the Ansys Granta EduPack software, and then converted into A T R C O 2 via the climate model outlined in Section 3. The operational A T R C O 2 comprises 35 years in service and 12.49 average daily airborne hours, where, for better comparability, only the contribution from CO2 was considered.
Table 4 associates an overwhelming majority (99.7%) of the current design’s life-cycle climate impact with the operating life. Other sources report similar values for commercial aircraft [50]. The right column lists the gain relative to the A330-200, where the 63.9% reduction during operations is less than that including all greenhouse gases (approximately 90%). By employing advanced manufacturing techniques, such as out-of-autoclave curing for composite airframe sections, the A T R C O 2 due to manufacturing could be reduced by 35.2%, however, the offsetting potential is limited by the energy demand of the recycling process itself. The overall life-cycle A T R C O 2 reduction equals 63.84%, and is thus heavily dominated by aircraft operations.

4.6. Performance Breakdown per Novel Design Feature

To shed light on the relative contribution from each of the considered design features, computations were performed to establish the relative A T R and D O C of design alternatives in which some of these features were omitted. For this analysis, it was assumed that the removal of features did not require a complete reconfiguration of the base design. Thus, for a fixed A T R -optimised aircraft using open rotor engines, cruising at a Mach number of 0.63 and at an altitude of 5000 m , the drag model and engine sizing were re-evaluated for each design alternative.
Computations were made to determine the relative A T R and D O C between the current aircraft and the A330-200 on their respective optimum mission profile (cruise Mach numbers of 0.63 and 0.82, and cruise altitudes of 5000 m and 11,250 m . As expected, the design which performed best in terms of its A T R reduction used all of the novel design features. It is therefore interesting to observe how the other design alternatives perform relative to this optimum baseline. The baseline design realised a relative A T R reduction of 89.8% at a D O C increase of 7.3%. In this section, the A T R and D O C have been computed using the accurate mission profiles from SUAVE shown in Figure 5. This differs from the foregoing sensitivity analysis, where A T R and D O C were computed for a simplified constant-cruise mission, although the numerical difference is small, thus validating this assumption.
Figure 15 shows the change in the relative A T R and D O C results with respect to the optimum baseline. For simplification, unique identifier codes were assigned to distinguish between different combinations of technologies. These are: P for the open rotor engine, R for riblets, F for synthetic kerosene, NACA for the use of the NACA 63(3)-418 airfoil, and SC for the use of the SC(2)-0414 airfoil.
In Figure 15a, design alternatives which use the NLF NACA airfoil outperform those using the supercritical airfoil by 1–2% in terms of their A T R performance. Using the Class II drag model, the C D of the PRFNACA design is 11.4% lower than its PRFSC counterpart at Mach 0.63, making the NLF airfoil more effective at lower Mach numbers. Since A T R reduction is related to drag reduction, at lower-than-conventional Mach numbers, design alternatives using the NLF airfoil will realise greater A T R reductions than those using a supercritical one. The use of riblets, as the choice of airfoil, has an effect on the A T R through its drag-reducing properties. Using the Class II drag model, the C D of the PRFNACA is 3.3% lower than its PFNACA counterpart at Mach 0.63. This lower impact on drag reduction directly correlates to a less significant A T R gain, realising A T R reductions of less than 1% relative to non-riblet-using designs. The final and most prominent design feature is that pertaining to the choice of synthetic kerosene. Each design alternative that used FTK performed substantially better than its non-FTK counterpart, realising A T R reductions between 8 and 10%. In a 50% blend mixture, FTK boasts a 42.5% reduction in CO2 emissions, which in this case outperforms the relative drag benefit of adopting riblets or an NLF airfoil.
Figure 15b shows the D O C performance of each of the design alternatives relative to PRFNACA. Designs which used 50% FTK realised a D O C increase, whilst those that used only Jet A-1 fuel realised a D O C decrease relative to the A330-200. Given the assumption that the price of FTK is 1.8 times that of conventional Jet A-1 fuel, and that the fuel price constitutes the most significant component of the D O C model, it is reasonable to expect that design alternatives that use FTK experience relatively large D O C increases compared to their non-FTK conjugates. For design alternatives that adopted NLF airfoils or riblets, it was assumed that these incurred no extra maintenance costs. Therefore, the changes in D O C were solely a consequence of the reduced total fuel burn caused by the reduced drag. Hence, it is reasonable to expect that design choices that utilise NLF airfoils and riblets underestimate D O C increases relative to their non-NLF and -riblet counterparts.
Improving the estimates of the effects of NLF and riblets on D O C would require estimates of their associated increases in maintenance frequency. This in turn requires an optimisation with inputs such as anticipated labour costs, changing contamination rates as a function of local conditions and time of year, and the anticipated price of the fuel saved [21]. Such an optimisation was not performed for this study due to a lack of appropriate data. However [21] indicates that in most scenarios the majority of the gains of NLF are realised after such optimisations are performed. For riblets, on the other hand, the cost of maintenance has been steadily decreasing, due to advancements in manufacturing techniques such as direct contactless microfabrication [23,24,25].
Based on the previous observations, design alternatives that used FTK realised both the largest A T R reductions and D O C increases relative to an A330-200 on its optimum mission profile. Therefore, for an airline interested in using FTK, a compromise must be found between a desired A T R reduction and the D O C increase they are willing to bear.

4.7. Implications of Revised Operating Conditions

The implications of commercial aircraft operation at reduced Mach numbers and altitudes are by no means restricted to A T R and D O C . In fact, several stakeholders within the air transportation system including passengers, airlines, airports, and air traffic control, would be affected either directly or indirectly by such operational changes.
Implications for passengers on the exemplary 8000 k m flight from Tokyo to Vancouver include a 1 h 40 min increase in travel time (Table 3), higher ticket prices and reduced travel comfort as a result of the increased turbulence levels at low altitudes. With regards to airline operability, longer flight times may conflict with night-flight bans at airports such as Frankfurt, or result in failure to meet buffer times for passengers on connecting flights. Unless the payload capacity of such new aircraft is higher than of those which they replace, or additional aircraft are commissioned, airline revenues will reduce. More importantly, a lower airline passenger capacity stands in conflict with a projected global passenger growth rate of 1.5–3.8% over the next 20 years [51]. For airports, altered flight schedules imply a shift in peak load times, potentially impacting the traffic capacity and availability of landing and take-off slots [2]. As was shown at the beginning of this chapter, aircraft optimised for lower Mach numbers and altitudes feature larger wing spans, increasing the demand for scarce ICAO Code F gates reserved for aircraft with wing spans between 65 m and 80 m [2]. The transition from high- to low-altitude operation will not take place overnight, and each airline will have to make a trade-off between lower A T R and higher D O C on a case-by-case basis. This circumstance will lead to a more heterogeneous air space utilisation and raise the number of air traffic control conflicts, demanding more frequent corrective actions. This scenario can only be mitigated by employing additional air traffic control staff, which will raise air navigation charges, and therewith D O C . Finally, aircraft operating at lower cruise altitudes will not be able to take advantage of the natural jet stream occurring between 8 and 11 k m altitude, which is leveraged by current transatlantic airliners as a means of reducing flight times and fuel consumption [52]. From a safety perspective, at low altitudes the flight icing threat increases, where supercooled liquid water contained in clouds freezes as it comes in contact with the aircraft skin, increasing the drag and deteriorating the lift-generating capability of the airframe [53].
Quantifying the impact of the above implications is beyond the scope of this work, but they must eventually be considered for the practical implementation of the current design.

5. Conclusions

In light of upcoming environmental legislation, aircraft manufacturers and operators will need short-term, cost-effective solutions to reduce aircraft emissions. Thus, the objective of this work has been to assess the climate impact mitigation potential of optimised flight profile parameters, combined with novel design features, as well as determine their adverse impact on D O C .
Compared to the Airbus A330-200, the resulting design achieved an 89.8% reduction in A T R , with a 7.3% increase in D O C . A sensitivity study was conducted for a Mach number range of 0.4–0.9 and an altitude range of 5000 m to 9000 m , which revealed that A T R scales primarily with altitude, whereas D O C varies almost exclusively with Mach number. It was found that by cruising at a low altitude and just below the critical Mach number, a good compromise between minimal climate impact and acceptable economic profitability can be achieved.
Amongst the various measures considered, the most impactful in terms of A T R and D O C was the modification of mission parameters, followed by the use of open rotor engines, and synthetic aviation fuels. Although the application of riblets and NLF airfoils reduced the drag, their contribution to the overall A T R reduction was of secondary importance. On the other hand, the use of synthetic aviation fuel compromised D O C the most, although this was partially mitigated by the high efficiency of the open rotor engines.
Aside from gauging the technical feasibility of achieving near-term climate goals, this paper highlighted some of the operational challenges which must be overcome to ensure that designs such as the current one reach operational maturity. Specifically, challenges related to the increased turbulence and icing levels at lower altitudes remain to be addressed, alongside logistical changes necessary to accommodate both longer flights and longer wings. If these challenges can be overcome, however, the environmental benefits would be substantial.

Author Contributions

This work is based on a Design Synthesis Exercise carried out by N.M.B., L.G., M.S.G. and those mentioned in the Acknowledgements. The exercise was conceived and supervised by D.M. and S.J.H. The manuscript was drafted by N.M.B., L.G. and M.S.G. All five authors contributed to the final text. All authors have read and agreed to the published version of the manuscript.

Funding

This research received no external funding.

Data Availability Statement

The data used to create Figure 1, Figure 3, Figure 4, Figure 5 and Figure 6 and Figure 11, Figure 12, Figure 13, Figure 14 and Figure 15 can be downloaded from: https://data.mendeley.com/datasets/ym5b4v3n6x/1 (accessed on 8 June 2022) (DOI: 10.17632/ym5b4v3n6x.1).

Acknowledgments

These authors gratefully acknowledge the contributions of M. Camus Amorós, O. Carpentier, G. di Summa, B. Galenkamp, V. Maes, A. Ramanna, P. Roeleveld, B. Çağlar and J. Pan to the design synthesis exercise, which formed the basis for this work.

Conflicts of Interest

The authors declare no conflict of interest.

Abbreviations

The following abbreviations are used in this manuscript:
C f Friction coefficient
D , C d Drag, drag coefficient
fLaminar-to-turbulent fraction
hAltitude
L , C l Lift, lift coefficient
MMach number
m , m ˙ Mass, mass flow
PPower
p , C p Pressure, pressure coefficient
R e Reynolds number
SSurface area
TTemperature, thrust
tTime
VVelocity
γ Ratio of specific heats
η Efficiency

Appendix A

A list of top-level aircraft design requirements is given below:
1.
The aircraft shall have a maximum operating range of 8000 k m
2.
The maximum flight time for the distance in 1. shall not exceed 16 h
3.
The aircraft shall accommodate 250 passengers
4.
The aircraft shall operate from runways of 2500 m in length
5.
The aircraft shall operate in crosswinds of 25 kts
6.
The aircraft shall operate in all weather conditions, including at least CAT II landings, with diversion capabilities
7.
In addition to standard CS-25 certification requirements, the safety and reliability of the passive flow control devices shall be assessed
8.
The aircraft shall make use of laminar flow control to delay laminar-to-turbulent transition
9.
The aircraft shall employ riblets to reduce turbulent skin-friction drag
10.
The aircraft shall utilise appropriate materials in manufacturing
11.
The aircraft design shall include an end-of-life plan for all system components
12.
The aircraft shall minimise A T R with no more than a 15% increase in D O C relative to an A330-200

References

  1. Hyde, D.; Barker, B.; Hodgson, P.; Miller, R.; Rapeanu, M. Target True Zero-Unlocking Sustainable Battery and Hydrogen-Powered Flight; Insight Report; World Economic Forum: Geneva, Switzerland, 2022. [Google Scholar]
  2. Koch, A. Climate Impact Mitigation Potential given by Flight Profile and Aircraft Optimization. Ph.D. Thesis, Technische Universität Hamburg-Harburg, Hamburg, Germany, 2013. [Google Scholar]
  3. Proesmans, P.; Vos, R. Airplane Design Optimization for Minimal Global Warming Impact. In Proceedings of the 2021 AIAA Scitech 2021 Forum, Virtual, 11–21 January 2021; pp. 1–25. [Google Scholar]
  4. Dallara, E.S.; Kroo, I.; Waitz, I. Metric for Comparing Lifetime Average Climate Impact of Aircraft. AIAA J. 2011, 49, 1600–1613. [Google Scholar] [CrossRef]
  5. Franz, K.; Risse, K.; Stumpf, E. Framework for Sustainability-Driven Aircraft Design. In Proceedings of the 2013 Aviation Technology, Integration, and Operations Conference, Los Angeles, CA, USA, 12–14 August 2013; pp. 1–20. [Google Scholar]
  6. Proesmans, P.J.; Vos, R. Comparison of Future Aviation Fuels to Minimize the Climate Impact of Commercial Aircraft. In Proceedings of the AIAA AVIATION 2022 Forum, Chicago, IL, USA, 27 June–1 July 2022; pp. 1–25. [Google Scholar]
  7. Marks, T.; Dahlmann, K.; Grewe, V.; Gollnick, V.; Linke, F.; Matthes, S.; Stumpf, E.; Swaid, M.; Unterstrasser, S.; Yamashita, H.; et al. Climate Impact Mitigation Potential of Formation Flight. Aerospace 2021, 8, 14. [Google Scholar] [CrossRef]
  8. Hendricks, E.; Tong, M. Performance and Weight Estimates for an Advanced Open Rotor Engine. In Proceedings of the 48th Joint Propulsion Conference and Exhibit, Atlanta, GA, USA, 30 July–1 August 2012; pp. 1–12. [Google Scholar]
  9. Gamah, I.; Self, R. Advanced Open Rotors-Balancing Noise Costs Against Reduced Carbon Emissions for Future Aircraft; Omega Project 36—Final Report; University of Southampton: Southampton, UK, 2009. [Google Scholar]
  10. Hall, C.; Zachariadis, A.; Brandvik, T.; Sohoni, N. How to Improve Open Rotor Aerodynamics at Cruise and Take-off. Aeronaut. J. 2014, 118, 1103–1123. [Google Scholar] [CrossRef] [Green Version]
  11. Rolls-Royce Ultrafan. Available online: https://www.rolls-royce.com/media/our-stories/innovation/2016/advance-and-ultrafan.aspx (accessed on 5 February 2022).
  12. CFM Aero Engines. Available online: https://www.cfmaeroengines.com/sustainability/ (accessed on 5 February 2022).
  13. Cabrera, E.; de Sousa, J.M.M. Use of Sustainable Fuels in Aviation—A Review. Energies 2022, 15, 2440. [Google Scholar] [CrossRef]
  14. Braun-Unkhoff, M.; Riedel, U.; Wahl, C. About the Emissions of Alternative Jet Fuels. CEAS Aeronaut. J. 2016, 8, 167–180. [Google Scholar] [CrossRef] [Green Version]
  15. Blakey, S.; Rye, L.; Wilson, C. Aviation Gas Turbine Alternative Fuels: A Review. Proc. Combust. Inst. 2011, 33, 2863–2885. [Google Scholar] [CrossRef]
  16. Hileman, J.; Ortiz, D.S.; Bartis, J.T.; Wong, H.M.; Donohoo, P.E.; Weiss, M.A.; Waitz, I.A. Near-Term Feasibility of Alternative Jet Fuels; Technical Report; RAND Corporation: Santa Monica, CA, USA, 2009. [Google Scholar]
  17. Zschocke, A.; Scheuermann, S. High Biofuel Blends in Aviation (HBBA); Technical Report; Deutsche Lufthansa AG: Cologne, Germany, 2012. [Google Scholar]
  18. Novelli, P. Sustainable Way for Alternative Fuels and Energy in Aviation; Technical Report; ONERA-Fundamental and Applied Energetic Department: Palaiseau, France, 2012. [Google Scholar]
  19. Zang, G.; Sun, P.; Yoo, E.; Elgowainy, A.; Lee, A.B.U.; Wang, M.; Supekar, S. Synthetic Methanol/Fischer-Tropsch Fuel Production Capacity, Cost, and Carbon Intensity Utilizing CO2 from Industrial and Power Plants in the United States. Environ. Sci. Technol. 2021, 55, 7595–7604. [Google Scholar] [CrossRef] [PubMed]
  20. Dallara, E.S. Aircraft Design for Reduced Climate Impact. Ph.D. Thesis, Stanford University, Stanford, CA, USA, 2011. [Google Scholar]
  21. Wicke, K.; Kruse, M.; Linke, F.; Gollnick, V. Impact of Insect Contamination on Operational and Economic Effectiveness of Aircraft with Natural Laminar Flow Technology. In Proceedings of the 29th Congress of the International Council of the Aeronautical Sciences (ICAS), St. Petersburg, Russia, 7–12 September 2014; pp. 1–17. [Google Scholar]
  22. Spalart, P.; McLean, J. Drag Reduction: Enticing Turbulence, and then an Industry. Philos. Trans. R. Soc. A Math. Phys. Eng. Sci. 2011, 369, 1556–1569. [Google Scholar] [CrossRef] [PubMed] [Green Version]
  23. Quinn, M.; McGrath, D.; Bell, D.C.; Bilinsky, H.C.; Builth-Williams, J.; Feichtinger, C.; Leitl, P.A.; Flanschger, A.; Shahjahan, S. Advancements in Drag-Reducing Riblet Film Production for Aviation and Other Applications. In Proceedings of the AIAA SCITECH 2022 Forum, San Diego, CA, USA, 3–7 January 2021; pp. 1–10. [Google Scholar]
  24. Leitl, P.A.; Feichtinger, C.; Bilinsky, H.C.; Flanschger, A.; Quinn, M.; de Vinaspre, I.O.; Forster, B. Riblet design, manufacturing, and measurements—A new rapid iteration process. In Proceedings of the AIAA Scitech 2021 Forum, Virtual, 11–15 & 19–21 January 2021; pp. 1–11. [Google Scholar]
  25. Bilinsky, H.C. Microfabrication of Riblets for Drag Reduction. In Proceedings of the 55th AIAA Aerospace Sciences Meeting, Grapevine, TX, USA, 9–13 January 2017; pp. 1–11. [Google Scholar]
  26. Lufthansa Technik. Available online: https://www.lufthansa-technik.com/aeroshark (accessed on 30 January 2022).
  27. Roskam, J. Airplane Design Part I: Preliminary Sizing of Airplanes; DARcorporation: Lawrence, KS, USA, 2002; pp. 1–85. [Google Scholar]
  28. Torenbeek, E. Synthesis of Subsonic Aircraft Design; Kluwer Academic Publishers: Delft, The Netherlands, 1982; pp. 50–53. [Google Scholar]
  29. Roskam, J. Airplane Design: Part VIII: Airplane Cost Estimation: Design, Development, Manufacturing and Operating; DARcorporation: Lawrence, KS, USA, 1990. [Google Scholar]
  30. Pearce, B. State of the Airline Industry. Available online: https://www.iata.org/en/iata-repository/publications/economic-reports/state-of-the-airline-industry/ (accessed on 18 June 2021).
  31. Hemmings, B.; Eckhard, P.; Forsyth, P.; Strand, J.; Mundaca, G.; Kageson, P. Taxing Aviation Fuel in Europe. Back to the Future? Technical Report; European Federation for Transport and Environment: Brussels, Belgium, 2020. [Google Scholar]
  32. Brons, M.; Pels, E.; Nijkamp, P.; Rietveld, P. Price Elasticities of Demand for Passenger Air Travel: A Meta-Analysis. J. Air Transp. Manag. 2002, 8, 165–175. [Google Scholar] [CrossRef] [Green Version]
  33. Lee, J.; Lukachko, S.; Waitz, I.; Schafer, A. Historical and Future Trends in Aircraft Performance, Cost and Emissions. Annu. Rev. Energy Environ. 2001, 26, 167–200. [Google Scholar] [CrossRef] [Green Version]
  34. Saravanamuttoo, H.; Rogers, G.; Cohen, H. Gas Turbine Theory, 5th ed.; Pearson: London, UK, 2001. [Google Scholar]
  35. Durand, W. Aerodynamic Theory, 2nd ed.; Julius Springer: Berlin, Germany, 1935. [Google Scholar]
  36. Raymer, D. Aircraft Design: A Conceptual Approach, 6th ed.; American Institute of Aeronautics and Astronautics, Inc.: Reston, VA, USA, 2018. [Google Scholar]
  37. Modesti, D.; Endrikat, S.; Hutchins, N.; Chung, D. Dispersive Stresses in Turbulent Flow over Riblets. J. Fluid Mech. 2021, 917, 1–36. [Google Scholar] [CrossRef]
  38. Dorsey, A.; Uranga, A. Design Space Exploration of Future Open Rotor Configurations. In Proceedings of the AIAA Propulsion and Energy 2020 Forum, Virtual, 24–28 August 2020; pp. 1–30. [Google Scholar]
  39. Bowers, A. Laminar Flow and the Holy Grail (blog). 11 February 2011. Available online: https://blogs.nasa.gov/Dryden/2011/02/11/post_1296777084480/ (accessed on 8 June 2021).
  40. Solomon, S.; Qin, D.; Manning, M.; Chen, Z.; Marquis, M.; Averyt, K.B.; Tignor, M.; Miller, H.L. (Eds.) Contribution of Working Group I to the Fourth Assessment Report of the Intergovernmental Panel on Climate Change; Cambridge University Press: Cambridge, UK; New York, NY, USA, 2007. [Google Scholar]
  41. Sausen, R.; Schumann, U. Estimates of the Climate Response to Aircraft CO2 and NOx Emissions Scenarios. Clim. Chang. 1998, 44, 27–58. [Google Scholar] [CrossRef] [Green Version]
  42. Lee, D.S.; Pitari, G.; Grewe, V.; Gierens, K.; Penner, J.E.; Petzold, A.; Prather, M.J.; Schumann, U.; Bais, A.; Berntsen, T.; et al. Transport Impacts on Atmosphere and Climate: Aviation. Atmos. Environ. 2010, 44, 4678–4734. [Google Scholar] [CrossRef] [PubMed] [Green Version]
  43. Vos, R.; Farokhi, S. Introduction to Transonic Aerodynamics; Springer: Dordrecht, The Netherlands, 2015; Volume 110. [Google Scholar]
  44. Mason, W. Configuration Aerodynamics: Transonic Aerodynamics of Airfoils and Wings; Virginia Tech: Blacksburg, VA, USA, 2006; pp. 12–13. [Google Scholar]
  45. Airbus A330-200. Available online: https://aircraft.airbus.com/en/aircraft/a330/a330-200 (accessed on 28 July 2022).
  46. Airbus A330 Aircraft Characteristics—Airport and Maintenance Planning Manual. Available online: https://www.airbus.com/sites/g/files/jlcbta136/files/2021-11/Airbus-Commercial-Aircraft-AC-A330.pdf (accessed on 28 July 2022).
  47. EASA Type-Certificate Data Sheet for CF6-80E1 Series Engines. Available online: https://www.easa.europa.eu/downloads/7789/en (accessed on 24 January 2022).
  48. Lukaczyk, T.W.; Wendorff, A.D.; Colonno, M.; Economon, T.D.; Alonso, J.J.; Orra, T.H.; Ilario, C. SUAVE: An Open-Source Environment for Multi-Fidelity Conceptual Vehicle Design. In Proceedings of the 16th AIAA/ISSMO Multidisciplinary Analysis and Optimization Conference, Dallas, TX, USA, 22–26 June 2015; pp. 1–56. [Google Scholar]
  49. Köhler, M.O.; Rädel, G.; Dessens, O.; Shine, K.P.; Rogers, H.L.; Wild, O.; Pyle, J.A. Impact of Perturbations to Nitrogen Oxide Emissions from Global Aviation. J. Geophys. Res. 2008, 113, 1–15. [Google Scholar] [CrossRef] [Green Version]
  50. Ashby, M.; Shercliff, H.; Cebon, D. Materials: Engineering, Science, Processing and Designs, 3rd ed.; Butterworth-Heinemann: Oxford, UK, 2014. [Google Scholar]
  51. IATA, 20 Year Passenger Forecast. Available online: https://www.iata.org/en/publications/store/20-year-passenger-forecast/ (accessed on 4 February 2022).
  52. Met Office, What Is the Jet Stream. Available online: https://www.metoffice.gov.uk/weather/learn-about/weather/types-of-weather/wind/what-is-the-jet-stream (accessed on 4 February 2022).
  53. Smith, W.L., Jr.; Minnis, P.; Fleeger, C.; Spangenberg, D.; Palikonda, R.; Nguyen, L. Determining the Flight Icing Threat to Aircraft with Single-Layer Cloud Parameters Derived from Operational Satellite Data. J. Appl. Meteorol. Climatol. 2020, 51, 1794–1810. [Google Scholar] [CrossRef]
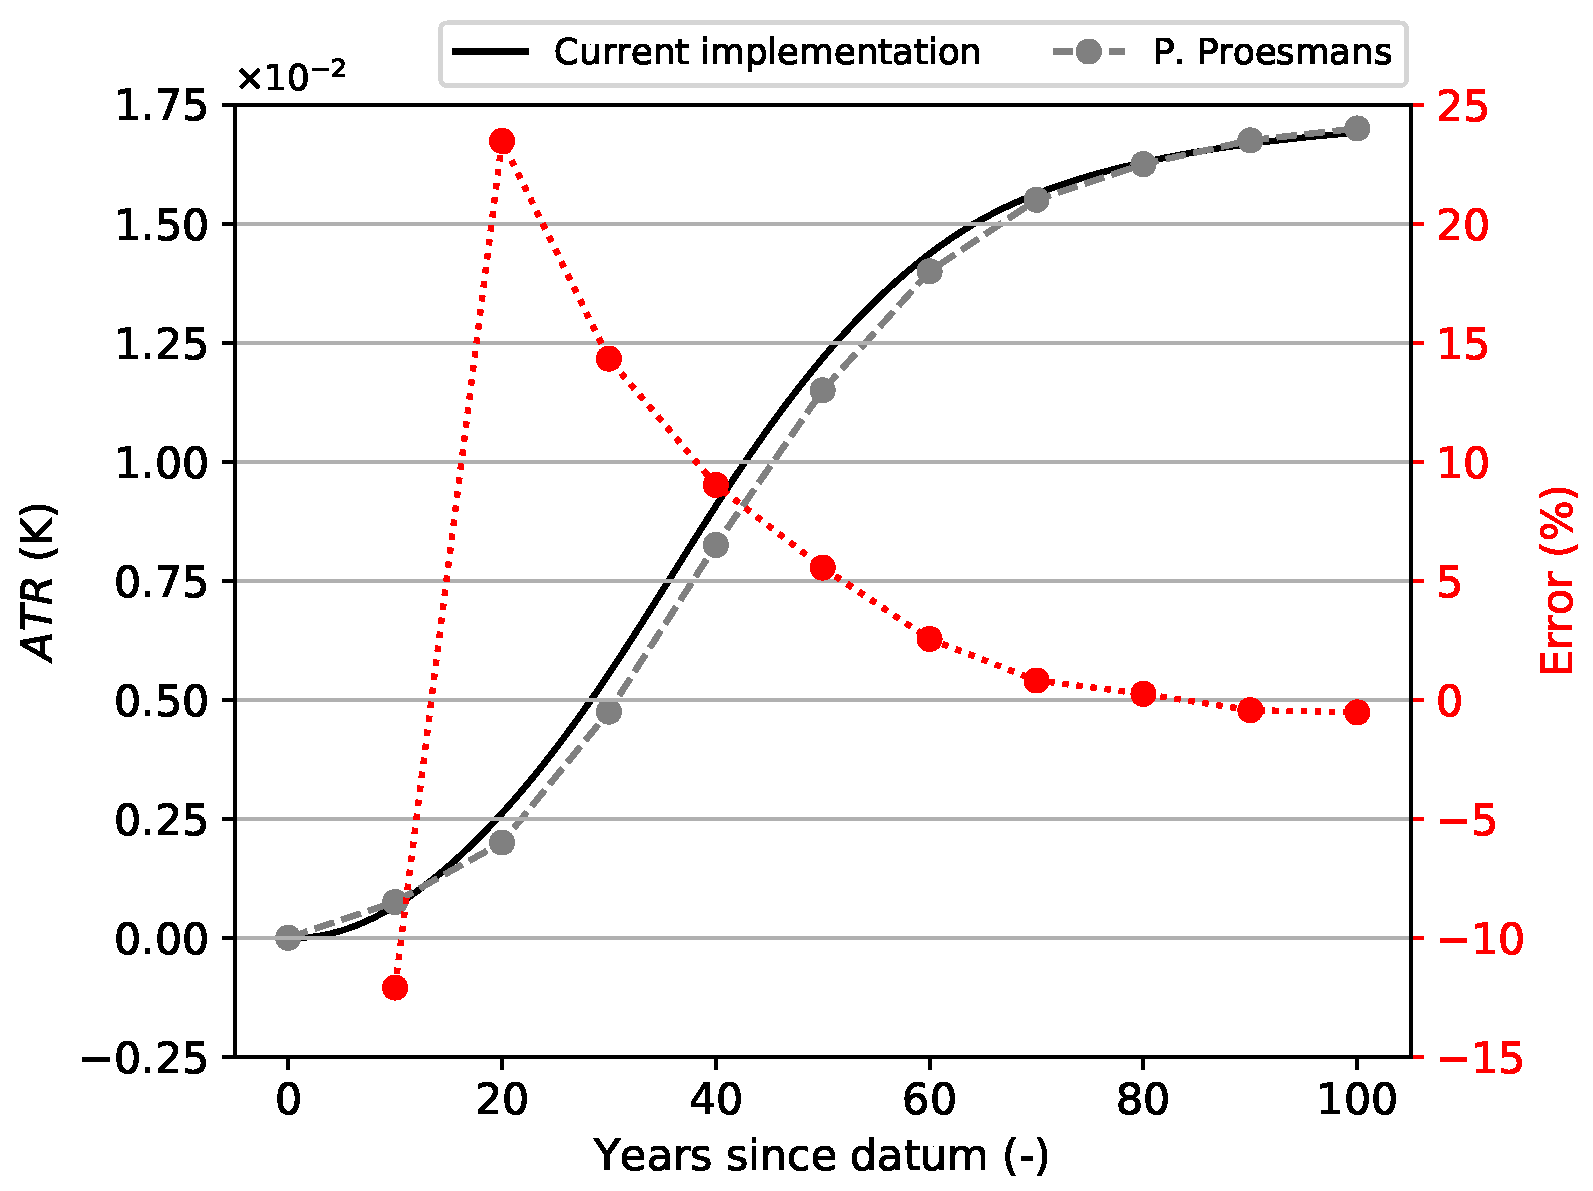
Figure 1. Verification of climate impact model (dashed grey reference data from [3]).
Aerospace 09 00436 g001
Figure 2. Airframe dimensions of current design and A330-200.
Aerospace 09 00436 g002
Figure 3. Drag behaviour of the current design’s NACA 63(3)-418 NLF airfoil and the NASA SC(2)-0414 supercritical airfoil used to model the A330-200.
Aerospace 09 00436 g003
Figure 4. Payload-range diagram of current design and A330-200.
Aerospace 09 00436 g004
Figure 5. Reference mission profiles of current design and A330-200 modelled in SUAVE.
Aerospace 09 00436 g005
Figure 6. Evolution of A T R footprint per climate agent for current design and A330-200 on their respective reference mission.
Aerospace 09 00436 g006
Figure 7. Drag variation with cruise Mach number and altitude (relative to A330-200 at Mach 0.82 and 11,250 m ).
Aerospace 09 00436 g007
Figure 8. Variation of T S F C with Mach number and altitude (relative to A330-200 at Mach 0.82 and 11,250 m ).
Aerospace 09 00436 g008
Figure 9. Variation of burnt fuel mass with Mach number and altitude (relative to A330-200 at Mach 0.82 and 11,250 m ).
Aerospace 09 00436 g009
Figure 10. Variation of A T R and D O C relative to the A330-200 operating at Mach 0.82 and 11,250 m .
Aerospace 09 00436 g010
Figure 11. A T R variation with Mach number relative to the A330-200 operating at Mach 0.82 and 10,973 m (A330-200 data from [2]).
Aerospace 09 00436 g011
Figure 12. A T R variation with altitude relative to the A330-200 operating at Mach 0.82 and 10,973 m (A330-200 data from [2]).
Aerospace 09 00436 g012
Figure 13. D O C / C O C variation with Mach number relative to the A330-200 operating at Mach 0.82 and 10,973 m (A330-200 data from [2]).
Aerospace 09 00436 g013
Figure 14. D O C / C O C variation with altitude relative to the A330-200 operating at Mach 0.82 and 10,973 m (A330-200 data from [2]).
Aerospace 09 00436 g014
Figure 15. A T R and D O C performance for each design alternative, relative to the baseline PRFNACA which adopts all of the novel design features.
Aerospace 09 00436 g015
Table 1. Airframe design parameters (A330-200 data from [2]).
Aircraft MTOW (N) OEW (N) N pax (-) AR (-) Λ c 4 (deg)
Current design 1788 · 10 3 889 · 10 3 250110
A330-200 2256 · 10 3 1179 · 10 3 2539.2629.7
Table 2. Engine design parameters (CF6-80E1 data from [47]).
Engine BPR (-) OPR (-) T st , sl (N) D fan (m) L tot (m) W dry (kg)
Open rotor3030 259 · 10 3 5.33.795334
CF6-80E15.332.6 310 · 10 3 2.94.175091.62
Table 3. Performance data of current design and A330-200 for reference mission.
Parameter t b (hours) Ma ¯ (-) h ¯ (m) m fuel (kg) TSFC ¯ ( g kNs ) η tot ¯ (%)
Current design11.410.61466737,40311.8539.2
A330-2009.730.77994659,11717.2732.3
Relative change+17.3%−20.8%−53.1%−36.7%−31.4%+21.4%
Table 4. A T R contributions from various life-cycle stages.
Life-Cycle PhaseCurrent DesignA330-200Relative Gain (%)
Manufacturing (%)0.320.18−35.24
Operations (%)99.6999.85−63.90
End-of-life (%)−0.01−0.03−85.03
Publisher’s Note: MDPI stays neutral with regard to jurisdictional claims in published maps and institutional affiliations.