Article

Parameter Sensitivity Study on Inflow Distortion of Boundary Layer Ingested Turbofans

1
Department of Mechanics and Maritime Sciences, Chalmers University of Technology, 412 96 Göteborg, Sweden
2
Aircraft Research Association Limited, Bedford MK41 7PF, UK
*
Author to whom correspondence should be addressed.
Aerospace 2022, 9(8), 426; https://doi.org/10.3390/aerospace9080426
Submission received: 11 July 2022 / Revised: 1 August 2022 / Accepted: 2 August 2022 / Published: 4 August 2022
(This article belongs to the Section Aeronautics)

Abstract

:
The inflow distortion to the fan introduced by the ingestion of the fuselage boundary layer is the most critical challenge in realizing the benefits of boundary later ingesting (BLI) concepts. Minimizing the level of distortion while maintaining the desired amount of ingested boundary layer and free stream flow is crucial in minimizing the penalties to fan efficiency and noise emissions. In this paper, a parametric sensitivity study is performed to examine the integration of two semi-buried BLI turbofans at the rear end of a typical tube-and-wing body (TWB) fuselage. The key parameters influencing BLI, such as the nacelle installation positions, wing position, fuselage length, rear fuselage shape, intake shape and operating conditions were evaluated by computational fluid dynamics (CFD). Among the investigated parameters, increasing the nacelle spanwise installation spacing improved inflow distortion by reducing the diffusion separation, but this needs to be offset against the added weight and nacelle drag. A high wing position variant showed strong interference between the wing and the nacelle, which must be avoided as this significantly increases the complexity of the inflow distortion. A moderate angle of attack (AOA) variation did not affect the fan inflow distortion but there was a tendency for interference from the wing to increase when the AOA was increased. The general conclusions from this study will be useful in the conceptual design of a similar type of BLI configuration, as well as a more comprehensive optimization of this type of aircraft–engine integration.

1. Introduction

The possibility of achieving aircraft drag reduction by utilizing the boundary layer for propulsion was first realized by Smith and Roberts [1] in 1947. However, it is only in the past two decades that increasing pressure to reduce aviation emissions has urged the aviation industry to investigate more revolutionary airframe and propulsion technologies [2,3]. These pressures have brought the BLI propulsion concept back into the spotlight. One of the major advantages that makes this concept attractive is that BLI could be principally beneficial for a range of different airframe and propulsion configurations, in particular, those radical airframe and propulsion technologies that allow for a feasible differential placement of BLI propulsors [4]. In the case of revolutionary aircraft designs, such as blended wing body (BWB) designs and distributed propulsion configurations, BLI propulsors have been widely considered [5,6,7]. For aircraft propulsion concepts that facilitate different degrees of electrification, studies have indicated that BLI could play a role as an important benefit booster [8,9,10]. Looking at less revolutionary ideas for short term consideration, the possibility of utilizing BLI in conventional tube-and-wing body (TWB) airframes has been extensively explored. A typical configuration is one additional electric-drive BLI propulsor installed at the rear end of a TWB fuselage, which forms a turboelectric system together with conventional under-wing podded turbofans [11,12,13,14]. This BLI configuration allows for the highest percentage of the boundary layer generated from the full 360 ° of the fuselage to be ingested into the BLI fan and theoretically delivers the maximum performance benefit [15]. However, before the full theoretical potential of BLI in this type of configuration can be realized, several practical difficulties must be overcome, as highlighted in [16]. One of the major difficulties is that there is a limit on the amount of boundary layer that can be utilized efficiently due to the practical installation penalties from the required drive components. The architecture of BLI turbofans mounted alongside the rear part of the fuselage is an attractive alternative since no additional unconventional components are needed, but this configuration has less potential in capturing the fuselage body boundary layer [15]. Representative configurations of this type of BLI architecture include the NASA D8 [17,18,19,20], ONERA NOVA [21,22,23,24] and Airbus Nautilus [25,26], where the first involves a more radical airframe design and the latter two are similar to a conventional TWB configuration. The sensitivity of BLI effects to the different TWB airframe geometric features (wing, vertical tailplane, fuselage nose and tail cone and fuselage body) has been investigated in [27] by means of computational fluid dynamics (CFD), which provides helpful guidelines in the preliminary design of TWB airframes for BLI applications.
Another key research area for BLI is to develop understandings of propulsors operating under the distorted inflow conditions incurred by ingestion of the boundary layer. Among the most critical aspects of this topic that need to be addressed are the penalties to propulsor efficiency and noise generation arising from these distorted inflow conditions. Previous studies [19,26,28,29,30,31,32,33] suggest that the fan efficiency penalty due to BLI effects could vary from 6.0% to less than 1.0%, while the operational stability can be ensured by using specific distortion-tolerant fan and inlet designs. Designing a low noise distortion-tolerant propulsor is difficult, particularly for BLI turbofans. As reported in [23,24,34,35], significant increases in cumulative noise levels of around 15 to 18 EPNdB have been observed in BLI configurations. Additionally, distortion-tolerant propulsors can be expected to have increased weight compared to a conventional propulsor design due to the requirement of increased fan and bearing stiffness.
In the context of BLI research, an integrated aerodynamic design of the airframe and propulsors is essential in order to correctly evaluate the potential of a BLI configuration. The fuselage or inlet geometry upstream of the propulsor fan ought to be carefully shaped to ensure the desired amount of boundary layer is ingested by the fan and to reduce the inflow distortion, which is critical for carrying out further component-level design or full system analysis. Focusing on TWB BLI applications, extensive studies in coupled aerodynamic design and optimization have been conducted for the single aft-mounted electric-drive BLI propulsor, named BLI360 in Figure 1 [12,36,37,38,39,40,41]. As for the mounting of twin propulsors, named BLI180 in Figure 1, a comprehensive investigation of the general design features of this concept has been conducted in [27]. The study is based on a simplified geometric setup, where non-dimensional BLI effects are calculated on predefined circular areas along the fuselage. This simplified setup, however, cannot ideally reproduce the complex scenario of a real aircraft. An obvious difference is that the engine is partially buried within the fuselage body rather than being mounted outside with a precise blockage zone of 360 degrees. The validity of the three-dimensional flow characteristics based on the simplified model must be carefully examined for a fully installed aircraft. Other research includes the NOVA concept studies published by ONERA [21,22,23,24], which mainly comprise case studies regarding fan noise analysis, and do not report any systematic study regarding the sensitivity of the ingested boundary layer to the fuselage and inlet geometric parameters. The presented work therefore intends to establish a systematic study based on a CFD study of fully installed aircraft geometries. The specific aim is to understand the effects of the representative airframe and nacelle geometries on the inflow distortion upstream of the BLI180 fan under cruise conditions with a varied angle of attack (AOA) and the mass flow capture ratio (MFCR). Additionally, the effect of the wing vertical position and fuselage length are investigated.

2. Methodology

2.1. Aircraft Geomoetry

The isolated airframe geometry with no nacelles installed is shown in Figure 2. It originates from a DLR F6 [42] and has been scaled to a similar size representative of a short-medium range aircraft. The fuselage consists of five sections, and their length parameters are labelled in the figure. The BLI180 configurations are derived from the isolated airframe by mounting two turbofan nacelles alongside the airframe tail cone. The wing is modified to provide representative flow at the fuselage and incorporates features for compatibility with the wind tunnel support system. One of these configurations is viewed in Figure 3. The fan diameter inside the nacelle is 1.98 m, which is the same as a CFM LEAP-1A [43].

2.2. Selection of Design Parameters

The key design parameters of the nacelle integration study are given in Table 1. A two-dimensional study was performed to explore the wider design space before the more focused 3D simulations described later in the paper. The diffusive profile of the fuselage follows the Bell–Mehta 5th order polynomial. The fore cowl conforms to cowl 6 outlined in [44] combined with a circular arc rear profile. The baseline model is built with h/D = 0.4, la/D = 4.8, lb/D = 4.8 and e/D = 0.
Based on the analysis of the 2D simulation results, appropriate 2D models were chosen. A subset of these 2D models were extended to 3D models. The simulations of the 3D models were conducted to improve understandings of the sensitivity of the design parameters. One 3D model was selected to evaluate the sensitivity of mass flow through the nacelle, the flight AOA, wing location and fuselage length. Variation in mass flow was achieved through changes to the exhaust area. Modification to the fuselage length was performed by removing the forward and aft-fuselage parts in Figure 2. Fairings were revised accordingly when the wing position was moved.

2.3. Numerical Simulations Setup

To establish general guidelines for the preliminary design of BLI180 engine integration, it was of importance to capture the inflow characteristics at the fan aerodynamic interface plane (AIP) as the fan performance is strongly dependent on the inflow quality. For this purpose, through-flow simulation was considered sufficient and efficient as the sensitivity study mainly involved geometry changes upstream of the AIP. Comparisons made between the through-flow case and the simplified fan modelling using a classic engine boundary condition approach showed that both methods computed a similar AIP flow field. As indicated in Figure 4, the AIP was defined as the position at which the spinner tip stands. Fully resolved 3D fan model was not considered due to the high computation cost. In this paper, no fan was modelled, and all the results are for a through-flow nacelle. This study also disregarded the flow path of the engine core nozzle. All the simulations were performed for a 1:23 scale wind tunnel model, compatible with future tests in the ARA transonic wind tunnel. The wind tunnel conditions correspond to Mach number = 0.8, free-stream static pressure of 66,500 Pa and free-stream static temperature of 277 K, corresponding to a Reynolds number of 12.8 million/m. Only half of the aircraft geometry was modelled as symmetry condition applies.
The commercial CFD tool, ANSYS Fluent, was used for the CFD simulations. The 3D aircraft geometry was created in CATIA. Computation domain and mesh generation capability were provided by DesignModeler and Ansys Mesh within Ansys Workbench. Meshes were created following the intermediate mesh guidelines as indicated in [45].

2.3.1. CFD Setup—2D

A view of the 2D model unstructured mesh can be viewed in Figure 4, with a zoom of the mesh around the engine cross-section. Based on the length scale of the aircraft cross-section c, the full computation domain extended 12c on the side and upstream of the aircraft cross-section, and 20c downstream to the outlet. This large computation domain was created in order to ensure that the boundary conditions assigned to the borders did not affect the flow around the studied object. The unstructured mesh contains about 380,000 elements with the first layer height of 0.0004 mm around the aircraft and engine walls, which gives a maximum y plus value lower than one. More details of the boundary conditions and mesh information can be found in Table 2.

2.3.2. CFD Setup—3D

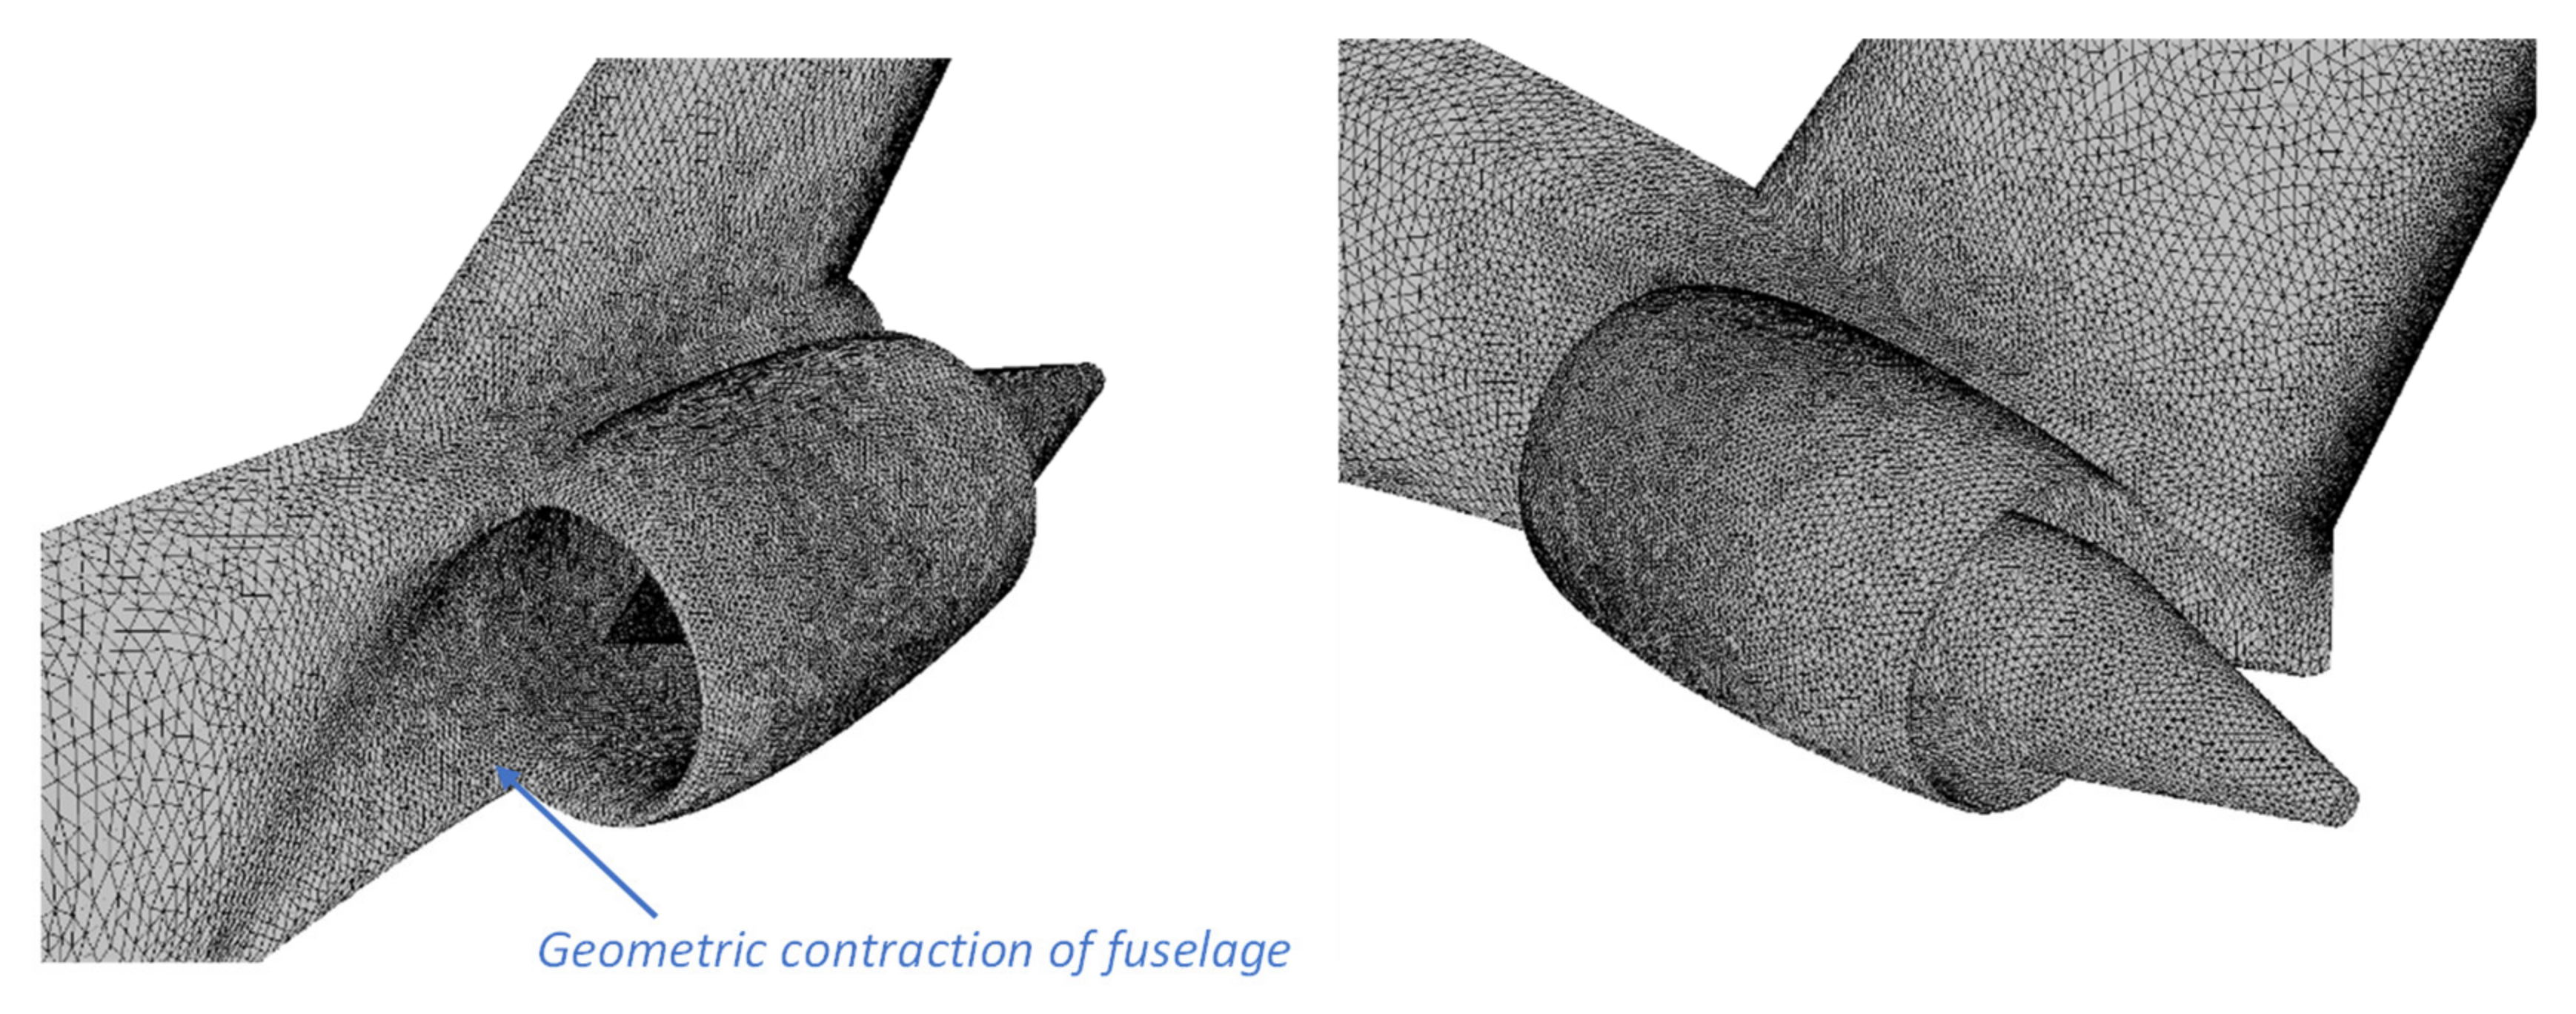
The 3D CFD cases are conducted at the design point AOA = 1 o ,   M a c h = 0.8 . The surface elements on the nacelle and engine plug are shown in Figure 5. The mesh resolution was refined upstream of the nacelle intake, where the flow distortion is of interest. Moreover, the grid spacing was refined around the nose of the engine plug. This treatment was necessary to ensure the boundary layer at the AIP and fan inlet was well resolved, these being the areas in which the solver numerical robustness and accuracy are sensitive to the mesh quality, owing to the large velocity gradients and high flow speeds. A mesh refinement study was conducted using three meshes with different quality (coarse, medium and fine), which were generated by globally refining cell sizes in the whole computational domain. The refinement ratio of the medium mesh cell sizes to the coarse ones was 0.75, and the same ratio was applied to generate the fine mesh with respect to the medium mesh. The results showed that the impact of the mesh refinement on the boundary layer and wake total pressure profiles was limited in general, but the coarse mesh underestimated the total pressure defect peak in the wake. A medium refinement volume was hence created to ensure the accuracy of the boundary layer and wake predictions for all cases. Detailed boundary conditions and the mesh parameters for the 3D cases are listed in Table 2.
The SST k-omega turbulence model was chosen based on the results of previous studies reported for the NASA drag prediction workshops [46,47], where transonic flows at similar Mach numbers at cruise flight were simulated using different turbulence models. It was found that the SST k-omega model is capable of correctly predicting primary flow phenomena such as shockwaves and separation. This study only uses one turbulence model, but it would be interesting to investigate the effects of turbulence modelling on prediction accuracy in the future.

2.4. Metrics for Benchmarking BLI Effects

2.4.1. Pressure Recovery Coefficient

For BLI propulsors, the pressure deficit in the boundary layer with respect to the free stream condition needs to be accounted as it could reflect the boundary layer generation for different airframe profile variations [27]. The pressure recovery coefficient is defined below as the mass flow averaged total pressure at the fan face plane, p 0 , f a n   f a c e , divided by the mass flow averaged total pressure in free stream, p 0 , f r e e   s t r e a m :
η P R = p 0 , f a n   f a c e p 0 , f r e e   s t r e a m

2.4.2. Flow Distortion Severity Index

Different from the BLI effects considered in [27], which are energy and dissipation terms derived from a power balance approach, in this sensitivity study, the focus was concentrated on the different inflow distortion patterns and severities for different geometry modifications. Among all the BLI effects, the BLI-incurred inflow distortion is considered the most challenging barrier to realizing BLI benefits. Minimizing BLI-incurred distortion should be prioritized before enormous efforts are put into detailed fan design. The flow distortion index, distortion coefficient (DC), was used in the sensitivity study to benchmark the distortion severity incurred by BLI.
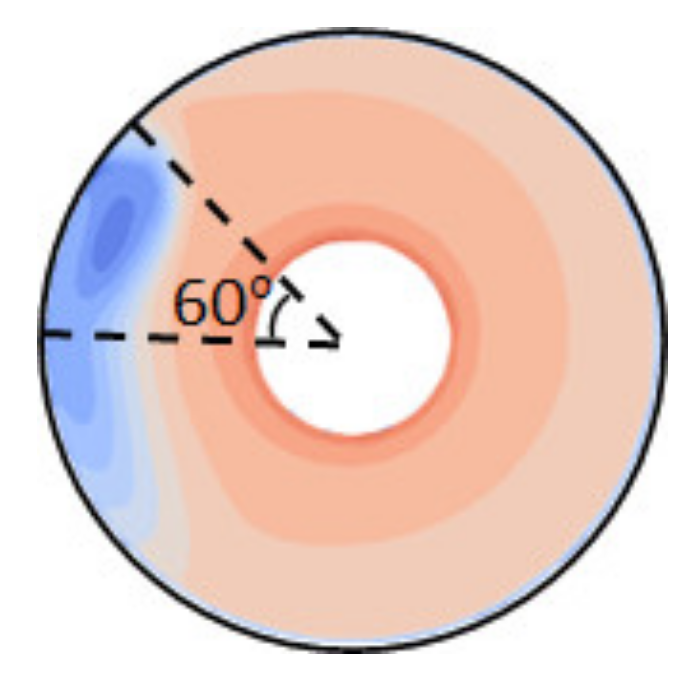
Typically, for the calculation of DC60, the 60-degree sector is rotated at 1-degree increments until the lowest sector average pressure is found; see the example given in Figure 6. The distortion coefficient is calculated as the difference between the averaged total pressure of the entire flow field p 0 , a l l , a v e and the lowest averaged total pressure of the 60-degree sector p 0 , 60 ° s e c t o r , a v e normalized with the averaged dynamic head of the entire flow field q a l l , a v e :
D C 60 = max p 0 , a l l , a v e p 0 , 60 ° s e c t o r , a v e q a l l , a v e

3. Results and Discussion

3.1. Simulation Results—2D

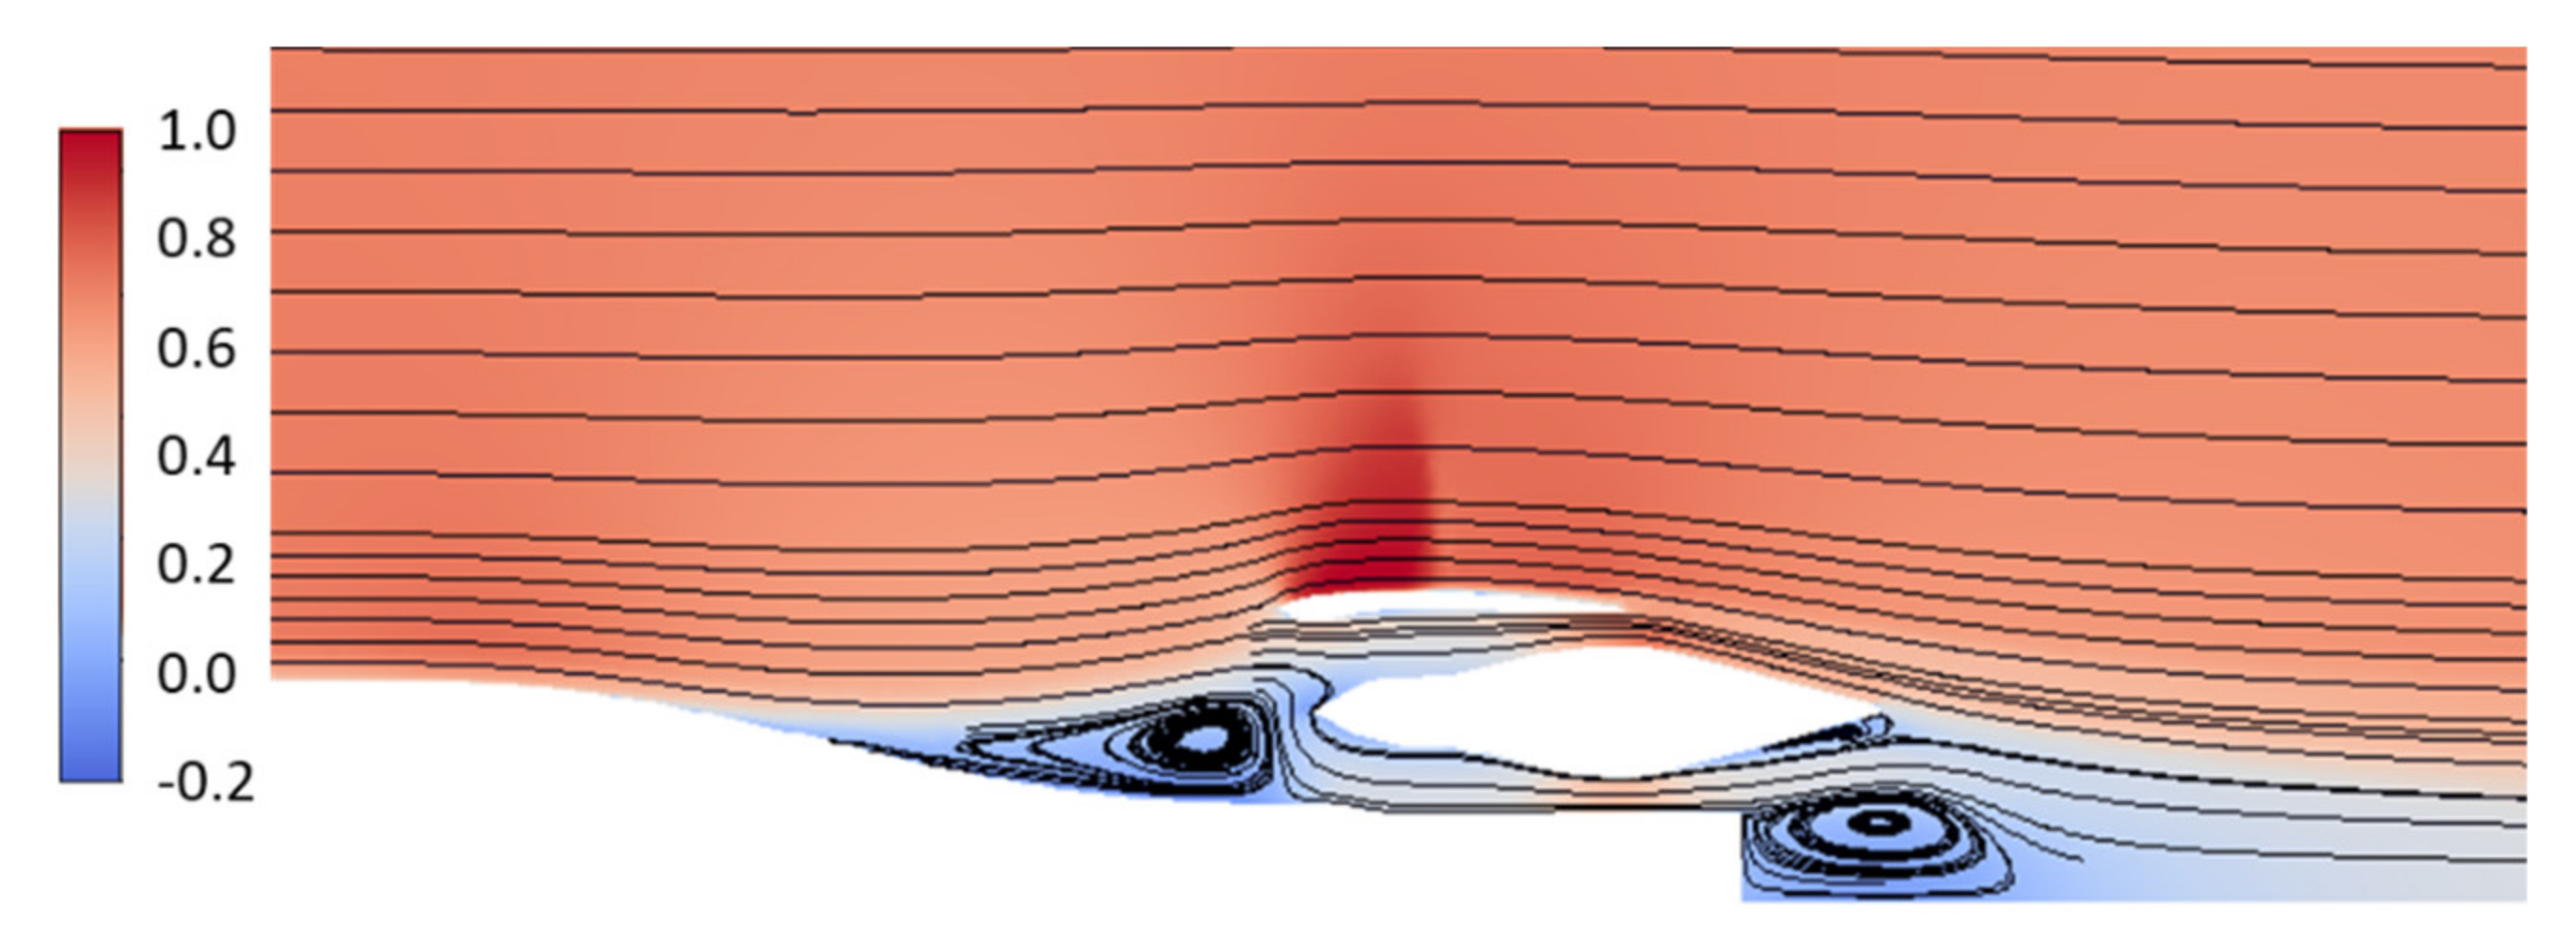
A contour of the normalized axial velocity of the baseline configuration 2D simulation is given in Figure 7. It can be seen that, as half of the nacelle is buried deeply into the fuselage body, a large recirculation zone is formed upstream of the nacelle intake. At the same time, the cutoff of the fuselage end also induces separation, which could affect the flow through the bottom part of the fan.
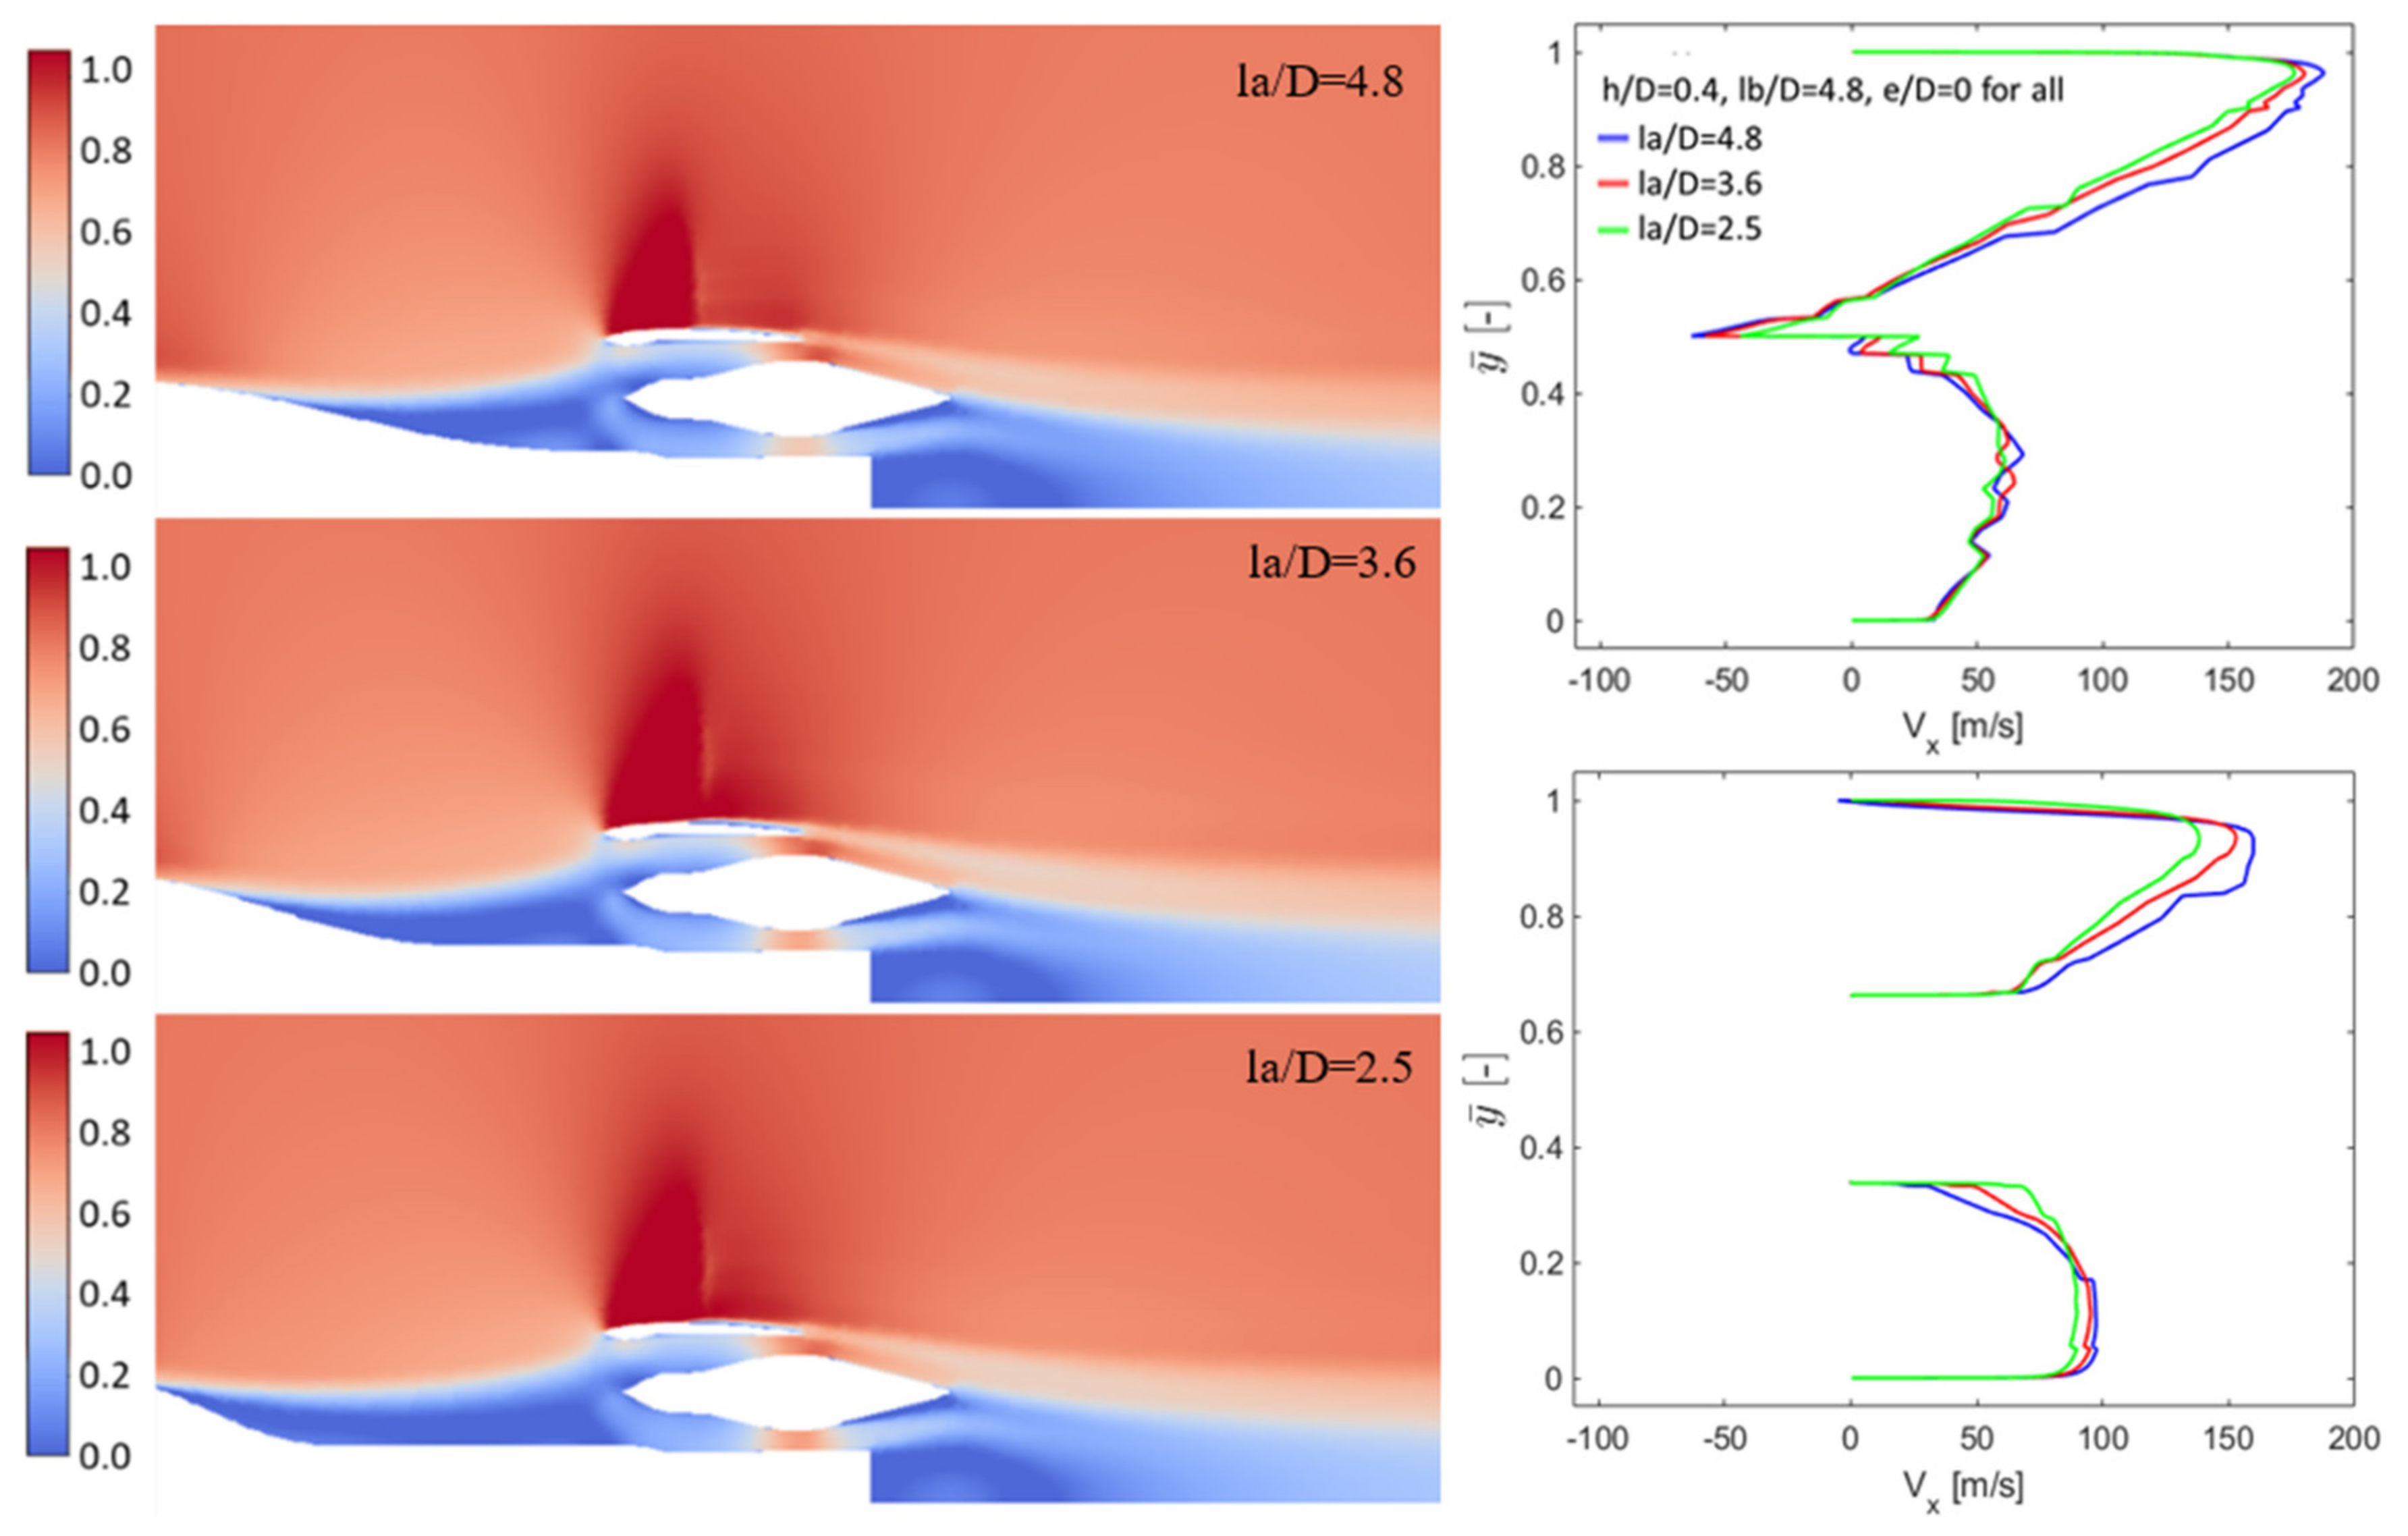
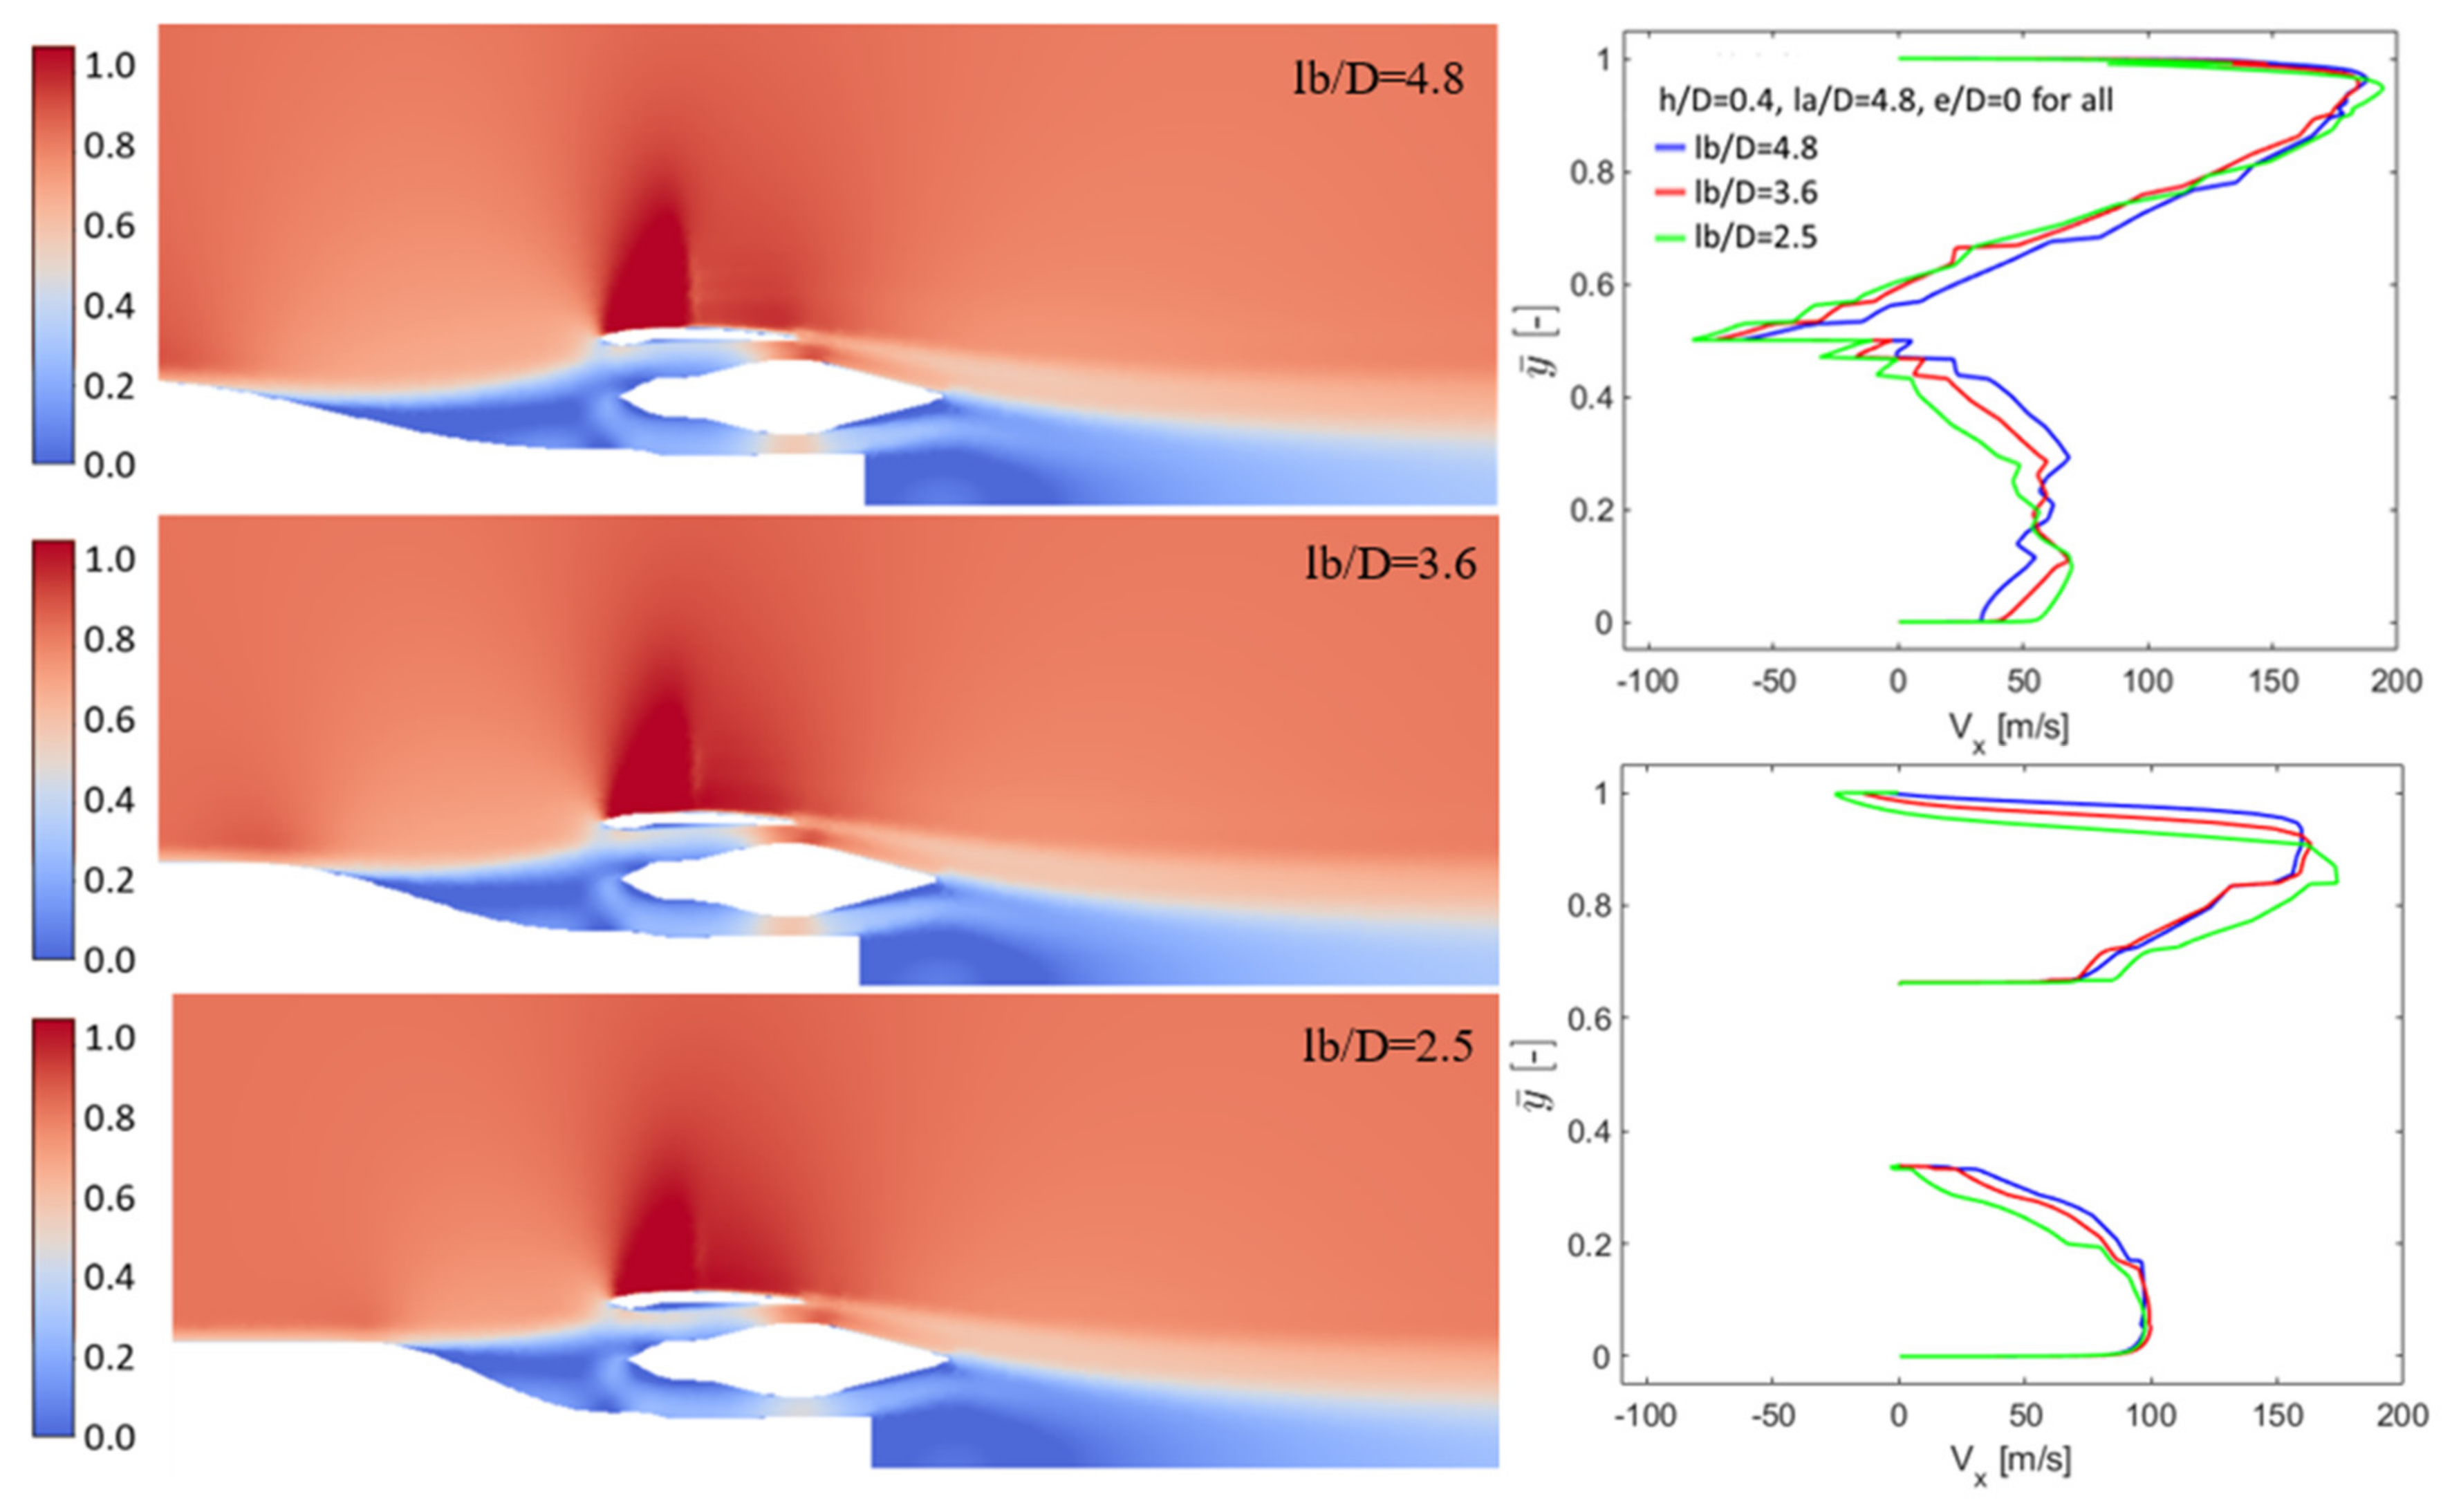
The results of the 2D simulations are presented in Figure 8, Figure 9, Figure 10 and Figure 11, showing the velocity profiles at AIP and the fan inlet plane as well as the Mach plot around the engine installation. The most critical design parameter revealed by the 2D simulation results is the highlight position of the nacelle. Increasing the spanwise separation improved the flow distribution across the AIP. As shown in the line charts of Figure 8, the axial flow velocities in the lower part of the AIP were largely improved by increasing spanwise separation, while in the upper part the axial flow velocities were decreased to the same level as in the lower part. This gives a more uniform flow distribution across the AIP. This is to be expected, as moving the engine away from the fuselage increases the percentage of the free-stream inlet flow and reduces the severity of the fuselage pressure recovery and hence the boundary layer growth. One drawback of the increased nacelle separation is the reduction in the part of the nacelle buried within the rear fuselage, which increased the wetted surface area, thus increasing the viscous drag.
Variations in the other three parameters show less sensitivity. Among them, shortening the intake diffusion length la had the lowest sensitivity with regard to the flow distribution across the AIP. The steeper rear fuselage profile caused an earlier separation, from which the boundary layer does not recover before it enters the engine. Shortening the intake diffusion length lb had a negative effect in guiding the flow into the lower part of the fan, because of the early separation and relatively short distance in which the diffusion could take place. Extending the nacelle forward reduced the MFCR in general but had a negligible effect in the lower part of the fan. The flow through the upper part of the fan decreased, as the extension reduced the intake area formed by the fuselage and the nacelle.
Designs similar to the NOVA concept have been generated based on the NOVA concept literature [21,22,24]. The NOVA concept design has a relatively long intake with the nacelle extended forward to cover the fuselage diffusion region, as can be seen in Figure 12. This requires that the nacelles be mounted at a sufficient distance from the fuselage centerline for the desired MFCR to be achieved. The NOVA-similar case (h/D = 0.6, e/D = 1.2, lb/D = 1.3) presented in Figure 12 shows a similar flow pattern to that reported in [22] (cruise condition) and [24] (take-off condition). The key observations are the heavy separation before the throat for the simulation in the cruise condition, while under the take-off condition, the separation was suppressed at the throat. Comparing the NOVA-similar case and a case with the same nacelle highlight position but without nacelle extension and aggressive diffusion (h/D = 0.6, e/D = 0, la/D = lb/D = 4.8), as shown in Figure 8, the flow distribution at the AIP for both cases is very similar. Considering the weight and wetted surface added by the long nacelle, and also based on the results from the 2D simulations, the case (h/D = 0.6, e/D = 0, la/D = lb/D = 4.8) was down-selected as the baseline configuration for the 3D simulations.

3.2. Simulation Results—3D

3.2.1. Comparison between 2D and 3D Simulations

A direct comparison between the down-selected 2D case with its 3D version simulation is given in Figure 13, where the Mach plots around the engine installation under the same legend range are shown for both. The comparison suggests that the 3D effects and the presence of the detailed aircraft geometries made a significant difference to the flow field. The 3D simulation shows a much less severe separation in front of the AIP and no shockwave generated over the nacelle.
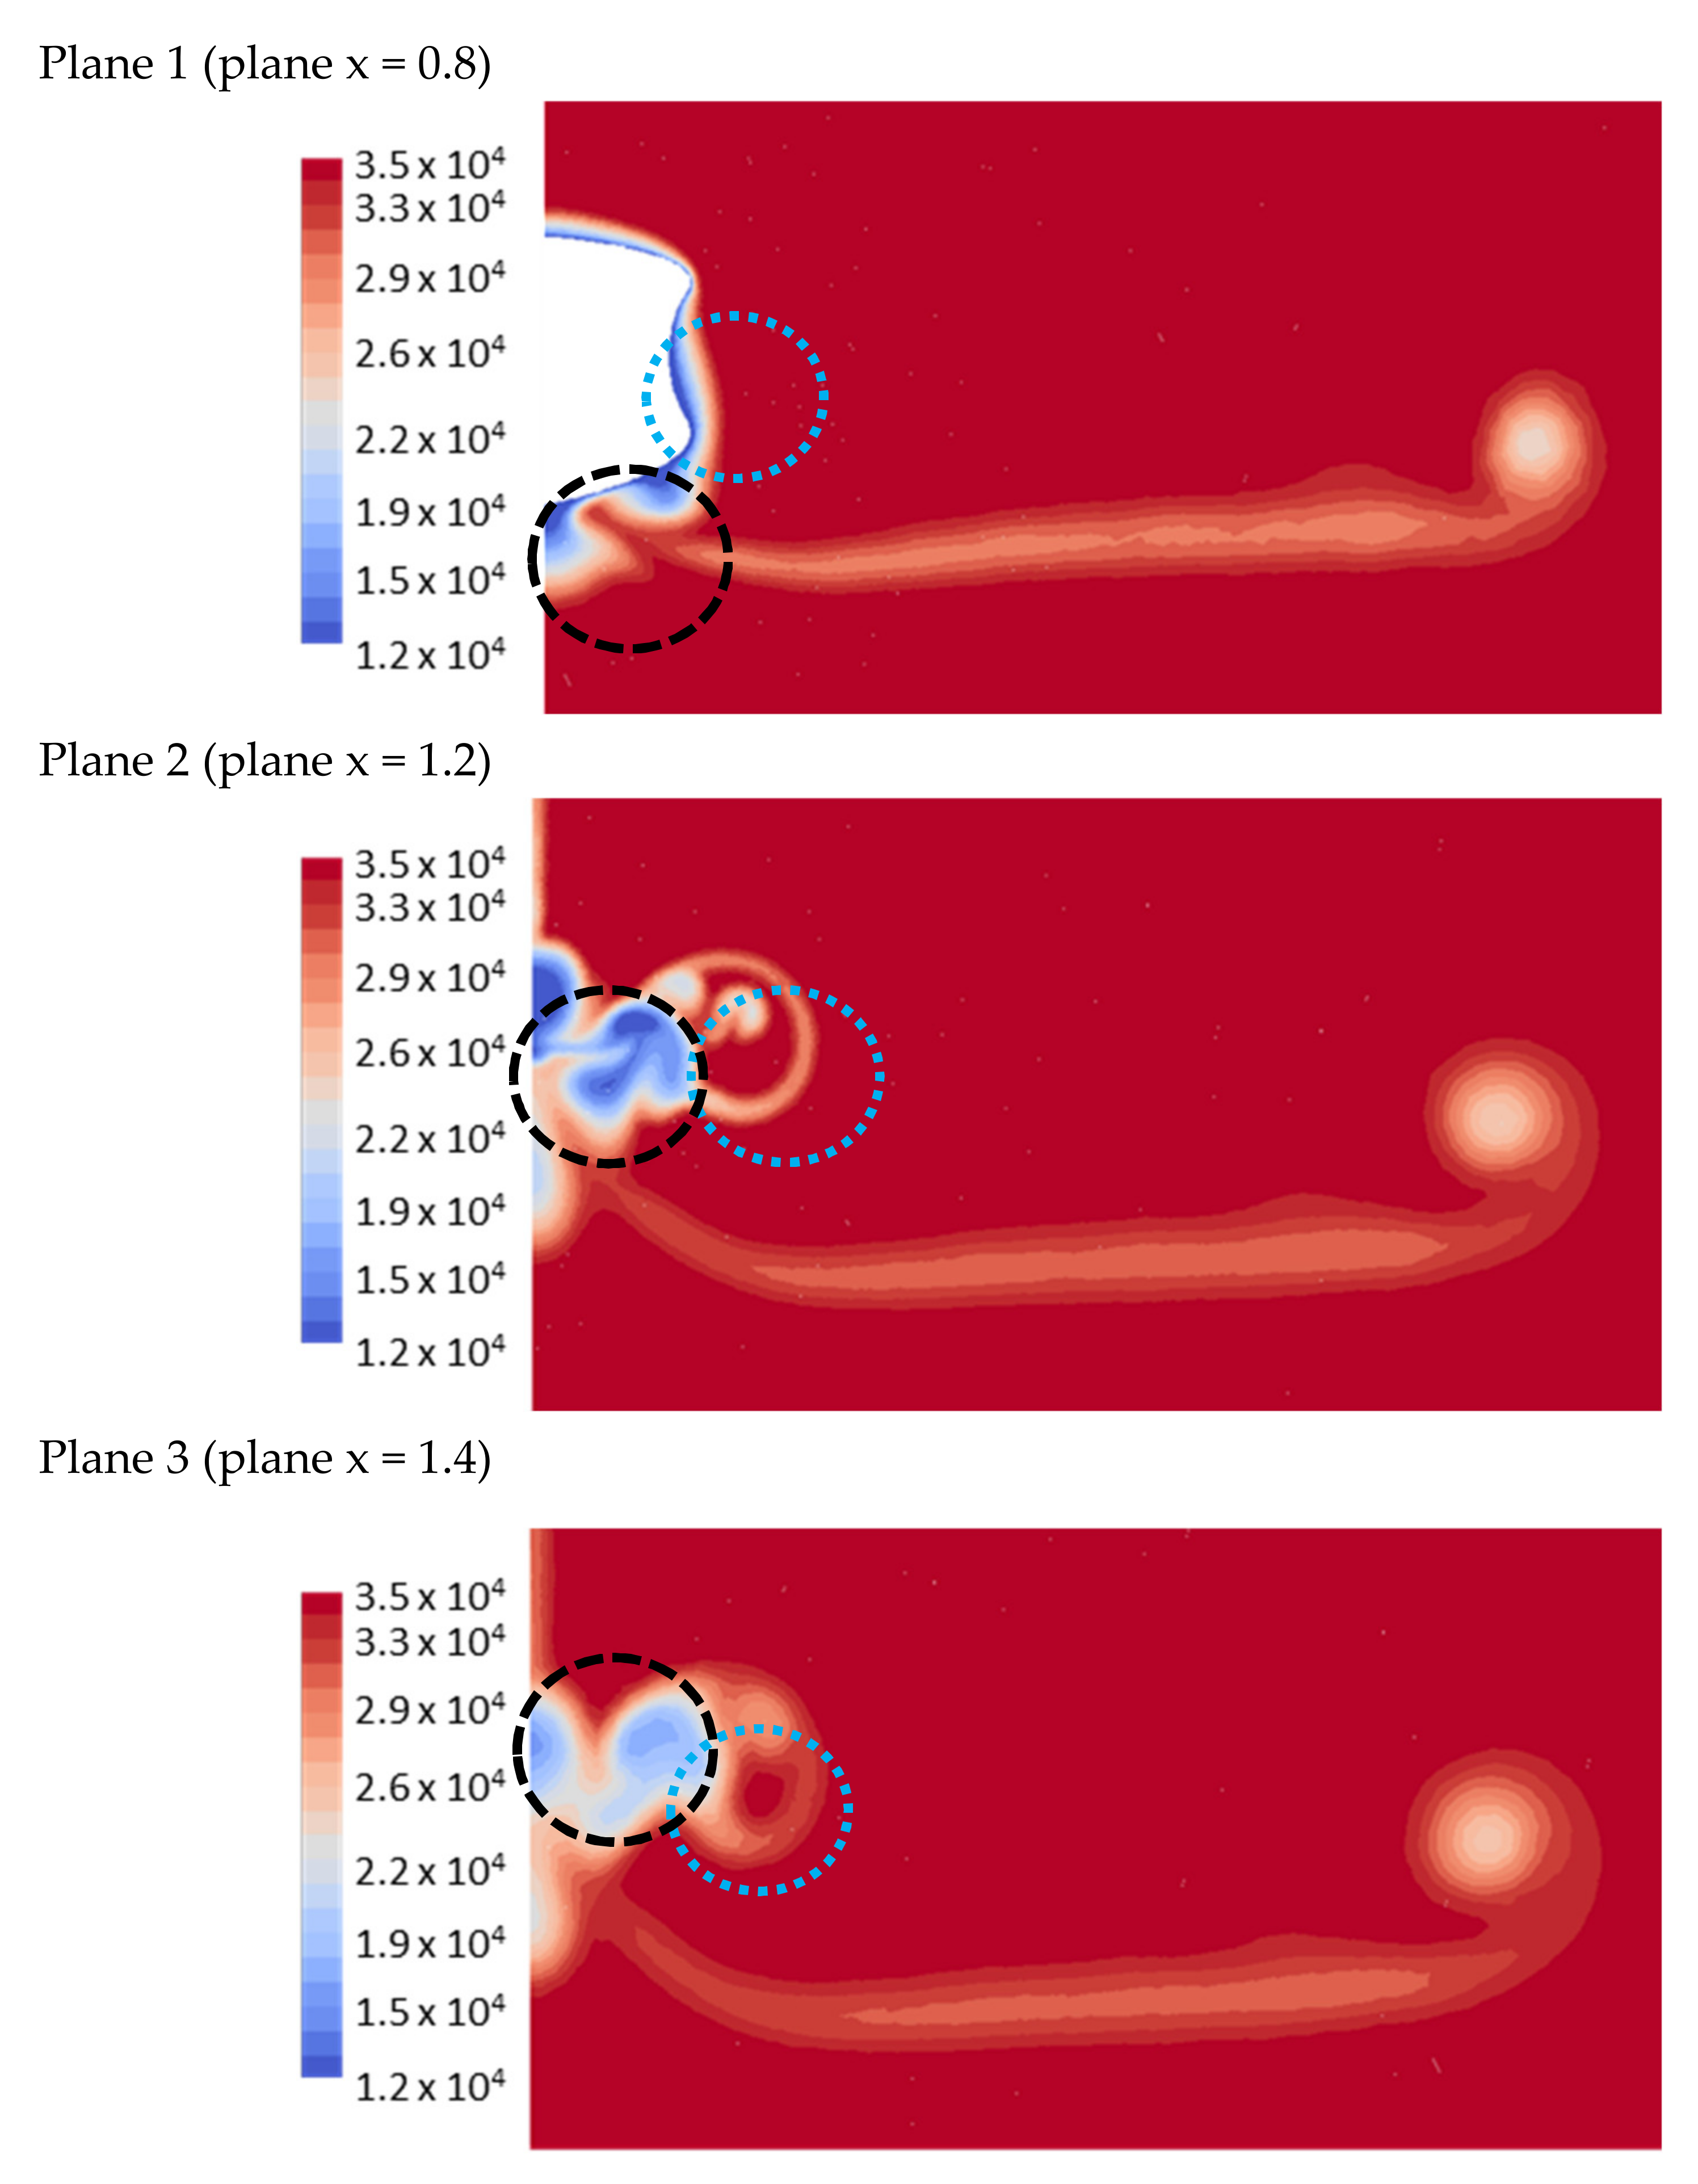
In order to obtain a better understanding of the 3D case, more results of the case (h/D = 0.6, e/D = 0, la/D = lb/D = 4.8) are given in Figure 14 and Figure 15. The top figure of Figure 14 shows the flow pathlines down to the engine intake AIP plane. It can be clearly seen that the wing caused the flow to accelerate as it passes over the wing, and then move downwards to the intake. The total pressure contour in Plane 1, as illustrated in the second figure of Figure 14, indicates the presence of low-pressure regions on the side and bottom of the fuselage just upstream of the intake, hence leading to the downward motion of the flow. The side low-pressure region (dotted blue circle in the figure) was formed due to the intake contraction, while the bottom low-pressure region (dashed black circle in the figure) is a result of the fuselage tail slope.
In Planes 2 and 3, which are positioned in the wake induced by the fuselage and nacelle, an annular low-pressure region (dotted blue circle) was observed, as illustrated in the third and fourth figures of Figure 14. This annular region is caused by the nacelle body wake. Moreover, a low-pressure zone was located inside of the annular region. This zone is formed by the separated flow that goes through the nacelle engine. The flow separates upstream of the nacelle intake, and this is shown in the total pressure contour in Plane 1. A similar effect has been reported for the ONERA NOVA concept [24], where it was found that the effect is alleviated by the fan, but not completely eliminated.
A long curved strip zone of low-pressure was in general seen in the three cut planes, and is caused by the wake developing from the wing. However, the low-pressure annular zone (dotted blue circle), which stems from the nacelle, was far away from the wing wake. This suggests a weak interference occurring between the nacelle and the wing. Based on the total pressure distributions at the cut planes, one conclusion is that the BLI nacelle was subjected to significant interference from the fuselage wake (dashed black circles), while the interference from the wake induced by the wing was not obvious.
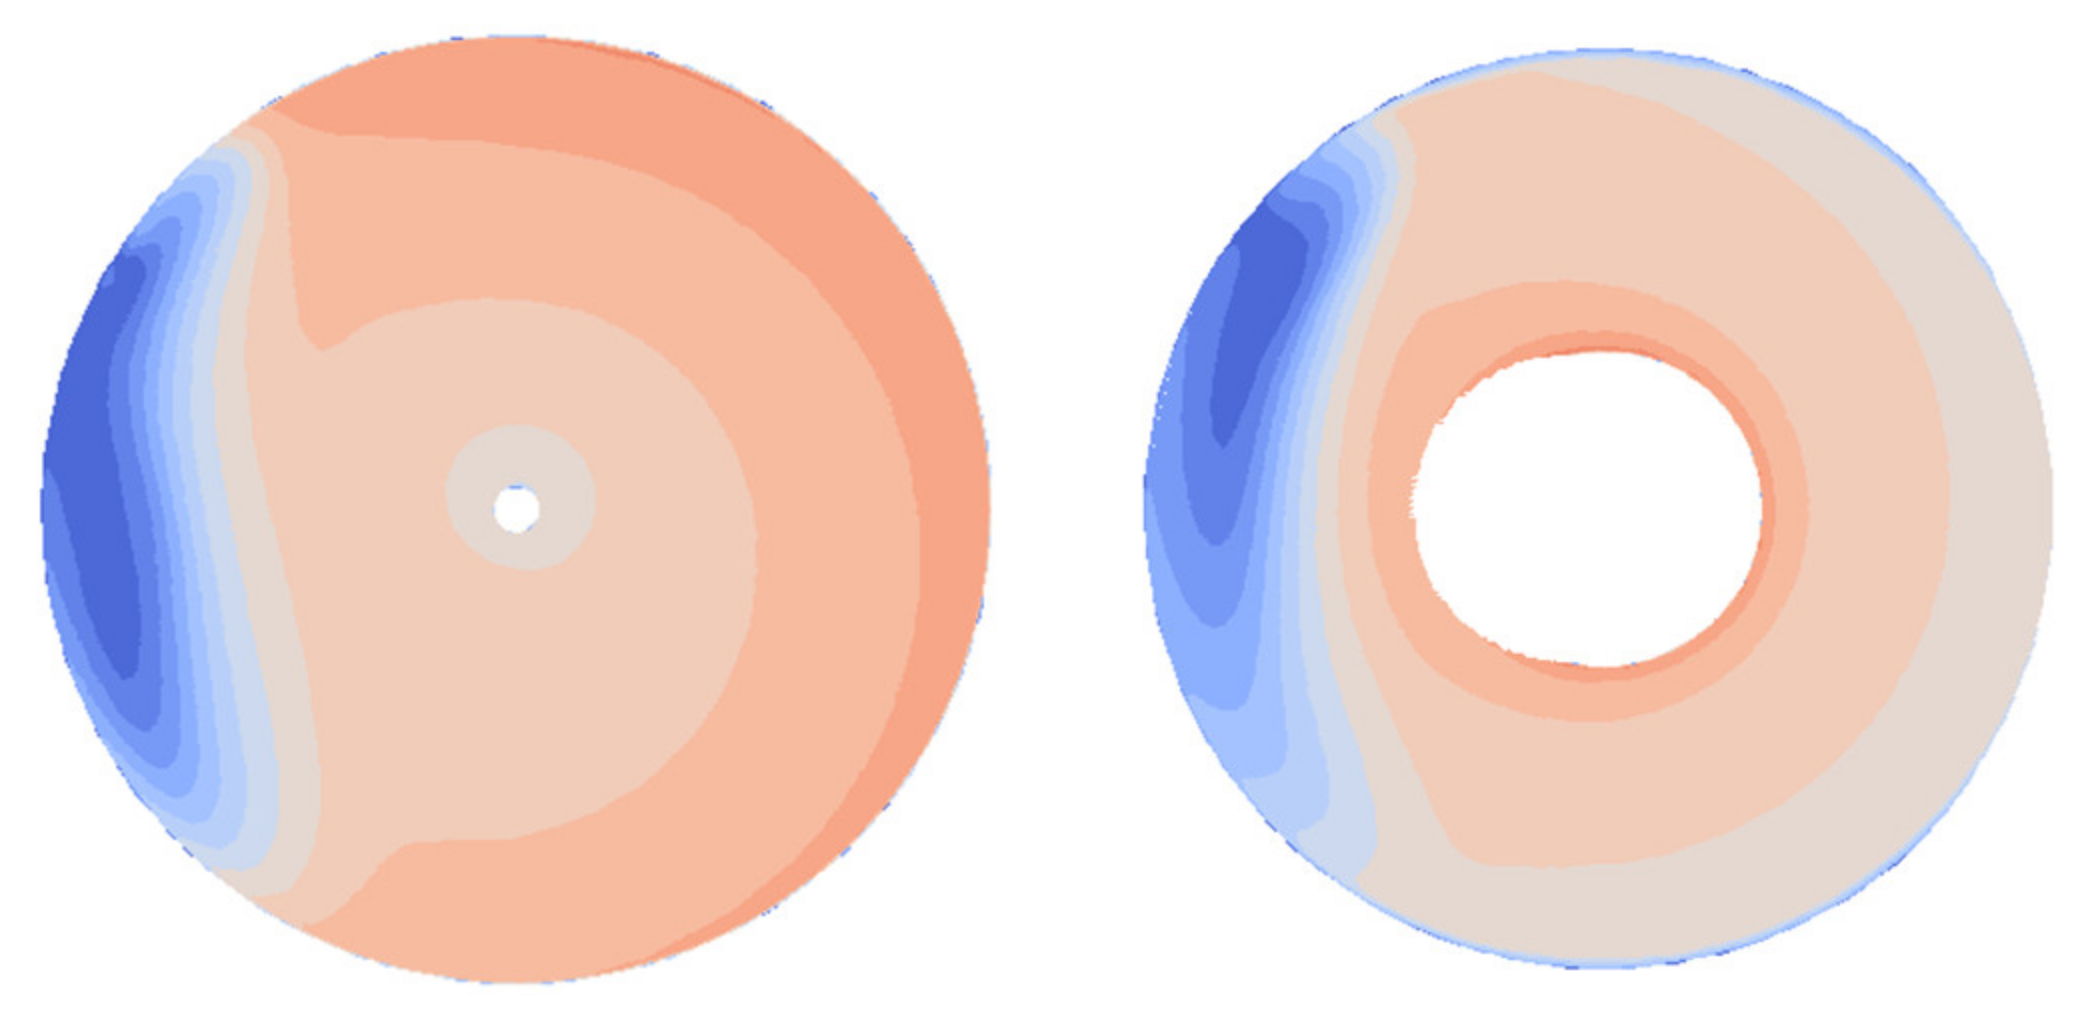
Zooming in closer to the engine intake, the top figure of Figure 15 gives more details regarding the flow pathlines. When the downwards motion crosses the edge of the fuselage contraction, a recirculation zone was generated. Considering that a large separation may occur just upstream of the intake according to the 2D simulation, as shown in Figure 13, this phenomenon actually had a positive effect, helping to suppress the separation. The result was that a recirculation zone was observed instead at the AIP plane and the fan inlet face, as shown in the bottom figures of Figure 15. In addition, the negative velocity region moved upwards as the flow passed the AIP and fan inlet.

3.2.2. Design Parameters Sensitivities—3D

Similar to the cases studied through 2D simulations, revisions to the 3D case h/D = 0.6, e/D = 0, la/D = lb/D = 4.8 were made. However, no revisions with an extended nacelle were performed. It was believed that a much longer nacelle with added weight and wetted surface would not be beneficial, even though it could achieve a better intake flow quality. Simulations of three initial 3D cases were conducted. A description of the geometries is now given:
  • No. A—Rev1_3D had the same design parameters as the case h/D = 0.6, e/D = 0, la/D = lb/D = 4.8. Revisions included the removal of the bump on the diffusion slope formed by the nacelle lip shape as can be seen in the lower figure of Figure 13 and the resize of the nozzle for a desired mass flow rate.
  • No. B—Rev2_3D had a higher highlight position with h/D = 0.8 compared to Rev1_3D.
  • No. C—Rev3_3D had a more aggressive diffusion slope with la/D = 3.6 compared to Rev1_3D.
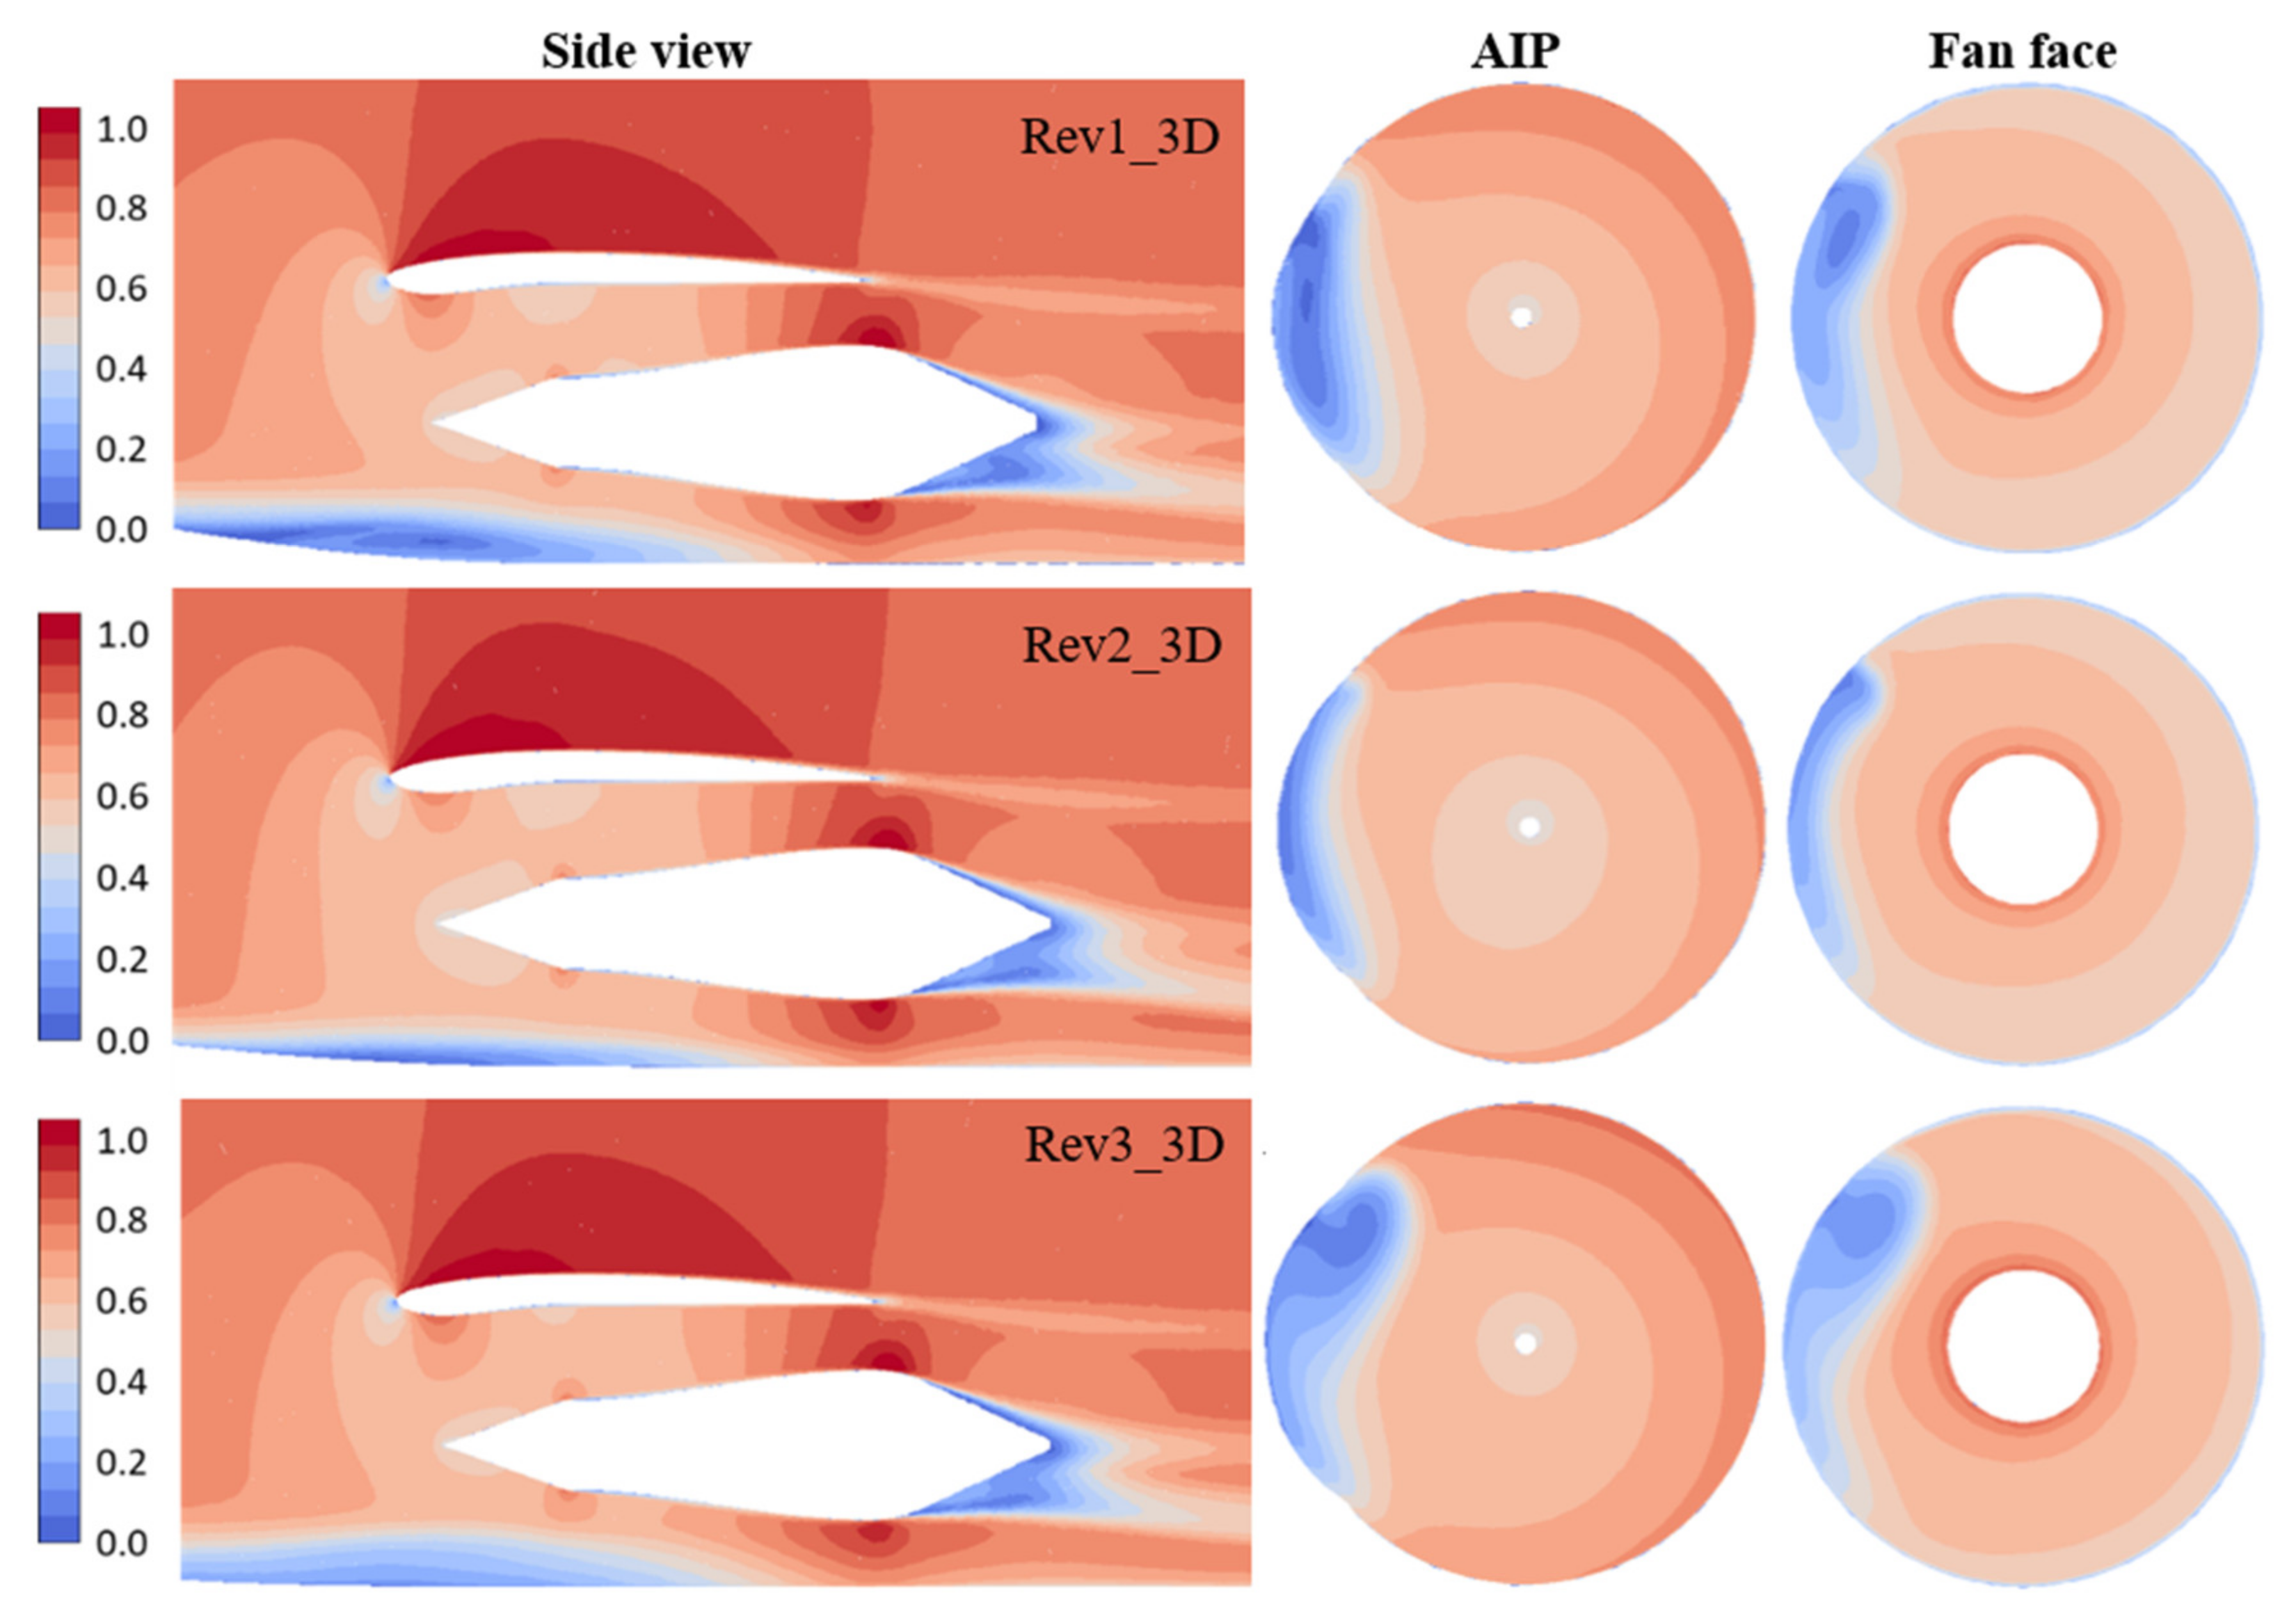
The quantitative results from the 3D simulations are given in Table 3 and the contours of the Mach number at the three locations of these configurations are shown in Figure 16. It can be seen that Rev2_3D, with a higher highlight position, performed the best, the same as was concluded from the 2D simulations. Increased nacelle spanwise separation reduced the fuselage contraction rate and flow diffusion. Hence, both the flow recirculation induced by the edge of the fuselage contraction and the separation incurred by the diffusion were alleviated. As the ingestion of turbulence is responsible of the deficit in thrust generation in the corresponding blade regions, the reduction of the turbulent region constitutes an improvement in the fan pressure ratio and efficiency. Noise-wise, as learned from the detailed analyses published in [24], the source power level is dominated by the broadband component for BLI engines. This suggests that less ingested turbulence would reduce the noise generation considerably. Placing the engines further into the fuselage could also suppress a small part of the noise source due to airframe shielding, but this would be limited to the noise propagation directions nearly perpendicular to the engine axis and for frequencies higher than blade-passing frequency 2 [24]. The more aggressive diffusion of revision Rev3_3D boosted the flow recirculation induced by the edge of the fuselage contraction. Except for the pressure ratio and efficiency penalties, the enhanced flow recirculation would result in a heavier periodic variation of forces for corresponding blade sections, which will be a challenge to the blade strength and life.

3.2.3. Mass Flow Sensitivity

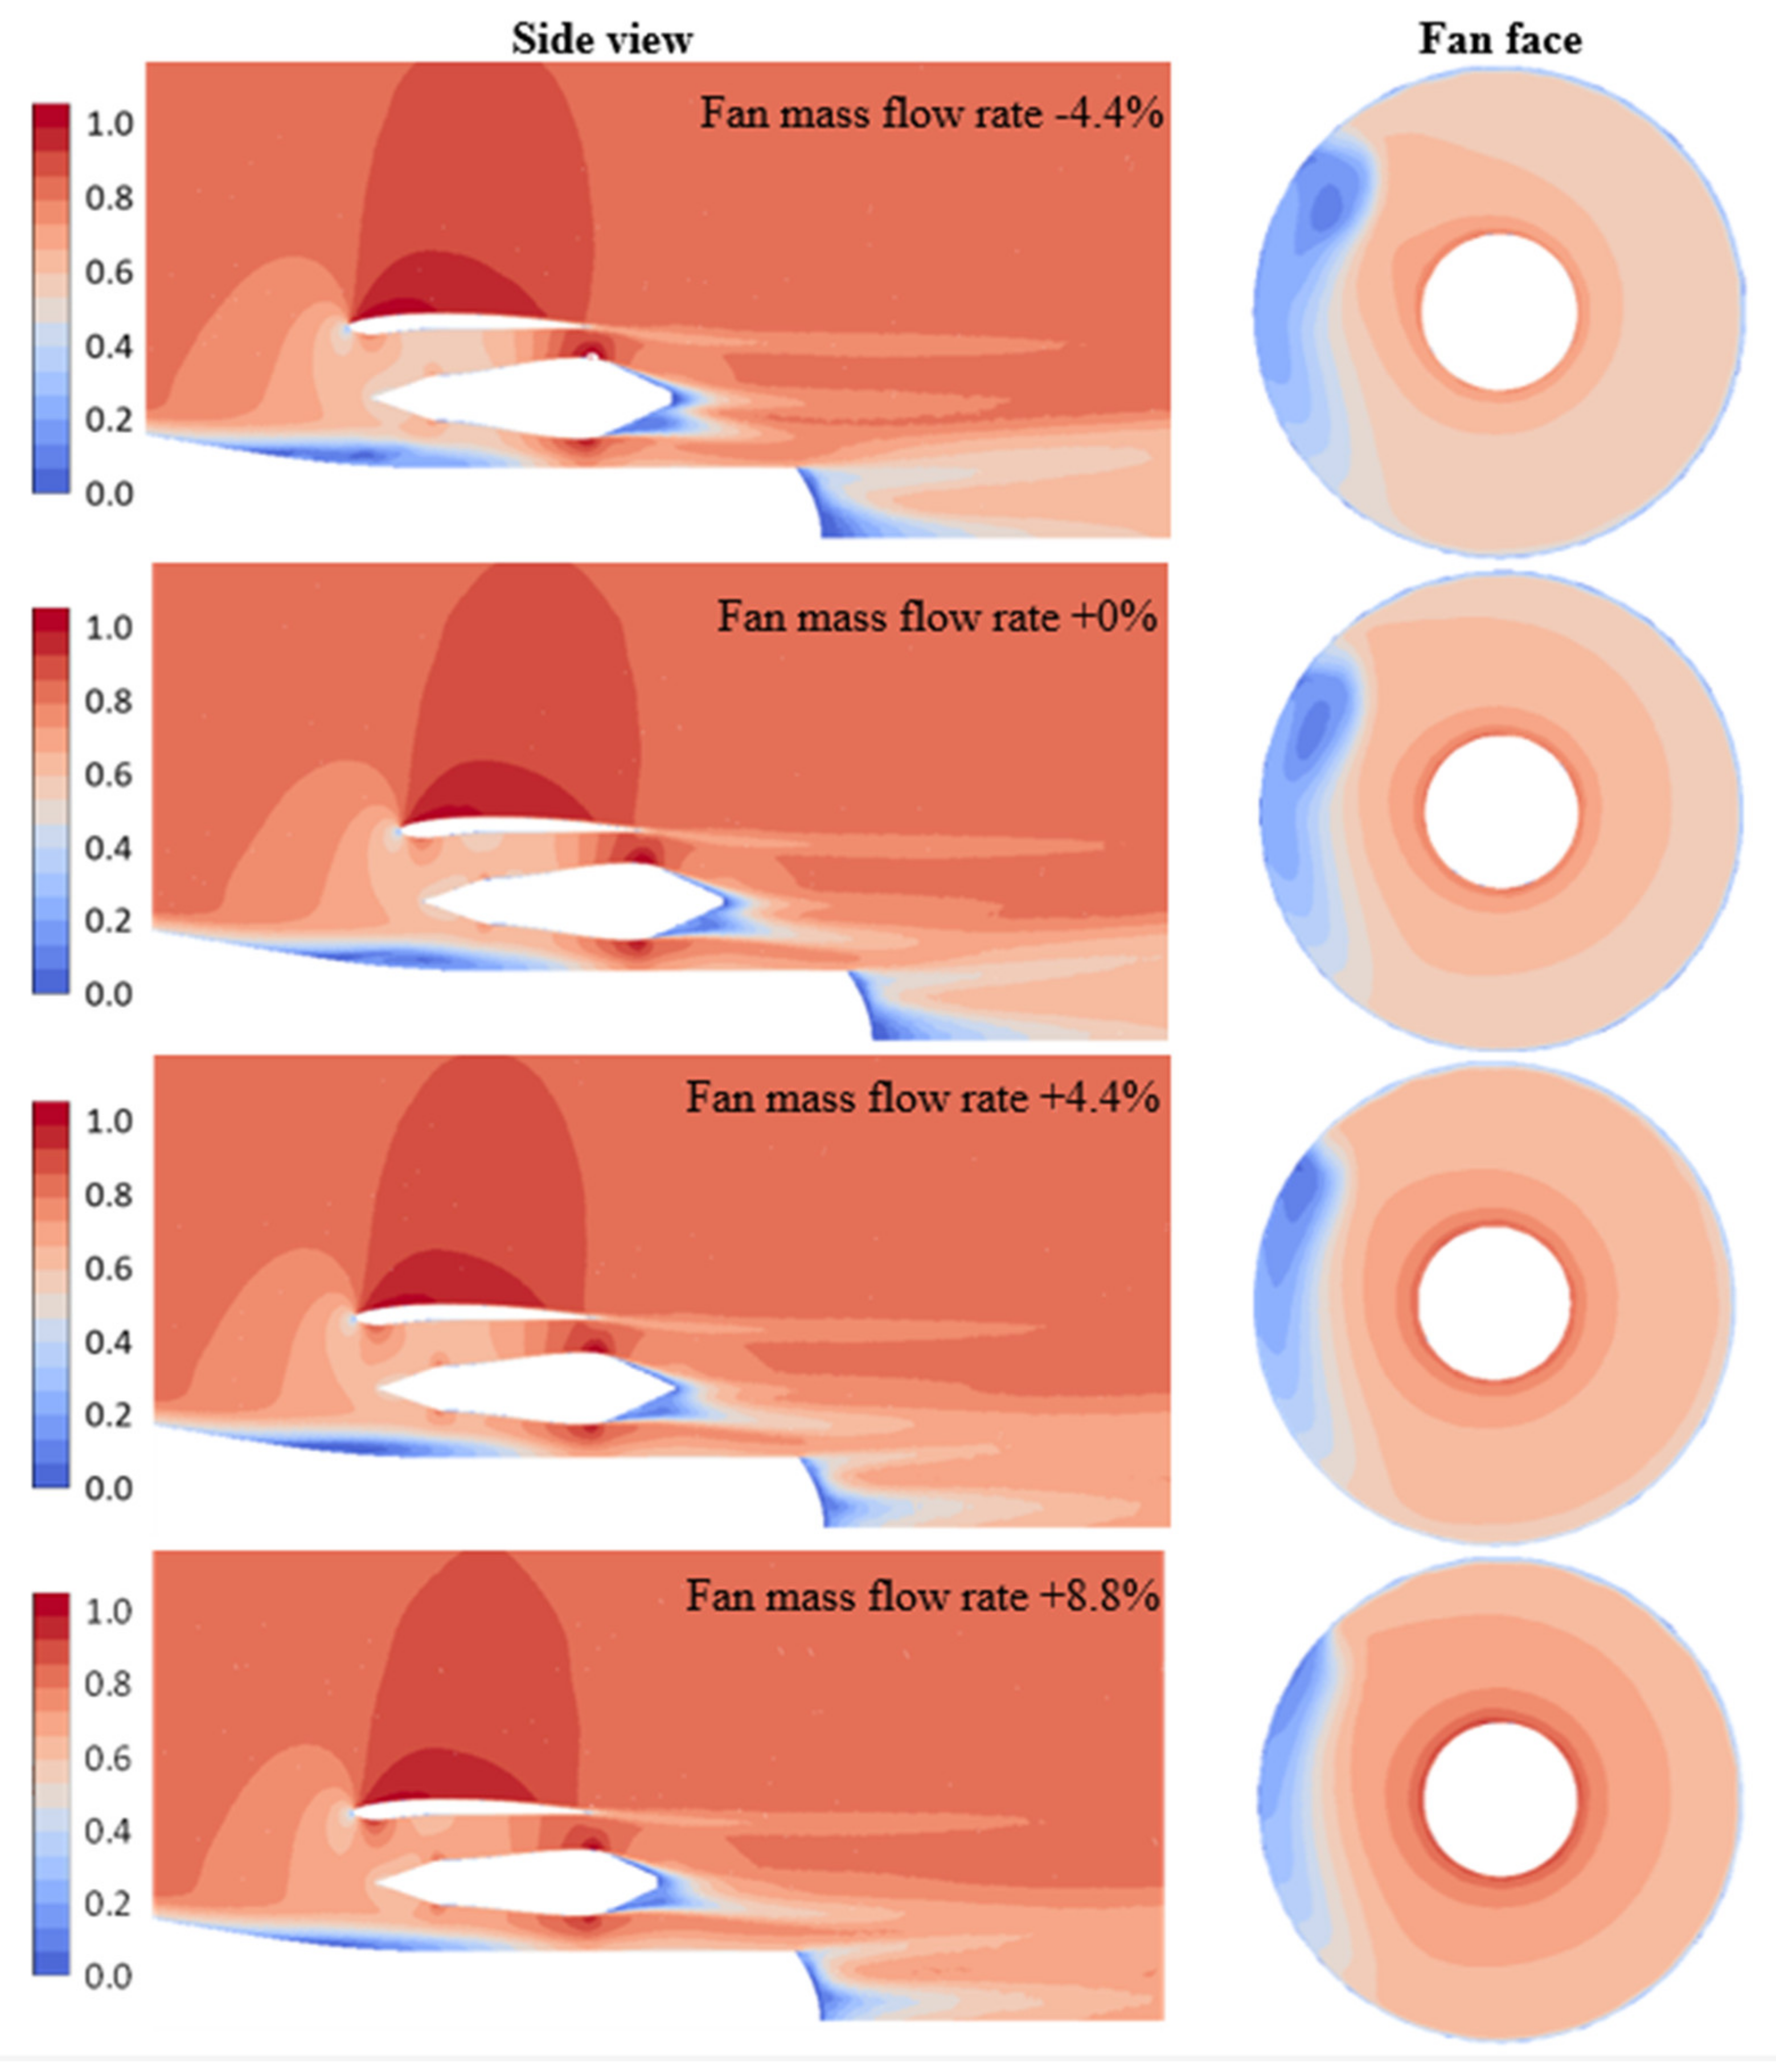
The sensitivity of the Rev1_3D configuration to changes in the intake mass flow was investigated by modifying the exhaust plug area, see cases D, E and F in Table 3. The exhaust plug area was calculated to target a ±5% step in mass flow variation but the CFD solutions gave a 4.4% variation. As expected, increasing the exhaust area increased the intake mass flow. Interestingly, however, this was accompanied by a recirculation moving away from the engine core, as illustrated in Figure 17.

3.2.4. Angle of Attack Sensitivities

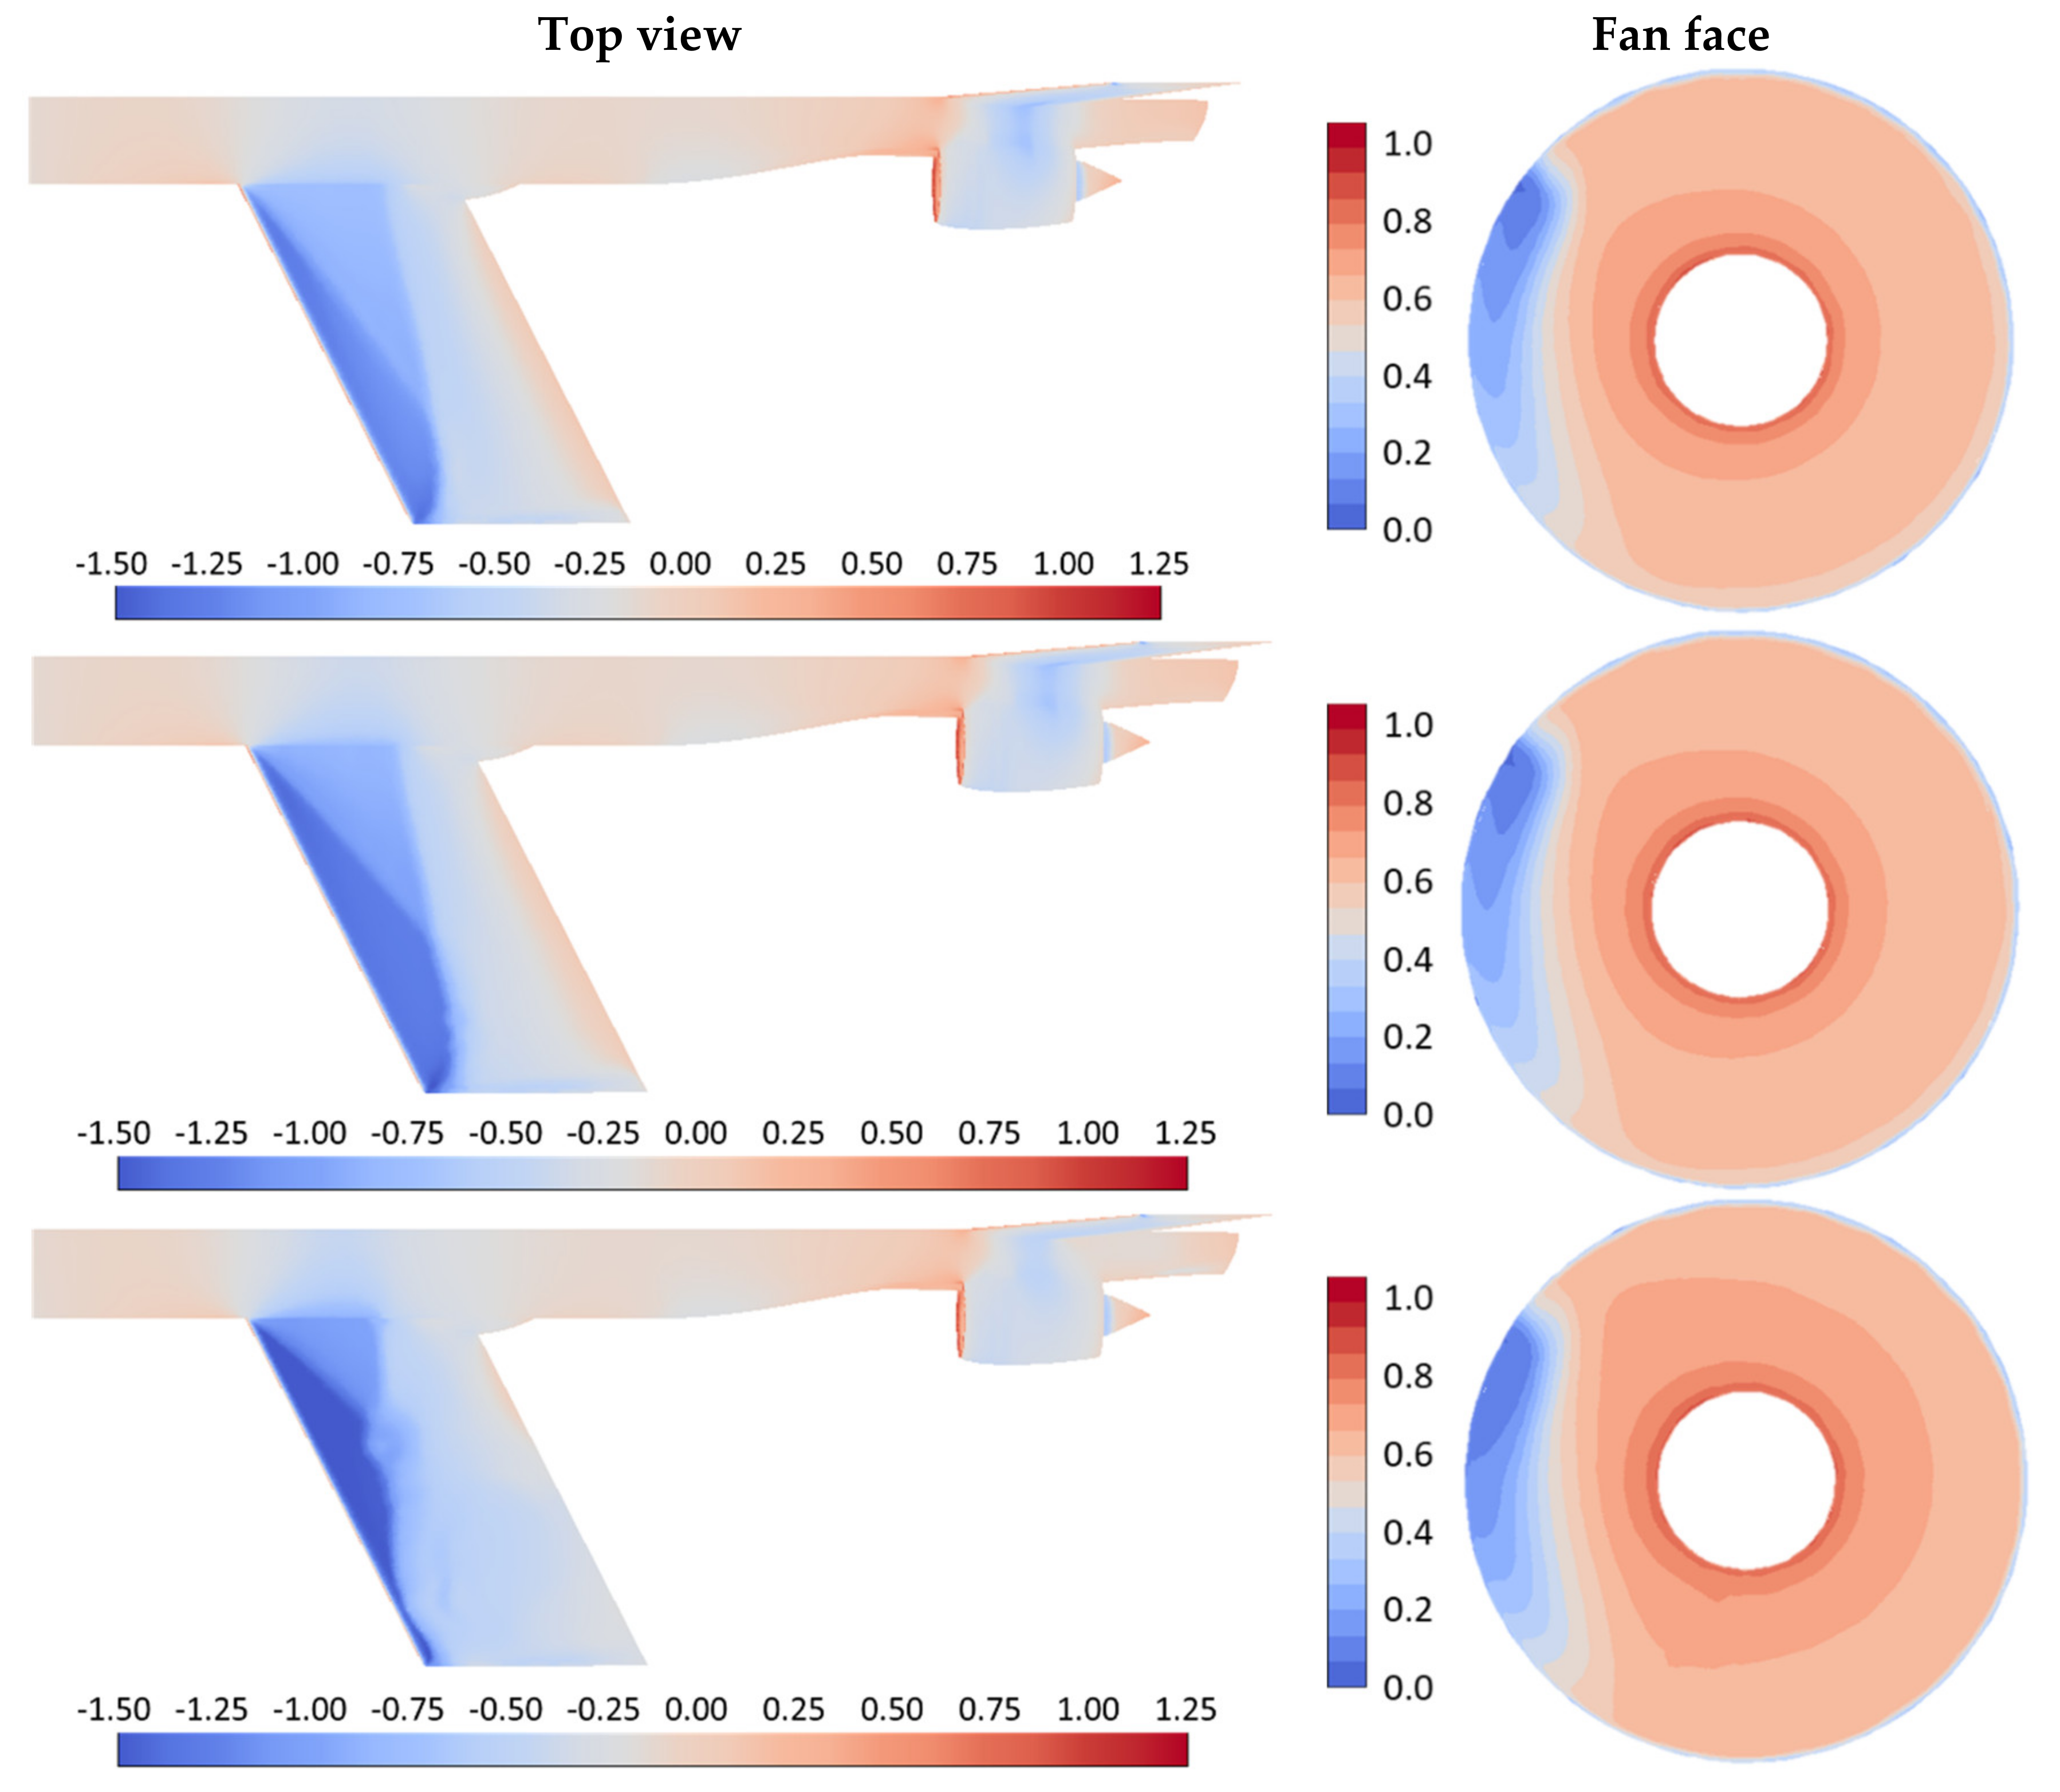
It is well-known that a shockwave is typically formed on the wing upper surface at a flight Mach number equal to 0.8, and that this shock will increase in strength as the AOA is increased. On the left side of Figure 18, the pressure coefficient plots on the aircraft clearly shows this phenomenon, whilst on the right side of the figure, the fan inlet Mach plots indicate that the variation in the AOA from 1 deg to 2 deg had a limited effect on the inflow to the engine. As expected, the data presented in Figure 14 indicate that the wing wake did not interfere with the engine intake for the studied aircraft model. However, a further increased AOA resulted in an increased flow distortion severity; see cases No. E, G and H in Table 3. On the right side of Figure 18, the fan inlet Mach plot for the case of AOA 4 deg indicates a tendency for the interference from the wing to the lower part of the turbofan to increase. In addition, doubling the AOA from 2 deg to 4 deg increased the fan mass flow rate by 5.7%.

3.2.5. Wing Position Parametric Study

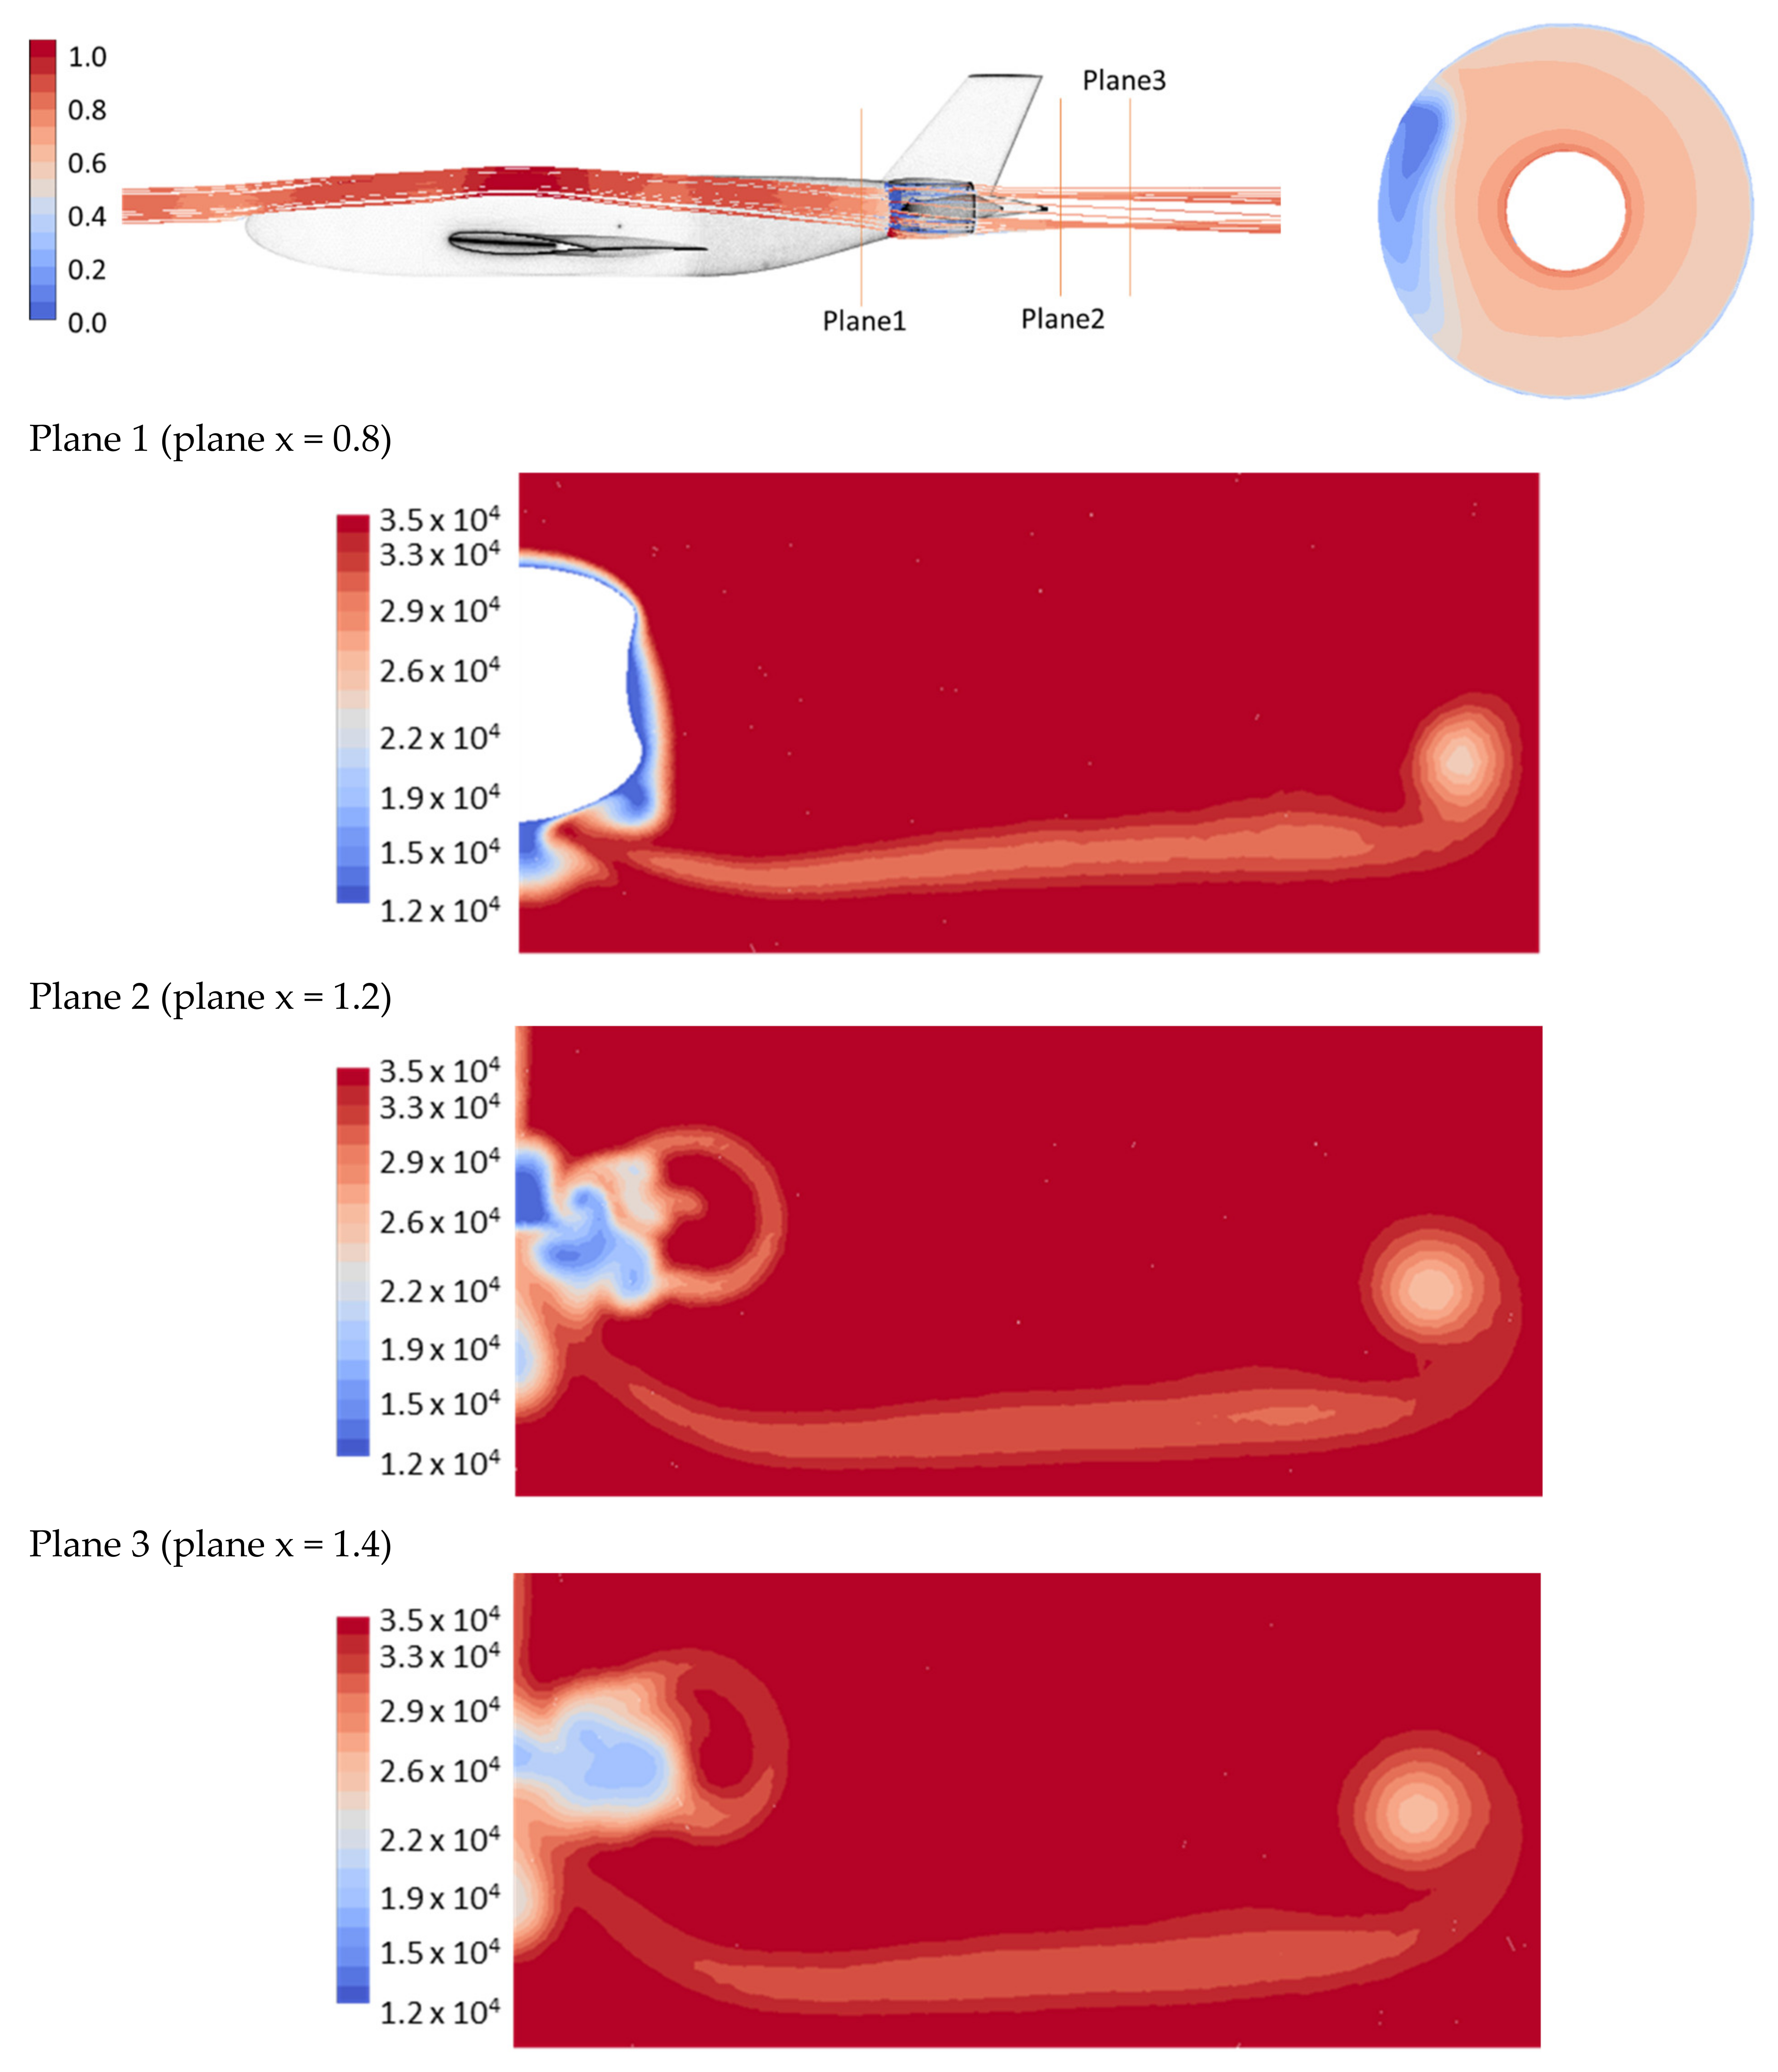
As could be expected from the low wing results previously discussed, a high wing position led to a direct strong interference between the nacelle and the wing. As can be seen from Figure 19, the flow was cut by the wing before entering the nacelle and the wake from the wing was directly injected into the lower part of the intake. This caused additional distortion and the highest DC60, as shown by case I in Table 3.

3.2.6. Fuselage Length Parametric Study

The shortening of the fuselage length was achieved by removing the forward and aft fuselage plug parts, as illustrated in Figure 2. Compared to Figure 14, the pathlines and Mach contours for the short fuselage case shown in Figure 20 present a similar flow development. Hence a neglectable effect on the fan inlet flow distortion is observed. Table 3 shows that η P R for the short fuselage was higher than for the long variants. This is believed to be due to the reduced fuselage wetted area, resulting in reduced frictional losses and a smaller boundary layer thickness in the case of the shortened fuselage.

4. Summary and Conclusions

The presented paper reports on a parametric study of multiple design parameters for the integration of two semi-buried BLI turbofans at the rear end of a typical TWB fuselage. Of the investigated parameters, the spanwise spacing of the nacelles is the most critical. Increasing the nacelle spanwise spacing improved the inflow distortion by reducing the diffusion separation, but this benefit needs to be offset against the added weight and nacelle drag, and the nature of this trade-off is beyond the scope of this paper. The comparison between the 2D and 3D simulations revealed, unsurprisingly, that a full aircraft simulation is necessary to capture the inflow distortion to the turbofans correctly. Nevertheless, the 2D studies were used to rapidly identify the geometric changes that would have the most impact on the AIP inflow conditions and the outcomes were appreciated.
For the studied cases, the recirculation formed by the downward motion of the flow across the edge of the fuselage contraction in the 3D simulation revealed dramatically different results, compared with the 2D simulation. A more aggressive diffusion of the intake profile, simulated in 3D, boosted the flow recirculation induced by the edge of the fuselage contraction and hence increased the inflow distortion in all aspects. Varying the AOA within the typical cruise AOA range hardly affected the inflow distortion. However, there was a trend of increased interference from the wing to the lower part of the turbofan when the AOA was increased. Increasing the mass flow entering the turbofan had the potential to push away the recirculating zone while maintaining the boundary layer to be ingested. However, in order to maintain a typical design Mach number at the fan face, the increased mass flow would need a larger fan, which may in turn bring the recirculating zone back. The high wing variant showed strong interference between the wing and the nacelle, significantly increasing the complexity of the inflow distortion. Although there are concepts that utilize the low-energy boundary layer and wake generated by the wings, a combination of different sources of distortion is hardly desirable. The shortened fuselage showed a negligible influence on the inlet flow distortion pattern but did improve the pressure recovery factor.

Author Contributions

Conceptualization, X.Z., H.-D.Y. and J.A.; methodology, X.Z. and H.-D.Y.; formal analysis, X.Z., H.-D.Y. and J.A.; writing—original draft preparation, X.Z.; writing—review and editing, X.Z., H.-D.Y., P.V.H. and J.A.; visualization, X.Z., H.-D.Y. and P.V.H. All authors have read and agreed to the published version of the manuscript.

Funding

This study is financed by the Clean Sky 2 project SUBLIME (Supporting Understanding of Boundary Layer Ingestion Model Experiment). The project has received funding from the European Union’s Horizon 2020 research and innovation programme under grant agreement number 864803.

Institutional Review Board Statement

Not applicable.

Informed Consent Statement

Not applicable.

Data Availability Statement

Not applicable.

Acknowledgments

The computations/data handling were enabled by resources provided by the Swedish National Infrastructure for Computing (SNIC) at Vera and Tetralith partially funded by the Swedish Research Council through grant agreement No. 2018-05973.

Conflicts of Interest

The authors declare no conflict of interest.

Nomenclature and Performance Metrics Definition

AOAAngle of attack
AIPAerodynamic interface plane
BLIBoundary layer ingestion
BWBBlended wing body
CFDComputational fluid dynamics
DC60Distortion coefficient
EPNdBEffective perceived noise in decibels
MFCRMass flow capture ratio
TWBTube-and-wing body
cLength scale of aircraft fuselage
DEngine fan diameter
eNacelle length extension
hEngine installation highlight
laIntake diffusion
lbIntake diffusion
p0Total pressure
ηPRPressure recovery coefficient

References

  1. Smith, A.M.O.; Roberts, H.E. The Jet Airplane Utilizing Boundary Layer Air for Propulsion. J. Aeronaut. Sci. 1947, 14, 97–109. [Google Scholar] [CrossRef]
  2. IATA. Aircraft Technology Roadmap to 2050; International Air Transport Association: Montreal, QC, USA, 2020. [Google Scholar]
  3. IATA. Technology Roadmap for Environmental Improvement Fact Sheet; International Air Transport Association: Montreal, QC, USA, 2020. [Google Scholar]
  4. Sahoo, S.; Zhao, X.; Kyprianidis, K. A Review of Concepts, Benefits, and Challenges for Future Electrical Propulsion-Based Aircraft. Aerospace 2020, 7, 44. [Google Scholar] [CrossRef] [Green Version]
  5. Kim, H.D.; Felder, J.; Tong, M.T.; Berton, J.; Haller, W. Turboelectric Distributed Propulsion Benefits on the N3-X Vehicle. Aircr. Eng. Aerosp. Technol. Int. J. 2014, 86, 558–561. [Google Scholar] [CrossRef]
  6. Liou, M.-F.; Gronstal, D.; Kim, H.; Liou, M. Aerodynamic design of the hybrid wing body with nacelle: N3-X propulsion-airframe configuration. In Proceedings of the 34th AIAA Applied Aerodynamics Conference, Washington, DC, USA, 13–17 June 2016. [Google Scholar]
  7. Kawai, R.T.; Friedman, D.M.; Serrano, L. Blended Wing Body (BWB) Boundary Layer Ingestion (BLI) Inlet Configuration and System Studies; NASA: Washington, DC, USA, 2006. [Google Scholar]
  8. Stückl, S.; van Toor, J.; Lobentanzer, H. VOLTAIR—The All Electric Propulsion Concept Platform—A Vision for Atmospheric Friendly Flight. In Proceedings of the 28th International Congress of the Aeronautical Sciences (ICAS), Brisbane, Australia, 23–28 September 2012. [Google Scholar]
  9. Steiner, H.-J.; Vratny, P.C.; Gologan, C.; Wieczorek, K.; Isikveren, A.T.; Hornung, M. Optimum number of engines for transport aircraft employing electrically powered distributed propulsion. CEAS Aeronaut. J. 2014, 5, 157–170. [Google Scholar] [CrossRef]
  10. Kruger, M.; Uranga, A. The Feasibility of Electric Propulsion for Commuter Aircraft. In Proceedings of the AIAA Scitech 2020 Forum, Orlando, FL, USA, 6–10 January 2020; p. 1499. [Google Scholar]
  11. Welstead, J.; Felder, J.; Guynn, M.; Haller, B.; Tong, M.; Jones, S.; Ordaz, I.; Quinlan, J.; Mason, B. Overview of the NASA STARC-ABL (rev. B) Advanced Concept; NASA: Washington, DC, USA, 2017. [Google Scholar]
  12. Seitz, A.; Habermann, A.L.; Peter, F.; Troeltsch, F.; Castillo Pardo, A.; Della Corte, B.; Van Sluis, M.; Goraj, Z.; Kowalski, M.; Zhao, X.; et al. Proof of Concept Study for Fuselage Boundary Layer Ingesting Propulsion. Aerospace 2021, 8, 16. [Google Scholar] [CrossRef]
  13. Bradley, M.K.; Droney, C.K. Subsonic Ultra Green Aircraft Research Phase II: N+ 4 Advanced Concept Development; NASA: Washington, DC, USA, 2012. [Google Scholar]
  14. Schnell, R.; Zhao, X.; Rallis, E.; Kavvalos, M.; Sahoo, S.; Schnoes, M.; Kyprianidis, K. Assessment of a Turbo-Electric Aircraft Configuration with Aft-Propulsion Using Boundary Layer Ingestion. Aerospace 2019, 6, 134. [Google Scholar] [CrossRef] [Green Version]
  15. Steiner, H.-J.; Seitz, A.; Wieczorek, K.; Plotner, K.; Isikveren, A.T.; Hornung, M.; Luftfahrt, B. Multi-disciplinary design and feasibility study of distributed propulsion systems. In Proceedings of the 28th International Congress of the Aeronautical Sciences, Brisbane, Australia, 23–28 September 2012. [Google Scholar]
  16. Samuelsson, S.; Grönstedt, T. Performance analysis of turbo-electric propulsion system with fuselage boundary layer ingestion. Aerosp. Sci. Technol. 2021, 109, 106412. [Google Scholar] [CrossRef]
  17. Uranga, A.; Drela, M.; Greitzer, E.M.; Titchener, N.A.; Lieu, M.K.; Siu, N.M.; Huang, A.C.; Gatlin, G.M.; Hannon, J. Preliminary Experimental Assessment of the Boundary Layer Ingestion Benefit for the D8 Aircraft. In Proceedings of the 52nd Aerospace Sciences Meeting, Hannon, National Harbor, MD, USA, 13–17 January 2014. [Google Scholar]
  18. Yutko, B.; Titchener, N.; Courtin, C.; Lieu, M.; Wirsing, L.; Hall, D.; Tylko, J.; Chambers, J.; Roberts, T.; Church, C. Design and development of the D8 commercial transport concept. In Proceedings of the 31st Congress of the International Council of the Aeronautical Sciences, ICAS 2018, Belo Horizonte, Brazil, 9–14 September 2018. [Google Scholar]
  19. Marien, T.; Welstead, J.R.; Jones, S.M. Vehicle level system impact of boundary layer ingestion for the NASA D8 concept aircraft. In Proceedings of the 2018 AIAA Aerospace Sciences Meeting, Kissimmee, FL, USA, 8–12 January 2018. [Google Scholar]
  20. Yutko, B.; Titchener, N.; Courtin, C.; Lieu, M.; Wirsing, L.; Hall, D.; Tylko, J.; Chambers, J.; Roberts, T.; Church, C. Conceptual design of a D8 commercial aircraft. In Proceedings of the 17th AIAA Aviation Technology, Integration, and Operations Conference, Denver, CO, USA, 5–9 June 2017. [Google Scholar]
  21. Wiart, L.; Atinault, O.; Hue, D.; Grenon, R. Development of NOVA Aircraft Configurations for Large Engine Integration Studies. In Proceedings of the 5th SCAD, Naples, Italy, 12 October 2015. [Google Scholar]
  22. Wiart, L.; Atinault, O.; Boniface, J.C.; Barrier, R. Aeropropulsive performance analysis of the NOVA configurations. In Proceedings of the 30th Congress of the International Council of the Aeronautical Sciences, Daejeon, Korea, 25–30 September 2016. [Google Scholar]
  23. Romani, G.; Ye, Q.; Avallone, F.; Ragni, D.; Casalino, D. Fan Noise Boundary-Layer Ingestion Installation Effects for NOVA Aircraft Configuration. In Proceedings of the 25th AIAA/CEAS Aeroacoustics Conference, Deft, The Netherlands, 20–23 May 2019. [Google Scholar]
  24. Romani, G.; Ye, Q.; Avallone, F.; Ragni, D.; Casalino, D. Numerical analysis of fan noise for the NOVA boundary-layer ingestion configuration. Aerosp. Sci. Technol. 2019, 96, 105532. [Google Scholar] [CrossRef]
  25. Wiart, L.; Negulescu, C. Exploration of the airbus “Nautilius” engine integration concept. In Proceedings of the 31st Congress of the International Council of the Aeronautical Sciences, Belo Horizonte, Brazil, 9–14 September 2018. [Google Scholar]
  26. Godard, B.; Negulescu, C. Fan Design Investigation on the Airbus Nautilius Engine Integration Concept. In Proceedings of the Turbomachinery Technical Conference and Exposition 2020, Turbo Expo: Power for Land, Sea, and Air, American Society of Mechanical Engineers, Virtual, 21–25 September 2020. [Google Scholar]
  27. Ahuja, J.; Mavris, D.N. Sensitivity of boundary layer ingestion effects to tube and wing airframe design features. In Proceedings of the AIAA Scitech 2020 Forum, Orlando, FL, USA, 6–10 January 2020. [Google Scholar]
  28. Arend, D.; Tillman, G.; O‘Brien, W. Generation after next propulsor research: Robust design for embedded engine systems. In Proceedings of the 48th AIAA/ASME/SAE/ASEE Joint Propulsion Conference & Exhibit, Atlanta, GA, USA, 30 July–1 August 2012. [Google Scholar]
  29. Florea, R.V.; Matalanis, C.; Hardin, L.W.; Stucky, M.; Shabbir, A. Parametric Analysis and Design for Embedded Engine Inlets. J. Propuls. Power 2015, 31, 843–850. [Google Scholar] [CrossRef]
  30. Cousins, W.T.; Voytovych, D.; Tillman, G.; Gray, E. Design of a distortion-tolerant fan for a boundary-layer ingesting embedded engine application. In Proceedings of the 53rd AIAA/SAE/ASEE Joint Propulsion Conference, Atlanta, GA, USA, 10–12 July 2017. [Google Scholar]
  31. Pardo, A.C.; Hall, C.A. Design of a Transonic Boundary Layer Ingesting Fuselage Fan. In Proceedings of the Global Power and Propulsion Society, Chania, Greece, 7–8 September 2020. [Google Scholar]
  32. Brown, K.A.; Fleming, J.L.; Langford, M.; Ng, W.; Schwartz, K.; Combs, C. Development of a Ducted Propulsor for BLI Electric Regional Aircraft-Part I: Aerodynamic Design and Analysis. In Proceedings of the AIAA Propulsion and Energy 2019 Forum, Indianapolis, IN, USA, 19–22 August 2019. [Google Scholar]
  33. Celestina, M.L.; Long-Davis, M.J. Large-scale boundary layer ingesting propulsor research. In Proceedings of the ISABE Conference 2019, Canberra, Australia, 22–27 September 2019. [Google Scholar]
  34. Clark, I.; Thomas, R.H.; Guo, Y. Aircraft system noise assessment of the NASA D8 subsonic transport concept. In Proceedings of the 2018 AIAA/CEAS Aeroacoustics Conference, Atlanta, GA, USA, 25–29 June 2018. [Google Scholar]
  35. Clark, I.; Thomas, R.H.; Guo, Y. Far Term Noise Reduction Roadmap for the NASA D8 and Single-Aisle Tube-and-Wing Aircraft Concepts. In Proceedings of the 25th AIAA/CEAS Aeroacoustics Conference, Deft, The Netherlands, 20–23 May 2019. [Google Scholar]
  36. Gray, J.S.; Mader, C.; Kenway, G.; Martins, J.R.R.A. Approach to modeling boundary layer ingestion using a fully coupled propulsion-RANS model. In Proceedings of the 58th AIAA/ASCE/AHS/ASC Structures, Structural Dynamics, and Materials Conference, Grapevine, TX, USA, 9–13 January 2017. [Google Scholar]
  37. Gray, J.S.; Martins, J.R.R.A. Coupled aeropropulsive design optimisation of a boundary-layer ingestion propulsor. Aeronaut. J. 2018, 123, 121–137. [Google Scholar] [CrossRef] [Green Version]
  38. Fernández, A.M.; Smith, H. Effect of a fuselage boundary layer ingesting propulsor on airframe forces and moments. Aerosp. Sci. Technol. 2020, 100, 105808. [Google Scholar] [CrossRef]
  39. Kenway, G.K.; Kiris, C.C. Aerodynamic shape optimization of the STARC-ABL concept for minimal inlet distortion. In Proceedings of the 2018 AIAA/ASCE/AHS/ASC Structures, Structural Dynamics, and Materials Conference, Kissimmee, FL, USA, 8–12 January 2018. [Google Scholar]
  40. Gray, J.S.; Mader, C.A.; Kenway, G.K.W.; Martins, J.R.R.A. Modeling Boundary Layer Ingestion Using a Coupled Aeropropulsive Analysis. J. Aircr. 2018, 55, 1191–1199. [Google Scholar] [CrossRef]
  41. Battiston, A.; Ponza, R.; Benini, E. Design Exploration for an Axisymmetric Rear BLI Propulsor. In Proceedings of the AIAA Propulsion and Energy 2021 Forum, Virtual, 9–11 August 2021. [Google Scholar]
  42. Brodersen, O. Drag Prediction of Engine-Airframe Interference Effects Using Unstructured Navier-Stokes Calculations. J. Aircr. 2002, 39, 927–935. [Google Scholar] [CrossRef]
  43. SAFRAN. Leap-1A Technical Characteristics Table. Available online: https://www.safran-aircraft-engines.com/commercial-engines/single-aisle-commercial-jets/leap/leap-1a (accessed on 24 May 2021).
  44. Langley, M. The Design of Axisymmetric Cowls for Podded Nacelles for High By-Pass Turbofan Engines; Aeronautical Research Council: London, UK, 1979. [Google Scholar]
  45. Frink, N.T. 3rd AIAA CFD Drag Prediction Workshop Gridding Guidelines; NASA Langley: Hampton, VA, USA, 2007. [Google Scholar]
  46. Du, P.; Agarwal, R.K. Numerical drag prediction of NASA Common Research Models using different turbulence models. Comput. Fluids 2019, 191, 104238. [Google Scholar] [CrossRef] [Green Version]
  47. Togiti, V.; Eisfeld, B.; Brodersen, O. Turbulence Model Study for the Flow Around the NASA Common Research Model. J. Aircr. 2014, 51, 1331–1343. [Google Scholar] [CrossRef]
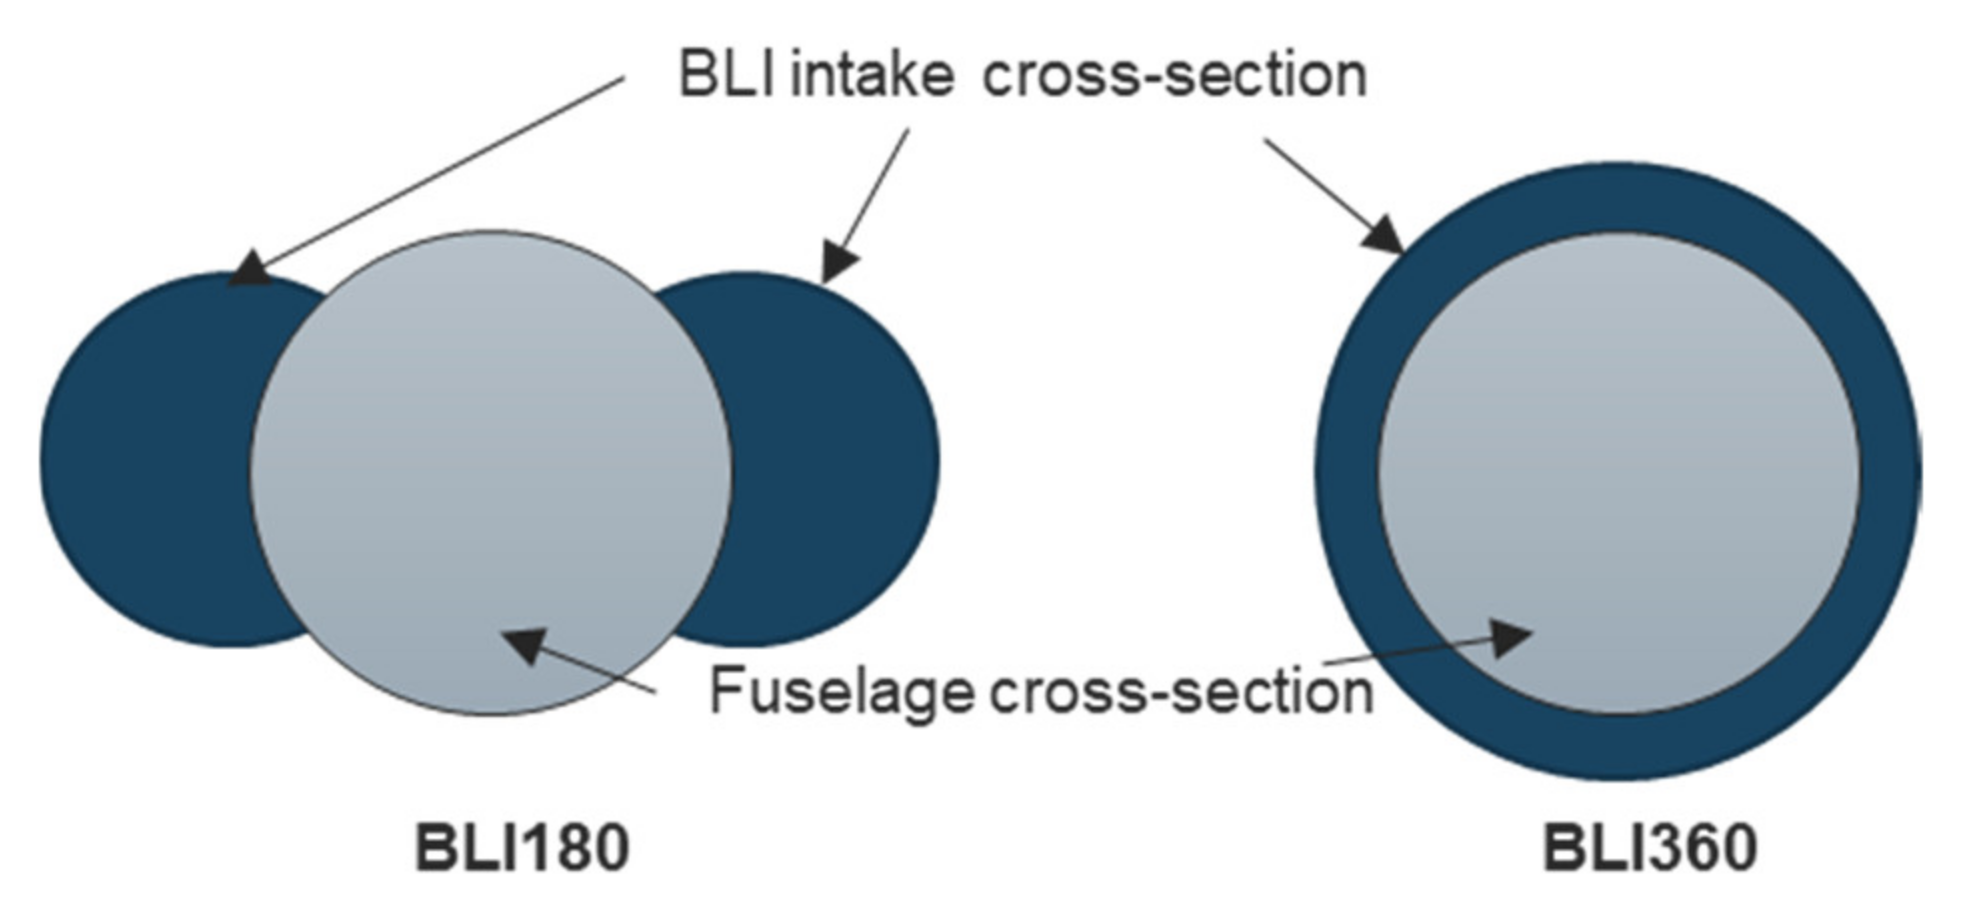
Figure 1. Illustrative diagrams of BLI180 (left) and BLI360 (right) concepts for TWB configurations.
Aerospace 09 00426 g001
Figure 2. Isolated airframe geometry designed based on DLR F6 [42].
Aerospace 09 00426 g002
Figure 3. BLI180 configuration designed with two turbofans buried in the fuselage tail cone.
Aerospace 09 00426 g003
Figure 4. Computation domain mesh generated for the 2D cases.
Aerospace 09 00426 g004
Figure 5. Typical surface mesh generated for the 3D cases.
Aerospace 09 00426 g005
Figure 6. Illustration of the 60-degree sector used in the distortion severity calculation method.
Aerospace 09 00426 g006
Figure 7. Contours of Mach number (normalized) for baseline case, 2D simulations.
Aerospace 09 00426 g007
Figure 8. Contours of Mach number for varying nacelle highlight positions, 2D simulations.
Aerospace 09 00426 g008
Figure 9. Contours of Mach number. Results of varying intake diffusion lengths la, 2D simulation.
Aerospace 09 00426 g009
Figure 10. Contours of Mach number. Results of varying intake diffusion lengths lb, 2D simulation.
Aerospace 09 00426 g010
Figure 11. Contours of Mach number. Results for varying outer nacelle extensions e, 2D simulation.
Aerospace 09 00426 g011
Figure 12. Contours of Mach number for cruise (top) and Vx [m/s] for take-off (bottom). NOVA-similar design, 2D simulation.
Aerospace 09 00426 g012
Figure 13. Contours of Mach number. Comparison between 2D (upper) and 3D (lower) simulations for case h/D = 0.6, e/D = 0, la/D = lb/D = 4.8.
Aerospace 09 00426 g013
Figure 14. Pathlines towards the inlet of the engine (top) and the contours of the total pressure [Pa] in the planes of interest (from the second to the last: Plane 1, Plane 2 and Plane 3), results from the 3D simulation of case h/D = 0.6, e/D = 0, la/D = lb/D = 4.8.
Aerospace 09 00426 g014aAerospace 09 00426 g014b
Figure 15. A zoom-in of pathlines towards the inlet of the engine (top) and the contours of the Mach number in the planes of interest (bottom left: AIP, bottom right: fan inlet), results from the 3D simulation of case h/D = 0.6, e/D = 0, la/D = lb/D = 4.8.
Aerospace 09 00426 g015aAerospace 09 00426 g015b
Figure 16. Contours of Mach number in the planes of interest (from left to right: mid-plane cross-section, AIP and fan inlet), results from the 3D simulation of the three revisions (from top to bottom: Rev1_3D, Rev2_3D and Rev3_3D).
Aerospace 09 00426 g016
Figure 17. Contours of Mach number in the planes of interest (from left to right: mid-plane cross-section and fan inlet), results from the 3D simulation of mass flow variation cases (from top to bottom: −4.4% fan mass flow, baseline, +4.4% fan mass flow and +8.8% fan mass flow).
Aerospace 09 00426 g017
Figure 18. Contours of pressure coefficient on the aircraft body (left) and Mach number in the fan inlet (right), results from the 3D simulation of angle of attack variation cases (from top to bottom: AOA 1 deg, AOA 2 deg and AOA 4 deg).
Aerospace 09 00426 g018
Figure 19. Pathlines towards the inlet of the engine (top left), the contour of the Mach number in the plane of fan inlet (top right), and the contours of the total pressure [Pa] in the planes of interest (from the second to the last: Plane 1, Plane 2 and Plane 3), results from the 3D simulation of high wing position.
Aerospace 09 00426 g019
Figure 20. Pathlines towards the inlet of the engine (top left), the contour of the Mach number in the plane of fan inlet (top right), and the contours of the total pressure [Pa] in the planes of interest (From the second to the last: Plane 1, Plane 2 and Plane 3), results from the 3D simulation of short fuselage.
Aerospace 09 00426 g020
Table 1. Overview of the engine integration design parameters for the sensitivity study.
Illustrative DiagramDesign Parameter DescriptionCases
Aerospace 09 00426 i001Distance h between fuselage centreline and the nacelle highlighth/D = [0.2, 0.4, 0.6, 0.8]
Aerospace 09 00426 i002Intake diffusion length la (Fixing the start point of the fuselage side profile)la/D = [4.8, 3.6, 2.5]
Aerospace 09 00426 i003Intake diffusion length lb (Fixing the end point of the fuselage side profile)lb/D = [4.8, 3.6, 2.5]
Aerospace 09 00426 i004Outer nacelle extension ee/D = [0, 0.6, 1.2]
Table 2. CFD setups for the simulations.
2D Setup3D Setup
Steady State, Ideal GasSteady State, Ideal Gas
Turbulence Modelk-ω SST✓ Viscous Heating✓ Viscous Heating
✓ Production Limiter✓ Curvature Correction
✓ Production Limiter
Freestream ConditionsPressure Far FieldStatic Pressure: 66,471 [Pa]Static Pressure: 66,471 [Pa]
Static Temperature: 277 [K]Static Temperature: 277 [K]
Mach: 0.8Mach: 0.8
Turbulent Intensity: 0.1%Turbulent Intensity: 0.1%
Turbulent Viscosity Ratio: 1Turbulent Viscosity Ratio: 1
Solution MethodsPressure-Velocity SchemeCoupledCoupled
Spatial DiscretizationGradient: LSCB
Pressure: Second Order
Density, Momentum, k, ω, Energy: Second Order
Gradient: LSCB
Pressure: Second Order
Density, Momentum, k, ω, Energy: Second Order
MeshNumber of Elements~0.38 million~40 million
Wall inflation layers4641
First layer height0.0004 mm0.0004 mm
Layer growth rate<1.25<1.25
Maximum y plus<1.0<1.0
Table 3. Quantitative results for the 3D cases.
No.CaseAOAFan Mass Flow η P R D C 60
ARev1_3D1 deg1.02 kg/s0.9870.290
BRev2_3D1 deg1.07 kg/s0.9950.112
CRev3_3D1 deg1.04 kg/s0.980 0.300
DRev1_3D
−4.4% mass flow rate
1 deg0.98 kg/s0.9890.280
ERev1_3D
+4.4% mass flow rate
1 deg1.07 kg/s0.9860.287
FRev1_3D
+8.8% mass flow rate
1 deg1.11 kg/s0.9850.259
GRev1_3D
+4.4% mass flow rate
2 deg1.06 kg/s0.9850.306
HRev1_3D
+4.4% mass flow rate
4 deg1.12 kg/s0.9930.346
IRev1_3D
+4.4% mass flow rate, High wing
1 deg0.99 kg/s0.9680.410
JRev1_3D
+4.4% mass flow rate, Short fuselage
1 deg1.03 kg/s0.9950.290
Publisher’s Note: MDPI stays neutral with regard to jurisdictional claims in published maps and institutional affiliations.