Abstract
In MR (mixed reality) environments, visual searches are often used for search and localization missions. There are some problems with search and localization technologies, such as a limited field of view and information overload. They are unable to satisfy the need for the rapid and precise location of specific flying objects in a group of air and space targets under modern air and space situational requirements. They lead to inefficient interactions throughout the mission process. A human being’s decision and judgment will be affected by inefficient interactions. Based on this problem, we carried out a multimodal optimization study on the use of an auditory-assisted visual search for localization in an MR environment. In the spatial–spherical coordinate system, the target flight object position is uniquely determined by the height h, distance r, and azimuth θ. Therefore, there is an urgent need to study the cross-modal connections between the auditory elements and these three coordinates based on a visual search. In this paper, an experiment was designed to study the correlation between auditory intuitive perception and vision and the cognitive induction mechanism. The experiment included the three cross-modal mappings of pitch–height, volume–distance, and vocal tract alternation–spatial direction. The research conclusions are as follows: (1) Visual cognition is induced by high, medium, and low pitches to be biased towards the high, medium, and low spatial regions of the visual space. (2) Visual cognition is induced by loud, medium, and low volumes to be biased towards the near, middle, and far spatial regions of the visual space. (3) Based on the HRTF application, the vocal track alternation scheme is expected to significantly improve the efficiency of visual interactions. Visual cognition is induced by left short sounds, right short sounds, left short and long sounds, and right short and long sounds to be biased towards the left, right, left-rear, and right-rear directions of visual space. (4) The cognitive load of search and localization technologies is significantly reduced by incorporating auditory factors. In addition, the efficiency and effect of the accurate search and positioning of space-flying objects have been greatly improved. The above findings can be applied to the research on various types of target search and localization technologies in an MR environment and can provide a theoretical basis for the subsequent study of spatial information perception and cognitive induction mechanisms in an MR environment with visual–auditory coupling.
1. Introduction
At present, an operator’s monitoring of air and space situations and searching judgments of relevant targets are mainly conducted through a radar interface [1]. With an explosion in the number of aircraft, the air and space situation is becoming increasingly complex [2,3,4]. The shortcomings of the insufficient information loading of the 2D graphical interface are exposed. Information on the height, distance, and direction of the flight target is difficult to obtain through the radar interface the first time. This has a serious impact on the efficiency of its search and localization capabilities. The vigorous development of MR technology provides an idea for solving the above problems: the information dimension is broadened by its three-dimensional display mode, which can realize a holographic perception of the overall situation and fill the gaps in the types of information [5,6,7,8]. However, greater visual fatigue and cognitive pressures in search and judgment are experienced by an operator due to the richer amount of information that comes with it [9,10]. Multimodal interaction is an important means of human–computer interaction, and the interaction efficiency can be significantly improved by combining different sensory channels [11,12,13]. In addition, there are now more and more multimodal solutions that combine vision with hearing, touch, and so on. In this paper, the visual search judgment of an operator is mainly based on the addition of auditory assistance in an MR environment [14]. Combining the element of sound with spatial perception correspondingly assists with indicating the spatial characteristics of the target. Here, the spatial characteristics are mainly a proxy for the position information of the target. In the spherical coordinate system [15], the position of a 3D object is uniquely determined by the height h, distance r, and azimuth angle θ. Under existing theories, there are also numerous researches on the intuitive perception and mutual induction relationship between pitch–spatial height, volume–spatial distance, and vocal tract alternation–spatial direction. This paper will also introduce the research results and current progress of auditory-assisted vision from these perspectives.
It is intuitively clear that there is a connection between pitch and spatial height. Cesare V. Parise and Katharina Knorre [16] determined the existence of a mapping between auditory frequencies and perceived vertical height by measuring the statistics of natural auditory signals and obtained the following conclusions: The experiments show a consistent mapping between sound frequencies and the average height of their external spatial sources. This is particularly evident in the middle range of the spectrum between 1 and 6 kHz. In addition, moderate but consistent frequency-dependent biases were also present in horizontal sound localization. These results suggest that there is a significant frequency perception bias in sound localization. This bias depends on the statistics of the natural auditory scene as well as on the filtering properties of the outer ear. This provides important ideas for subsequent mapping relationships involving frequency dependence, such as pitch–height, as in this paper, and provides a theoretical basis for their further study and generalized application in MR environments. It is also evidenced in neurology. With the use of fMRI, Kelly McCormick [17] obtained a pitch–height correspondence by observing the consistent effect of the pitch–spatial height pitch in the bilateral inferior frontal and insular cortex, the right frontal visual field, and the right subparietal cortex. The related applications of the pitch–height-based cross-modal mapping are also becoming more abundant and mature: Marco Pitteri [18] scientifically presented a SMARC effect applied to the music field. Pitch–height can be expressed in a spatial format; when the response is executed in the lower part of the space, the response times (RTs) are faster for bass heights. In addition, when the response is executed in the upper part of the space, the RTs are faster for high pitch heights. This provides an important theoretical basis for the search performance in this paper. It is shown in Judith Holler’s [19] research that the common phonological gestures of some Dutch and Persian speakers reveal a mapping of high-to-high space and low-to-low space. Moreover, this gestural spatial–pitch mapping is considered to occur simultaneously with the corresponding spatial word (high-low). In addition, Sarah Dolscheid [20] confirmed that different speakers differ in spatial–pitch correlations. The strong correlation between both pitch and spatial height is also illustrated in their respective sets of data. In addition, the pitch–height spacing is more malleable compared to other mapping correlations. The above studies and some related studies [21,22] have explored the connection between pitch–indication–height, including both the physiological principle and the application level, but the mechanism has not been verified and applied in a mixed-reality environment, and it should be investigated whether it can be applied in the scenario of this paper.
There is a correlation between the volume and the distance: the farther away, the smaller the sound [23]. Taking advantage of this property, the cognitive mechanisms related to the indication, offset, and enhancement between the volume and spatial distance of vision have been intensively investigated and are widely used. Paul Luizard [24] presented a heuristic model based on the parametric analytic solution of the diffusion equation and the physical approximation of sound energy behavior. It is used to describe the design of geometric structures in concert halls. The energy decay properties of the volume in the audio-visual coupled space are explained. This provides important support for the subsequent volume design principles in this paper. Andrew J. Kolarik [25] showed the coupled relationship between the distance properties of vision and sound source distance through an experimental study. and found that when there is partial visual loss, participants with visual loss misjudge the relationship between the room size and sound source distance as judged by participants with normal vision. Scott A. Hong [26] investigated the problem of hearing damage to infants from excessive volume by setting up three microphones at different spatial distances to simulate different volumes. Min-Chih Hsieh [27] set up an electric vehicle warning sound with different volume levels and different distances and the efficiency of it with a recognition of the warning was judged. Accordingly, the degree of influence of auditory warnings at different volume levels on visual perception was investigated. Hongrae Jo [28] used visual and acoustic methods to explain the phenomenon of bubble condensation. The volume of the bubble was measured visually to determine the distance of its movement in a vertical direction. The auditory perception of the sound pressure signal after volume conversion was also used to obtain its relative position relationship. This reflects the consistency of the indication of visual distance and auditory volume. The volume–distance cross-modal application described above exemplifies the validity of the auditory-perceptual indication of distance and its strong correlation with cognition. By setting three different distances, Like Jiang [29] studied the rapidity of the visual impact of different sound distances. This can be used to evaluate the impact of traffic noise on the efficiency of visual judgments on highways. This study also provides an important idea for the experimental design of this paper, that is, by studying the correspondence between different distances and different sounds, the correlation between volume and distance indication is confirmed. The mechanism, experiment, and application of volume indication distance in different scientific fields are illustrated by the above results and some related studies [30,31,32]. However, whether its application in an MR environment is smooth and reasonable and whether it is consistent with cognitive mechanisms needs to be further investigated.
The direction in visual space can likewise be indicated by sound. The Head-Related Transfer Function (HRTF) is a very effective implementation of a sound localization algorithm for describing the transmission of sound waves from a sound source to both ears. This has been demonstrated in related studies by Dmitry N. Zotkin and Ramani Duraiswami [33] who used a new approach to detail the algorithmic details of HRTF interpolation, room impulse response creation, HRTF selection from the database, and audio scene representation by selecting personalized head-related transfer functions (HRTFs) based on anatomical measurements from the database. They successfully constructed a theoretical system for rendering local spatial audio in virtual auditory space. This provides an important theoretical basis for auditory-assisted visual–spatial localization. V R. Algazi and R. O. Duda [34] studied the statistical data of anthropometric parameters and the correlation between anthropometric measurements and some temporal and spectral features of HRTF and provided a database for public study, contributing to research in the field of auditory localization. Sound indication direction can also be achieved by a binaural vocal tract shift and a time difference in time arrival. M. Houtenbos [35] explored the effects of different vocal channel input sequences on the perceived orientation of joint visual-auditory interactions in the absence of complete visual cues. He achieved this using audio “beeps” in different lateral input directions (left-to-right ear and right-to-left ear) corresponding to the direction of approach of the target. Experiments have shown that this way of indicating the direction can substantially improve the efficiency of the visual-auditory display and its perceived direction. This facilitated the specific design of the experimental protocol based on the principle in this paper. Tahir Mushtaq QURESHI [36] proposes a digital waveguide-based sound channel model. The sound channel is decomposed by the model into uniform-length cylindrical segments, the time played by the sound wave propagation in its axial direction is explored, and the predicted relevant direction is determined by this time difference. Alfonso Nieto-Castanon [37] analyzed the vocalization data of the subjects in the experiment. It was ascertained that the degree of acoustic variation along a given joint direction was relatively strong. This confirms a consistent relationship between the vocal tract as a target variable and orientation. The effectiveness of directional indication based on vocal tract alternation and its region-specific cognitive induction were effectively demonstrated by the above-mentioned studies. However, its related mechanisms have been less frequently applied in MR environments as a general rule, and this needs to be subsequently explored through specific experiments.
In summary, the study shows that the pitch, volume, and vocal track alternation scheme in a joint audio-visual interaction is closely related to spatial height, distance, and direction in realistic environments. They also have a wide range of applications in the positioning, medical, and transportation fields [38,39,40]. However, there is still a gap in how to efficiently optimize spatial–visual interactions through auditory assistance in MR environments. Whether the mechanisms in the real space state are applicable in an MR environment and whether the cognitive mechanisms change have not yet been explored. Further studies of visual-auditory multimodal interactions in MR environments are therefore stalled. The search task of command and control in a holographic environment is also constrained. In addition, there is a lack of research on the integration of the above three types of elements. They cannot meet the rapid and accurate localization of sound and spatial location when each element is complete. Therefore, in this paper, an experiment was designed to investigate the connection between the characteristics of sound and the spatial elements of MR, pitch–height, volume–distance, and vocal tract alternation–spatial orientation. A validation of the effects of the fusion of the auditory elements indicating spatial location was also carried out
2. Experimental Procedures and Methods
2.1. Experimental Procedure
2.1.1. Experimental Procedure for the Correlation between Auditory Elements and Target Characteristics
This section is divided into three experiments, which were designed to verify the correlation between auditory elements and target location characteristics from three perspectives: pitch–height, volume–distance, and vocal tract alternation–direction. They were implemented by locating a simulated spacecraft in an MR environment
The subjects were 30 master’s degree students from an engineering university (age range 23–35, mean 25.6, SD = 2.67). All subjects had experience in mixed-reality operations and had a fuller understanding of the target search task related to this paper. They had normal vision and hearing, were not informed in advance of the purpose of the experimental study, and their informed consent was obtained.
For the equipment, the experimental scene was presented in Hololens 2. Hololens 2 is an MR device that takes a transparent holographic lens to achieve a 3D display based on eye position. It is paired with six cameras and depth sensors to support line-of-sight tracking, touch, grip, and other interactive operations, and has built-in spatial speakers. The necessary hardware conditions for auditory-assisted instructional vision are available to meet the experimental requirements. Participants wore devices on their heads and stood in a relatively empty room with some visible light. The immersive scenes were edited by unity3D software, and the specific equipment and subject sites are shown in the Figure 1 below. The corresponding scenes of the different experiments will be introduced later.
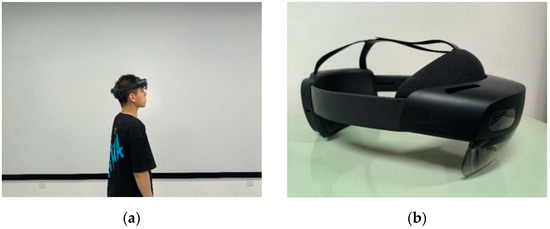
Figure 1.
Experimental scenarios and equipment (a) the subject wearing the device; (b) Hololens 2 display device.
- (1)
- Experiment 1: Pitch–Height
Under the study of the existing environment, there is a consistent mapping relationship between the frequency of sound and the perceived external environment; the higher the frequency, the higher the perceived height. In addition, there is also a positive correlation between sound frequency and its manifested pitch; the higher the frequency, the higher the pitch. Therefore, we can reasonably infer the plausibility of the pitch–height mapping and further investigate it in an MR environment. This experiment was intended to simulate the MR air and space situation for the rapid search and positioning of targets at different heights. The experiment was set up with three different pitch cues and three different spatial heights. The efficiency of the operator in discerning a target at a specific height was investigated in the presence of different pitch cues. The scenario of a specific pitch indicating height is shown in Figure 2.
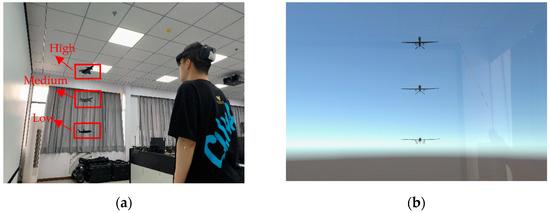
Figure 2.
Scenes from experiment 1. (a) Schematic diagram of the virtual-real scene; (b) Range of height of field of view in MR.
Three different flying objects at high, medium, and low heights (with an altitude difference of 15 m in the field of view) flew in the subject’s direction at the same time. Subjects needed to find the specified flying object. First, three kinds of cue audio with high, medium, and low pitch were processed separately by changing the sound frequency. Their sound frequencies were 4 kHz, 3 kHz, and 2 kHz. One kind of cue audio was played randomly during the flight of the target in conjunction with the target flight. The targets of each trial appeared randomly, but the total number of times each audio appeared with targets of different heights needed to be controlled to be the same. Due to the need to control the variables, only one type of audio was played for each task process. The judgments were made 9 times in each trial, and 9 sets of experiments were performed. The number of times each pitch indicated a different height was 9. The purpose of the search judgment experiment is to obtain the correct judgment result, that is, to find the correct specific simulated aircraft. In addition, the reaction time results of the incorrectly judged experimental samples are of little reference significance for the mechanistic study in this paper. So, a total of 81 sets of data with correct judgment results were recorded.
- (2)
- Experiment 2: Volume–Distance
In real-world environments, sound stimuli at near and far ends can cause biases in human localization judgments. Different volumes of audio have different impact characteristics when they reach the human ear. This experiment was intended to simulate the MR air and space situation for the fast search and localization of targets at different distances. The experiment was set up with three different volumes of audio and three different distances of targets. The efficiency of the operator in discerning a specific distance target under the condition of having a different volume for the cue sound was explored. The scenario of specific volume indicating distance is shown in Figure 3.
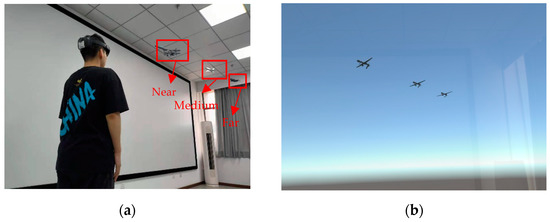
Figure 3.
Scenes from experiment 2. (a) Schematic diagram of the virtual-real scene; (b) Range of distance of field of view in MR.
Combined with the variability of the virtual and actual ranges, this experiment selected a scale of 1:1 in unity3D, that is, 1 unit distance in unity3D corresponds to 1 m of actual distance. Three targets with different distances (15 m, 30 m, and 50 m) from the human eye were placed at the same height (field-of-view height 30 m) and in the same direction. In order to correspond to the volume attenuation in the above realistic environment, different volumes were set at the corresponding positions of the targets to indicate the targets (the volumes were V, V-6, V-10.5). With audio instructions at different volumes, subjects judged the target location visually and then selected the correct target to complete a set of experiments. The experiment started with an initial value of V = 50 decibels (dB), then the corresponding volumes at three different locations were 50 dB, 44 dB, and 39.5 dB. Of these, half of the subjects performed nine experiments (three random displays for each distance) with auditory distance cues. The remaining half of the subjects completed the above experiments without auditory distance cues. A total of 48 sets of data with correct judgment results were obtained.
- (3)
- Experiment 3: Vocal Track–Direction
This experiment was intended to simulate the MR air and space situation for the rapid search and positioning of targets in different directions. By taking HRTF as a basic method for indicating directions and combining it with coding theory, four alternate cueing schemes with different sound channels were set up. The response times of the operator in the context of HRTF with and without the alternating sound channel scheme conditions were compared. Thus, we analyze whether the alternating sound channel scheme can improve the interaction efficiency in the context of HRTF.
Since the field of view of Hololens 2 is 47°, it cannot fully fit the field of view of the human eye. In addition, the target orientation generally needs to be considered in all directions. Therefore, in this experiment, the realistic environment in which the subjects were located was divided into four areas (Figure 4 below), which were 0°–90°, 90°–180°, 180°–270°, and 270°–360°.
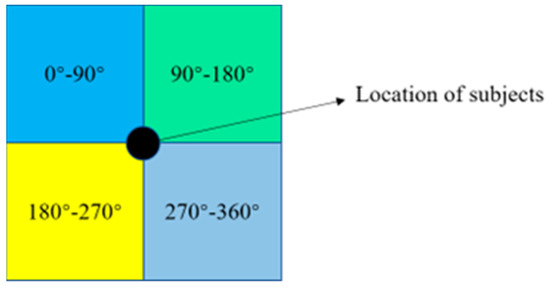
Figure 4.
Area–division diagram.
In an MR environment, the HRTF can be implemented by the steamaudio plug-in. Our experiment uses “SteamAudioHRTF” as the steamaudio plug-in to realize the direction setting based on HRTF. The four directions of the sound source in the unity3D experimental scene were set to 45°, 135°, 225°, and 315° and then “HRTF” mode was turned on to indicate the left, right, left-back, and right-back directions, respectively. The experimental program without alternating vocal tracks is prompted by the default long sound, and HRTF mode in the plug-in is applied to process the audio as it corresponds to the simulated aircraft appearing in the corresponding direction (for example, the simulated aircraft in the left direction is prompted by the 45° audio). The addition of HRTF sound effects can better suggest the direction but will also enable people to perceive the existence of direction and make judgments. However, during the actual experiment, it was found that when this method is used, a human can discriminate the left and right directions quickly but there is a fuzzy area for the front and back directions, which is less efficient. Therefore, this paper combines the ideas of “short flash” and “long flash” from coding theory [41] in the sound channel alternation scheme design; in the front of the left and right directions a short sound cue was used, and in order to play a distinguishing effect, in the back two corresponding directions a “long + short sound” cue was used. The situation is shown in Figure 5 below:
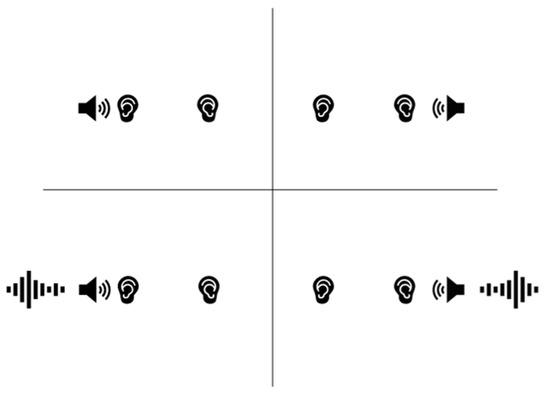
Figure 5.
Schematic diagram of vocal track stimulation in each direction.
Based on the above principle, the four subjects were informed of the experimental method and requirements in advance, and then the experiment was started. All subjects performed the discrimination experiment 2 times in each direction (scenario below in Figure 6). A total of 64 sets of data were obtained when the discriminations were correct. The direction in which the target appears in each experiment was set to be random, but the total number of times in each direction was the same. The experiment time and correctness were recorded in the background and left for data analysis. The scenarios of alternating specific vocal tracks to indicate spatial directions are shown in Figure 6 and Figure 7.
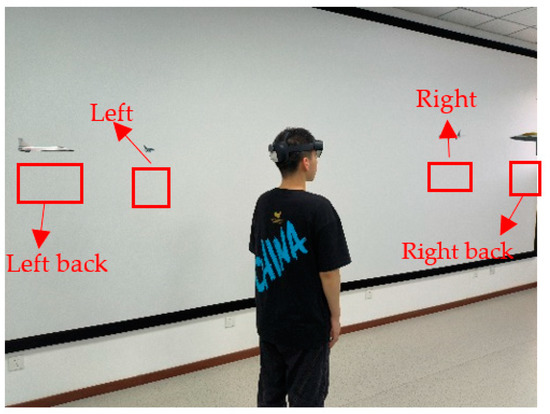
Figure 6.
Schematic diagram of the virtual-real scene.
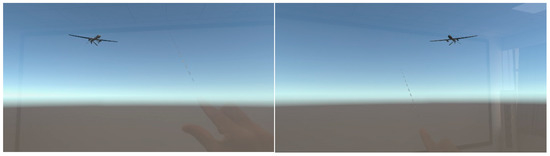
Figure 7.
Range of distance field of view in MR.
2.1.2. Experimental Procedure for an Integrated Task of Auxiliary Target Localization Incorporating Auditory Elements
Three experimental studies on the connection between sound and spatial vision of pitch–spatial height, volume–spatial distance, and vocal track alternation–spatial direction were conducted in the previous phase. In a comprehensive target localization task, the three elements need to be organically integrated to indicate the specific location of the target. When combining auditory assists, it is necessary to integrate the auditory elements as well. However, this auxiliary indication has not appeared in previous studies and the first time it has been used was in the MR visual field environment. Therefore, this experiment specifically investigated its one-to-one correspondence.
Ten subjects who had participated in the three previous correlation experiments and were familiar with the three cross-modal associations of pitch–height, volume–distance, and vocal tract alternation–direction were selected, and six integrated discrimination experiments with and without auditory assistance were conducted for each. The arrangement of the 36 targets and the location of the particular target to be found were randomized. In addition, the targets were randomly disrupted after each completed experiment, and then the subjects were allowed to make the next identification. The time to complete the task and the success or failure of the two comparison experiments were recorded. In addition, the number of times before and after the direction of the experiment was the same in the control group. A total of 120 comparison experiments were eventually performed. The virtual scene is illustrated in Figure 8 and the real scene is shown in Figure 9.
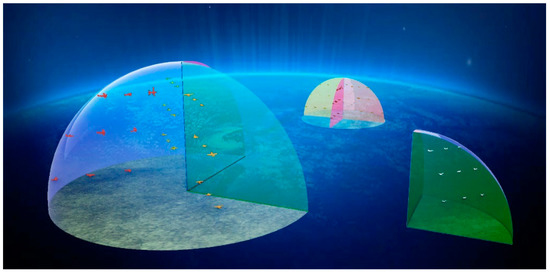
Figure 8.
MR visual field scene schematic: where the left hemisphere is the range of the subject’s visual field; the right side is the range of a separate direction; the upper part is the schematic of the four directions in which the target is located.
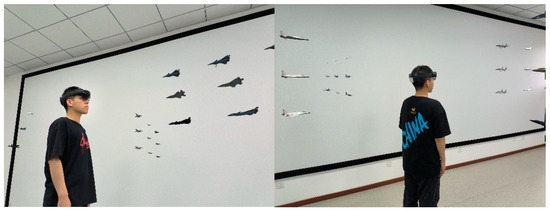
Figure 9.
The virtual-real diagram of an integrated task of auxiliary target localization incorporating auditory elements.
2.2. Experimental Method
2.2.1. Experimental Method of Correlation between Auditory Elements and Target Characteristics
To explore the relationship between pitch and height, the pitch needs to be quantified. For the quantitative study of pitch, in terms of traditional physics, it represents the level of sound frequency. The higher the frequency, the higher the pitch, and vice versa, the lower the pitch, the lower the frequency, which is calculated in Equation (1). In this experiment, three different pitches of audio were created for the experiment by varying the sound frequency.
The volume represents the intensity of the sound. Considering the fluctuating nature of sound, it is usually analyzed using short-period analysis, commonly known as “frame analysis”. Its relative stability in the shorter time range can be ensured by this. The calculation is performed by Equation (2).
The relative intensity value L in decibels (dB) can be obtained by this method. This is consistent with the human ear’s perception of sound size. However, due to the noise contained in the sound and its inherent offset nature, the use of pre-processing to avoid errors is usually performed before the calculation.
The processing of audio and quantization in experiments on volume is carried out mainly using the above theory. We can obtain insights from the propagation law of the point source on how the calculated volume is specifically prompted. Usually, under ideal conditions the sound intensity is inversely squared with distance; for every doubling of the sound source distance, the sound intensity decreases by 6 dB. Previous studies have shown that humans increase their sound output to compensate for the loss of these sound transmissions. The sound itself is also a wave and for a point source, its attenuation with distance is similar to the scattering of electromagnetic waves from a point charge, satisfying Equation (4). From Equation (4) we can obtain the table of distance attenuation values of point sources in a realistic environment, as shown in Table 1.

Table 1.
Point source distance attenuation values.
Based on this table of values, we can obtain the graph corresponding to the decay values fitted by the scatter plot as shown in Figure 10.
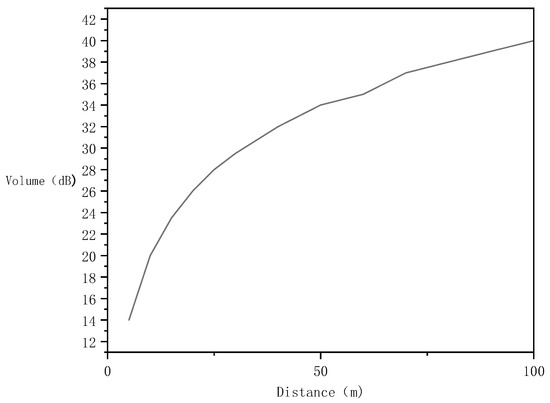
Figure 10.
Volume distance correspondence of point source attenuation.
When the sound is transmitted to us, the HRTF will correspond to the phase and frequency responses of our brain. Therefore, the HRTF is a function of the source direction and frequency. If the sound source is located at the azimuth φ at elevation θ in a spherical coordinate system centered on the subject, then the left and right HRTFs will be defined as the frequency-dependent ratio of the sound pressure level (SPL) at the corresponding eardrum to the free-field SPL at the center of the head as if the listener were absent [33].
where ω represents the frequency of the sound. According to the above model, the following three parameters are important for the calculation of HRTF:
- Interaural Time Difference (ITD): Time difference for sound to reach each ear.
- Interaural Level Difference (ILD): Sound level difference per ear.
The human ear is very capable of discriminating the direction and distance of sound propagation and localization. The human brain can determine the location of the sound source by comparing the Interaural Time Difference (ITD) and Interaural Level Difference (ILD) [42,43] of the same sound source reaching the two ears, which is on top of the hyperbola with the two ears as the focus (the difference between the distance from the point on the hyperbola to the two foci is a constant value). In the actual calculation, since the sound propagation speed is equal in the same medium, the time difference can be obtained by multiplying it with the speed to obtain the distance difference, as shown in Figure 11:
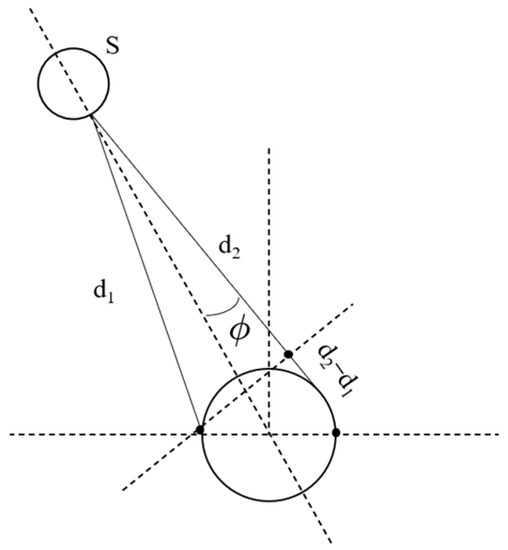
Figure 11.
Schematic representation of the distance difference between the sound reaching the ears.
The distance difference can be expressed as a function of the azimuth ϕϕ:
The ITD can be calculated from the distance difference Δd:
where u is the speed of sound and k refers to the distance between the two ears.
In addition, according to the relationship between phase difference and wave range difference (distance difference).
In the case of virtual reality, distance and loudness differences do not exist because the device’s speakers are confined to the hardware range. The realization of phase and loudness differences between the two ears is difficult to achieve by traditional methods. So, we need to find other ways. The dual vocal tracts of both ears are also sensitive to orientation. According to the above theory, stimulation can also be performed by causing transient phase differences corresponding to different vocal tracts:
In this way, a person can subconsciously perceive the orientation. The device used in this experiment, Hololens 2, has two built-in speakers placed in binaural positions, which enables the construction of instantaneous phase differences based on the above principle. Based on this principle, pre-experiments were designed to demonstrate the directional effect of the differentiated vocal tract stimulation.
The above extra-aural cues can play an important role in the direction of auditory discrimination. However, the wavelength of the sound is comparable to the environment and body size. Therefore, the auricle forms a specially shaped “antenna” that filters out location-dependent and frequency-dependent sounds. That is, the following third parameter exists as a third cue for auditory orientation perception in HRTF.
- 3.
- Spectral Cues of sound interacting with individual anatomy
This intra-aural cue can likewise affect overall sound direction discrimination and effects in a frequency-dependent manner.
Therefore, HRTF integrates extra-aural and intra-aural cues to more accurately describe the effects of human sound discrimination and the effects of sound on human cognition, and the experimental design of the relevant experiments in this paper is based on this principle.
2.2.2. Experimental Method for an Integrated Task of Auxiliary Target Localization Incorporating Auditory Elements
According to the specific design of the three auditory elements of pitch, volume, and vocal tract alternation in the three previous experiments in this paper, pitch was divided into three types: high, medium, and low; volume was divided into three types: high, medium and low; vocal-channel alternation was divided into four types: left short sound, right short sound, left long and short sound, and right long and short sound cues. A piece of audio that incorporates three features to indicate the corresponding location in space was used. The 36 relevant areas in the space at different heights, directions, and distance depths were aided by 36 audio-assisted indication schemes (Figure 12). Thirty-six objects were placed in thirty-six equal areas within the human surroundings. Due to the placement rules planned in the front, there should be a strong occlusion relationship between objects. This should cause a large degree of ambiguity in visual discrimination. While introducing auditory-assisted instructions, the subject’s attention to the corresponding area should be guided by the audio. Judgment efficiency should be promoted. However, its effects are unknown and need to be determined through experiments.
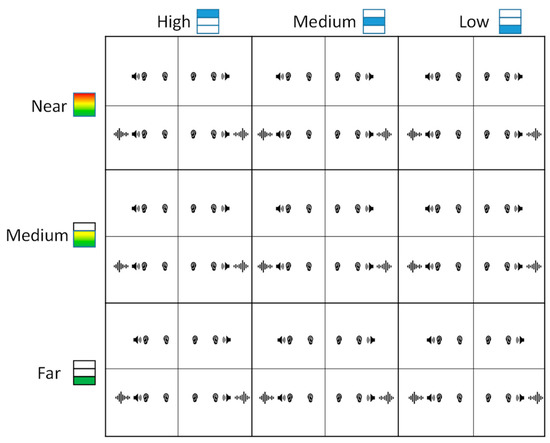
Figure 12.
Auditory-assisted instruction program that incorporates all elements.
3. Data Analysis and Results
3.1. Analysis of Experimental Results on the Correlation between Auditory Elements and Target Characteristics
3.1.1. Analysis of Pitch–Height Results
The results were obtained as time data. The smaller the value, the shorter the time and the better the experiment. First, all the data were analyzed. Adjusted F values were obtained by adopting the Greenhouse–Geisser method using within-subjects one-way ANOVA; F (2.78, 22.27) = 46.17; p = 0.000 < 0.05. It was shown that the nine scenes obtained by the nine subjects were significantly different in time. The overall data are presented below.
It can be seen that different pitches indicate different heights with variability. When the high, medium and low pitch cues were indicating the high, medium, and low regions of the MR visual field airspace, respectively, their time duration was shorter with mean values of 4.79 s, 4.88 s, and 4.80 s. Accordingly, when the pitch did not match the spatial height, its time increased significantly when compared to matching. Take for example the three heights indicated by the high pitch. The time averages of the other two heights increased by 27.48% and 20.80%, respectively, compared to the high region indicated by the high pitch. The increase in time at other pitches was essentially the same as at higher pitches. Therefore, it was most efficient when the corresponding pitch indicated the corresponding height. This indicates that sounds with pitch characteristics will guide the spatial visual perception of humans toward the corresponding height offset. When the corresponding target is right in the visual area reached by the offset, the subject can make a judgment quickly. Thus, the shortest time is obtained, which reflects the induced bias of pitch to the target spatial height perception. In addition, it is clear in Figure 13 that the standard deviation of the interaction time increases substantially when there is a pitch–height mismatch due to the auditory induction of vision. This is due to the fact that subjects have to shift their visual attention and rejudge and the volatility of the interaction is further increased.
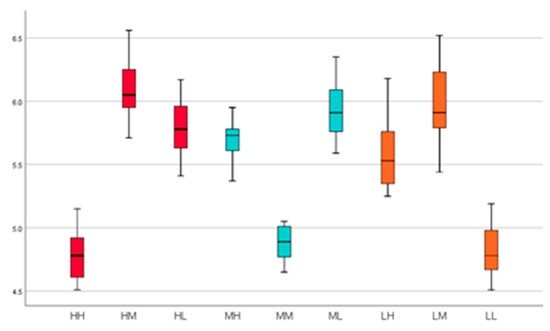
Figure 13.
Wireframe diagram of each group of time data (Red represents the indication of high pitch, cyan represents the indication of medium pitch, and orange represents the indication of low pitch. H, M, and L in the group name refer to high, medium, and low, respectively; those located in front are the pitch, and those behind are the heights).
To further explain the mechanisms of the perception of spatial height with auditory indications, different indicated heights at the same pitch were analyzed. The dependent samples t-test was selected to evaluate the differences in the indicated different heights, where the alpha level for each two-comparison test was 0.016. The results and scatter plots of the time distribution are shown in Table 2 and Figure 14. (in each pairing, H refers to high, M refers to middle, L refers to low, the one in front is the pitch, and the one behind is the height).
Table 2.
Time distribution results table of high pitch–height.
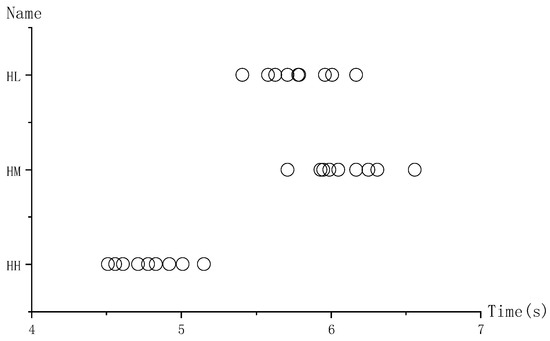
Figure 14.
Scatter plot of the response time for each height of the high-pitched indication.
(1) In the high-pitch indication, the time of the high-pitch indication high region was significantly lower than that of the high-pitch indication middle region and the high-pitch indication low region. In addition, the mean value of time in the high-pitch indication low region was significantly lower than that in the high-pitch indication middle region.
(2) In the low-pitch indication, the time in the low-pitch indication low region was significantly lower than that in the low-pitch indication high region and the low-pitch indication medium region. Accordingly, the mean value of time in the high region of the low-pitch indication was significantly lower than that in the middle region of the low-pitch indication. The statistical data and distribution of time are shown in Table 3 and Figure 15.
Table 3.
Time distribution results table of low pitch–height.
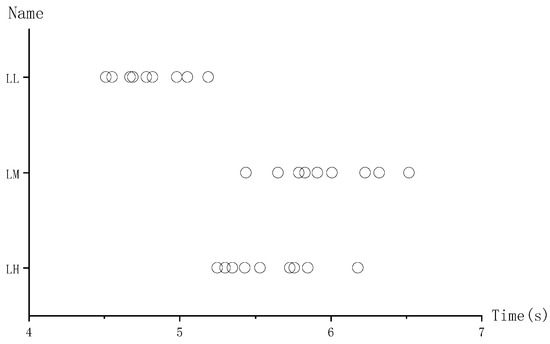
Figure 15.
Scatter plot of the response time for each height of the low-pitched indication.
The results of the above two sets of data show that with the auxiliary indication of high and low pitches, the high pitch indicates the low region more efficiently than the high pitch indicates the middle region. The low-pitch indication of the high region was also more effective than the low-pitch indication of the middle region. This is in line with the law of reverse cognition in the context of search tasks. It indicates that when pitch-guided subjects search the corresponding height and find an error, subjects will generally start searching again from their relative extremes first and then go to the adjacent area. Therefore, the middle region in human perception is the last to search, causing the time to be relatively slowest.
(3) In the mid-pitch indication, the time in the mid-region of the mid-pitch indication was significantly lower than that in the high region of the mid-pitch indication and the low region of the mid-pitch indication. Accordingly, the mean value of time in the mid-pitch-indicated low region was significantly lower than that in the mid-pitch-indicated high region. The statistical data and distribution of time are shown in Table 4 and Figure 16.
Table 4.
Time distribution results table of medium pitch–height.
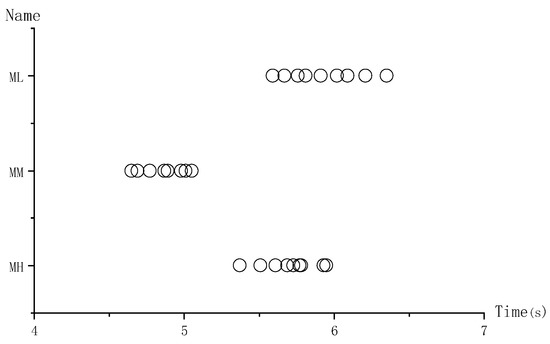
Figure 16.
Scatter plot of the response time for each height of the medium-pitched indication.
The results of the mid-pitch indication showed that the mid-pitch indication of the high region was more efficient than the mid-pitch indication of the low region. This suggests that auditory-assisted visual indications for flight targets have an induced bias toward higher spatial extents. In the context of airspace, subjects will tend to search further toward higher areas provided that the target indicated by the mid-pitch is incorrect.
3.1.2. Analysis of Distance Results of Volume Indication Targets in MR Environment
The preliminary statistical data obtained from the experiment are shown in Table 5:
Table 5.
Time comparison with and without volume indication.
Analysis was conducted using the Greenhouse–Geisser method. The presence or absence of auditory-assisted cues was used as a between-subjects factor, and the indicated distances (near, medium, and far) were used as within-subjects factors. A 2 ∗ 3 within-subjects with interaction ANOVA was conducted for the task interaction time (the results are shown in Table 6). The results showed that the main effect of the presence or absence of auditory-assisted cues was significant, as was the main effect of the indicated distance. Therefore, for the presence or absence of auditory assistance, the completion time with auditory assistance instructions was significantly lower than that without auditory assistance instructions, meaning that the completion effect was optimized.
Table 6.
Results of ANOVA.
In addition, there is a significant crossover effect of auditory-assisted indication × distance (Figure 17 below).
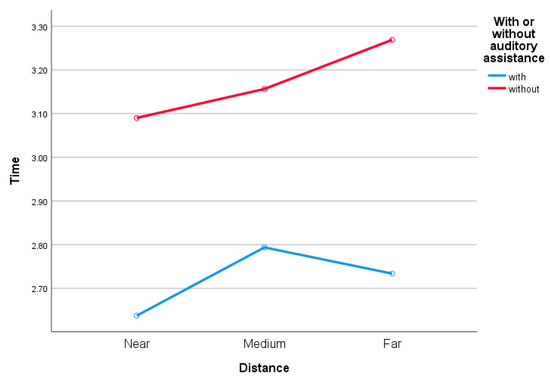
Figure 17.
The plot of the estimated marginal mean with and without auditory assistance (This shows a significant association between the two elements).
After selecting an alpha level of 0.016 for each test, a simple benefits analysis was performed for the presence or absence of the corresponding auditory indication for each factor level case of the indicated distance. The results of the simple effects test and the above mean values indicate that subjects with auditory-assisted instructions had significantly lower task times than subjects without auditory-assisted instructions, regardless of whether the instruction distance was near, medium, or far. The t-values for the three distances were t(14) = −7.84, t(14) = −8.10, and t(14) = −5.17, respectively, and their p-values were below 0.016. It can be ascertained that the volume auditory aid cue has a significant contribution to the distance of the indicated target. The operator’s ability to perceive the distance to the target can be effectively improved. However, after specific analysis, we found that the relative judgment efficiency of each distance changed before and after the addition of auditory-assisted indications. Therefore, it is necessary to analyze whether the time levels of each distance indication were different in different cases.
A significance level of 0.016 was taken and a dependent samples t-test was performed for each case. The results showed that with auditory-assisted indications, the time to indicate targets at close distances was significantly lower than that to indicate targets at medium distances and targets at far distances, whereas the time to indicate targets at medium distances was significantly higher than that to indicate targets at far distances. In the no-auditory indications, the time for indicating the near target and the time of indicating the middle distance target were both significantly lower than that for indicating the far distance target, but there was no significant difference between the two times of indicating the near target and indicating the middle-distance target, Specific analysis values are shown in the following table (see Table 7; the first column shows the presence or absence of an auditory indication, and in the second column, N, M, and F represent near, middle, and far).
Table 7.
Results of dependent samples t-test.
The cognitive mechanisms of volume assistance can be obtained from the above results. Before the addition of sound, the location information was perceived only through vision. Although less efficient than the auxiliary indication, its discriminative efficiency is significantly negatively correlated with distance. As the distance increases, the visual discrimination ability becomes worse and decreases more rapidly as the degree of the increase becomes greater. After adding auditory aid instructions, the sound attenuation changes nonlinearly with distance, and the sensitivity of the human perception of sound decreases after a certain distance. So, the effects of the perception of sound at a medium distance become blurred. Therefore, it is easier to distinguish between near and far distances. In summary, according to the task characteristics and experimental human cognitive properties of sound, the most efficient method is to adopt sound-assisted visual indications of distance and among them, lower volume cues to indicate a more distant target.
3.1.3. Analysis of Orientation Results of Targets in MR Environments with Alternating Acoustic Channel Indication
The raw data in each direction are presented as Figure 18:
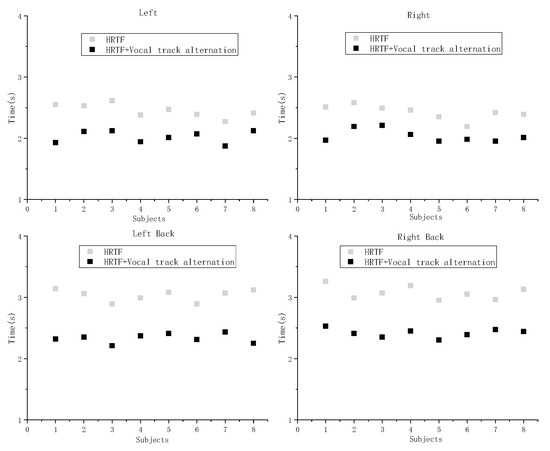
Figure 18.
Scatter plot of time distribution in each direction (top left, top right, bottom left, bottom right are left, right, back-left, and back-right directions, respectively).
According to the above data, due to the excessive differences between the judgment efficiency of the front and back directions before and after optimization, the significance of the response data and the crossover effect will be reduced by including all data uniformly in the analysis of variance, defined as follows. Set the time of the basic HRTF sound experiment designed to . Set the time of the HRTF sound experiment with the addition of the vocal channel alternation scheme designed to . Use the optimization rate of time μ to measure the optimization effect of the auxiliary instructions. The optimization rate μ can be expressed as follows:
The calculated optimization rates obtained are shown in the following Table 8.
Table 8.
Results of optimization rate.
A between-subjects 2 × 2 two-factor ANOVA was performed on the calculated optimization rates. The two independent variables were short-sound stimuli, left-direction and right-direction, and long-sound stimuli, presence and absence. The dependent variable was the optimization rate, which corresponded to each of the four regions in the table above. The results showed that the main effect of long-syllable stimuli was significant (F (1,28) = 23.42, p = 0.000 < 0.05, η2 = 0.455). Among them, subjects with long-syllable stimuli had significantly less time than those without long-syllable stimuli. The main effect of short-syllable stimuli was not significant, and the difference in the response time between the left and right short-syllable stimuli was not significant. In addition, the interaction between the long-syllable and short-syllable cues was not significant (F (1,28) = 0.000, p = 0.985 > 0.05, η2 = 0.000). That is, there was no necessary link between the two in affecting the final subject’s time except for their separate effects, as seen in Figure 19.
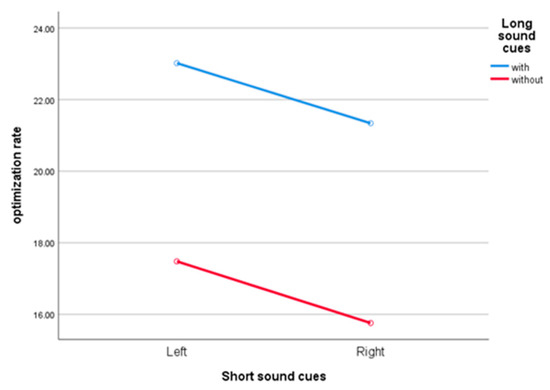
Figure 19.
Estimated marginal mean plot of the optimization rate (this shows no significant association between the two elements).
Thus, with the inclusion of the long sound cue, the efficiency of the subjects in conducting the search of the two back orientations using short-time working memory was substantially increased, the time gap between the previous two directions was narrowed, and the efficiency of the directional search was improved across the board. Brain load was also reduced, and task performance was greatly enhanced. In addition, there is no difference in the effects of performing left and right discriminations in either the front two directions or the back two directions. The attention of the subjects was prompted to the relevant direction by the stimuli of different vocal tracks. The effect of cueing using this cognitive property was also superior.
The above ANOVA argued for the significant optimality of the presence or absence of long syllable cues, and the argument for the optimality effect of short syllables was still missing. The main effect of the short syllable cue was not obvious, and there was no significant distinction between the left and right stimuli. Therefore, the data from the left and right channels were combined for the raw data analysis before and after optimization. The t-test showed that t(15) = 15.993, p = 0.000 < 0.05, and there was a significant decrease in subjects’ times after performing the short syllable cue optimization. The efficiency of the subjects in searching for each target direction was enhanced by the orientation indication of the alternate visual aids of the vocal tract.
3.2. Analysis of Experimental Results of an Integrated Task of Auxiliary Target Localization Incorporating Auditory Elements
Due to the excessive time differences between the front and back directions before optimization, the time results of the final experiment were presented by placing the results of the front two directions in the 1, 2, and 3 datasets. The results of the back two directions were placed in the 4, 5, and 6 datasets. The sample curve is shown in Figure 20.
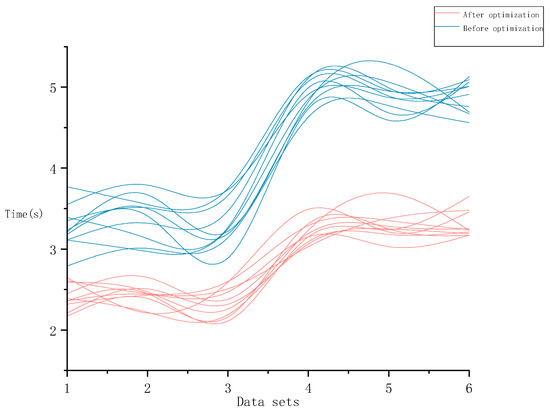
Figure 20.
Smoothed response time curves for each dataset.
An independent samples t-test analysis was performed for the final time. In addition, the time gap between the front and back two directions in the third correlation experiment in the earlier period was too large. Therefore, the two components of the randomized experimental time results need to be distinguished for ANOVA.
The results for the first two directions with and without auditory indication are as follows. With the combined auditory indication (M = 2.40, SD = 0.16), the time was significantly lower than without the auditory indication (M = 3.34, SD = 0.27), t(58) = −14.464, p < 0.05, d = 3.73. The results for the latter two directions in the presence and absence of auditory instructions are as follows. With the combined auditory instructions (M = 3.26, SD = 0.16), the time was significantly lower than in the absence of auditory instructions (M = 4.90, SD = 0.18), t(58) = −36.624, p < 0.05, d = 9.46. The latter two directions were more significant in terms of difference and represented a greater degree of optimization. As a task type with high accuracy and timeliness requirements, the search task needs to maintain a high correctness rate. This is also a real need for airspace safety and stability. So, it is not only necessary to consider the time effect alone, but also to consider the correctness together with the time. In the field of a comprehensive evaluation that includes response time and accuracy, a method combining the two factors has also been proposed by many experts and scholars. The effect is good, but there is a lack of integration of the two, covering only correct “reward” and incorrect “punishment”. Therefore, a combination of scoring methods that combines correct performance and response time needs to be considered. Maris Gunter [44] gives the following evaluation method in Equation (12):
where is the judgment performance (the value is 1 when the judgment is correct, 0 when it is incorrect), is the coefficient of the increase of the fraction when the reaction is correct, is the reduction factor of the fraction in the case of an incorrect reaction, and is the time limit. This value is generally the maximum time to complete the task and is the time to respond. In this experiment, the time difference between the front and rear directions before optimization was too large. Therefore, the analysis from two different time constraints contributed to the final score statistics. Take the maximum time of 4 s and 6 s not exceeded in both directions before optimization as the time limit of the two phases. The evaluation method of Maris Gunter was optimized in Equation (13) and is applicable to this experiment.
where the values of and , as the core part of the overall scoring method, need to be set by expert opinion in the field. Here, we analyze the importance of the four experts related to the time and correctness of completing the task by adopting the AHP method [45]. The average of the four judgment matrices was used to obtain the experts’ judgment matrix of the relevant importance:
Its eigenvector was derived (Equation (15)) and regularized (Equation (16)):
Its feature vector (weight distribution) was obtained as
The consistency judgment was calculated using the maximum characteristic root and consistency index.
Obtain
Therefore, the final time to correct the correlation correctness ratio was 0.177:0.823. It can be understood that in the context of search tasks, correctness was the primary requirement. So, obtaining an incorrect response conclusion quickly required a higher penalty. Therefore, the ratio of and as the evaluation indicators was also set to 0.177:0.823 based on the above criteria. To facilitate the calculation, the value of in the formula was set to 1, so was 4.65. The formula was adjusted to
The final correct rate and reaction time were brought into the above equation to obtain a combined performance score of 70.80 after auditory optimization and 8.87 before optimization. The combined correctness, response time, and score of the combined experiment are displayed in order in Figure 21.
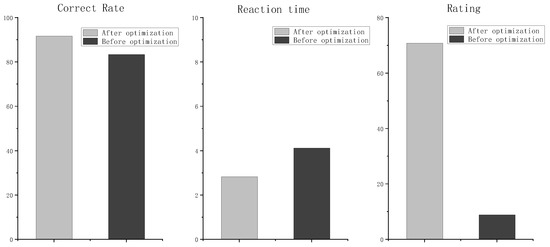
Figure 21.
Combined comparison chart of the correct rate, response time, and score with and without auditory.
The final results clearly showed that when considering the combined effect of the correct rate and response time, auditory instructions with three characteristics of pitch, volume, and vocal channel alternation have a significant optimization effect when compared with visuals alone in a target space location search.
4. Discussion and Analysis
This paper focuses on the connection between auditory pitch, volume, and vocal tract alternation schemes and the height, distance, and direction of space in the MR display environment in the context of air and space situations. Furthermore, the induced mechanisms and cognitive properties of auditory-assisted visual–spatial search localization are explored. The results of the three experiments concluded that several elements of auditory-aided indication have a strong correlation with the target characteristics. And the variability among the datasets for different pitch–height, volume–distance, and vocal channel alternation–azimuth is obvious. This indicates that their indication relationships are non-interfering and clearly distinguishable from each other, with sufficient cognitive discrimination.
In Experiment 1, we set audio cues with different pitches to assist subjects’ spatial-visual height judgments in an MR. The relationship between the spatial area indicated by the auditory aid and the human visual cognitive area was determined by comparing the reaction times. After data analysis, we found that the association between pitch and target height was significant: The three mapping relations, high pitch–high region, medium pitch–medium region, and low pitch–low region, had the shortest response times and little time difference for the three different pitch indications. This suggests that subjects’ visual cognition is guided to high, medium, and low regions by high, medium, and low pitches accordingly. In addition, in the case of a pitch and height association mismatch, the search process satisfies the human reverse cognitive laws and the cognitive properties of the airborne target.
In Experiment 2, the discrimination of subjects’ spatial–visual distance in an MR was assisted by setting up audio with different volume levels. We analyzed whether the volume was optimized for human visual distance perception by comparing two distance discrimination scenarios with and without auditory-assisted indication audios with different volumes and whether their cognitive mechanisms had changed. When no volume assist cue was present, the efficiency of discriminating between distant, medium, and near targets increased from low to high. When there was a volume-assisted indication, the efficiency of discriminating between far and near targets was similar and both were lower than the intermediate distance targets. However, regardless of the efficiency, the results were better than when there was no volume assistance. This illustrates the strong correlation between volume and distance in the MR environment and the better effects of volume-assisted distance optimization.
In Experiment 3, different vocal tract alternation schemes were set up to assist subjects in discriminating spatial–visual directions in an MR. By combining intuitive interaction theory and coding theory, a vocal track alternation scheme was designed for the sound indication directions. The left and right short audios were used to indicate the left and right directions, and the left “long sound and short sound” and right “long sound and short sound” audios were used to indicate the left-back and right-back directions. Through an experimental verification, a better optimization effect was obtained in each direction when the vocal track alternation scheme assisted the interactions. In addition, the degree of optimization was greater for the left-back and right-back directions, which further reduced the judgment time difference between each direction. This proves that the approach can improve subjects’ ability to discriminate directions in the MR environment in all aspects.
In a comprehensive experiment, each of these three auditory properties was combined in a piece of audio that indicated a specific location in space. The overall visual space was divided into 36 areas by combining height, distance, and direction similar to the differentiation in the previous article. Correspondingly, there were 36 audios with different audio, volume, and channel alternation methods to determine the effectiveness of auditory-assisted instructions for the visual judgment of position in MR environments by studying the correlation between them. It was assessed by introducing an evaluation method and concluded that it was better optimized.
5. Conclusions
In this paper, three sets of correlation experiments and one set of integrated experiments were completed based on the current need for the rapid and precise localization of specific flying objects in a group of air and space targets. The correlations of pitch–height, volume–distance, and vocal track alternation–spatial orientation in an MR environment were explored separately in the experiments. The following conclusions were obtained.
- (1)
- There is a correspondence between the pitch (sound frequency) and the spatial height perceived by humans. In addition, in an MR environment, human visual cognition is biased to the high, medium, and low regions of visual space by high, medium, and low pitch guidance. The search localization is most efficient when the pitch matches the spatial height.
- (2)
- Volume can have different effects on human perception of spatial distance location, and in an MR environment, human visual perception is induced by large, medium, and small volumes to bias the near, medium, and far areas of visual space, respectively. The search localization is most efficient when the volume is matched to the spatial distance. However, when there is an auditory volume indication, the ambiguity of the intermediate volume causes a relative optimization effect when indicating the intermediate distance to be inferior to that of the near and far distances.
- (3)
- In the context of HRTF use, human visual perception is induced to bias to the visual left, right, left-back, and right-back directions by short left, short right, short left and long, and short right and long audios, respectively. The search localization is most efficient when the corresponding vocal track scheme matches the spatial orientation. In addition, the optimization of the latter two directions with the presence of the encoding optimization is greatly improved.
- (4)
- The human cognitive load is significantly reduced by the integration of auditory factors to assist the search, and the efficiency and effectiveness of the accurate search and localization of space objects are greatly improved.
The above findings provide a better optimization idea for visual-auditory interactions under the search and localization task. They provide a new way for the subsequent MR holographic environment of air–sky posture for multi-species target search and localization. They also provide a theoretical basis for subsequent studies on spatial information perception and cognitive induction mechanisms.
Author Contributions
Conceptualization, W.W. and N.X.; data curation, N.X.; formal analysis, S.D. and X.H.; funding acquisition, W.W. and J.Q.; investigation, N.X., S.D. and X.H.; methodology, W.W. and N.X.; project administration, W.W. and J.Q.; resources, W.W., N.X., S.D., X.H. and J.Q.; supervision, W.W. and S.D.; validation, W.W., N.X., X.H. and J.Q.; visualization, N.X., S.D. and X.H.; writing—original draft, N.X.; writing—review and editing, W.W., N.X. and S.D. All authors have read and agreed to the published version of the manuscript.
Funding
The research was supported by the National Natural Science Foundation of China (grant number 52,175,282).
Institutional Review Board Statement
The ethical review and approval of this study was waived for a reason (the equipment used in the experiment has no adverse effects and does not cause harm when in contact with humans).
Informed Consent Statement
Informed consent was obtained from all subjects involved in the study.
Data Availability Statement
The data presented in this study are available on request from the corresponding author. The data are not publicly available due to some data involving detailed equipment parameters, which cannot be disclosed.
Conflicts of Interest
The authors declare no conflict of interest.
References
- Guo, L.; Li, H.; Chen, F.; Hu, Y. The Real-Time Detection and Prediction Method for Ballistic Aircraft Based on Distributed Sensor Networks. Wirel. Pers. Commun. 2017, 95, 2049–2072. [Google Scholar] [CrossRef]
- Berggren, N.; Eimer, M. Visual working memory load disrupts the space-based attentional guidance of target selection. Brit. J. Psychol. 2019, 110, 357–371. [Google Scholar] [CrossRef] [PubMed]
- Clarkson, J.; Glazebrook, K.; Lin, K. Fast or Slow: Search in Discrete Locations with Two Search Modes. Oper. Res. 2020, 68, 552–571. [Google Scholar]
- Qu, J.; Guo, H.; Wang, W.; Dang, S. Prediction of Human-Computer Interaction Intention Based on Eye Movement and Electroencephalograph Characteristics. Front. Psychol. 2022, 13, 816127. [Google Scholar] [CrossRef] [PubMed]
- Wainman, B.; Pukas, G.; Wolak, L.; Mohanraj, S.; Lamb, J.; Norman, G. The Critical Role of Stereopsis in Virtual and Mixed Reality Learning Environments. Anat. Sci. Educ. 2020, 13, 398–405. [Google Scholar] [CrossRef]
- Ahn, S.; Kim, S.; Lee, S. Effects of Visual Cues on Distance Perception in Virtual Environments Based on Object Identification and Visually Guided Action. Int. J. Hum.-Comput. Interact. 2021, 37, 36–46. [Google Scholar] [CrossRef]
- Itoh, Y.; Langlotz, T.; Sutton, J.; Plopski, A. Towards Indistinguishable Augmented Reality: A Survey on Optical See-through Head-mounted Displays. ACM Comput. Surv. 2021, 54, 1–36. [Google Scholar] [CrossRef]
- Papadopoulos, T.; Evangelidis, K.; Kaskalis, T.H.; Evangelidis, G.; Sylaiou, S. Interactions in Augmented and Mixed Reality: An Overview. Appl. Sci. 2021, 11, 8752. [Google Scholar] [CrossRef]
- Cometti, C.; Paizis, C.; Casteleira, A.; Pons, G.; Babault, N. Effects of mixed reality head-mounted glasses during 90 minutes of mental and manual tasks on cognitive and physiological functions. PeerJ 2018, 6, e5847. [Google Scholar] [CrossRef]
- Penczek, J.; Boynton, P.A.; Beams, R.; Sriram, R.D. Measurement Challenges for Medical Image Display Devices. J. Digit. Imaging 2021, 34, 458–472. [Google Scholar] [CrossRef]
- Lee, M.; Billinghurst, M.; Baek, W.; Green, R.; Woo, W. A usability study of multimodal input in an augmented reality environment. Virtual Real. 2013, 17, 293–305. [Google Scholar] [CrossRef]
- Wahn, B.; Schwandt, J.; Kruger, M.; Crafa, D.; Nunnendorf, V.; Konig, P. Multisensory teamwork: Using a tactile or an auditory display to exchange gaze information improves performance in joint visual search. Ergonomics 2016, 59, 781–795. [Google Scholar] [CrossRef] [PubMed]
- Wang, P.; Zhang, S.S.; Bai, X.L.; Billinghurst, M.; Zhang, L.; Wang, S.; Han, D.; Lv, H.; Yan, Y. A gesture- and head-based multimodal interaction platform for MR remote collaboration. Int. J. Adv. Manuf. Technol. 2019, 105, 3031–3043. [Google Scholar] [CrossRef]
- Yang, J.; Sasikumar, P.; Billinghurst, M. The effects of spatial auditory and visual cues on mixed reality remote collaboration. J. Multimodal User Interfaces 2020, 14, 337–352. [Google Scholar] [CrossRef]
- Huang, G.-J.; Bai, C.Y.; Qian, W. Simultaneous inversion of three model parameters with multiple phases of arrival times in spherical coordinates. Chin. J. Geophys.-Chin. Ed. 2015, 58, 3627–3638. [Google Scholar]
- Parise, C.V.; Knorre, K.; Ernst, M.O. Natural auditory scene statistics shapes human spatial hearing. Proc. Natl. Acad. Sci. USA 2014, 111, 6104–6108. [Google Scholar] [CrossRef]
- McCormick, K.; Lacey, S.; Stilla, R.; Nygaard, L.C.; Sathian, K. Neural basis of the crossmodal correspondence between auditory pitch an visuospatial elevation. Neuropsychologia 2018, 112, 19–30. [Google Scholar] [CrossRef]
- Pitteri, M.; Marchetti, M.; Grassi, M.; Priftis, K. Pitch height and brightness both contribute to elicit the SMARC effect: A replication study with expert musicians. Psychol. Res. 2021, 85, 2213–2222. [Google Scholar] [CrossRef]
- Holler, J.; Drijvers, L.; Rafiee, A.; Majid, A. Embodied Space-pitch Associations are Shaped by Language. Cogn. Sci. 2022, 46, e13083. [Google Scholar] [CrossRef]
- Dolscheid, S.; Celik, S.; Erkan, H.; Kuntay, A.; Majid, A. Space-pitch associations differ in their susceptibility to language. Cognition 2020, 196, 104073. [Google Scholar] [CrossRef]
- Bidelman, G.M. Sensitivity of the cortical pitch onset response to height, time-variance, and directionality of dynamic pitch. Neurosci. Lett. 2015, 603, 89–93. [Google Scholar] [CrossRef] [PubMed]
- King, C.; Prime, S.L. Auditory pitch glides influence time-to-contact judgements of visual stimuli. Exp. Brain Res. 2019, 237, 1907–1917. [Google Scholar] [CrossRef] [PubMed]
- Michael, D.D.; Siegel, G.M.; Pick, H.L. Effects of distance on vocal intensity. J. Speech Hear. Res. 1995, 38, 1176–1183. [Google Scholar] [CrossRef]
- Luizard, P.; Polack, J.D.; Katz, B.F.G. Sound energy decay in coupled spaces using a parametric analytical solution of a diffusion equation. J. Acoust. Soc. Am. 2014, 135, 2765–2776. [Google Scholar] [CrossRef] [PubMed]
- Kolarik, A.J.; Moore, B.C.J.; Cirstea, S.; Raman, R.; Gopalakrishnan, S.; Pardhan, S. Partial visual loss disrupts the relationship between judged room size and sound source distance. Exp. Brain Res. 2022, 240, 81–96. [Google Scholar] [CrossRef]
- Hong, S.A.; Kuziez, D.; Das, N.; Harris, D.; Brunworth, J.D. Hazardous sound outputs of white noise devices intended for infants. Int. J. Pediatr. Otorhinolaryngol. 2021, 146, 110757. [Google Scholar] [CrossRef] [PubMed]
- Hsieh, M.-C.; Chen, H.J.; Tong, M.L.; Yan, C.W. Effect of Environmental Noise, Distance and Warning Sound on Pedestrians’ Auditory Detectability of Electric Vehicles. Int. J. Environ. Res. Public Health 2021, 18, 9290. [Google Scholar] [CrossRef]
- Jo, H.; Jo, D. Experimental studies of condensing vapor bubbles in subcooled pool water using visual and acoustic analysis methods. Ann. Nucl. Energy 2017, 110, 171–185. [Google Scholar] [CrossRef]
- Jiang, L.; Kang, J. Effect of traffic noise on perceived visual impact of motorway traffic. Landsc. Urban Plan. 2016, 150, 50–59. [Google Scholar] [CrossRef]
- Hayber, S.E.; Keser, S. 3D sound source localization with fiber optic sensor array based on genetic algorithm. Opt. Fiber Technol. 2020, 57, 102229. [Google Scholar] [CrossRef]
- Yang, H.-S.; Kang, J.; Kim, M.J. An experimental study on the acoustic characteristics of outdoor spaces surrounded by multi-residential buildings. Appl. Acoust. 2017, 127, 147–159. [Google Scholar] [CrossRef]
- Martin, V.; Viaud-Delmon, I.; Warusfel, O. Effect of Environment-Related Cues on Auditory Distance Perception in the Context of Audio-Only Augmented Reality. Appl. Sci. 2022, 12, 348. [Google Scholar] [CrossRef]
- Zotkin, D.N.; Duraiswami, R.; Davis, L.S. Rendering localized spatial audio in a virtual auditory space. IEEE Trans. Multimed. 2004, 6, 553–564. [Google Scholar] [CrossRef]
- Algazi, V.R.; Duda, R.O.; Thompson, D.M.; Avendano, C. The CIPICHRTF database. In Proceedings of the IEEE Workshop on the Applications of Signal Processing to Audio and Acoustics, New Paltz, NY, USA, 24 October 2001. [Google Scholar]
- Houtenbos, M.; de Winter, J.C.F.; Hale, A.R.; Wieringa, P.A.; Hagenzieker, M.P. Concurrent audio-visual feedback for supporting drivers at intersections: A study using two linked driving simulators. Appl. Ergon. 2017, 60, 30–42. [Google Scholar] [CrossRef] [PubMed]
- Qureshi, T.M.; Ishaq, M. Real-Time Vocal Tract Model for Elongation of Segment Lengths in a Waveguide Model. Arch. Acoust. 2019, 44, 287–300. [Google Scholar]
- Nieto-Castanon, A.; Guenther, F.H.; Perkell, J.S.; Curtin, H.D. A modeling investigation of articulatory variability and acoustic stability during American English/r/production. J. Acoust. Soc. Am. 2005, 117, 3196–3212. [Google Scholar] [CrossRef]
- Ramkhalawansingh, R.; Keshavarz, B.; Haycock, B.; Shahab, S.; Campos, J.L. Age Differences in Visual-Auditory Self-Motion Perception during a Simulated Driving Task. Front. Psychol. 2016, 7, 595. [Google Scholar] [CrossRef]
- Yu, Z.; Li, L.L.; Song, J.C.; Lv, H.Y. The Study of Visual-Auditory Interactions on Lower Limb Motor Imagery. Front. Neurosci. 2018, 12, 509. [Google Scholar] [CrossRef]
- Brungart, D.S.; Kruger, S.E.; Kwiatkowski, T.; Heil, T.; Cohen, J. The Effect of Walking on Auditory Localization, Visual Discrimination, and Aurally Aided Visual Search. Hum. Factors 2019, 61, 976–991. [Google Scholar] [CrossRef]
- Zhen, K.; Lee, M.S.; Sung, J.; Beack, S.; Kim, M. Psychoacoustic Calibration of Loss Functions for Efficient End-to-End Neural Audio Coding. IEEE Signal Process. Lett. 2020, 27, 2159–2163. [Google Scholar] [CrossRef]
- Takahashi, T.T. The neural coding of auditory space. J. Exp. Biol. 1989, 146, 307–322. [Google Scholar] [CrossRef] [PubMed]
- Yamada, K.; Kaga, K.; Uno, A.; Shindo, M. Comparison of interaural time and intensity difference discrimination in patients with temporal lobe lesions. Acta oto-laryngologica. Supplementum 1997, 532, 135–137. [Google Scholar]
- Maris, G.; van der Maas, H. Speed-Accuracy Response Models: Scoring Rules based on Response Time and Accuracy. Psychometrika 2012, 77, 615–633. [Google Scholar] [CrossRef]
- Shuai, Z.; Qu, J.; Wang, W.; Hu, B. Human-machine interface evaluation model for CNC machine tools based on improved FAHP-TOPSIS. Mech. Des. Res. 2019, 35, 144–148, 156. [Google Scholar]


Publisher’s Note: MDPI stays neutral with regard to jurisdictional claims in published maps and institutional affiliations. |
© 2022 by the authors. Licensee MDPI, Basel, Switzerland. This article is an open access article distributed under the terms and conditions of the Creative Commons Attribution (CC BY) license (https://creativecommons.org/licenses/by/4.0/).