1. Introduction
Remote sensing satellites acquire information about land, ocean, meteorology, etc., by using various payloads [
1,
2]. They can perform global earth observations without regional restrictions, and thus play an important role in the remote sensing field [
3]. Due to the recent advancement in satellite development, the number of remote sensing satellites has drastically risen, growing from less than 400 satellites in 2012 to more than 1000 satellites in 2022 [
4,
5]. Remote sensing satellites distributed in different orbital positions usually use attitude maneuvers to provide high-frequency and high-resolution observation services, including point target, area target, and moving target observation tasks. However, owing to the complexity of satellites’ composition and structure, as well as the varying task environments, the full utilization of valuable satellite resources is challenging [
6]. Hence, it is necessary to comprehensively evaluate the observation effectiveness of remote sensing satellites, so as to ensure the optimality of the decision-making process such as tasks allocation and attitude maneuver [
7,
8].
The study of effectiveness evaluation is mainly divided into two parts: the construction of the index system and the research of evaluation methodologies [
9]. The index system is a whole composed of several related indices, which can completely reflect the characteristics of the evaluation object from all aspects [
10]. As the main content of the evaluation study, the reasonability of the index system will have a direct impact on the effectiveness of the evaluation [
11]. Additionally, the complex diversity of satellite systems and tasks introduces more challenges to the applicability of the index system. Therefore, it is crucial to determine whether the index system can comprehensively and effectively reflect the system’s ability to accomplish various tasks [
12].
The construction of an index system typically contains the following basic principles [
13,
14]: (1) completeness: the index system should cover all the attributes of the evaluation object as much as possible. (2) Hierarchy: the index system should have a clear hierarchy structure where the relationships between indices in each layer are definite. (3) Measurability: each index can be quantitatively calculated to obtain a numerical value that intuitively reflects the system’s capability. (4) Independence: each index should be as uncorrelated as possible to avoid redundant information. (5) Simplicity: the index system should not include too many indices. It should only use the least number of indices to cover the most attributes. In respect of the completeness problem, an index system with insufficient completeness will lead to one-sided cognition, causing defects in design, manufacture, and application [
14]. Furthermore, in terms of independence and simplicity, several redundant or relational indices might exacerbate the difficulties in determining the weight value [
15,
16,
17,
18]. Therefore, the screening of indices is a necessary part of the index system construction process [
19].
Current research in the construction of index systems is categorized into qualitative and quantitative methods. The qualitative methods mainly include the expert experience (Delphi) method and the analytic hierarchy process (AHP) method. Regarding the Delphi method, the index systems are usually obtained by experts solely based on their experience and analysis of the research object. The index systems can well reflect all aspects of the system capabilities but inevitably include redundant indices. Zheng et al. [
10] established an evaluation system including revisit capability, observation interval, observation frequency, observation duration, and other indices from the perspective of three target types: point target, area target, and moving target. Barsi et al. [
20] established a remote sensing data quality index system including resolution, accuracy, completeness, redundancy, readability, and accessibility. Liu et al. [
21] developed an index system with a total of eighteen indices in four categories including coverage efficiency, mission planning efficiency, communication efficiency, and resource scheduling efficiency. To evaluate the feasibility and effectiveness of nanosatellites in military operations, Tang et al. [
22] developed an index system with fifteen indices divided into four categories, including space segment capability, ground segment capability, survivability, and command and control capability. Elhady, A.M. [
23] constructed an index system that includes instantaneous availability, mission availability, steady state of availability, achieved availability, and intrinsic availability. Additionally, Li et al. [
24] established an index system consisting of six indices of temporal resolution and spatial resolution for the evaluation of remote sensing satellite coverage effectiveness. Regarding the satellite observation and data-downlink scheduling problem, Zhang et al. [
8] suggested an Availability–Capacity–Profitability (ACP) evaluation framework. Regarding the AHP method, the index systems are usually scored by experts for index screening. Although this method can effectively reduce the number of indices, the evaluation of the loss of completeness and independence is arduous. Li et al. [
25] established an index system for the coordination degree of meteorological satellite stakeholder relationship network and used the AHP method to determine the index weights and screen these indices.
Regarding the quantitative research aspect, the index system is generally obtained through numerical statistical analysis and index screening. The quantitative methods mainly include correlation analysis, information entropy theory, and principal component analysis (PCA) method. Correlation analysis is an effective method to determine the index redundancy relationship and reduce the number of factors. Li et al. [
26] established an index system for the observation effectiveness of satellites on moving targets with the use of correlation analysis to reduce redundant indices. Aiming at the evaluation problem of the space information network demonstration platform, Liu et al. [
14] carried out an index screening method by calculating the correlation coefficient and comprehensive weight to ensure the independence of the index system. Generally, correlation analysis can assure the independence and simplicity of the index system but cannot evaluate the loss of completeness. Regarding the PCA method, it is a common approach to address the simplicity and independence problem. However, the resulting orthogonal principal components lack clear physical meaning, thus, fail to meet the intuition requirements of the measurability principle. To address the redundancy problem of the primary index set in the armored vehicle (prognostics and health management) PHM system performance index system, Zhai et al. [
19] used the PCA method to select the indices. Finally, the index screening method based on information entropy theory usually selects the index according to the amount of information. A representative method is the entropy weight method (EWM). Huang et al. [
27] combined the AHP and EWM methods to screen out components that are closely associated with the efficacy of drugs. Based on the information entropy theory, Wang et al. [
10] defined the direction loss rate to measure the evaluation ability loss of the index screening results. Normally, the EWM method can evaluate and ensure the completeness of the index system.
Most of the studies mentioned above fail to consider all principles concurrently. In particular, the principles of completeness, independence, and simplicity of the index system contradict themselves and are thereby unable to be considered simultaneously. Hence, it is practically challenging to use the least possible number of independent indices to reflect the system’s capability in every aspect.
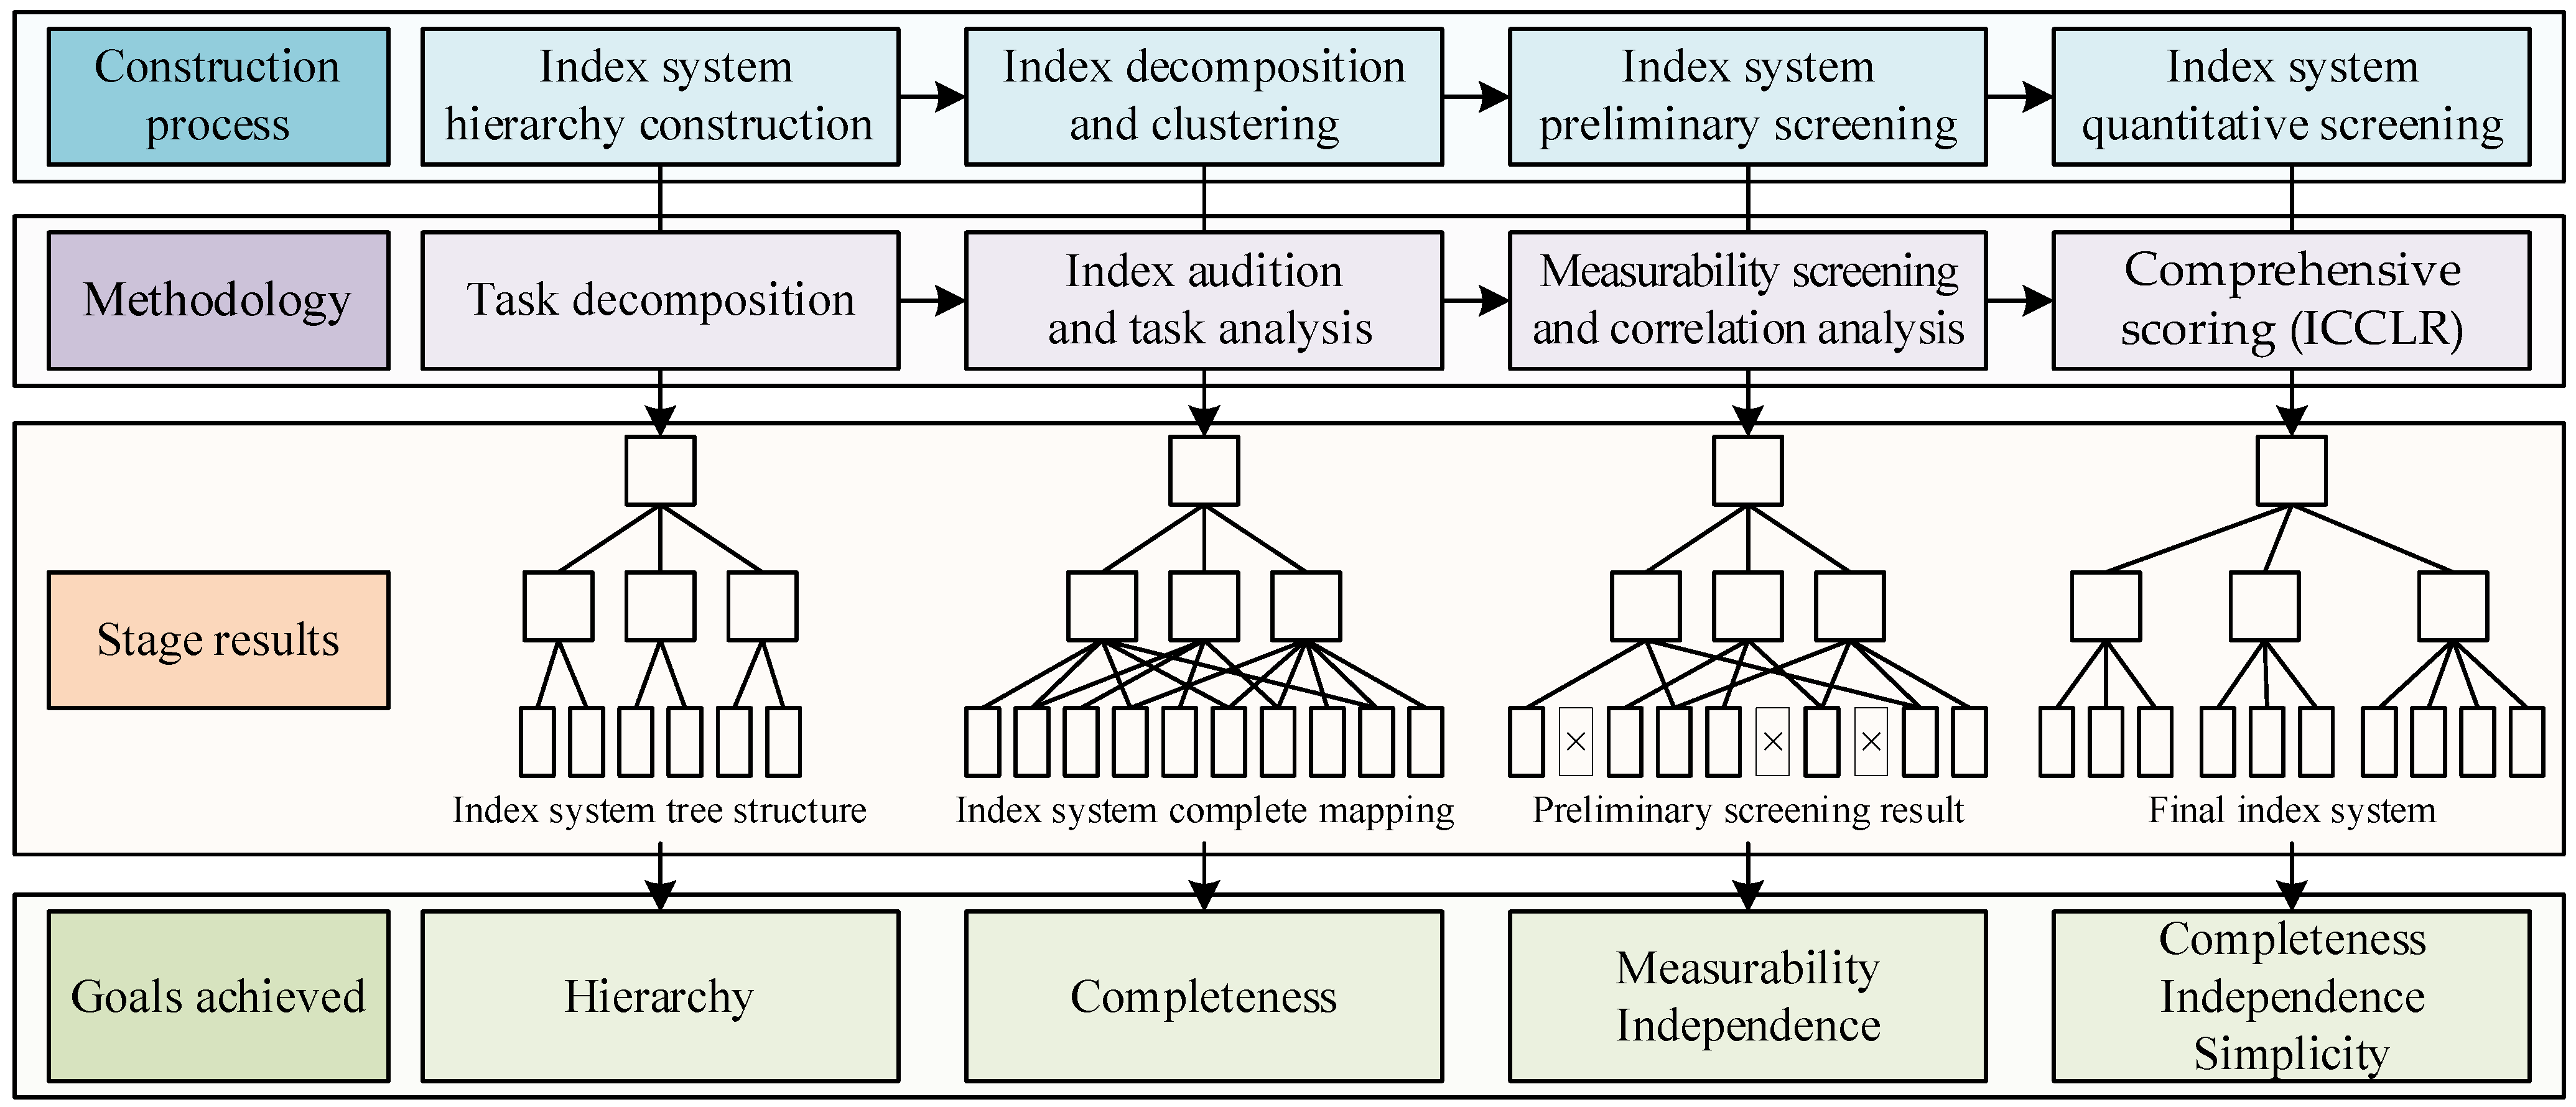
In this paper, in an attempt to address the effectiveness evaluation problem of remote sensing satellites, an index system construction method is proposed. This method fully considers the five principles: completeness, hierarchy, measurability, independence, and simplicity. Firstly, according to the requirement analysis of remote sensing satellites, a three-layer structure is suggested. This structure comprises a system layer, a task layer, and an index layer. Secondly, an initial index system set that is complete, hierarchical, and measurable is constructed through index decomposition, clustering, and preliminary screening. Finally, index sets in every task layer are screened quantitatively. Based on PCA, the ICCLR approach that extracts the index system is then proposed by introducing the calculation methods of independence coefficients and the comprehensive loss rate of the contribution rate. From index sets that are redundant and correlated, this approach retrieves index systems that fulfill the principle of completeness, independence, and simplicity. Through the simulation experiments and quantitative analysis of three typical mission scenes of remote sensing satellites, a complete evaluation index system is constructed. By comparing our proposed method with the conventional research, the effectiveness of the proposed method is verified.
The remaining parts of this paper are organized as follows. In
Section 2, the method for remote sensing satellite observation effectiveness evaluation is described.
Section 3 begins with the formation of three simulation scenes, followed by the index screening method using quantitative computation to generate an index system that considers all of the principles aforementioned. In
Section 4, a discussion of the experimental results is provided. Lastly,
Section 5 concludes this paper.
2. Materials and Methods
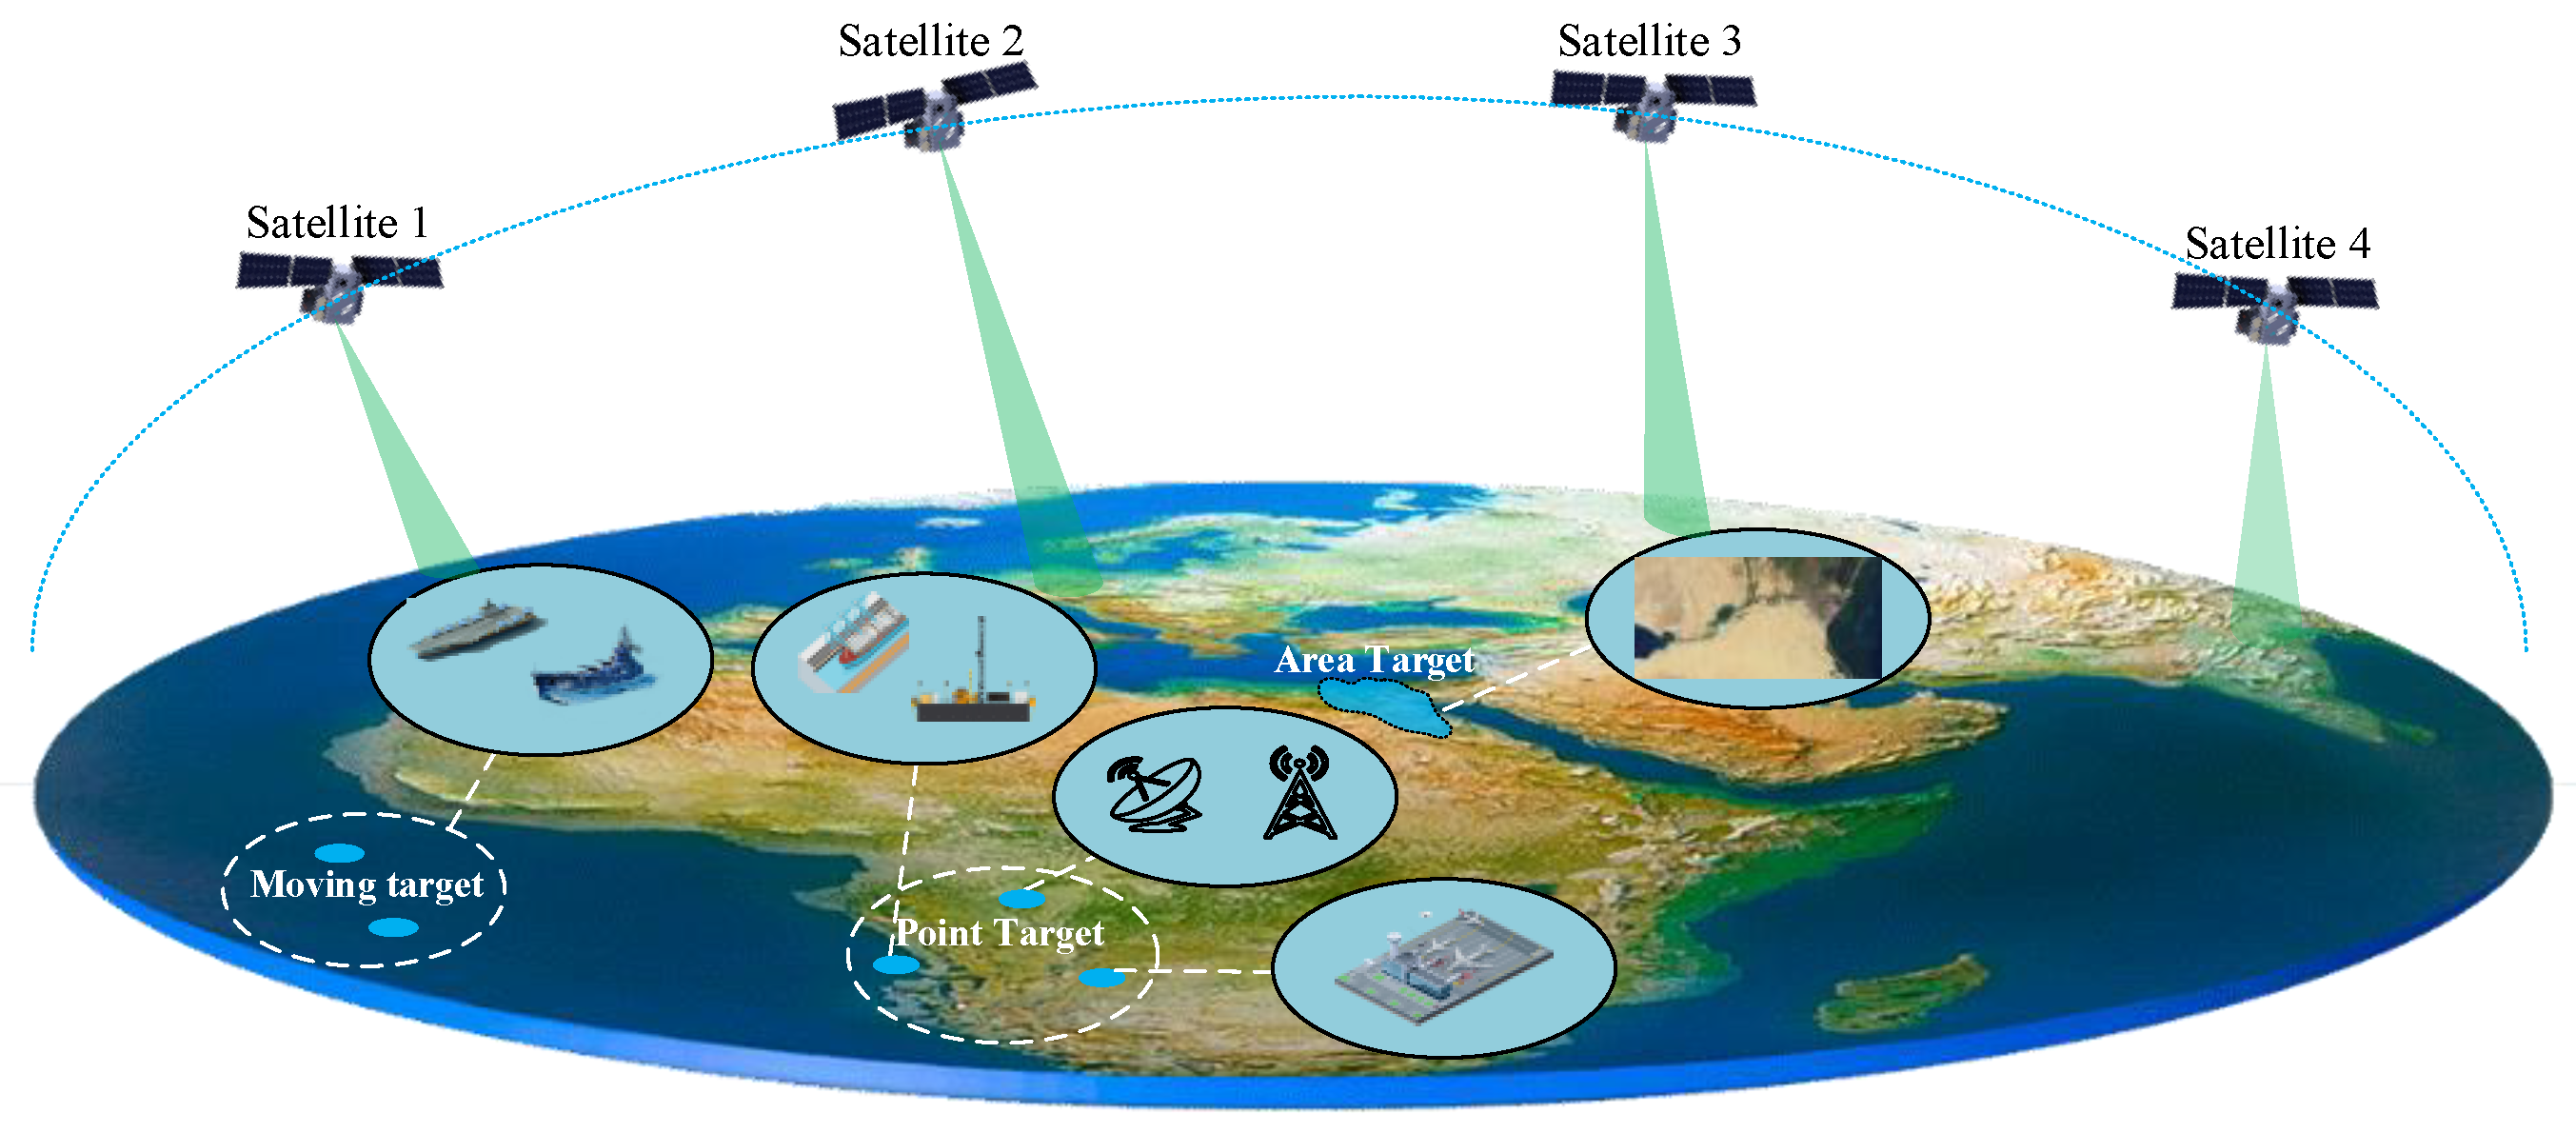
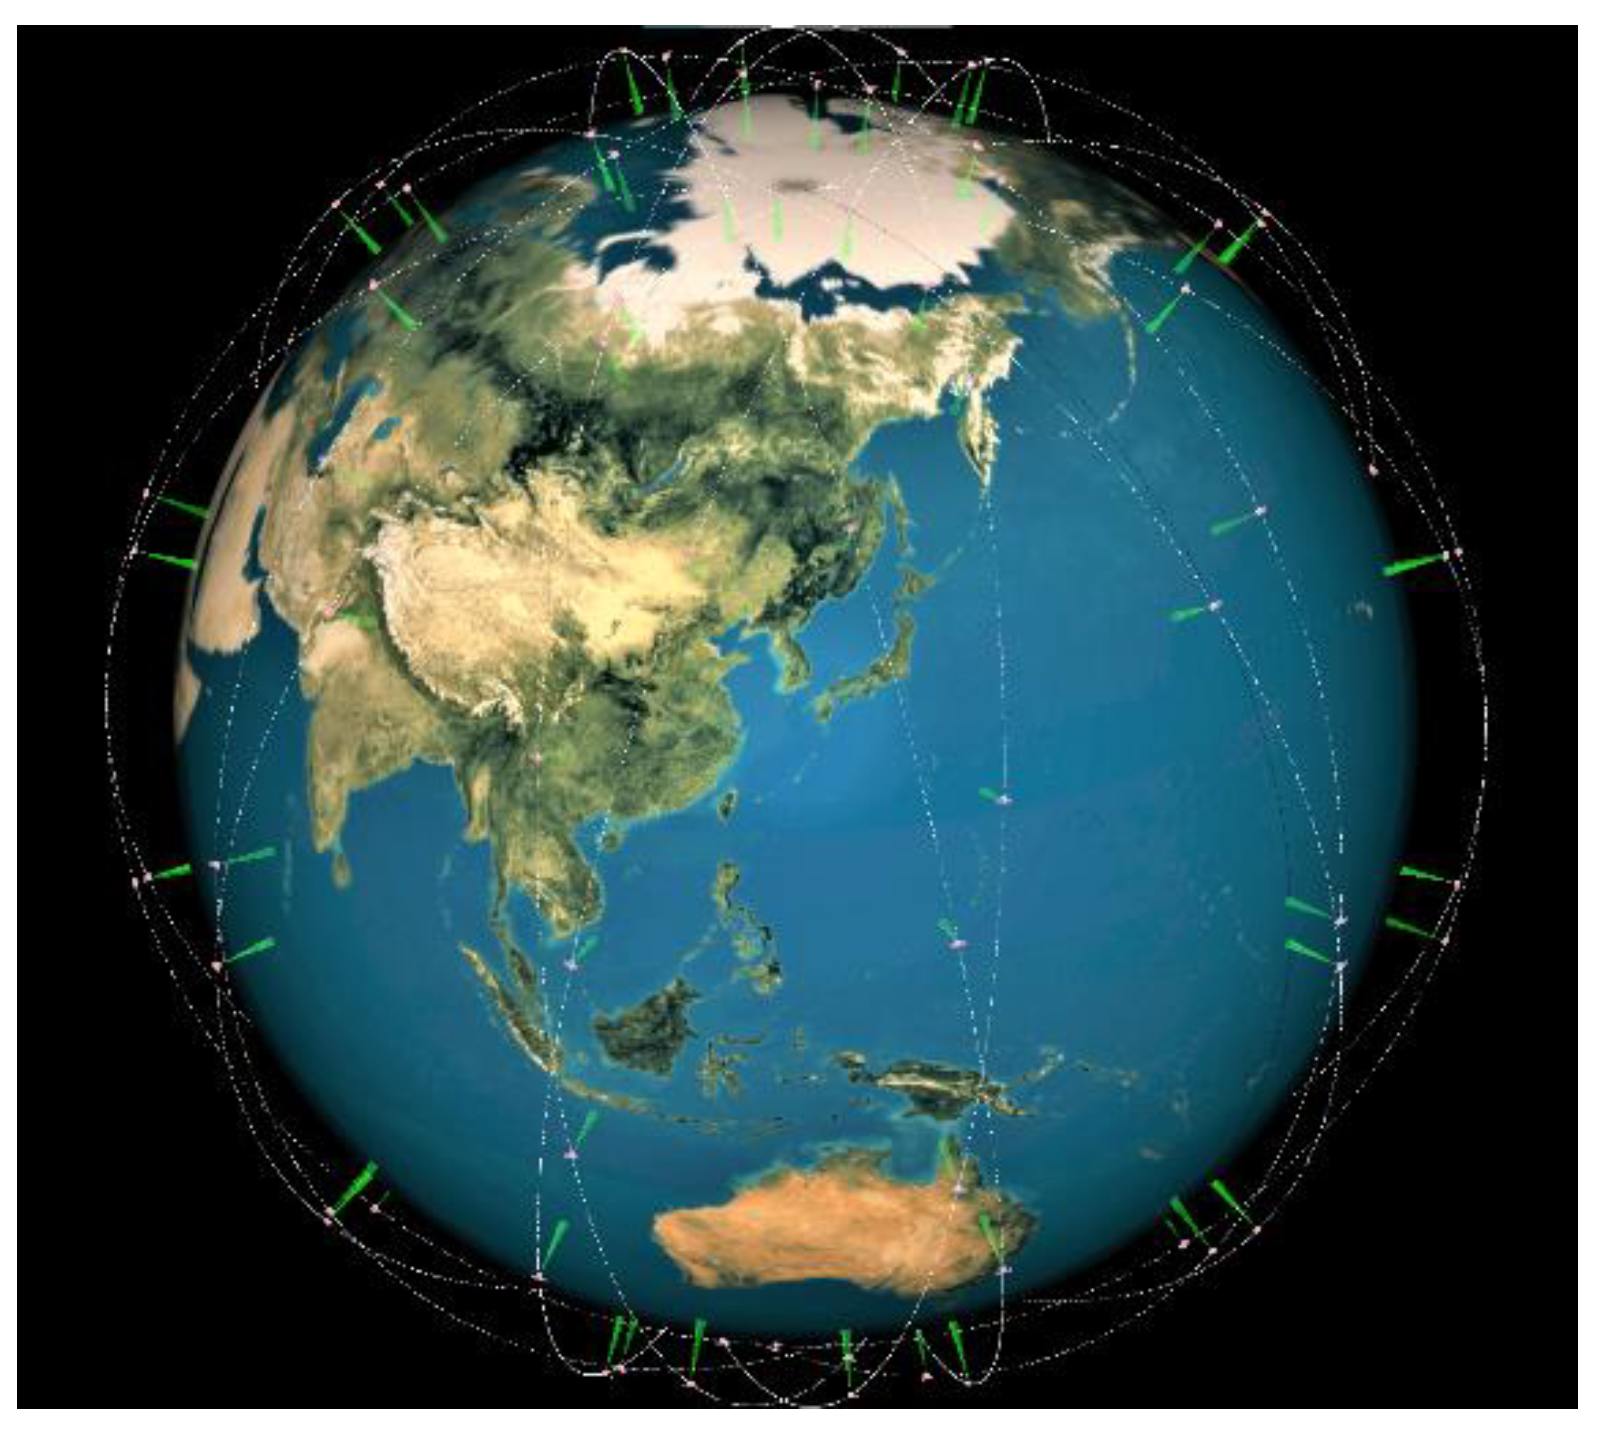
Remote sensing satellite systems are typically composed of optical satellites, synthetic aperture radar (SAR) satellites, and satellites carrying other payloads. They collaborate to carry out observation missions of worldwide targets. Targets are normally classified as point targets, area targets, and moving targets. The observation mission scene of remote sensing satellites is shown in
Figure 1.
The evaluation index system for remote sensing satellites is constructed from the mission perspective. As shown in
Figure 2, the method mainly consists of four steps: (1) index system hierarchy construction, (2) index decomposition and clustering, (3) index system preliminary screening of measurability and independence, and (4) index system quantitative screening considering completeness, independence, and simplicity.
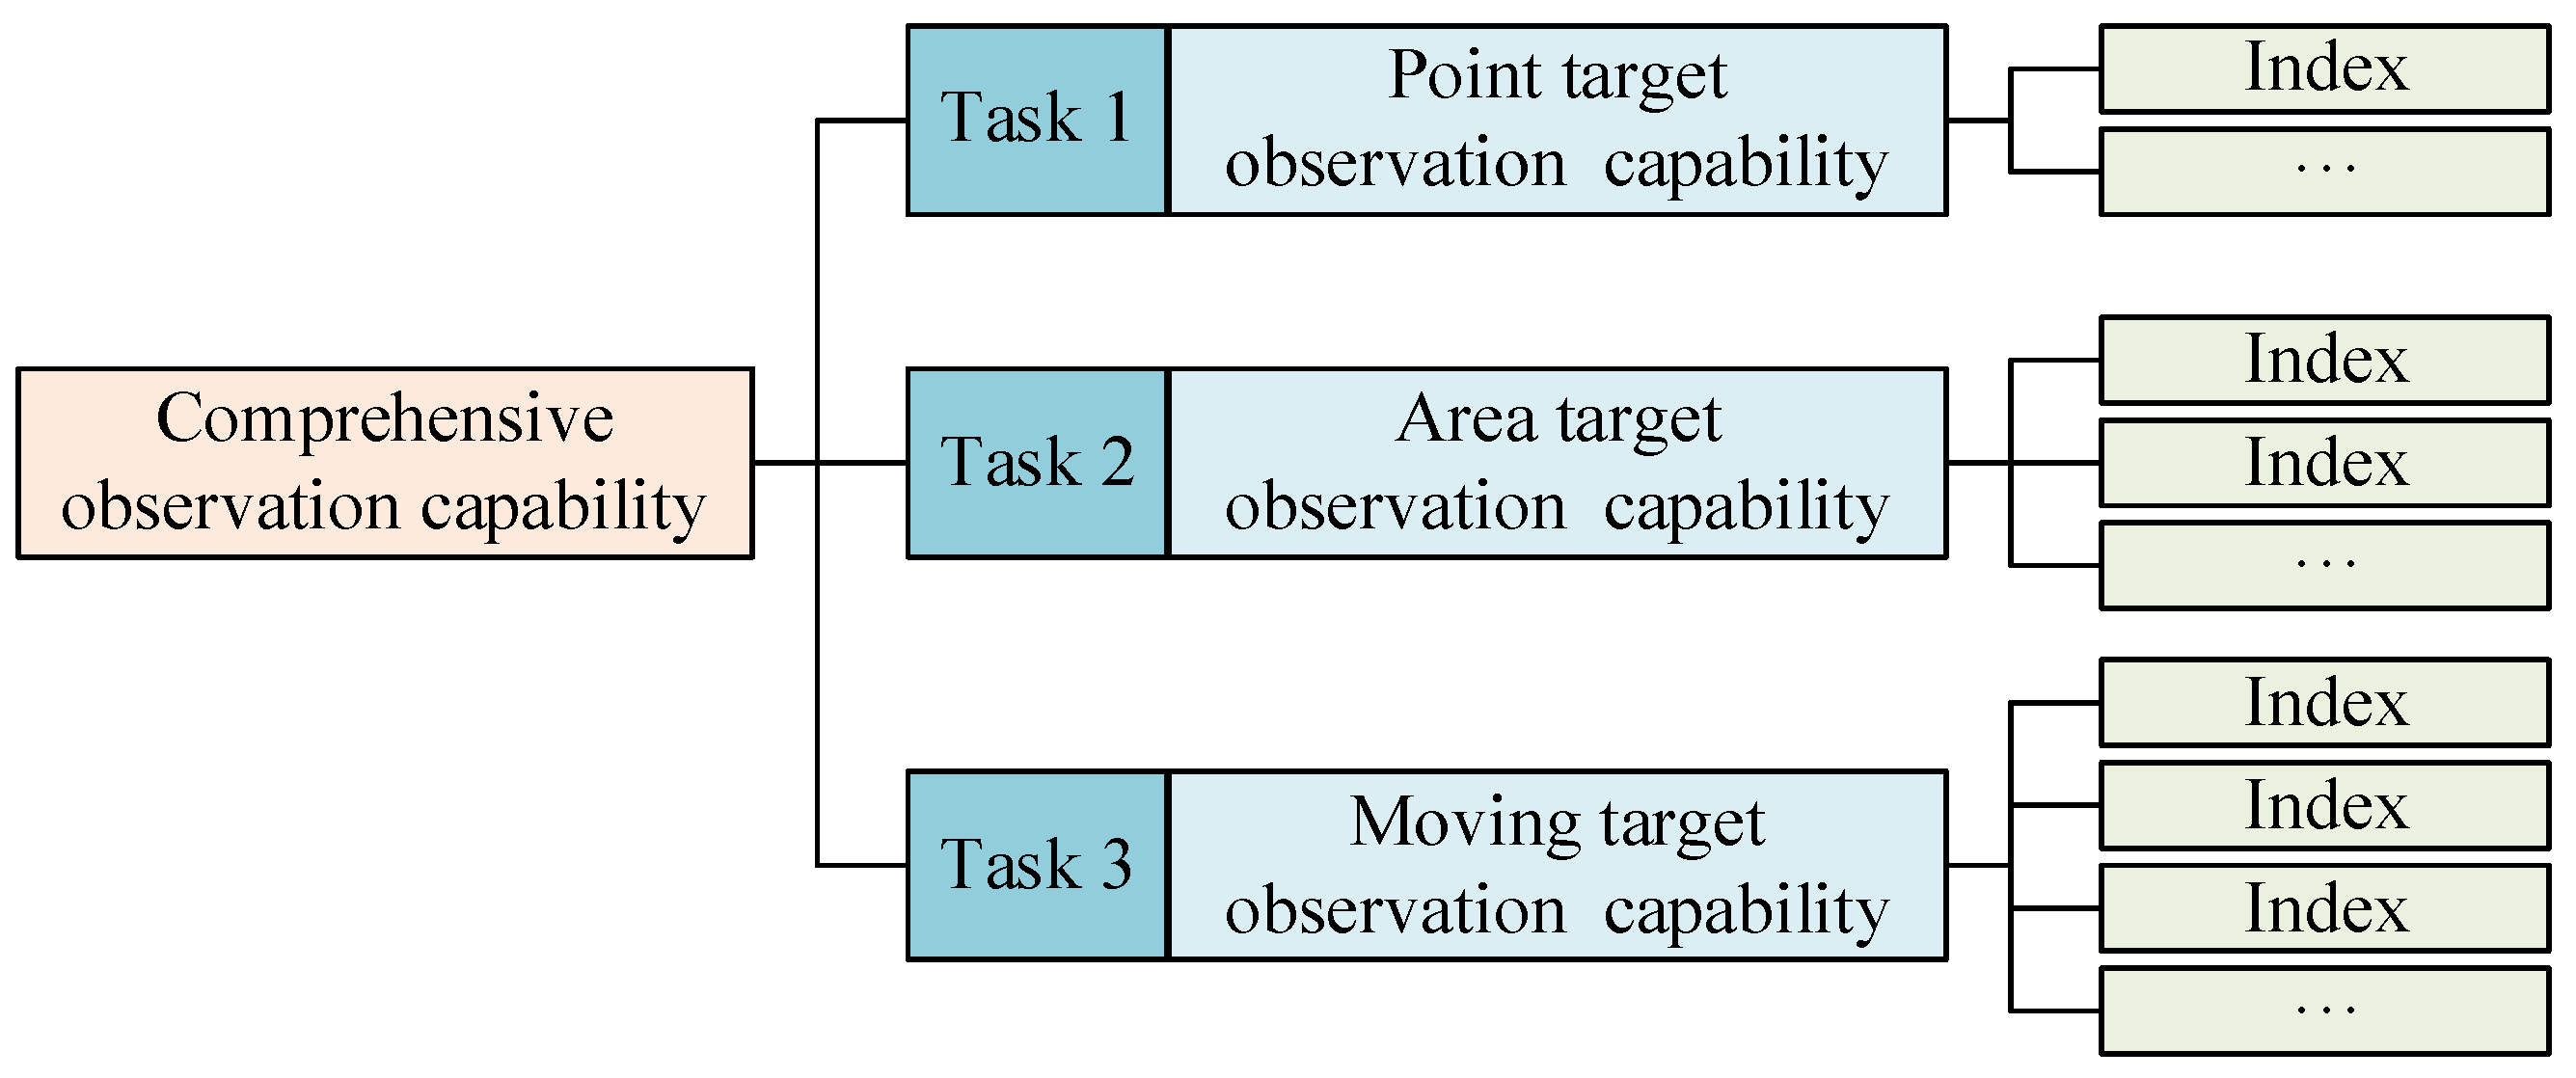
2.1. Index System Hierarchy Construction
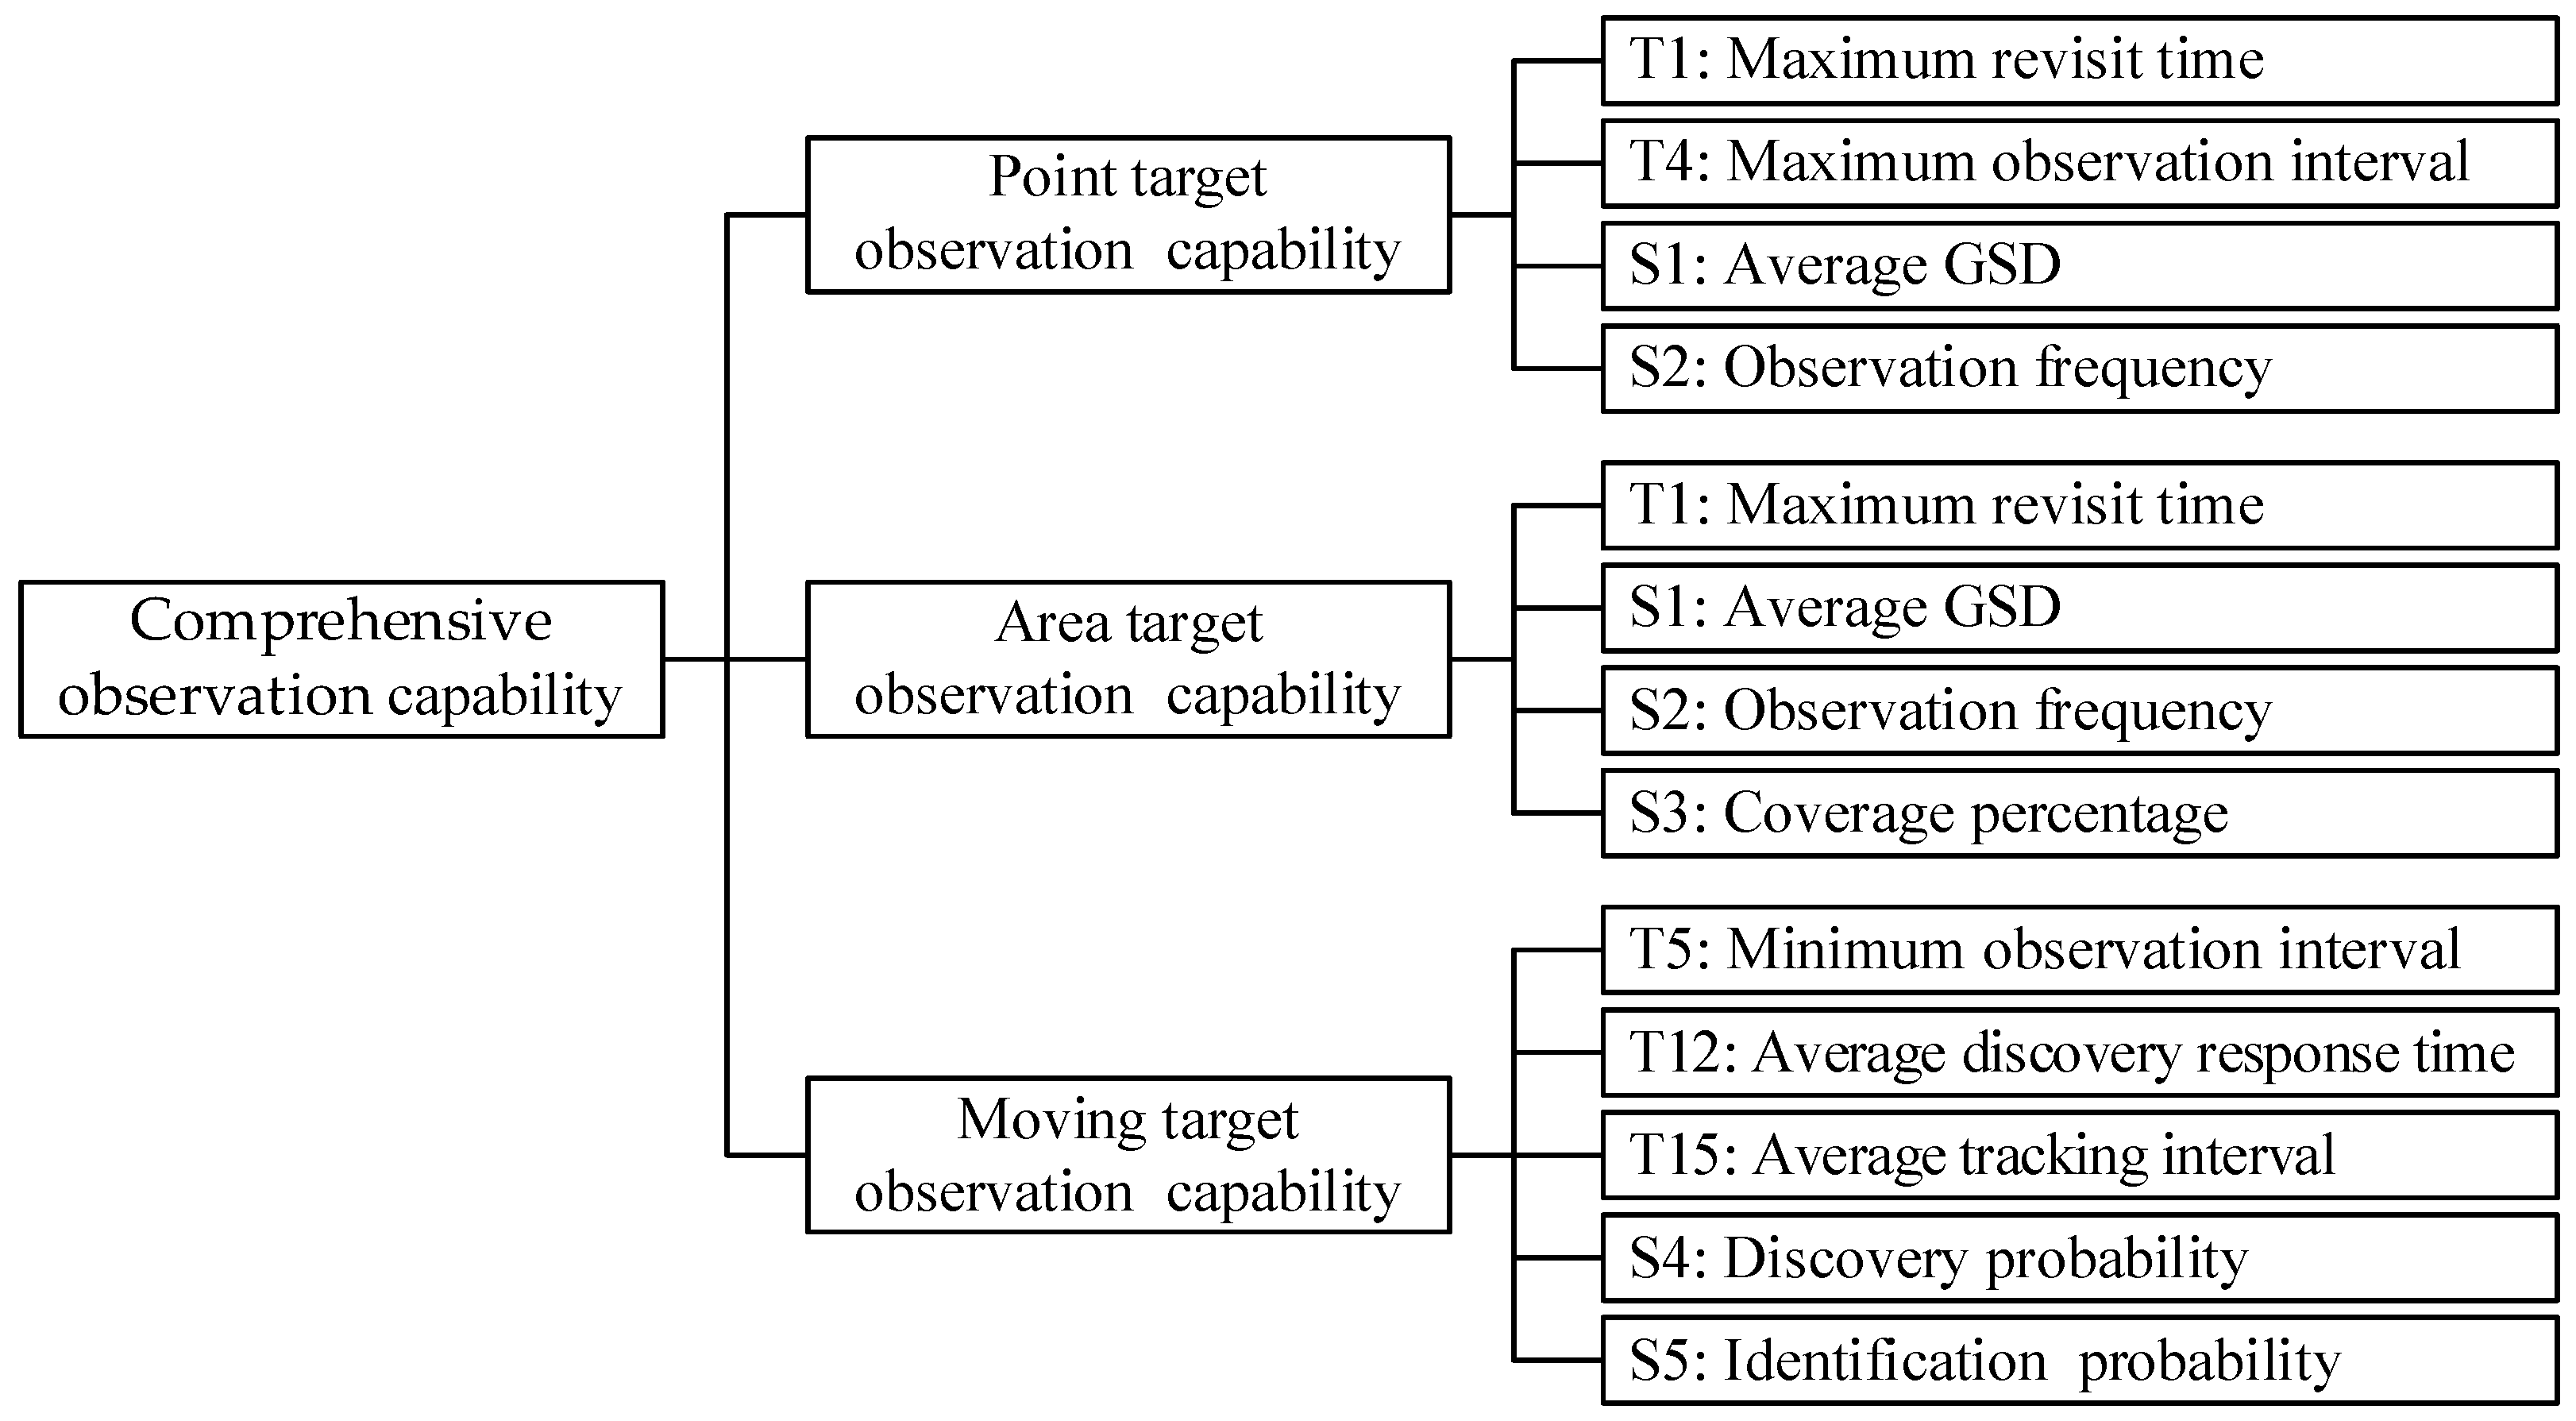
The first layer of the index system is defined as the system layer which represents the comprehensive observation capability. Comprehensive observation capability is the comprehensive value of the ability of remote sensing satellites in accomplishing different observation tasks. This value can be obtained by weighting the underlying indices.
Next, the remote sensing satellite observation task is decomposed according to three main targets, which are the point target, area target, and moving target. As the target characteristics and observation requirements are noticeably distinct, the emphasis on effectiveness evaluation for each target is different. Therefore, by referring to the three different tasks, the task layer is defined as the second layer of the index system.
Each task layer contains numerous dissimilar effectiveness indices. Although some of them are hierarchically related, the number of layers in the index system should be limited. Hence, the index system only retains a three-layer hierarchy structure. The third construction layer is the index layer, which is the smallest unit in the index system.
The three-layer structure of the index system is shown in
Figure 3.
2.2. Index Decomposition and Clustering
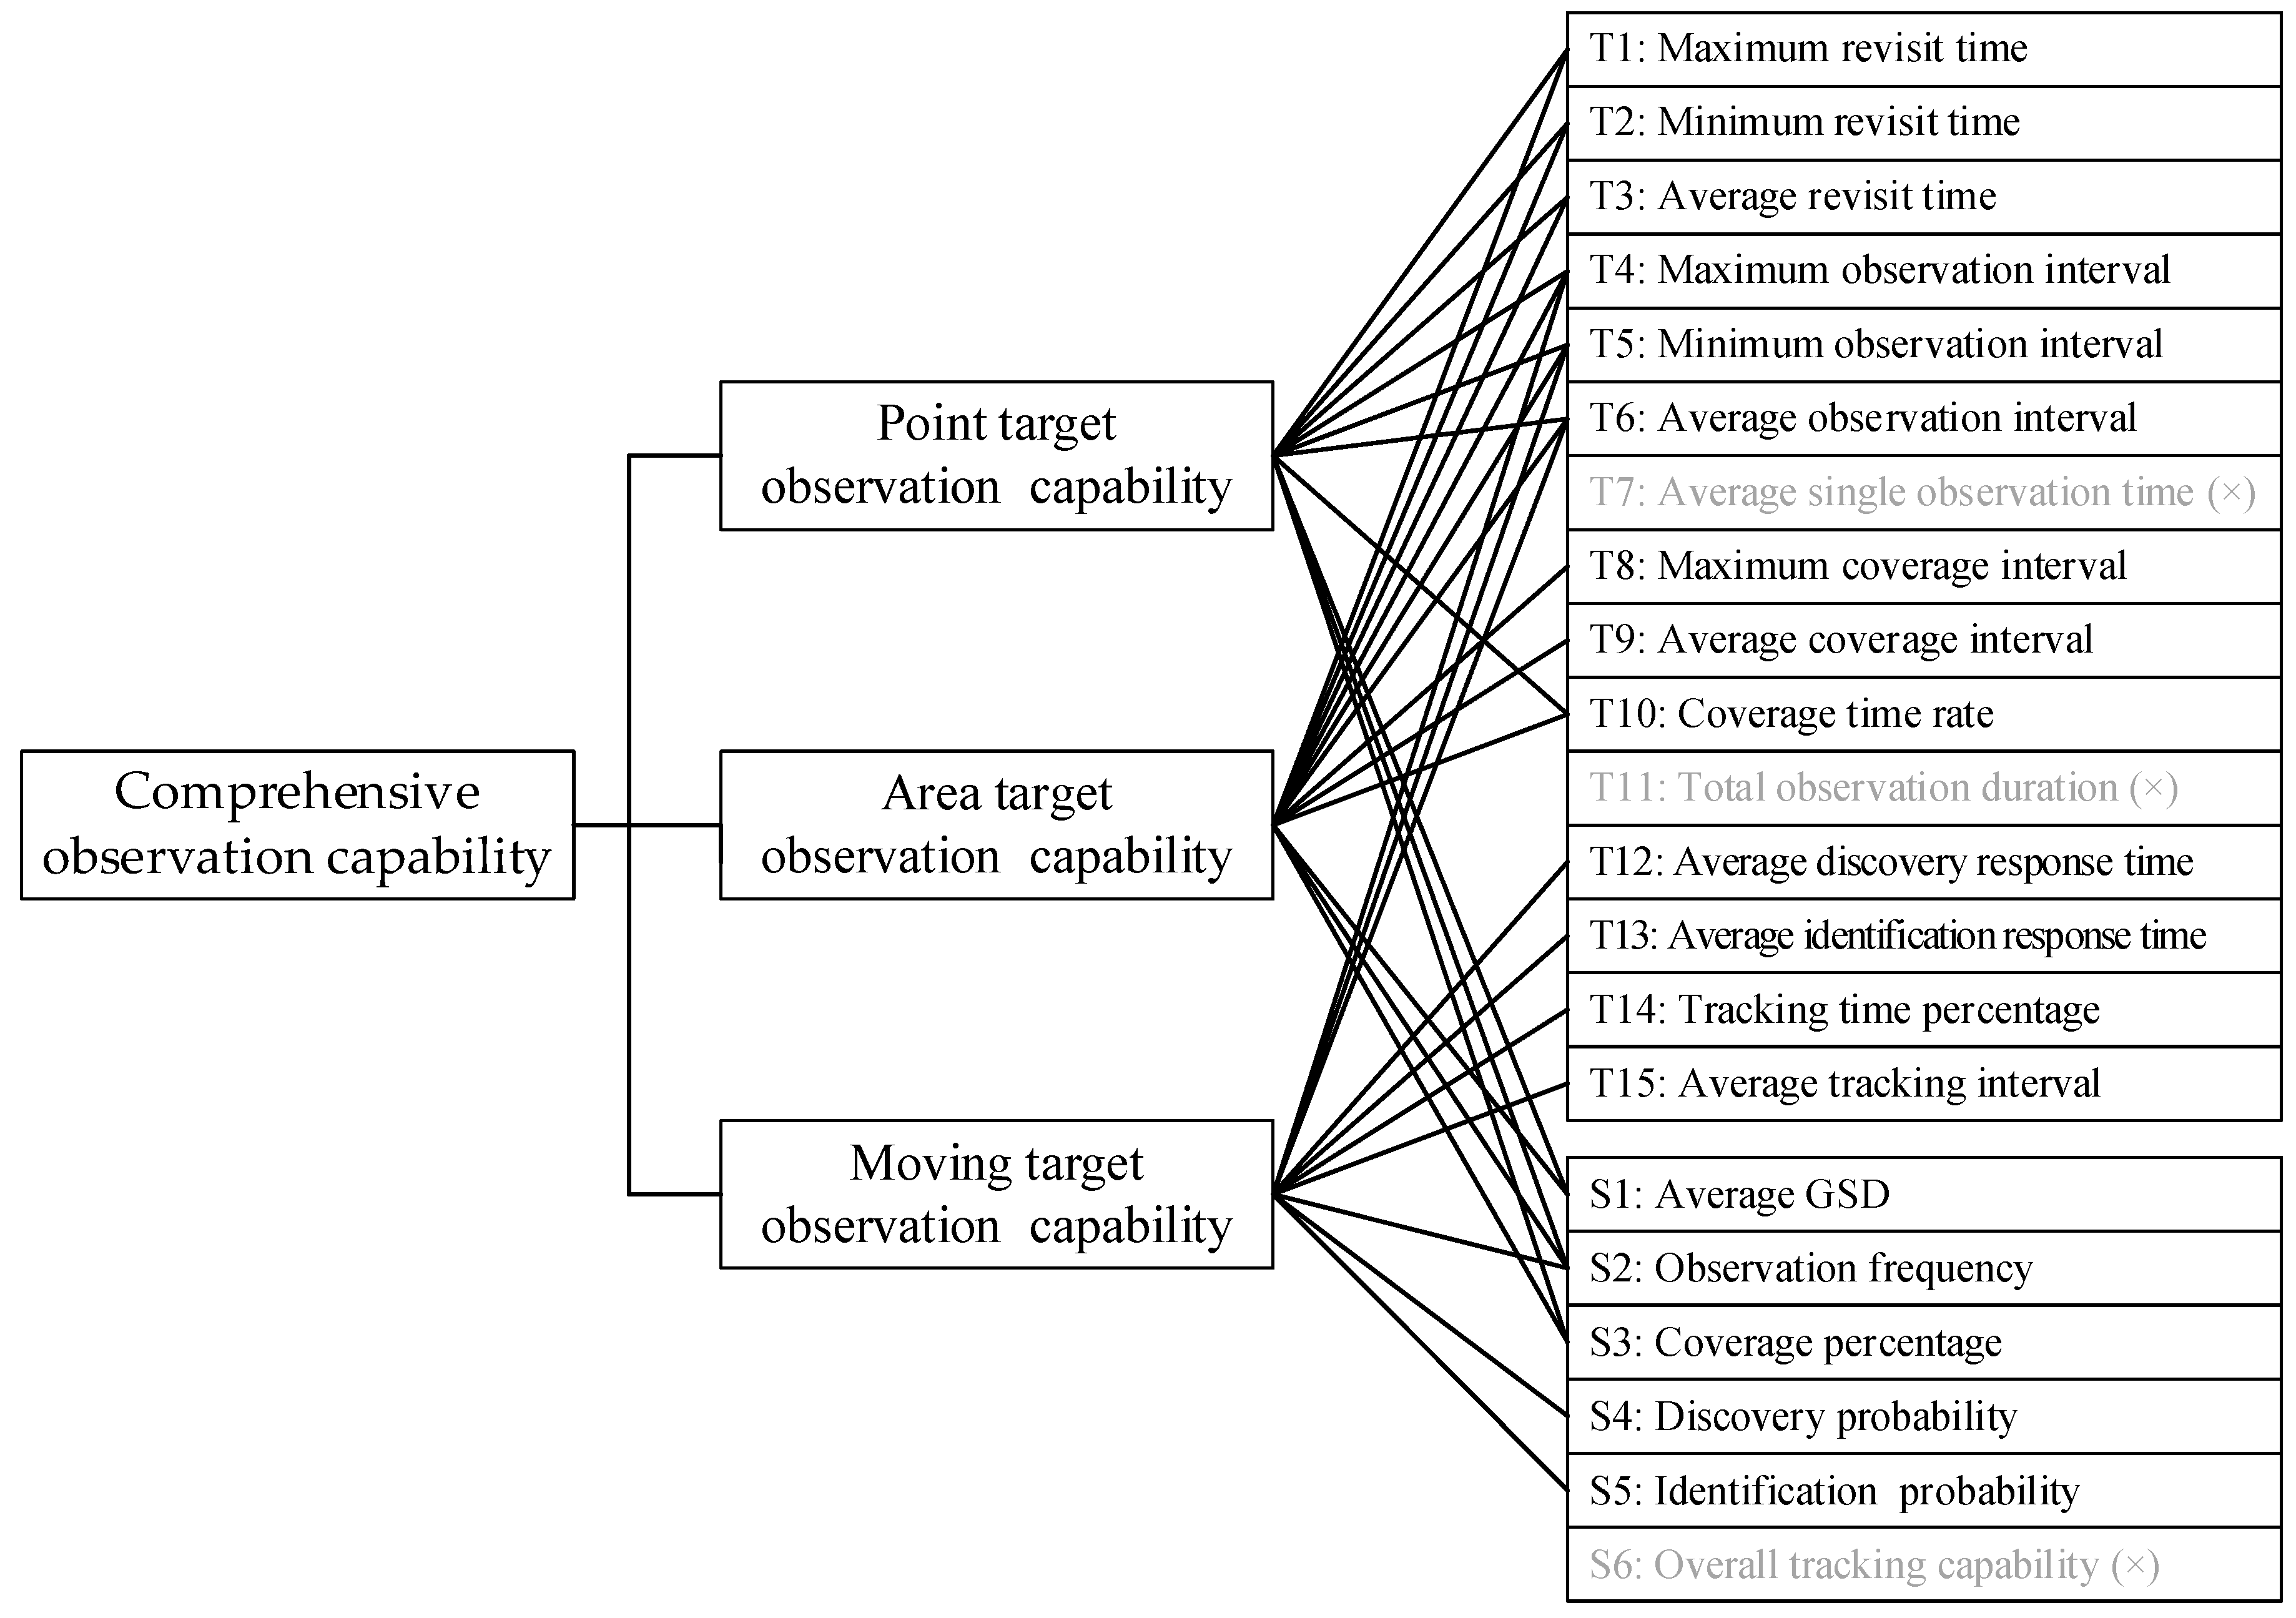
The effectiveness indices are decomposed based on temporal resolution, spatial resolution, spectral resolution, and radiometric resolution. The index decomposition result is presented in the first three columns in
Figure 4 [
10,
20,
21,
22,
23,
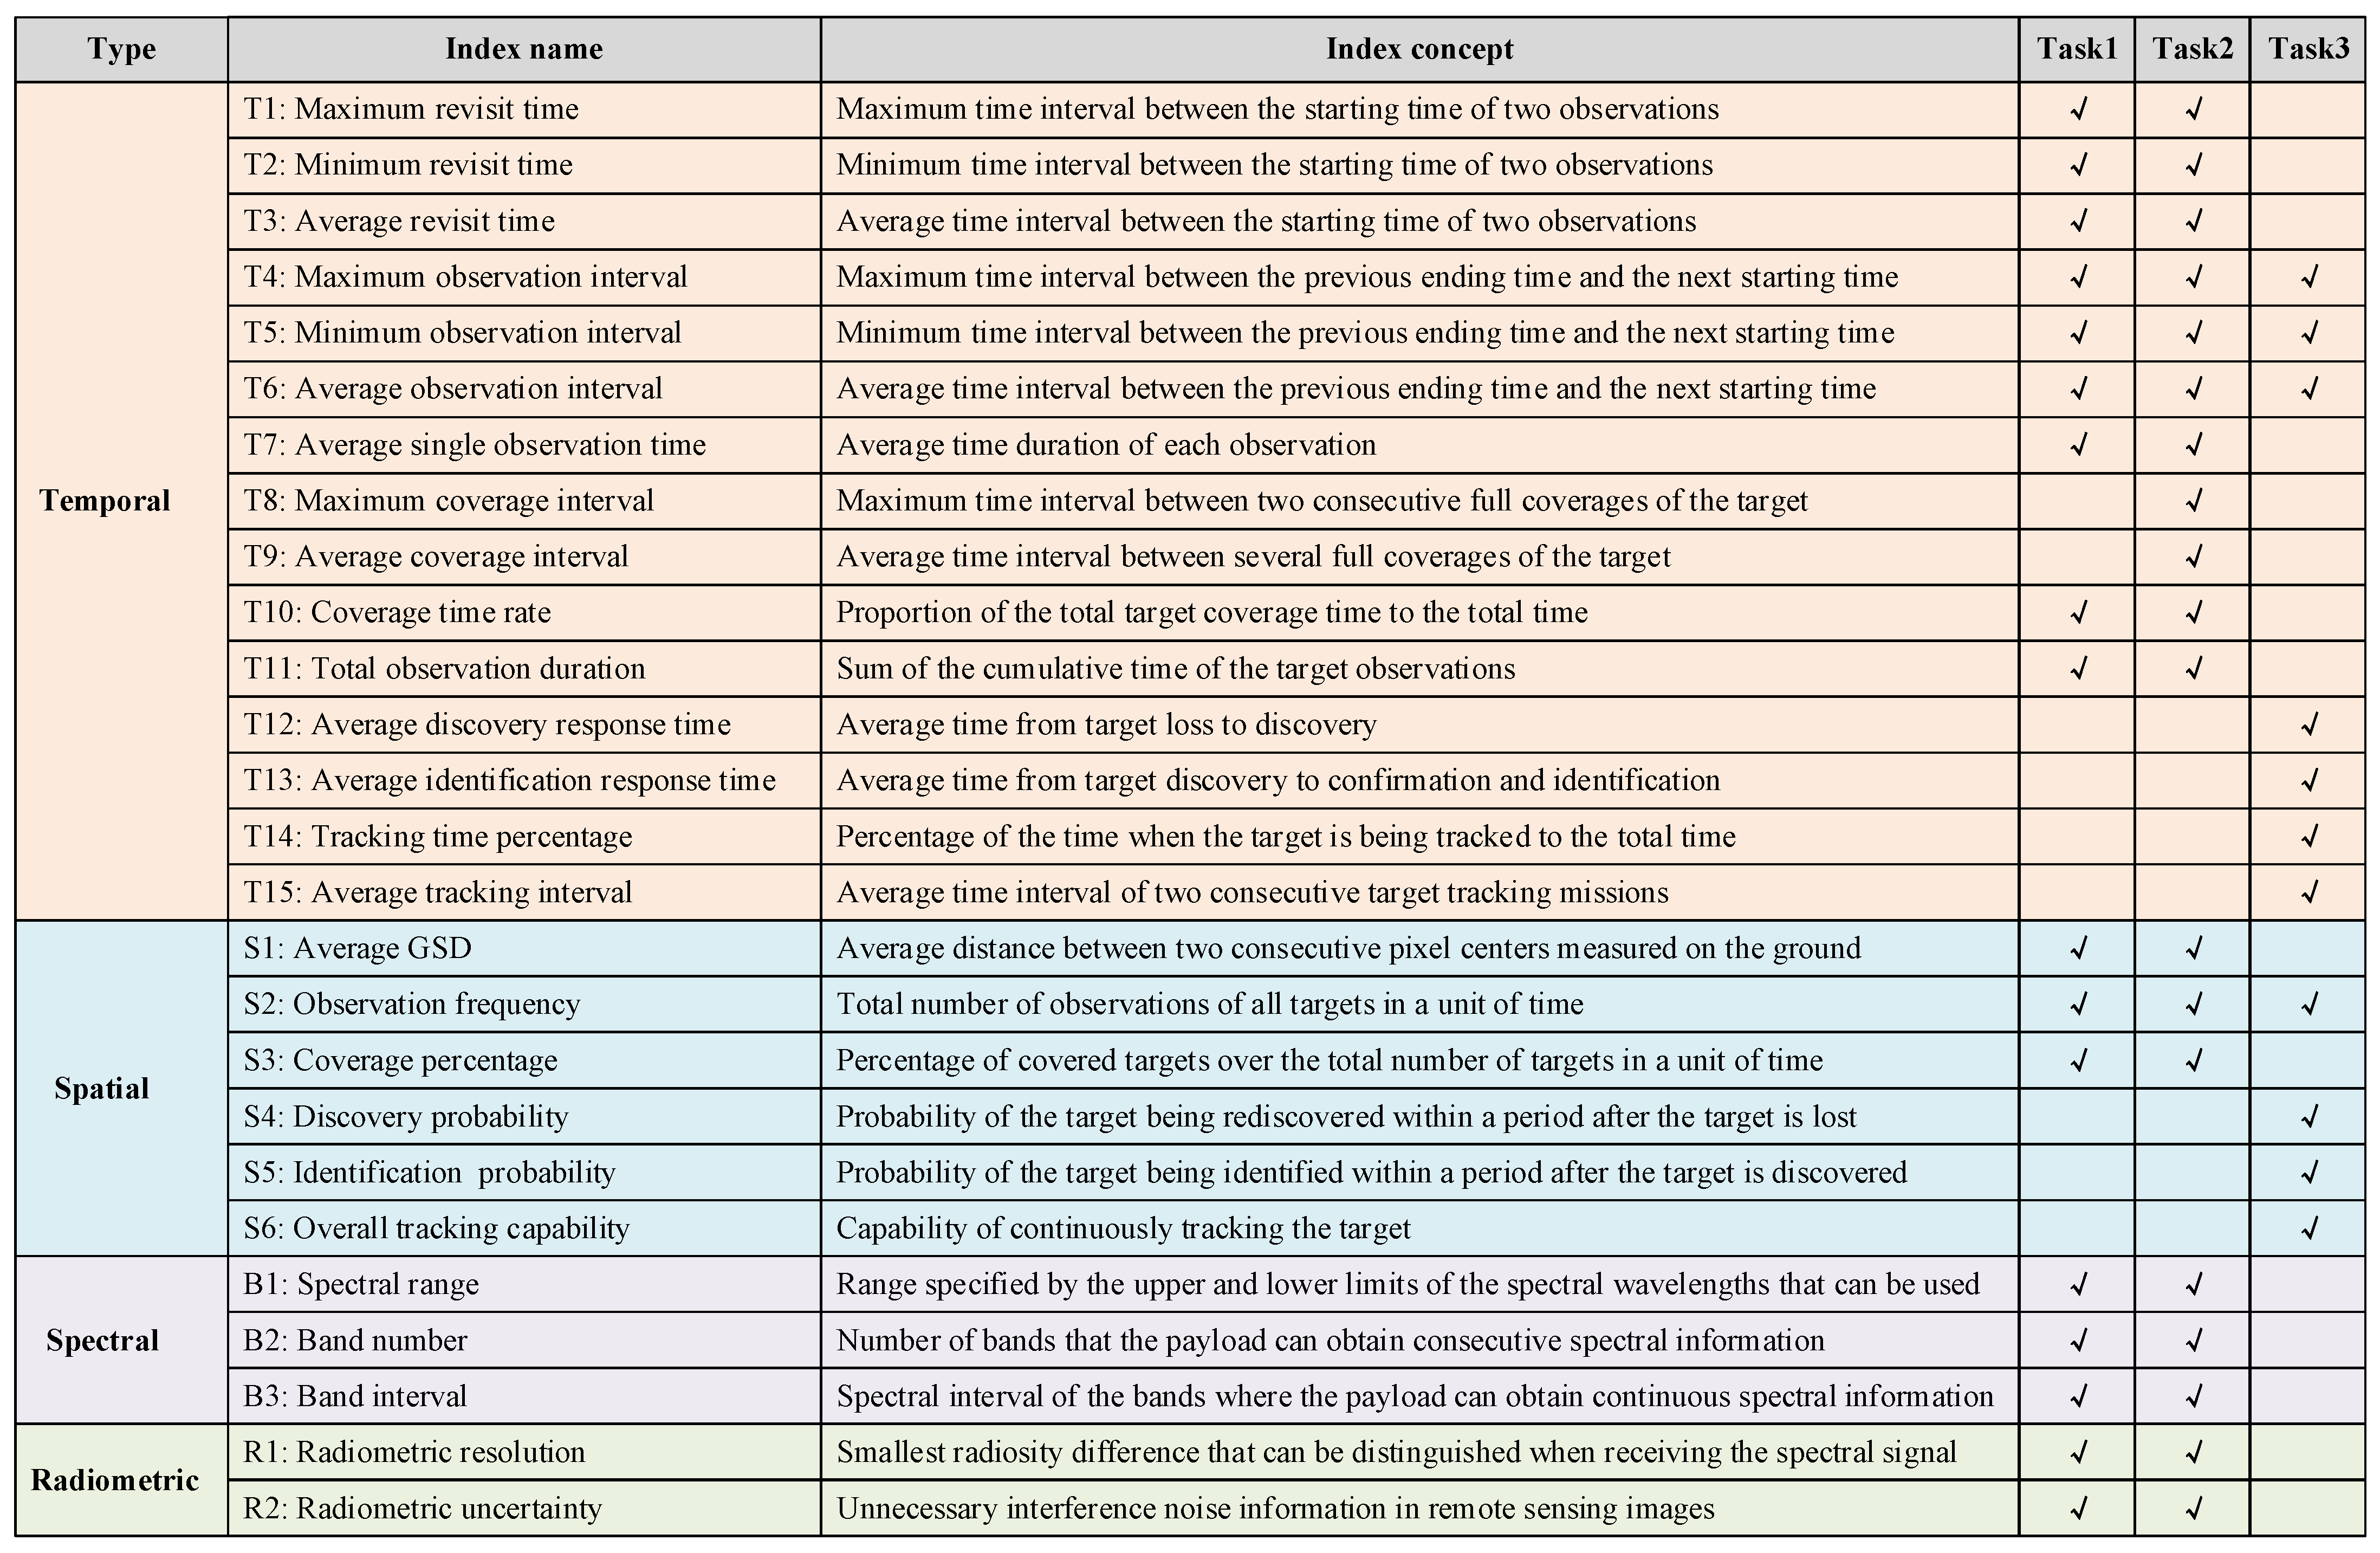
26]. The temporal resolution contains various indices, including revisit time, observation time interval, single observation ability, total coverage time, task response-ability, and continuous observation ability. The spatial resolution includes ground sampling distance (GSD), total observation number, coverage percentage, and capability of discovery, identification, and tracking. Spectral resolution consists of spectral range, band number, and band interval.
The characteristics of three different tasks and the applicable index set are then analyzed. The clustering results are summarized in the last three columns of
Figure 4, where Task 1, Task 2, and Task 3 represent the observation tasks of the point target, area target, and moving target, respectively. The detailed analysis and clustering process are as follows.
(1) Point target observation effectiveness index.
Point targets generally refer to small, fixed targets on the ground, such as airports, ports, buildings, etc. The dimensions of the point target are much smaller than the field of view of the remote sensing satellite; thus, only a single observation is needed to fully cover the point target. The requirements of observation effectiveness for point targets are mainly reflected in the coverage, timeliness, and imaging capabilities. Consequently, the main indices used to evaluate the effectiveness of point target observation are: revisit time, observation time interval, coverage percentage, coverage time rate, GSD, number of observations, spectral resolution, and radiometric resolution.
(2) Area target observation effectiveness index.
Area targets are generally of a certain scale, such as rivers, forests, and countries’ frontiers. As the dimensions of the target are relatively large, a single observation is inadequate to cover the whole target. Several satellites are therefore required to cooperate so that the target can be completely covered through multiple observations. The observation effectiveness of the area target is similar to that of the point target, but the numerical patterns for some of the same indices are different. Take the observation time interval and single observation time as examples. The larger the target dimensions, the longer the observation time. In addition, the full coverage ability for the area target is added to the evaluation index system, particularly the maximum coverage interval and average coverage interval.
(3) Moving target observation effectiveness index.
Moving targets include ships, vehicles, and other moving objects. Due to their small dimensions and motion uncertainty, close cooperation among multiple satellites are necessary to observe the moving targets. The typical moving target observation process begins with the use of wide-swath satellites to scan and search for the target. Next, high-resolution satellites are used to recognize and identify the moving targets. Subsequently, the remote sensing satellites will track the target continuously. The observation effectiveness of moving targets is mainly indicated in the success rate and timelines of different tasks. Hence, the index clustering results include observation time intervals, as well as the probability and response time of the three processes. These processes are search and discovery, identification and confirmation, and also continuous tracking.
2.3. Index System Preliminary Screening
The preliminary screening principle of the index system includes measurability and independence. The principle of measurability requires that the indices can be quantitatively calculated so that the indices can intuitively and objectively reflect the system’s capabilities. Independence requires the indices to be highly uncorrelated so that the index system’s hierarchy structure will be unaffected. Note that the indices of spectral resolution and radiometric resolution only describe the static capabilities of the payload. As they do not vary with time and tasks, they are mutually independent of other indices related to temporal resolution and spatial resolution. In the subsequent index screening, indices of spectral resolution and radiometric resolution are excluded. The preliminary screening process is as follows:
(1) Measurability screening, eliminate indices that cannot effectively measure the system's capabilities.
The overall tracking capability index is defined as the capability of continuously tracking the entire process of the target from appearing to disappearing in a specific area. As the satellite system is susceptible to weather, clouds, and other factors, it is generally impossible to track the whole process of the target. This index can hardly reflect the system’s capability since it has only a value of either 0 or 1. In contrast, tracking time percentage is the index that can effectively reveal the system’s capability for continuous tracking of the moving target. To comply with the measurability principle, the overall tracking capability index is eliminated from the index system.
(2) Independence screening, remove highly correlated and linearly dependent indices through correlation analysis.
There is a correlation between the total observation duration index and the coverage time rate index as the total observation duration is equal to the product of total time, total target number, and coverage time rate. The total observation duration index is an absolute time with no clear meaning as it is affected by the changes in the total time and the total target number. Instead, the coverage time rate index is a relative value that is more general in use. Hence, the total observation duration index is removed.
The average single observation time, average revisit time, and average observation interval are three correlated indices. The average single observation is redundant because it is obtained by subtracting the average observation time from the average revisit time. On the other hand, the revisit time and observation interval have three conventional indices, which are the maximum, minimum, and average values. Thus, the average single observation is removed to decrease the correlation among indices.
After screening the indices with the consideration of the principle of measurability and independence, the preliminary screening result of the index system are presented in
Figure 5.
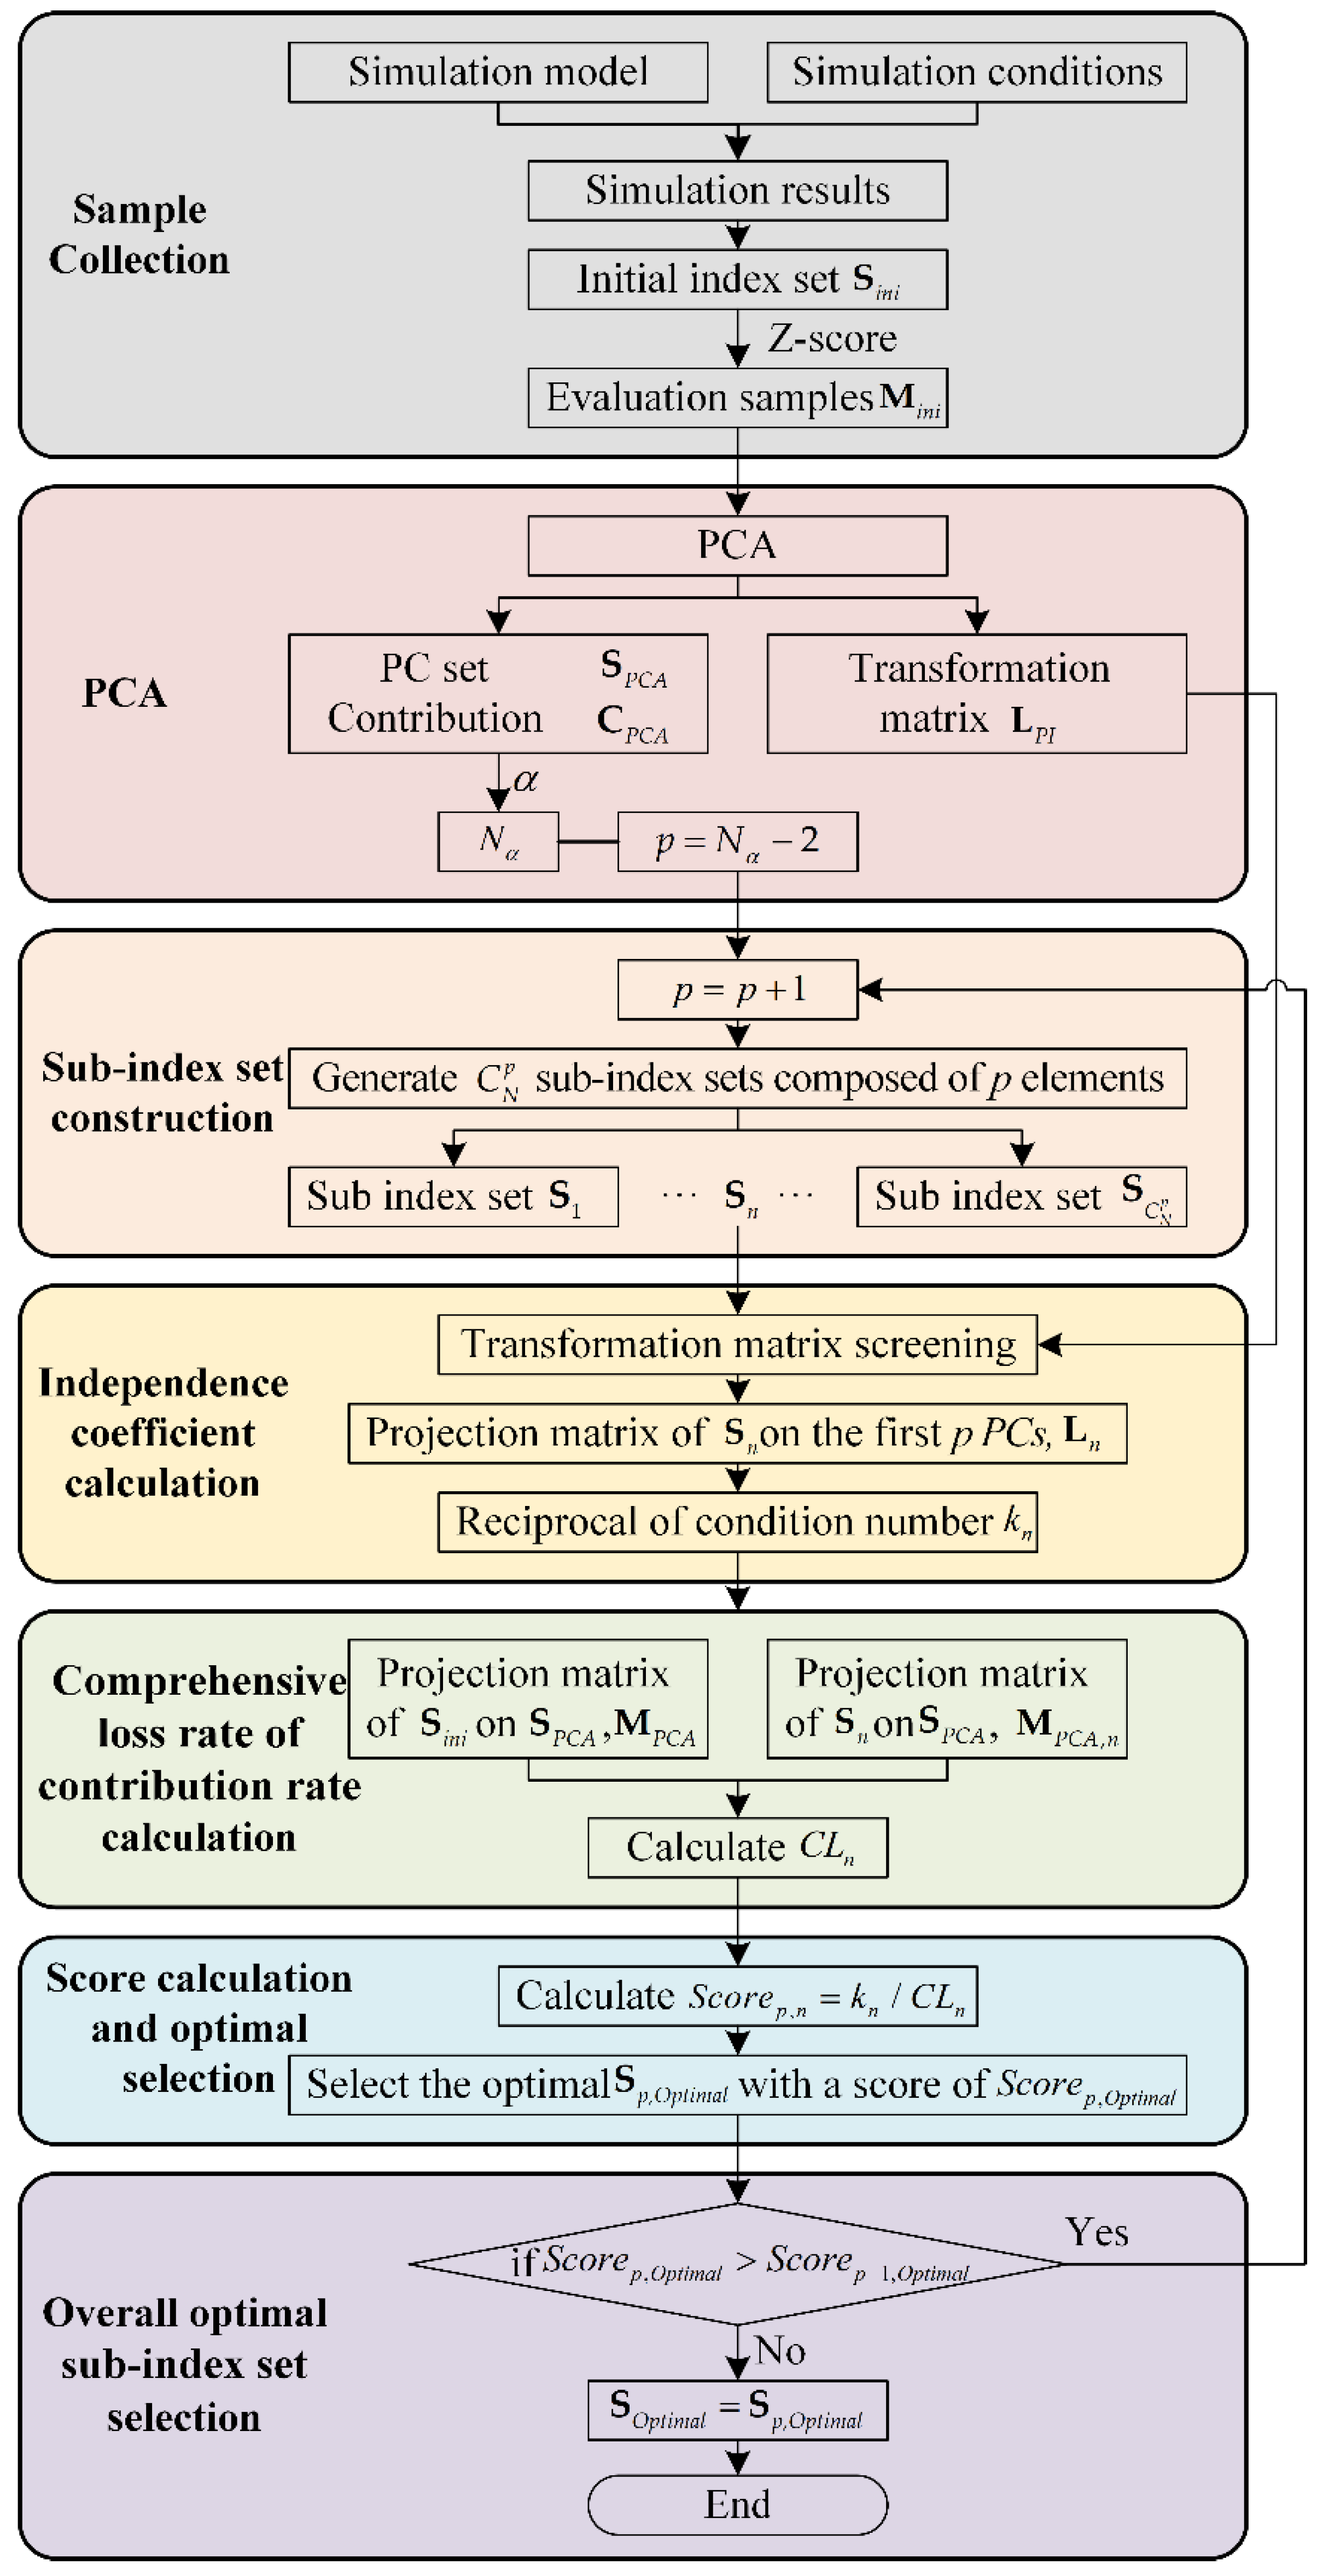
2.4. Index System Quantitative Screening (ICCLR)
An index system is gained after the preliminary screening. The completeness, hierarchy, and measurability of the index system are ensured, but the indices are still unavoidably redundant and correlated, which leads to inadequate independence and simplicity. This section presents a comprehensive scoring ICCLR method using the principal component analysis combined with the independence coefficient and the comprehensive loss rate of the contribution rate. After quantitative analysis and calculation, the index sets under each task layer branch are screened to obtain the optimal index system. The quantitative screening process of the index system is presented in
Figure 6.
Step 1: Sample collection.
Given the preliminarily screened index sets
in the specific task layer, which includes
effectiveness indices.
Analyze the systems and task parameters that have a significant impact on the effectiveness indices in the task scenes. Then, the influencing parameters are randomly scattered to generate
simulation conditions. The effectiveness indices of each simulation condition are simulated and calculated. After Z-score normalization, a sample matrix
is generated for index screening.
where
is the calculated value of
th index in
th sample, note that
,
.
Step 2: Principal component analysis.
Perform PCA on Matrix
to obtain two sets, which are the principal component set
and the contribution rate of the principal component set
[
19].
According to a specified requirement of cumulative contribution rate
(normally set to 90–95%), the number of top
principal components is obtained, satisfying
Meanwhile, the transformation matrix
of the initial index set
and principal component set
can also be obtained,
,
, and
is the feature vector corresponding to
th principal component. In the matrix
, each row is a vector of the initial index in the principal component coordinate system. The above relationship can be expressed as
Step 3: Traverse to build sub-index sets.
Select
indices from the
indices included in the index set
, then form
sub-index sets
, where
and
Step 4: Calculate the independence coefficient for each sub-index set.
indices in are projected to the top principal components in , where the projection matrix is . Since only the top principal components are extracted, the coordinates of principal components can be neglected, and thus the coefficients of rows are deleted from . Next, according to the numbering of indices in , select the corresponding rows to obtain .
Calculate the independence coefficient
of
, which is the reciprocal condition number of
.
The condition number is one of the important indicators of the ill-conditioned matrix. If the condition number is around 1, the matrix is well-conditioned, meaning that the variables are all mutually independent. Conversely, the higher the condition number, the more ill-conditioned the matrix is. Aiming at the effectiveness index screening problem, the reciprocal condition number is defined as the independence coefficient . When is closer to 1, the independence of the index system is higher.
Step 5: Calculate the comprehensive loss rate of the contribution rate for each sub-index set.
is defined as the weighted value of the projected distance difference of all the samples on the principal components, under two different index systems and , where the weighting coefficient value is the contribution rate of the principal component. , when the value is lower, the information loss of is lesser, indicating that the index system is more complete. The calculation process is shown below.
Under the complete index system
, all samples are projected to the principal component coordinate system projection matrix
Under the index system
, the evaluation result of samples is
, where the transformation matrix is
. The evaluation result is projected to the principal component coordinate system projection matrix
Step 6: Calculate the comprehensive score for each sub-index set, and choose the optimal set.
First, calculate the comprehensive score
of the index sets by computing the ratio of
to
.
Then, select the sub-index set with the highest to be the optimal index system that takes into account completeness, independence, and simplicity given the current value, and the score is .
Step 7: Select the global optimal index set.
Compare of different values. Select the optimal index system through iterations.
If , perform and loop through Step 3 to Step 7.
If , break the loop, where is the optimal index system, which is also the .
3. Experiment and Results
A remote sensing satellite constellation scene with a scale of 100 satellites was selected for simulation verification. The satellite configuration adopted the walker constellation, as shown in
Figure 7. The nominal constellation consists of 10 orbital planes, each of which contains 10 satellites, with an orbital height of 650 km and an orbital inclination of 98°. The observation scenes of the point target, area target, and moving target were simulated, evaluated and index screened, respectively. Note that the satellite constellations of the first two scenes were composed of single-type satellites. The satellite cluster in the moving target observation scene was composed of two types of satellites: wide-swath satellites and high-resolution satellites. Finally, the optimal evaluation index system of remote sensing satellites was obtained. All the experiments were performed on a personal computer with an Intel i7-9700 CPU.
We compared our proposed method with several quantitative and qualitative methods using the obtained index system. Qualitative methods include the Delphi [
7,
24] and AHP [
25] methods, while quantitative methods include correlation analysis [
26] and EWM [
27] methods. Index systems were obtained using these different methods. By comparing their independence coefficients, the comprehensive loss rate of the contribution rate, and comprehensive scores, our proposed method was proven to be optimal.
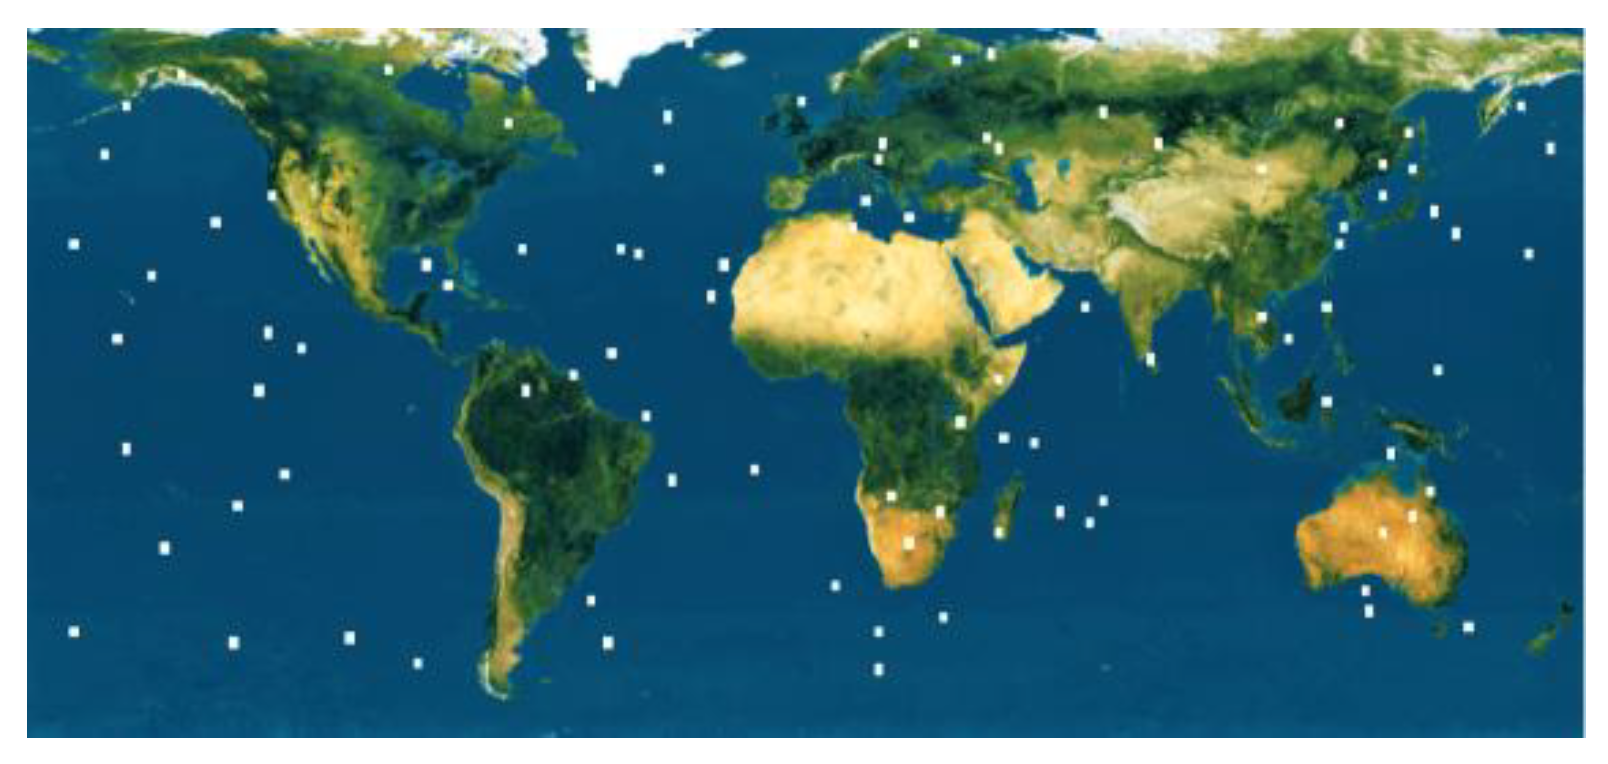
3.1. Scene 1: Point Target Observation Task
By selecting 100 fixed targets that were randomly distributed across the globe, the point target observation scene was constructed as shown in
Figure 8. The location of the targets was randomly chosen, with longitude ranging from 180° E to 180° W and latitude ranging from 50° S to 80° N. The position distribution of a group of randomly generated target points is shown in
Table A1. The simulation started at 0:00 on 1 January 2021 and lasted for 1 day.
The system parameters and the location of the point targets were chosen at random to create 500 samples. System parameters consisted of the satellite constellation orbit configuration parameters and the satellite payload parameters. The ranges of the parameters are listed in
Table 1.
A batch simulation was performed on the 500 randomly generated samples. The simulation results were then used to evaluate the remote sensing satellite observation effectiveness on point targets. The input parameters and the effectiveness evaluation results of the first five samples are listed in
Table 2.
The samples were then analyzed using PCA, where the respective contribution rate of the principal components was
The cumulative contribution rate of the first four principal components reached 95.04%, given that the initial index number was three. Iterations started with the number of indices
= 3 to construct
of different sets of index layer elements. For each index combination, the resulted independence coefficients
, the comprehensive loss rate of contribution rate
, and the comprehensive score are shown in
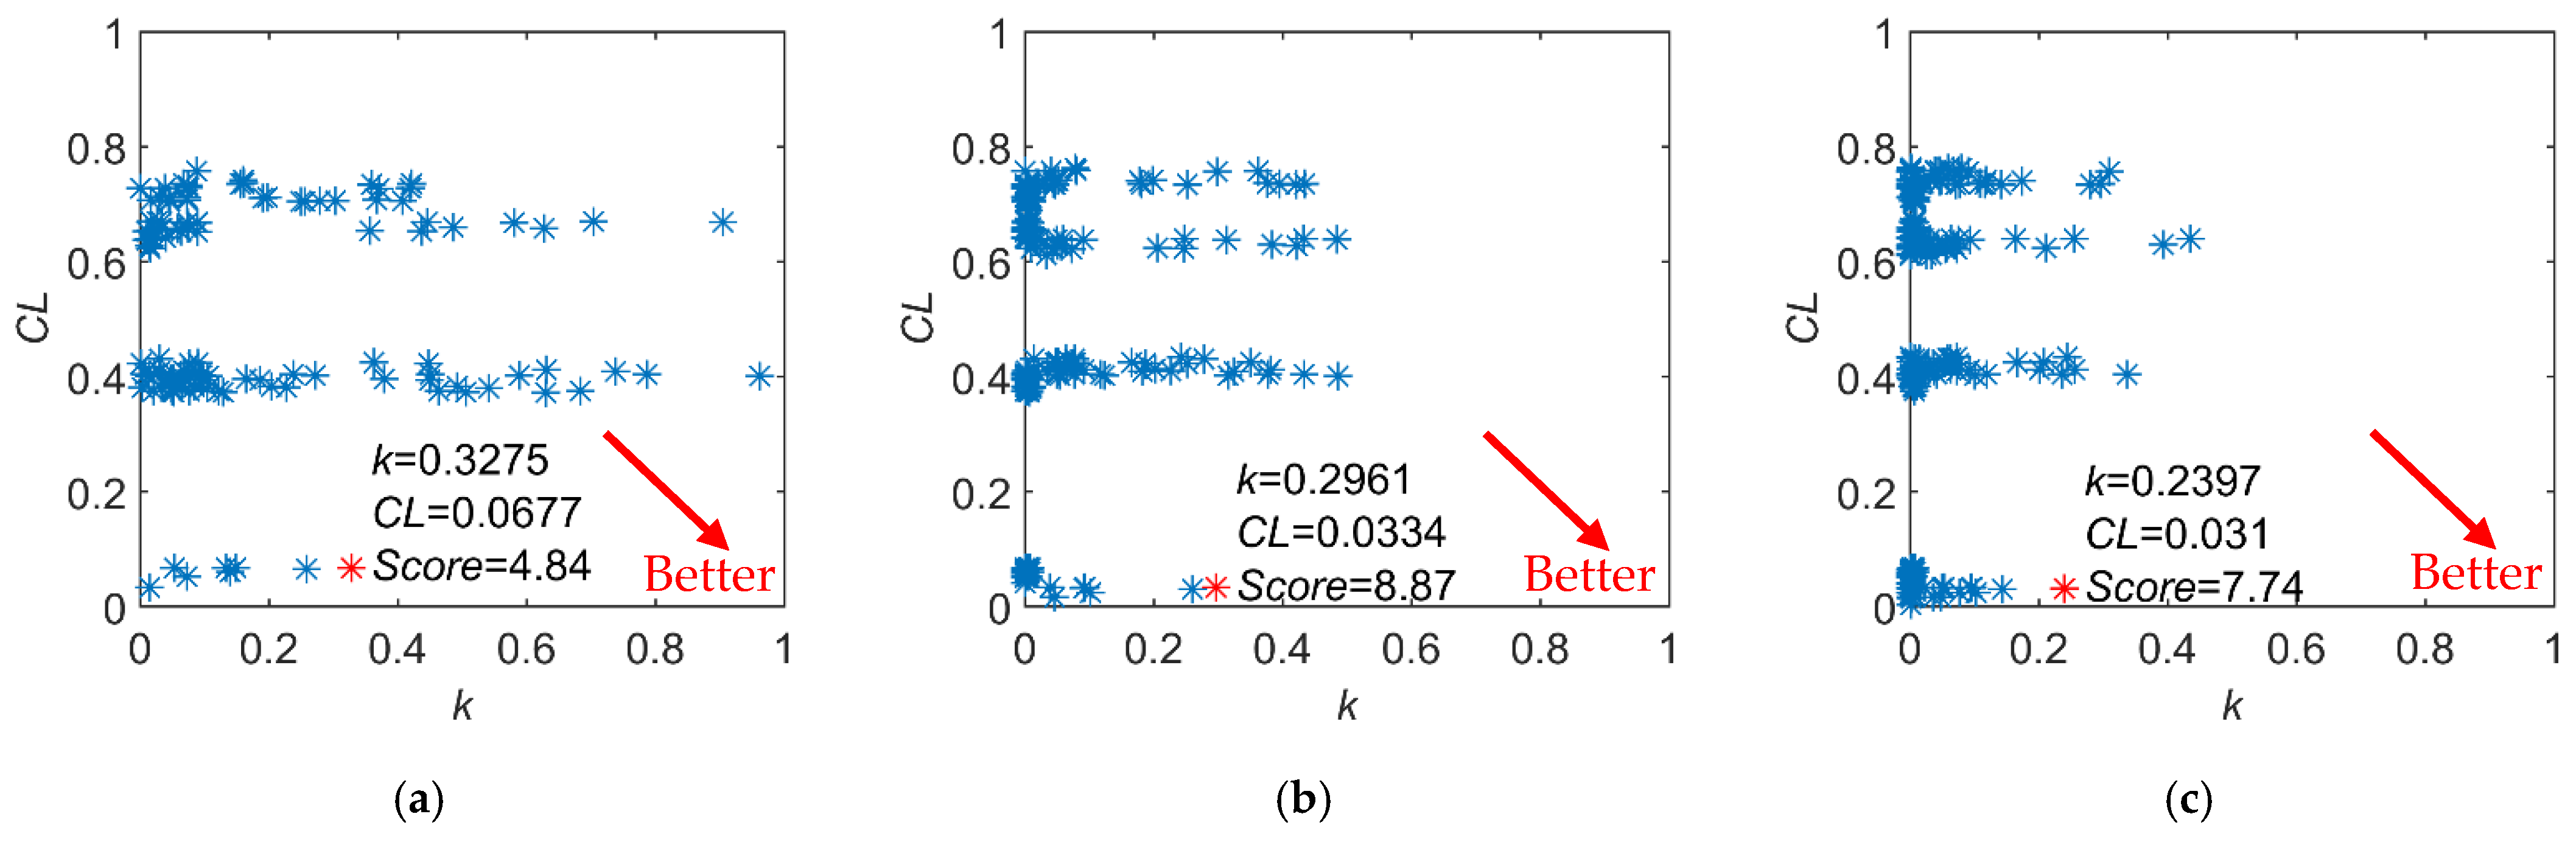
Figure 9. Noticeably, when
= 4, the index set achieved the optimal value, where the comprehensive score was 8.87,
= 0.2961, and
= 0.0334. In contrast, when
= 3, although the independence of the optimal index set was higher, more contribution rate was sacrificed; when
= 5, the contribution loss was reduced but yet its independence was lower. As a result, the optimal index set when
= 4 was the global optimal solution that considered the principle of completeness, independence, and simplicity. The indices included in the optimal index set were T1, T4, S1, and S2.
Concerning the observation efficiency of point targets, we compared several different index system construction methods; the results are shown in
Table 3. In terms of qualitative methods, the k values are all less than 0.11, indicating that the index systems contained redundant indices and hence their independence are lower. In addition, all CL values are higher than 0.7, indicating an insufficient level of completeness. With respect to quantitative methods, the independence of the correlation analysis screening results (
= 0.4203) is better, but the completeness is inadequate (
= 0.07345). On the contrary, the screening results of the entropy weight method have better completeness (
= 0.0333) but insufficient independence (
= 0.0382). By comparison, the independence of the obtained index system using the proposed method is slightly lower than that of the correlation analysis method, the completeness is basically the same as that of the entropy weight method, and the comprehensive score is higher than all other methods mentioned above. Hence, our proposed method is able to obtain an index set that has better completeness, independence, and simplicity.
Consequently, we obtained the optimal effectiveness observation index set for remote sensing satellites on point targets, which included indices of maximum revisit time, maximum observation interval, average GSD, and observation frequency.
3.2. Scene 2: Area Target Observation Task
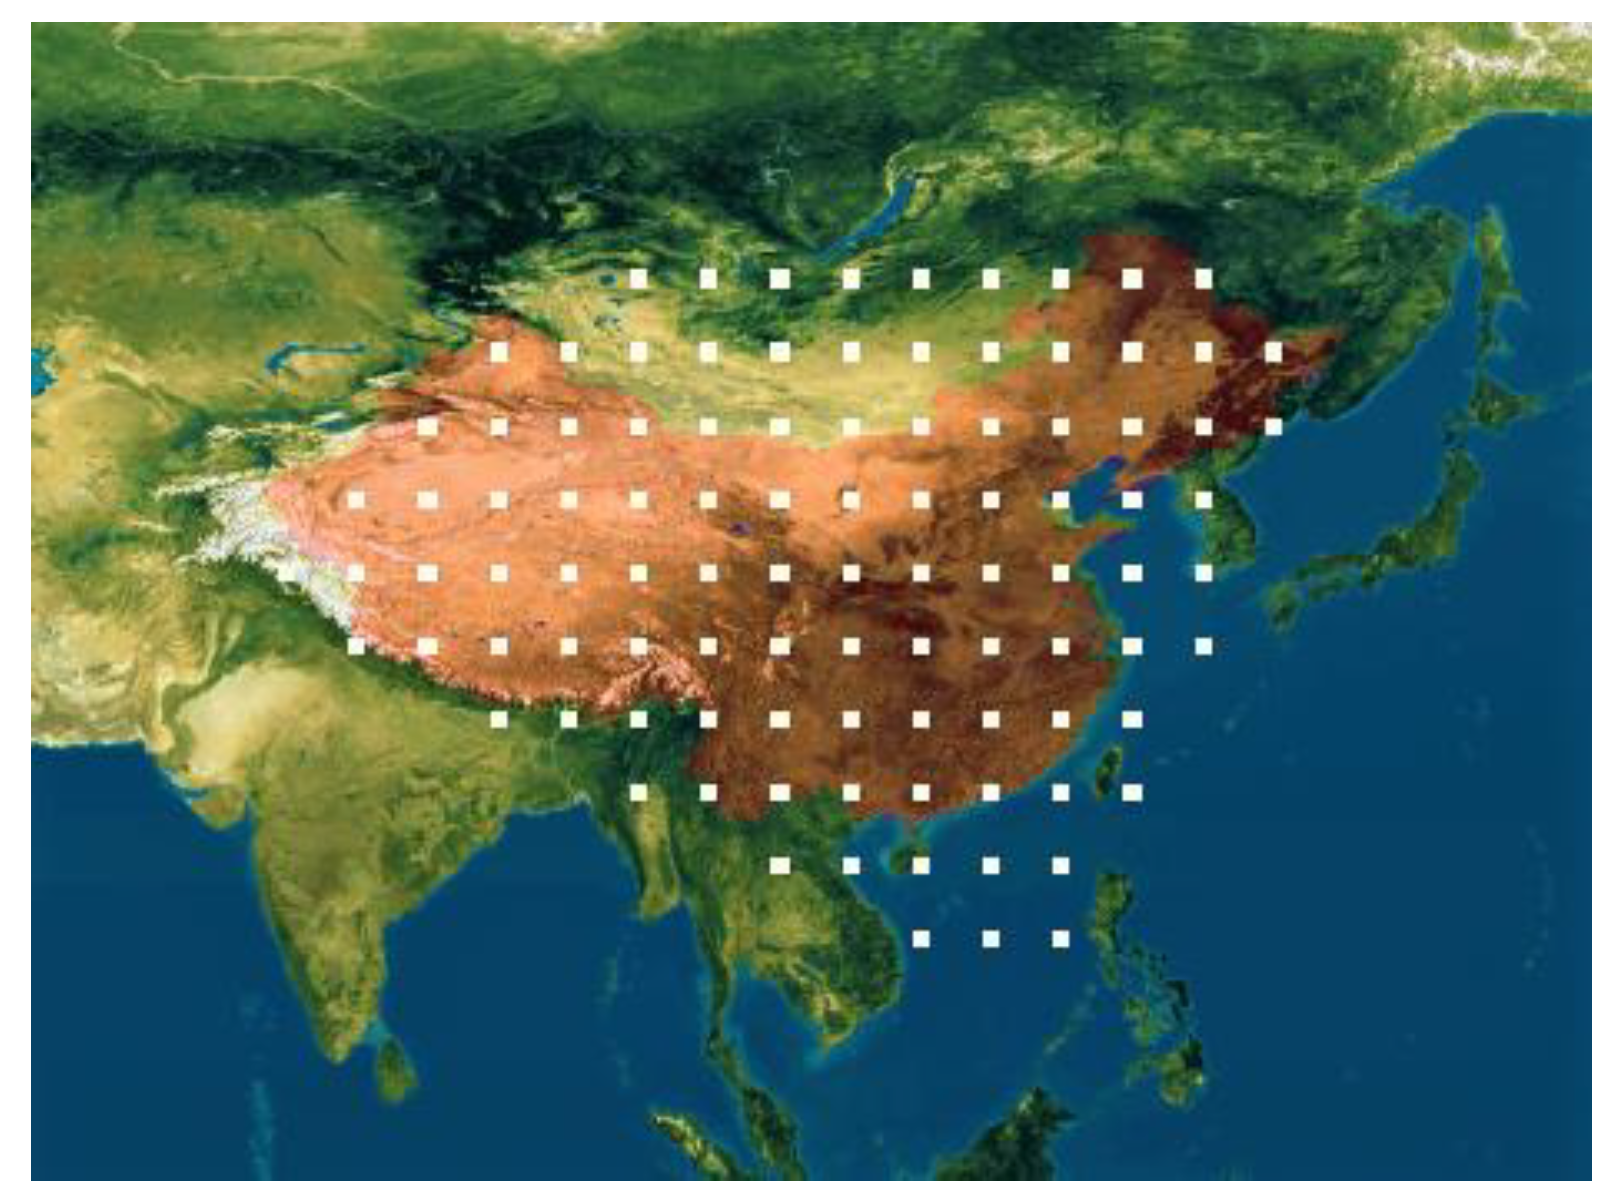
To construct the area target observation scene, China and its surrounding areas were selected. The simulation was next carried out using the grid method, as shown in
Figure 10. The detailed target position generated by the grid method is shown in
Table A2. The simulation started at 0:00 on 1 January 2021 and lasted for 5 days.
Similarly, 500 samples were randomly generated whose value ranges were the same as in
Section 3.1; see
Table 1 for details. Subsequently, batch simulation and effectiveness indices calculation were carried out.
Table 4 provides the input parameters and effectiveness evaluation results of the first five samples.
We analyzed the samples with PCA, and the respective contribution rate of the principal components was
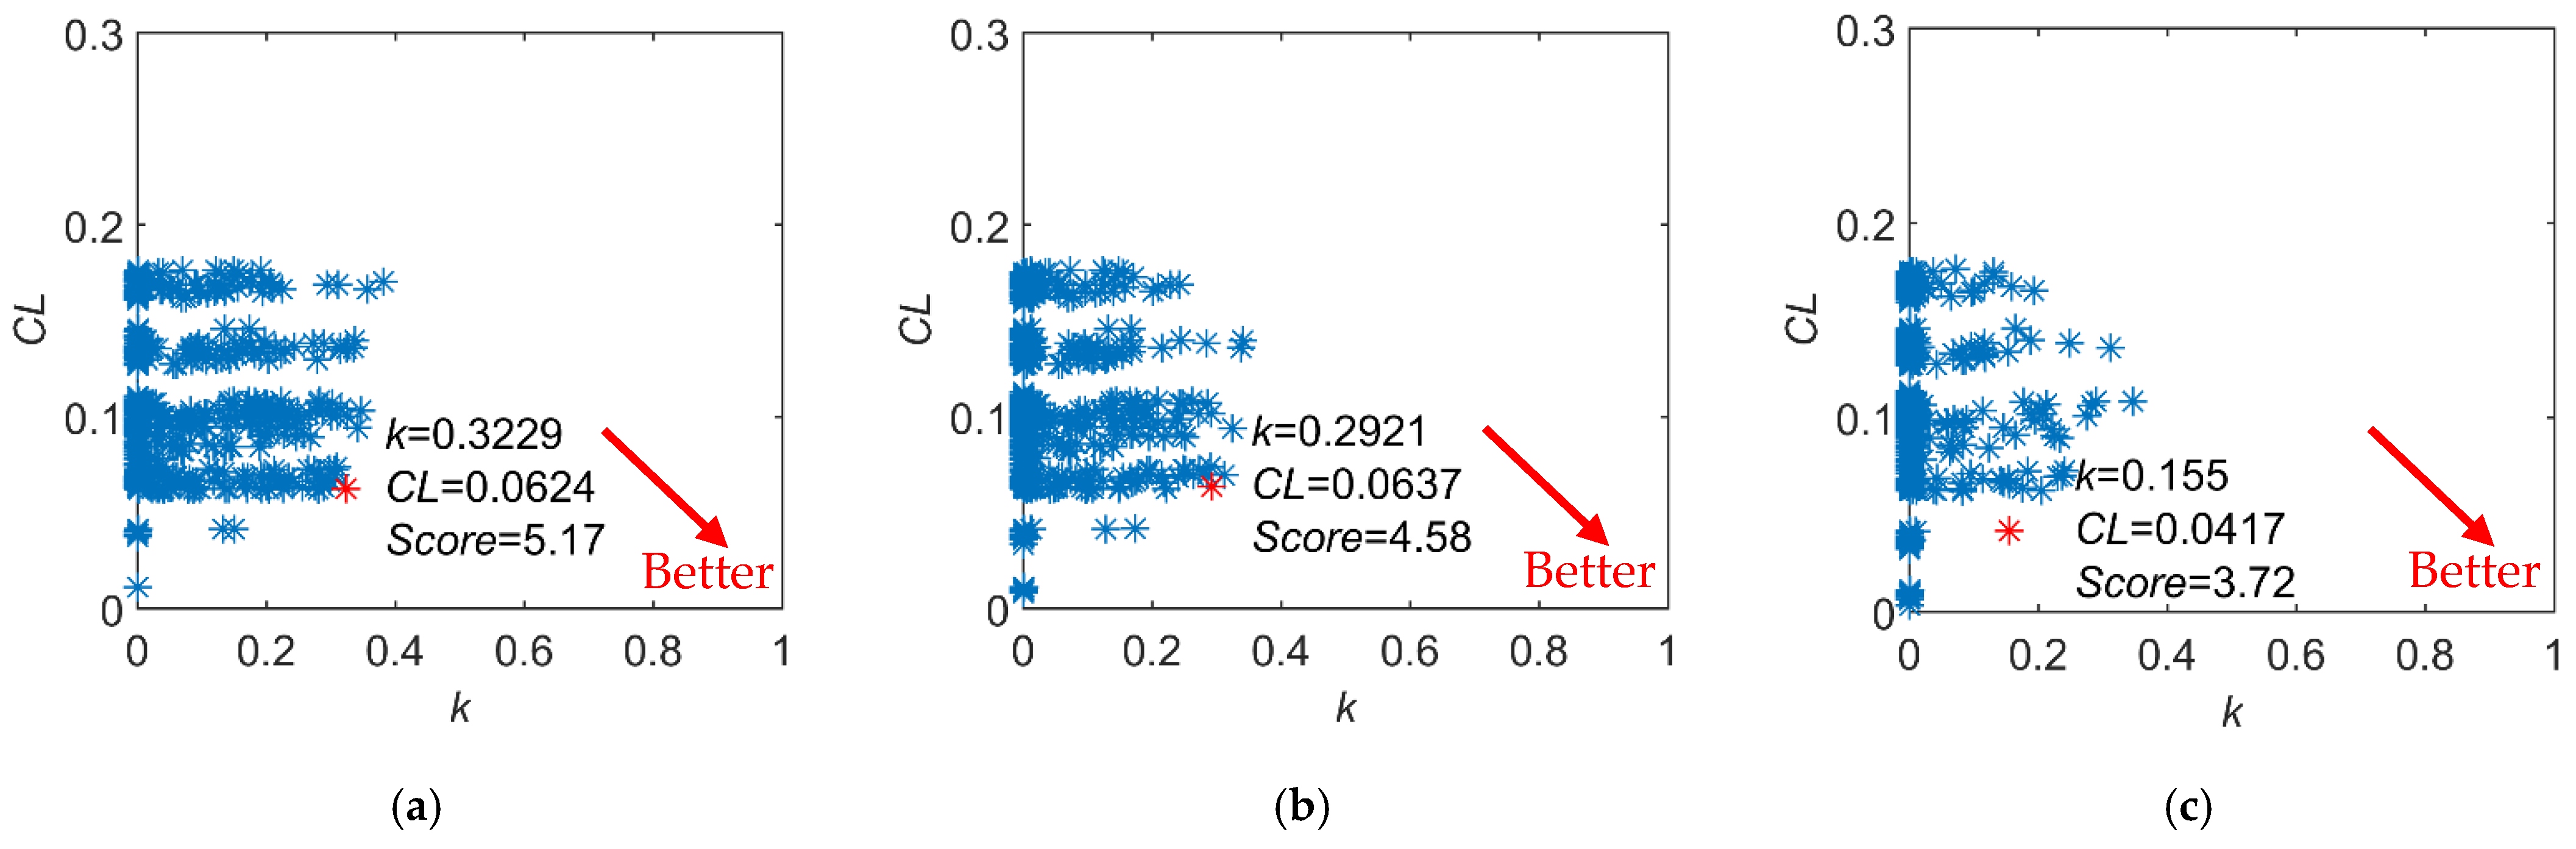
The cumulative contribution rate of the first five principal components reached 96.98%. Hence, the iteration began with = 4. As shown in
Figure 11, we calculated the independence coefficient
, the comprehensive loss rate of the contribution rate
, and the comprehensive score for each index combination. As we can see, when
= 4, the index set achieved the optimal values, where the comprehensive score was 5.17,
= 0.3229, and
= 0.0624. By comparison, when
= 5, the contribution loss rate was almost the same as when
= 4, but the independence was lower; whereas when
= 6, even though the loss in the contribution rate decreased, the independence difference was obvious. As a consequence, the global optimal solution was the optimal index set when
= 4. The optimal index set included four indices, which were T1, S1, S2, and S3.
Regarding the observation efficiency of area targets, we compared several different index system construction methods, and the results are shown in
Table 5. In respect of qualitative methods, all
values are less than 0.09, suggesting that the index systems are of weaker independence as they contained redundant indices. Additionally, all
values are lower than 0.1, indicating a sufficient level of completeness. When comparing the screening results of quantitative methods to those of qualitative methods, the correlation analysis method and the entropy weight method not only significantly improved the independence of the screening results but also have a similar level of completeness. In contrast, the index set obtained using the proposed method in this paper is superior to the other methods mentioned above in terms of independence and completeness.
Eventually, the optimal effectiveness observation index set for remote sensing satellites on area targets was obtained, which contained maximum revisit time, average GSD, observation frequency, and coverage percentage.
3.3. Scene 3: Moving Target Observation Task
The satellite constellation employed in the moving target observation scene was composed of wide-swath satellites and high-resolution satellites. They collaborated to conduct moving target observation tasks. The main parameters of the satellite constellation are shown in
Table 6.
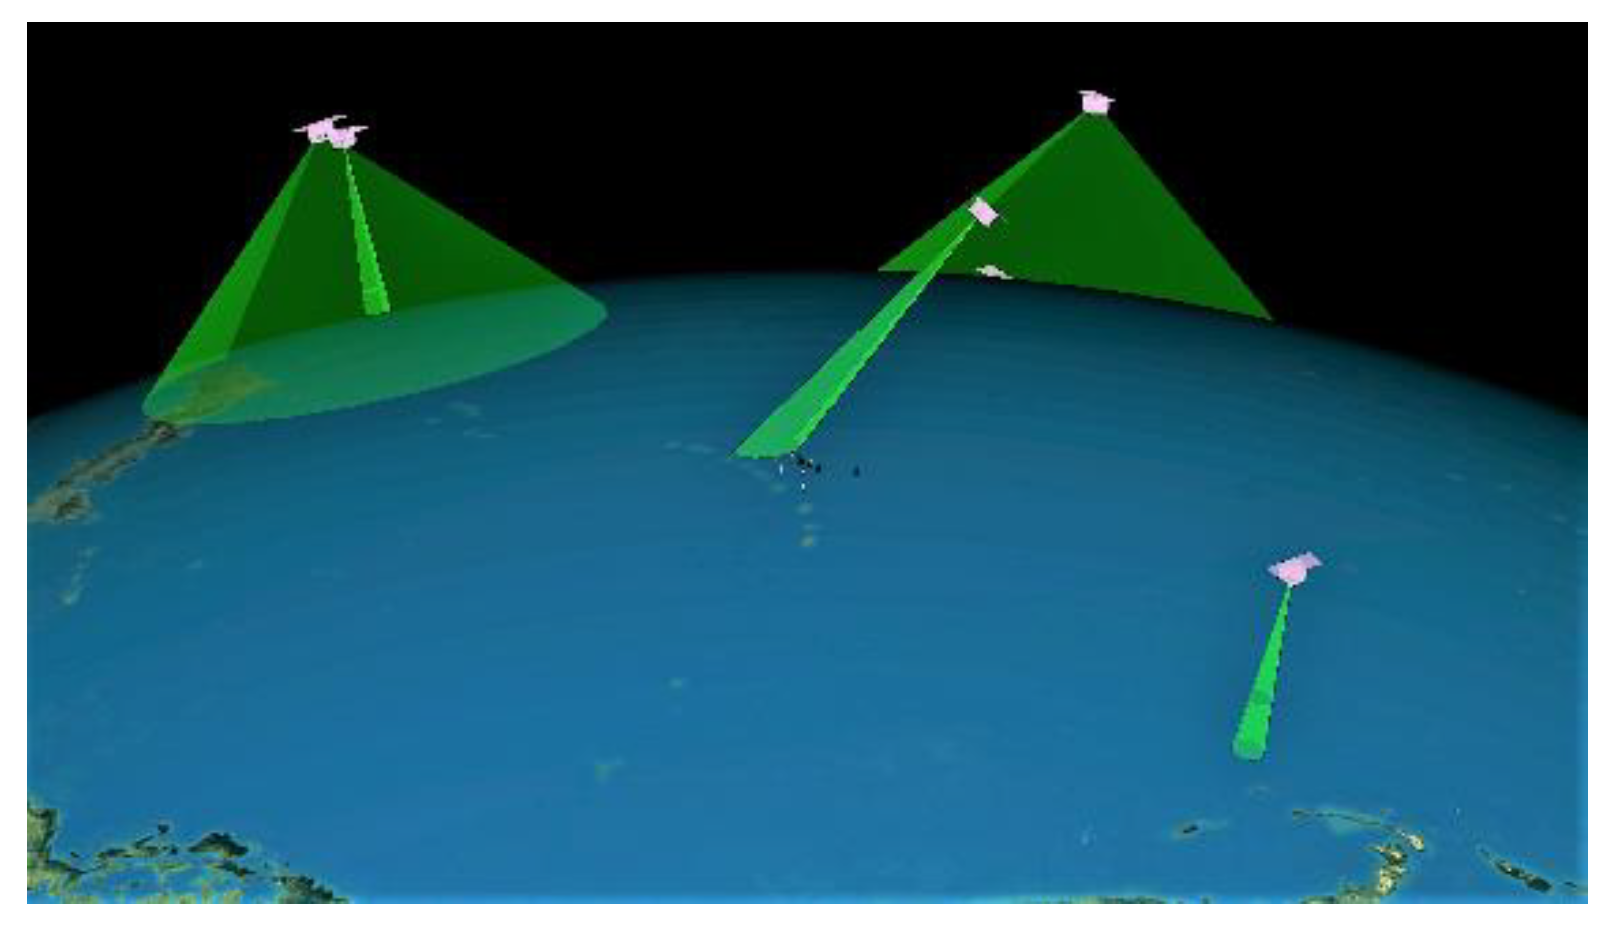
As
Figure 12 illustrates, we selected some ship targets in the sea area of the Asia-Pacific region to construct the moving target observation scene. Every ship target was initially located in a 220 km × 220 km area, where its position, speed, and heading were arbitrary values. The simulation started at 0:00 on a day in 2021 and lasted for 6 h.
We generated 500 samples by picking random values for the task parameters. The task parameters contained time, target, and environmental parameters that have a stronger influence on the task effectiveness [
27]. The range of values for the task parameters is shown in
Table 7.
Next, batch simulation was performed on the 500 randomly generated samples. The simulation results were utilized to complete the evaluation of the effectiveness of remote sensing satellites in observing moving targets. The input parameters and effectiveness evaluation results of the first five samples are listed in
Table 8.
PCA was performed on the samples and the contribution rate of the principal components was
The cumulative contribution rate of the first six principal components was 95.17%. Hence, the number of indices iterated from
= 5, and
different sets of elements for each index layer were generated. As can be seen from
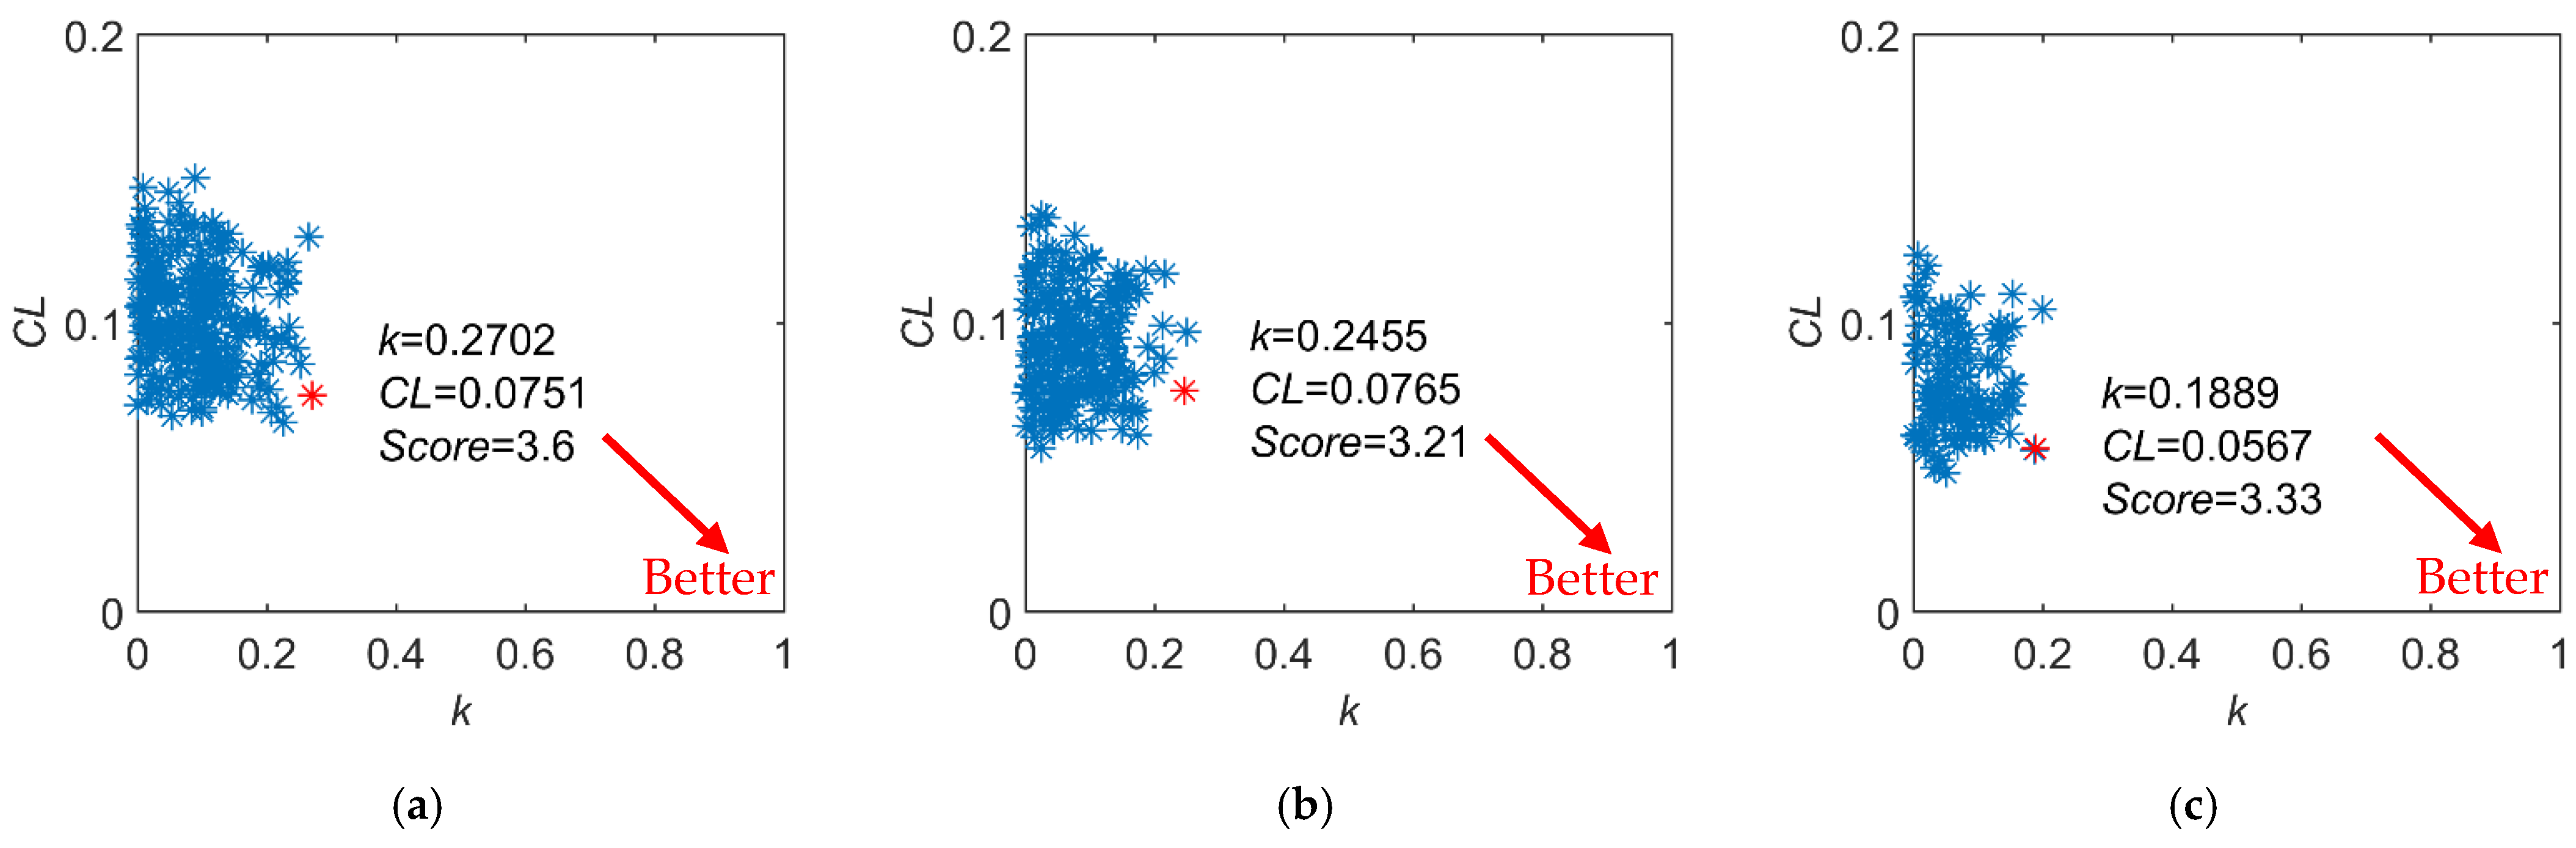
Figure 13, when
= 5, the index set had the optimal values, in which the comprehensive score was 3.60, the independence coefficient was 0.2702, and the comprehensive loss rate of the contribution rate was 0.0751. Comparing the results of
= 5 to
= 6, the contribution loss rate was basically the same while the loss in independence was higher. By comparing the results of
= 5 to
= 7, albeit the contribution loss rate had decreased, the difference in independence was significant. From this experiment, the optimal index set was obtained when
= 5, which was a globally optimal solution that considered the principle of completeness, independence, and simplicity. The optimal index set included indices T5, T12, T15, S4, and S5.
As for the observation efficiency of moving targets, we compared different index system construction methods; the comparison results are shown in
Table 9. In terms of qualitative methods, all
values are lower than 0.08, meaning that the index systems are of lower independence. Meanwhile, the
values are around 0.1, where their completeness is acceptable. With regard to quantitative methods, the screening results of correlation analysis are of a higher level of independence and completeness. On the other hand, even though the entropy weight method produced an index system with the highest completeness, it sacrificed independence, resulting in the lowest comprehensive score. In contrast, although the index set obtained by the proposed method in this paper has slightly lower completeness than that of the entropy weight method, not only is its independence better than the other methods, but it also has the highest comprehensive score.
Lastly, the optimal effectiveness evaluation index set of remote sensing satellites in observing the moving targets was obtained. The optimal index set included indices of minimum observation interval, average discovery response time, average tracking interval, discovery probability, and identification probability.
4. Discussion
Aiming to overcome the problem that the evaluation index system cannot take into consideration all the construction principles, this paper proposed an index system construction method based on quantitative analysis. After screening, an optimal index system that satisfies the principle of completeness, hierarchy, measurability, independence, and simplicity was established, as shown in
Figure 14.
The index system consisted of three layers, which were the system layer, task layer, and index layer, respectively. Without considering the relatively independent indices of spectral resolution and radiometric resolution, the number of indices in the index system decreased from 32 to 13. As compared with the mainstream index system construction and screening methods, it can be seen that the effect of quantitative methods is generally better than qualitative methods. Among them, the independence of the screening results of correlation analysis is better, and the completeness of the screening results of the entropy weight method is better. By comparison, our proposed method can effectively select the least number of indices that conform to the five principles from numerous redundant indices. As compared with conventional research, the index system given in this paper not only improves the completeness but also fulfills the requirements of independence.
Apart from remote sensing satellite effectiveness evaluation, our proposed method is also applicable to other types of satellite as well as other evaluation problems. Unlike the traditional methods, the method proposed can evaluate the index system and hence provide a basis for the screening of an optimal index system. Nevertheless, this method relies on the calculation results of a large number of samples, which in turn increases the requirements for the simulation model and computational resources. In addition, the index screening results are affected by the sample space. The dimension of the sample space and the value range of each dimension will influence the final results.
Future research will be undertaken to include the following areas. Firstly, the system and task parameters that will affect the effectiveness indices can be obtained through data mining. This can improve the quality of the index system and reduce the consumption of computing resources. By using data mining to find out the main influencing factors, the granularity and the sample space can be refined. Meanwhile, the resource consumption of the nonessential elements can be reduced, which hence provides a better index system. Secondly, the collaborative optimization of the index system construction method and the effectiveness evaluation method—the index system must be combined with the evaluation method to give the system’s comprehensive score. Thus, through collaborative optimization, the design process and application process of the index system can be merged to produce a better optimal evaluation criterion. Finally, other effectiveness aspects of the satellite system also deserve further attention, such as the availability and capability of communication links, data processing capability, security, and reliability.


