Article

A Counterfactual Framework Based on the Machine Learning Method and Its Application to Measure the Impact of COVID-19 Local Outbreaks on the Chinese Aviation Market

1
Logistics School, Beijing Wuzi University, Beijing 101149, China
2
Technology Limited China, Beijing 100193, China
*
Author to whom correspondence should be addressed.
Aerospace 2022, 9(5), 250; https://doi.org/10.3390/aerospace9050250
Submission received: 28 March 2022 / Revised: 25 April 2022 / Accepted: 26 April 2022 / Published: 4 May 2022

Abstract

:
COVID-19 affects aviation around the world. China’s civil aviation almost recovered to its pre-epidemic levels in the domestic market, but there are still local outbreaks that affect air traffic. This paper proposes measuring the impact of local outbreaks of COVID-19 by the machine learning method and the synthetic control method as a counterfactual control group to measure such an impact. In this study, we use the LightGBM algorithm to construct a counterfactual control group and transform the prediction problem from time series to the fitting problem at the spatial level. We find that machine learning methods can measure such an impact more accurately. We take local outbreaks in Beijing and Dalian as examples, and our measure of their impacts shows that the impact of an outbreak on intercity air traffic can be divided into lag, decline, stable, and recovery periods, and will last for a long period (more than 40 days) unless there are external stimuli, such as legal holidays. The outbreaks reduced the number of passengers in the cities by 90%. Finally, we show the impact on the air traffic network, and find that when a local outbreak happens in a big city, tourist cities or small stations will be greatly affected.

1. Introduction

International air networks and the number of air passengers have expanded and increased, respectively, dramatically due to globalization and increasingly liberalized bilateral air service agreements (ASAS). Such domestic and international air connectivity allows people to travel around the world easily, stimulating trade and people-to-people exchanges, but it may also facilitate infectious diseases to spread rapidly around the world. International air travel has acted as an important medium to contribute to the fast spread of several pandemics in the past, for example, SARS in 2013 and H1N1 in 2009 [1,2,3]. The COVID-19 outbreak in early 2020 caused significant disruption to economic activity; the aviation market has been hit particularly hard. Scholars have studied the influence of COVID-19 around the world, such as its impact on domestic and international U.S. air travel [4,5,6] as well as policies in or its impact on Europe [7,8,9]. In a study on COVID-19 focused on aviation, Sun et al. [10] reviewed more than 110 items of literature and found that the current research on the impact of COVID-19 on the aviation market is mainly focused on (1) the analysis of the global air transport system during COVID-19 [11,12]; (2) the impact of COVID-19 on the passenger-centric flying experience [13,14,15]; and (3) the long-term impact of COVID-19 on the aviation market [16,17,18,19,20], etc. China was the first country to be hit by COVID-19. Under a number of the controlling measures, the epidemic in China has recovered relatively well, and the resumption of work and production has been carried out simultaneously. However, the epidemic has experienced several stages of rebound due to factors that were beyond control. Zhang et al. [21] plotted the changes in the number of air passengers throughout the year from 2018 to 2020. It can be found that, after May 2020, the overall number of air passengers in China recovered well, and several inflection points of reduced passenger flow all corresponded to local epidemic outbreaks. We further plot air passengers from 2018 to 2021 in Figure 1, which also shows that local outbreaks affect the total air demand.
Therefore, it is obvious that a sudden local epidemic hurts the recovery of the aviation market. With the rapid spread of COVID-19 and the gloomy global situation, local outbreaks are no longer an accident. Studying the impact of local outbreaks on urban air passenger flow can not only guide transportation organizations on the trend of passenger numbers in the future during the epidemic—such as airlines and urban airports being able to provide plans to adjust flight frequency and airport operation as well as maintenance—but also help air passengers make more reasonable travel plans.
The changing of air passengers is uncertain in the context of COVID-19. Therefore, the main problem that we need to study is evaluating the changing of air traffic demand after a city is affected by a local outbreak. In order to exclude the impact of the natural increase in tourists during the recovery period on our assessment, we used a classic research method in economics to regard the outbreak of COVID-19 as a policy variable, and divided the research objects into two groups. The group affected by a local outbreak is the experimental group; by finding a control group not affected by the epidemic policy, we can obtain the treatment effect by finding the difference between the two. Here, we assume that the only difference between this two is the policy. However, the control group is difficult to find in practice. For example, in our study, an outbreak had already occurred in a certain city, so it is difficult for us to obtain a control group that was not affected by the epidemic and had the same changed trend in air traffic as the experimental group. Therefore, economists study the effects of policies by constructing counterfactual experimental groups. The difference-in-differences (DID) method is one of the most widely used methods by scholars [13]. In this method, the areas affected by the policy can be defined as the experimental group, while the areas not affected by the policy can be defined as the control group. Meanwhile, the difference between the experimental group and the control group before and after the policy treatment can be compared. However, for DID research methods, it is difficult to solve the problem of selective bias. Taking China as an example, the geographical location, population, and economic level of cities vary greatly, making it difficult to directly screen out a matched control group. For the deficiency of the DID method, Abadie and Gardeazabal [22] proposed a new method to identify the effect of policies—the synthetic control method (SCM). The synthetic control method also has drawbacks. For example, because the synthetic control method uses a weighted method to synthesize virtual controls, it is largely unable to synthesize “extreme” virtual controls. The defect of the above two methods can be avoided by predicting the changing trend of the experimental group and constructing a counterfactual control group. There is a linear and nonlinear method to predict the changing trend, and the machine learning prediction method is a nonlinear method that can improve the accuracy of counterfactual estimation in recent years [23,24].
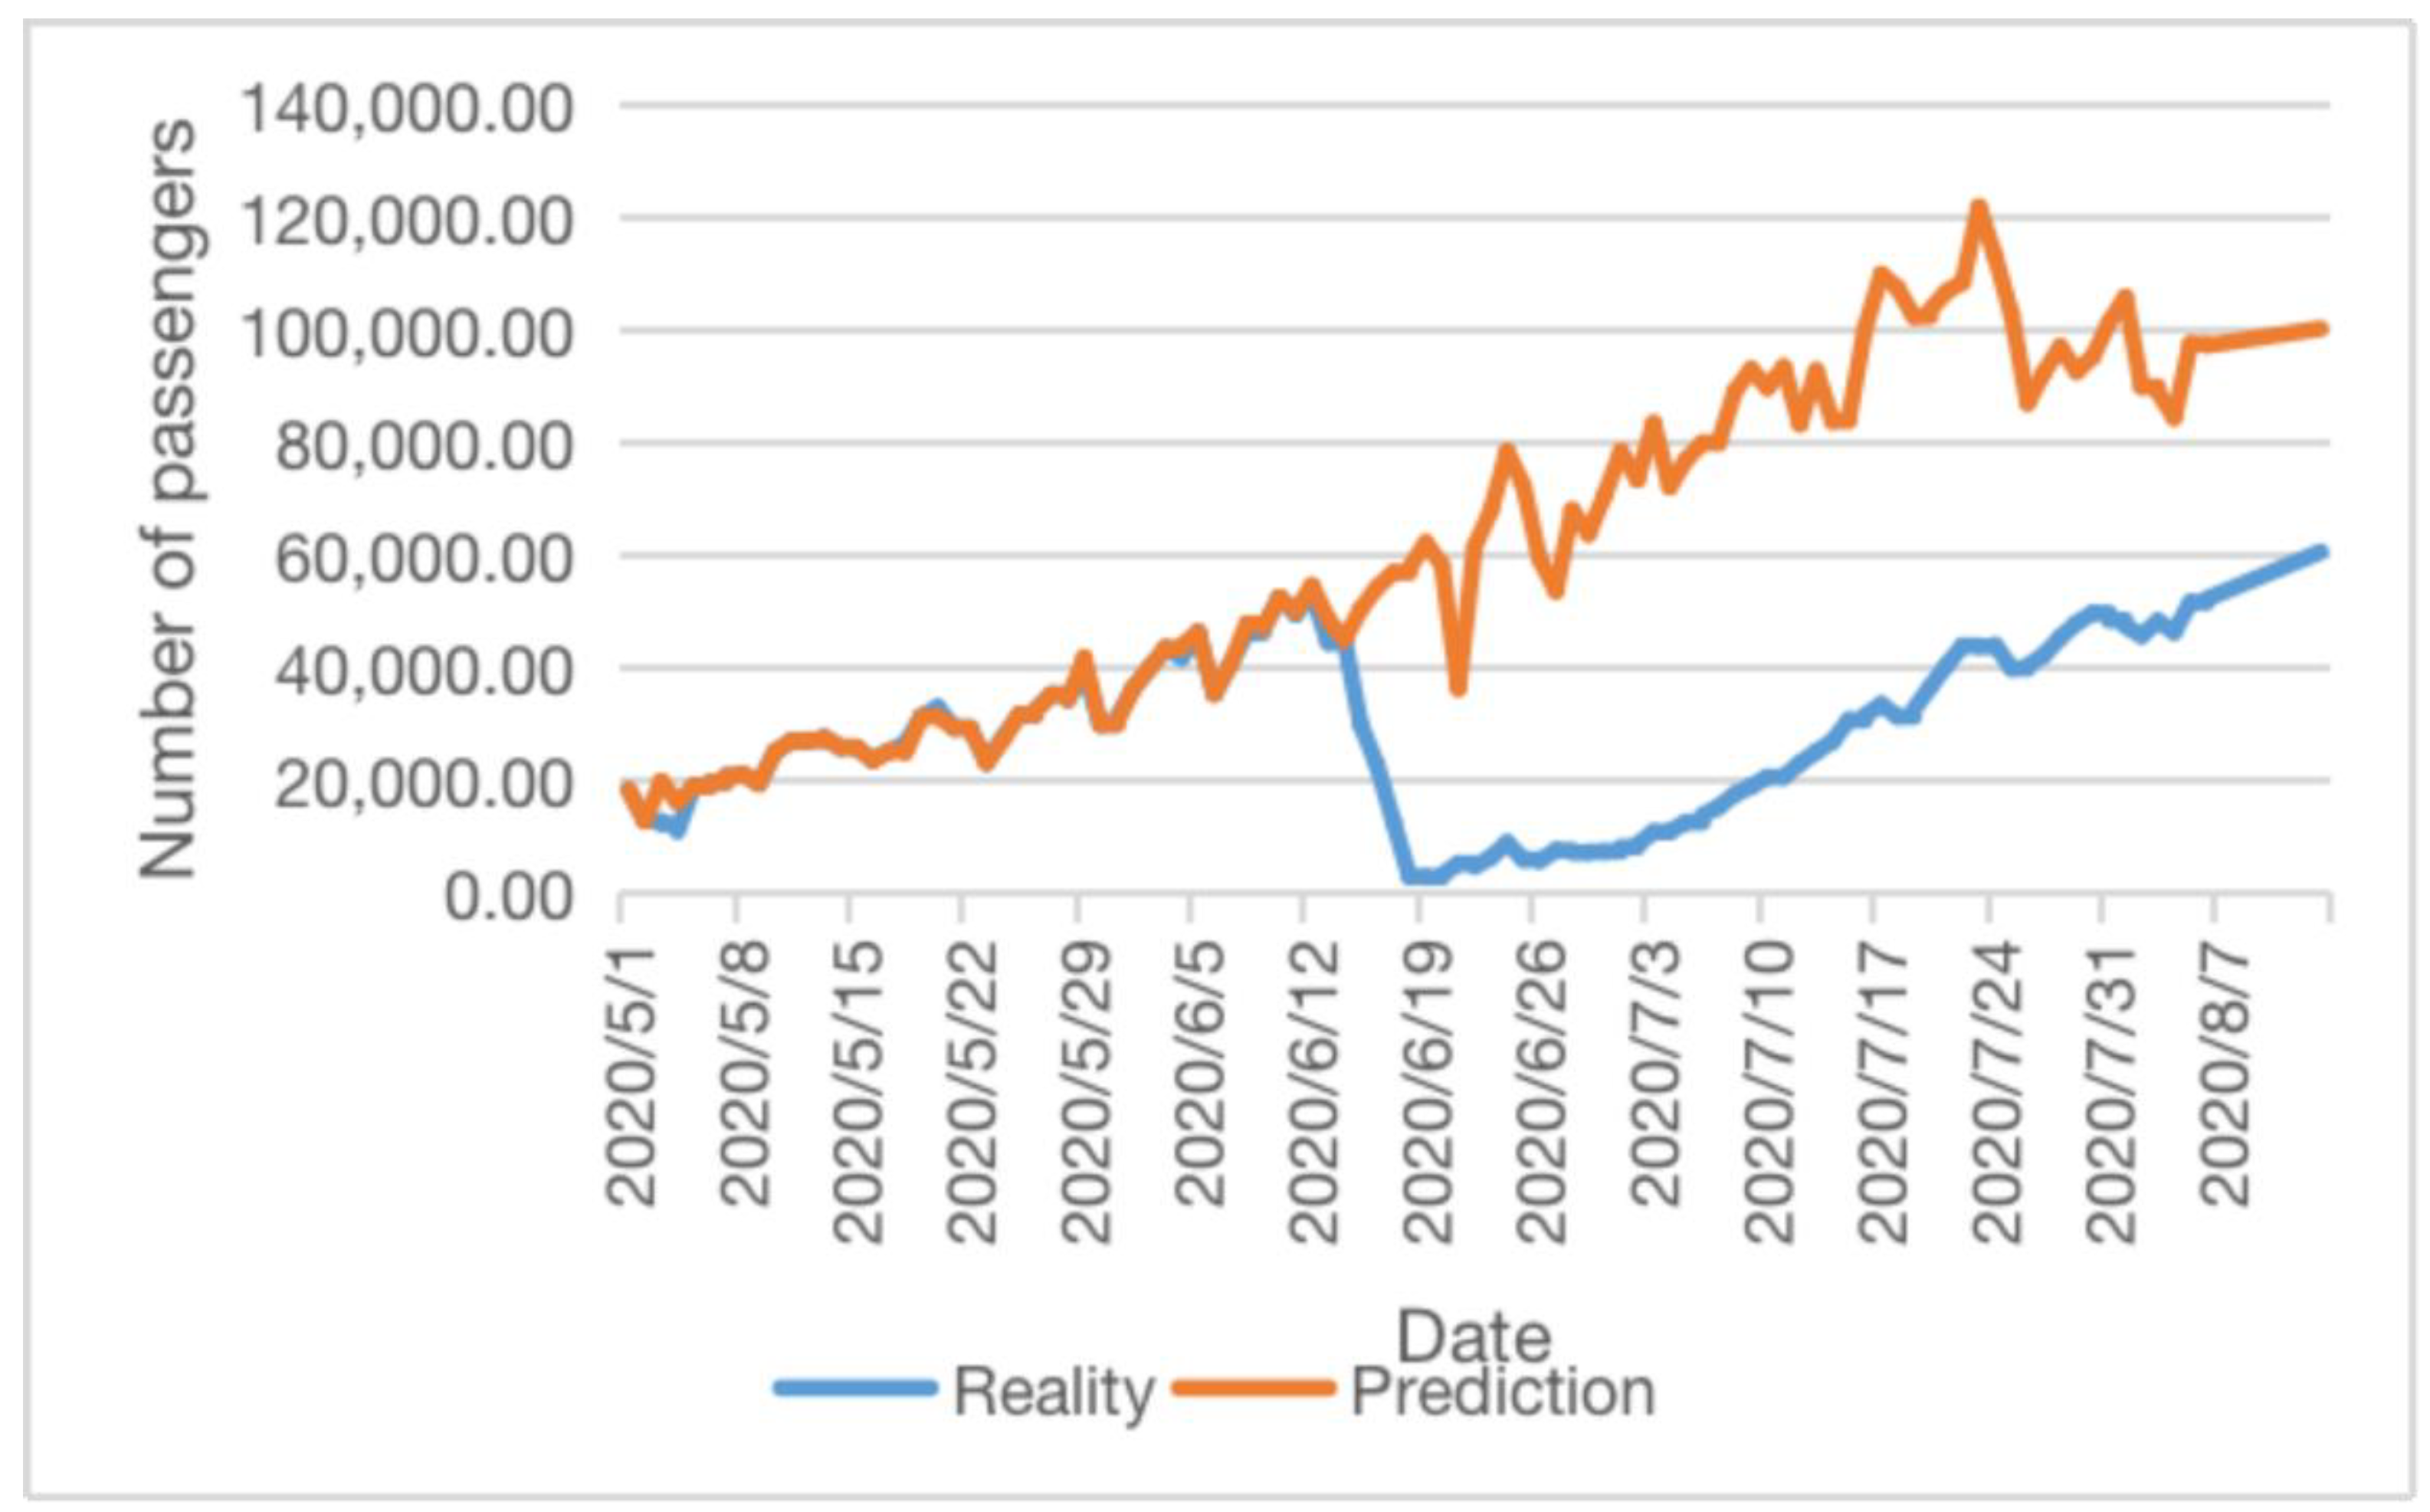
In our study, we used machine learning to predict the air traffic demand of cities and its changing trend in the absence of outbreaks. This group can be seen as a counterfactual experimental group. The impact of a local outbreak on urban air traffic is the difference between the actual air demand and the counterfactual group.
When we use the machine learning method to predict the trend of air traffic in cities with local outbreaks, the following difficulties need to be solved: (1) Due to the incubation period and lockdown policy of COVID-19, the impact of a local outbreak may be long-term, so we need to predict the long-term trend of air passenger traffic as a counterfactual experimental group after a local outbreak through a machine learning algorithm. (2) Due to the lack of historical data and the dramatic growth in the recovery period, it is difficult to make predictions from time series. (3) Air transport is a network structure. Local outbreaks not only affect the inbound and outbound passenger flows of urban airports, but also change the flow at the airline level. In order to solve the above problems, we transformed the prediction problem from time series to the fitting problem at the spatial level. We used the LightGBM algorithm to fit the air traffic demand of target cities through those cities not affected by local outbreaks.
This model has the advantages of fast computing speed, small memory occupation, and difficulty in overfitting, and is suitable for our research background. At the same time, in order to reduce the network’s influence, we need to assume that a sudden outbreak in a city and other cities have spatial dependence, the means of processing and forecasting a dataset are in the training dataset, and we need to remove the stay fit of a city to obtain the clearance between local epidemic breakouts in a city. Moreover, in training, we also need to remove the spatial dependencies associated with an epidemic from a city.
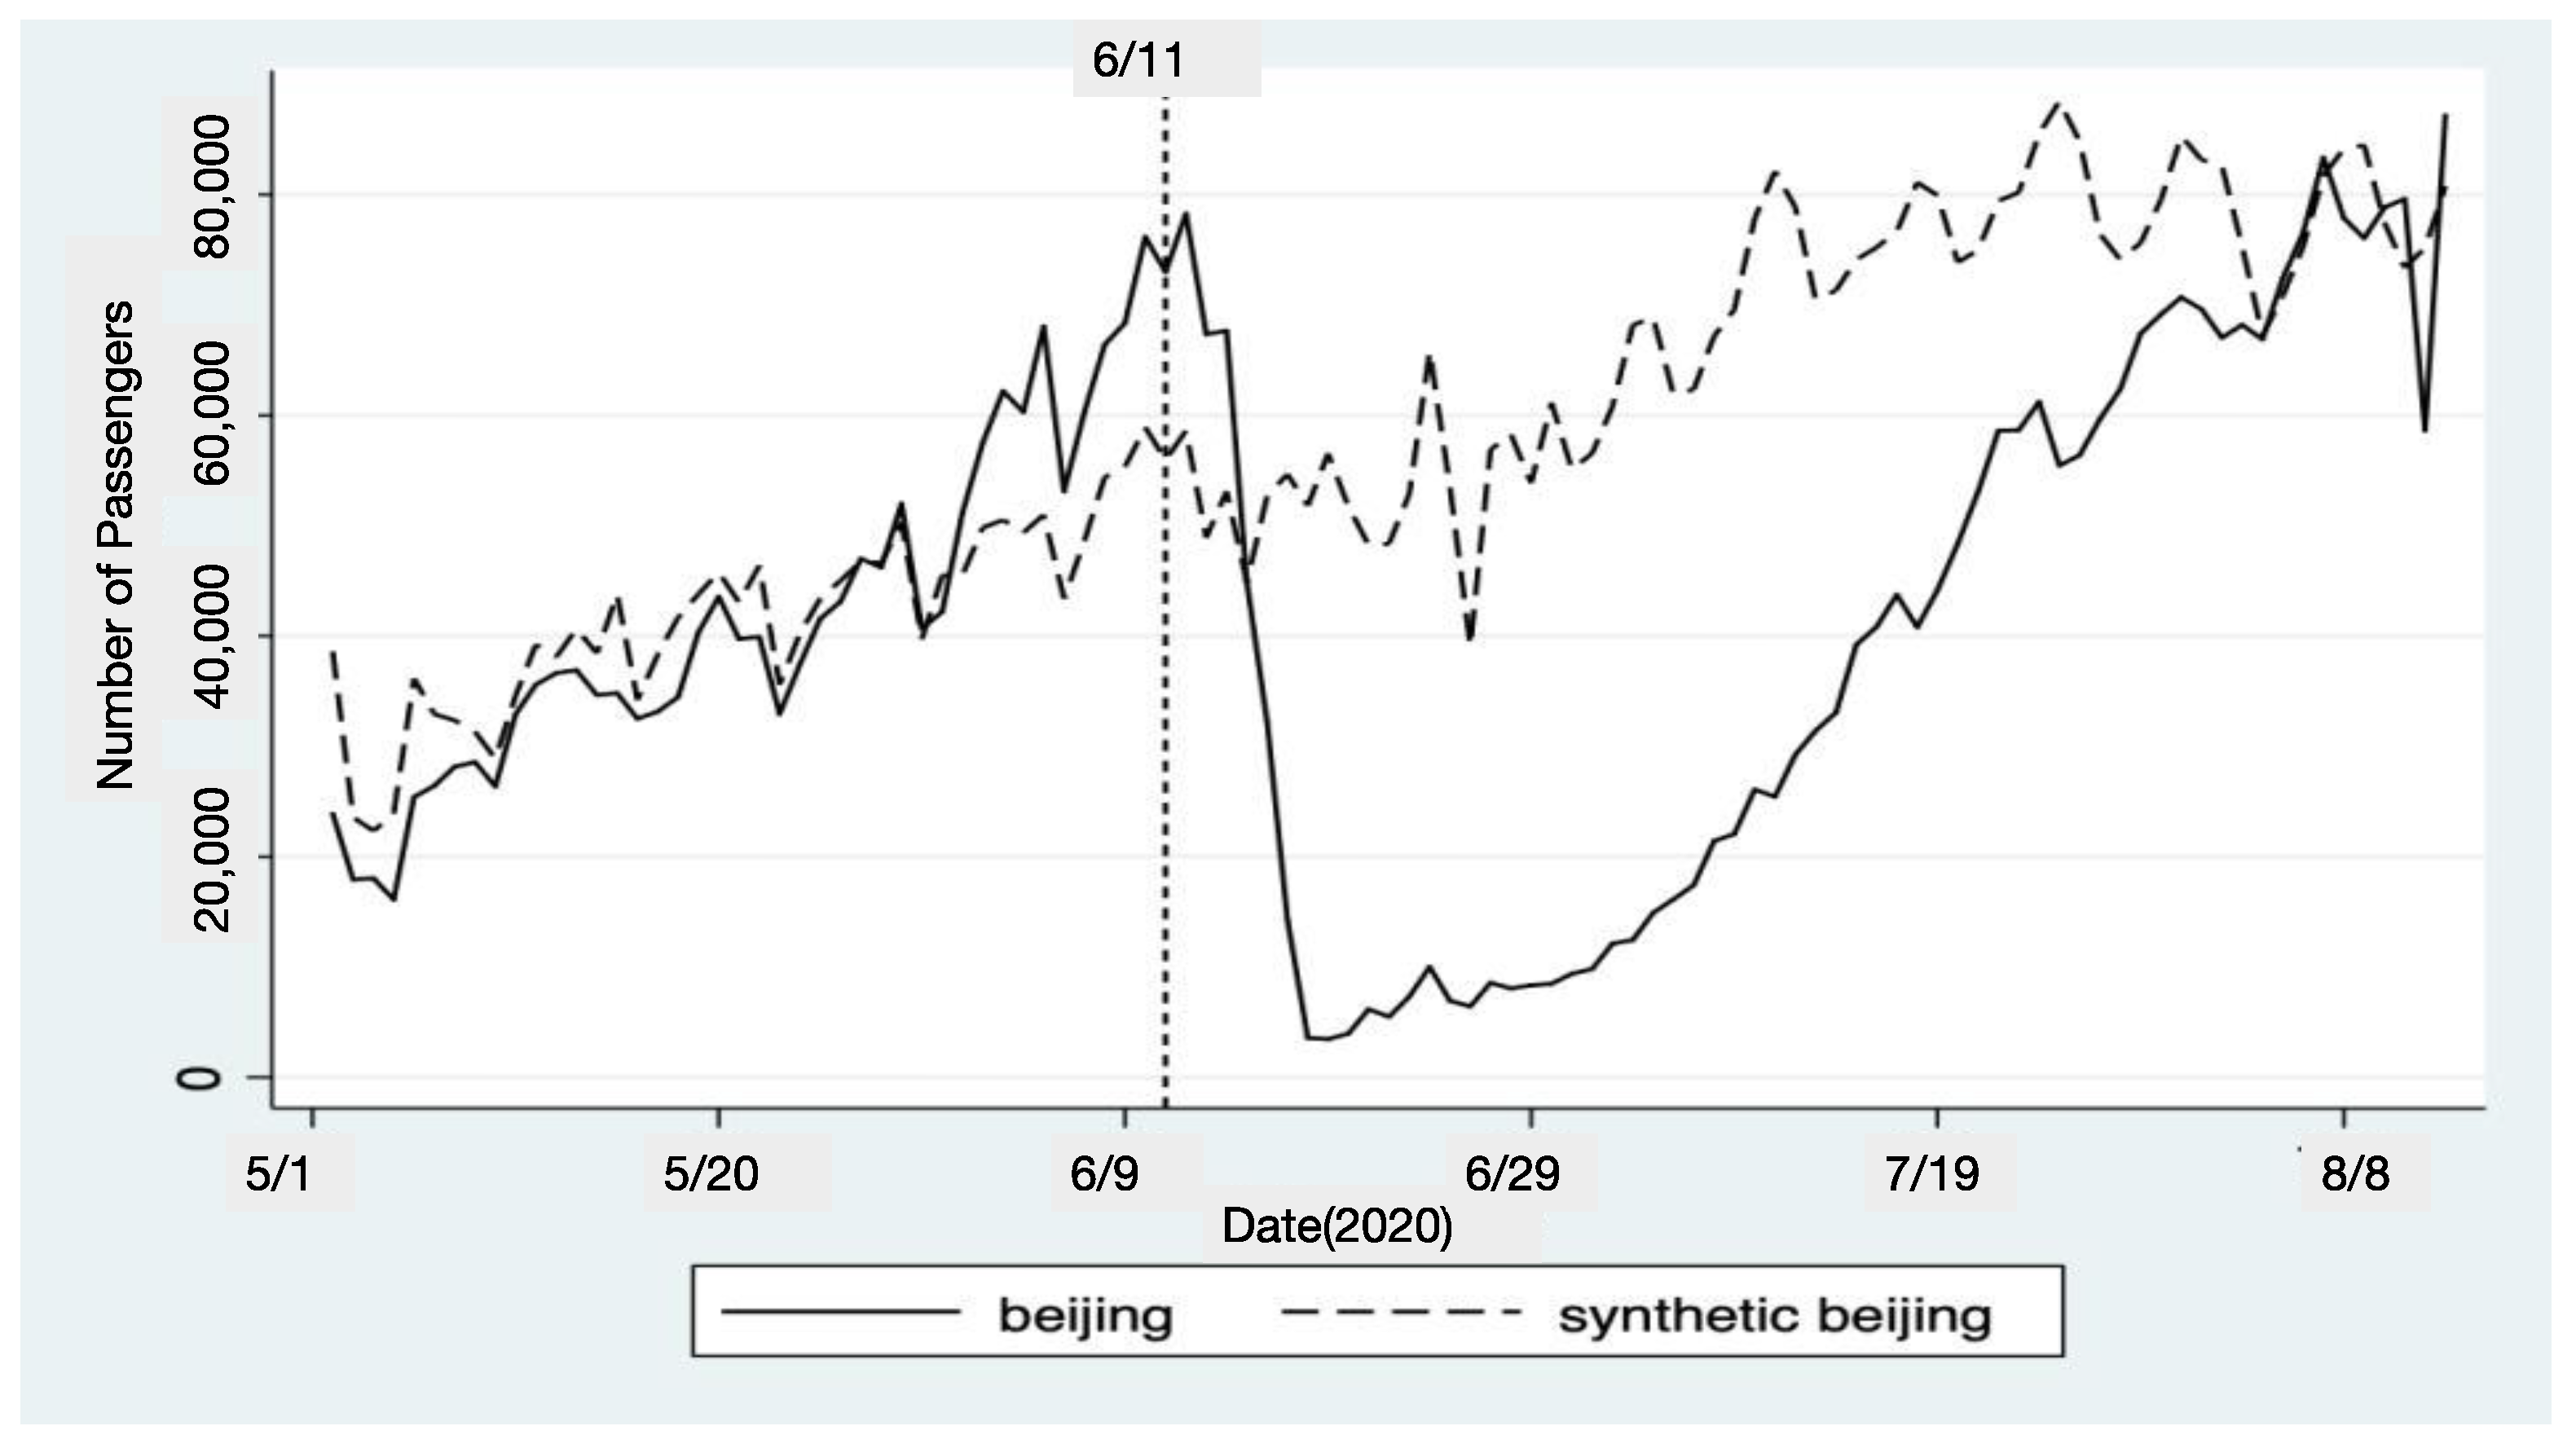
We introduce research on causal inference through the machine learning method into the field of air transportation in this study. We construct a counterfactual experimental group of urban air passenger demand in the case of a local outbreak through the LightGBM method and evaluate the impact of a local outbreak on urban air demand. Finally, we select two local outbreak cities (Beijing and Dalian) as case studies and compare them with synthetic control methods to verify the effect of our policy evaluation method.
The main structure of this paper includes the following parts: Section 2 is a review of the literature. Section 3 introduces the research method, which includes information on how to construct a counterfactual group, how to predict air traffic demand, and how to measure the impact. We select the local outbreaks in Beijing and Dalian as cases that can show the method that we use and the impact that we want to measure. Section 5 is the conclusion.

2. Literature Review

In order to exclude the impact of the natural increase in tourists during the recovery period on our assessment, we use a classic research method from economics to regard the outbreak of COVID-19 as a policy variable, and we divided the research objects into two groups. The difference-in-differences (DID) method is one of the most widely used methods by scholars [13]. The DID method has been widely used in airline competition and policy analyses. For example, Yan et al. [25] and Ma et al. [26] treated an airline merger as a treatment policy and used the DID method to investigate the fare effects of mergers. However, for DID research methods, it is difficult to solve the problem of selective bias in order to solve the problem of selectivity deviation. Abadie et al. [22] developed a synthetic control procedure for estimating the effect of a treatment, in the presence of a single treated unit and a number of control units, with pretreatment outcomes observed for all units. This method constructs a set of weights, such that covariates and pretreatment outcomes of the treated unit are approximately matched by a weighted average of control units. The weights are restricted to be non-negative and total one. The synthetic control method has been widely used in policy evaluation. Borbely [27] applied the synthetic control method to the change in air travel passenger volume under the influence of an air tax. When we regard an emergency as a policy and study its impact on a specific city, we can make an appropriate linear combination of several major cities to construct a better “synthetic control region” and compare a “real city” with a “synthetic city”. For example, Xin et al. [28] studied and estimated the impact of COVID-19 on the daily passenger volume of urban rail transit (URT) through the synthetic control method. However, the synthetic control method also has defects. For example, because the synthetic control method uses the weighted method to synthesize a virtual control group, and the weighted coefficient is one, a virtual control group with an “extreme value” cannot be synthesized.
Therefore, how to obtain a set of counterfactual experimental groups that is closer to reality is one of the difficult problems in the research. In this paper, we construct a counterfactual experimental group by predicting the air demand of a city without a local outbreak and study the impact of an outbreak on the city. In terms of air transportation demand prediction on the country or city level, there exists a large amount of literature. The existing studies that focus on linear forecasting include a variety of univariate, multivariate, and panel regression OLS models [23,29], ARIMA models [30], gravity models [31,32,33], and so on. Although this kind of method has achieved good prediction results, its prediction accuracy needs to be improved for nonlinear cases. The change in aviation demand is nonlinear, so it is challenging research to analyze air demand and its growing trend in the recovery period. These nonlinear methods are mainly based on the framework of machine learning, such as artificial neural networks [34], support vector regression [35], and so on. There are also some machine learning algorithms used in the prediction of road traffic demand, such as long and short memory [36]. Researchers report that the machine learning methodologies adhere more closely to the actual transportation demands of air traffic than the econometric ones. Alekseev and Seixas [37] researched air demand forecasting for Brazil based on simple OLS regression and artificial neural network (ANN) models, and found that ANNs provide more accurate forecasts of future air transportation demand than the econometric models. Srisaeng et al. [38] predicted Australia’s low-cost carrier passenger demand and revenue passenger kilometers (RPKs) performance using traditional econometric and artificial neural network (ANN) methods, and they found that the prediction performance of the ANN model was better than that of the traditional multiple linear regression (MLR) approaches.
There are also some hybrid methods to improve the accuracy of prediction, such as Xie et al. [39] using hybrid seasonal decomposition and least squares support vector regression approaches, which predict short-term air passenger demand; they found that hybrid approaches are better than other time series models.
In addition, various graph neural networks based on the characteristics of air transport networks are also used to predict the number of passengers at the node or route level. ConvLSTM was used to deal with a temporal and spatial network of airlines [40]. However, ConvLSTM is very complex and requires a large amount of training data. With the increase in network depth, the training cost will increase significantly, which limits the depth of the network and the ability to capture a wide range of spatial–temporal correlations. The traffic demand prediction of road networks is also faced with the problem of a short prediction time. Zhao et al. [41] considered temporal–spatial correlations with the LSTM approach in a traffic system via a two-dimensional network for short-term traffic forecasting. However, the network model based on LSTM cannot effectively capture the remote time correlation, so it cannot make long-term predictions.

3. Data Description and Research Method

3.1. Data Description and Processing

The passenger data used in this paper were retrieved from UMETRIP, which is the largest aviation data service company in China. It is a technical company which is jointly operated by China TravelSky Holding Company Limited and TravelSky Mobile Technology Limited. Both are state-owned companies that operate air ticket booking and are integrated with IATA’s global air ticket reservation system. It provides daily air travel service information and monitors more than 12,000 domestic flights in China as well as 60,000 flights every day. For more information, please refer to the following website: https://www.umetrip.com (accessed on 28 April 2022). The database contains the weather and number of air passenger departures from various cities in China from 1 May to 1 October 2020. We also collected the grade data, geographical location, and GDP of urban airports from the Civil Aviation Administration of China and the 2019 urban statistical yearbook. The cities and research periods of the local outbreaks in the study are shown in Table 1.
After a local outbreak affects Beijing, the number of passengers departing from airports on routes connected with Beijing will also change due to the network structure. Therefore, if the city affected by the local outbreak is i, and a city not affected by the local outbreak is j, we divide the number of passengers of city j into two types: the first is the total number of passengers departing from city j, and the second is the number of passengers excluding the air passenger departures from j and arrivals at city i. At the same time, we also introduce factors that affect the number of air traffic volumes in predictions. These mainly include weather, GDP, and the geographical location of the airport.
Weather: Extreme weather may affect the number of passengers. For example, in the case of strong typhoon weather, flights may be canceled, which reduces the number of passengers.
GDP: The GDP of a city can be used as one of the indicators to measure the consumption capacity of a city. The greater the consumption capacity of a city, the greater the possibility of traveling by air.
The geographical location of a city: In this paper, the geographical location of an airport where a city is located is identified according to the air traffic control bureau, which is specifically divided into East China, North China, South China, Central China, northwest, southwest, northeast, and Hong Kong, Macao, and Taiwan. We use these data to exclude the impact of policy differences between different air traffic control bureaus.
We also obtained the data of outbreaks through the statistics of Dingxiangyuan in China.

3.2. Research Method

When portraying the effect of a local outbreak of COVID-19 on aviation demand, we can regard it as a policy variable. When a city suffers from a local outbreak, the number of air passengers departing from a city will be reduced due to restrictive travel policies and a reduction in passengers’ travel willingness. When we quantitatively analyze this impact, we should also consider the dynamic change process of air passengers and the natural growth in the recovery period. In order to eliminate the influence of natural growth, we borrow the idea of a random experiment from economics. We suppose that there are two groups of experimental subjects: one group (the experimental group) is affected by the policy, while the other group (the control group) is not affected by the policy. The only difference between the two groups is the policy, and the treatment effect of the policy is the difference between the two. However, a randomized controlled experiment will have some difficulties in practice. For example, in our study, if an outbreak has occurred in a certain place, there will be no change trend for air traffic in real life. Therefore, economists’ study of the treatment effect of policy by a random experiment was used, and a counterfactual experimental group (control group) was constructed. In our study, the synthetic control method and the machine learning prediction method are used to construct the control group of a counterfactual experiment to study the treatment effect of an outbreak, and the two are compared. Finally, we extended the impact of a local epidemic on a single city to other stations in China.

3.2.1. Definition of Impact

First, we define the impact of a COVID-19 local outbreak. Assuming that a city with a local outbreak is i and the time point of the local outbreak is t 1 , the variation curve of the actual departure demand of air passengers in city i with time t 1 is f i t . The time period, T, we studied is from a t 0 moment before an outbreak to a t 3 moment after an outbreak. If there is no local outbreak in city i, the curve of air passenger departure demand changing with time t is f i t . Therefore, we have f i t = f i t when t ∈ [ t 0 , t 1 ], and f i t = f i t + Impact i t when t ∈ [ t 1 , t 2 ]. Here, Impact i t refers to the changes of departure demand due to the local outbreak of city i. It can be written as:
Impact i t = f i t f i t t t 1 , t 2
Due to the different airport sizes in the outbreak cities, the throughput of air passengers is also different. In order to make the impact values comparable, the relative impact values are calculated as follows:
rImpact i t = Impact i t f i t

3.2.2. Prediction of Counterfactual Group

In previous studies the machine learning method has usually been used for the time series prediction of air passenger demand. The historical dataset is divided into two parts: the first part is the training set, and the second part is the test set. In the training set, the law and logic of the air passenger demand changing trend is obtained, and the prediction error is obtained through the test set. However, COVID-19 in 2020 is an occasional event, and there are relatively few data available since domestic restrictions were lifted in May and aviation demand began to recover. However, when the number of available data is small, the time series prediction also has its limitations. During the recovery period, the departure demand of cities presents a very obvious growing trend. If only a time series prediction is made, the long-term forecast value may be too high. Therefore, we abandon the traditional cyclic neural network algorithm and use the LightGBM algorithm to construct the proportion relationship of passenger flow between the city to be predicted and other cities from the spatial level. The air passenger flow of the local outbreak city, i, was predicted from the spatial dimension and the time dimension at the same time. The characteristics and training time used in the prediction are described in Section 3.1. We want to predict f i t , which is the number of air passengers departing from the local outbreak city, i, and it is also a continuous value prediction problem. This being the case, we have:
f i t = F ( f 1 t , , f m t , β 1 t , , β n t , α 1 i , , α n i )
Here, f i t is a function related to the following three parts: (1) the air passenger number of other cities f 1 t , , f m t ; (2) the external characteristics of other cities, β 1 t , , β n t ; and (3) the external characteristics of city i, α 1 i , , α n i . Since the changing trend of time, T, will affect the prediction results, time, T, is not included in the data training process in our study: that is, for Equation (3), we have F t = 0 . In addition, when we fit the local outbreak city, i, through other cities, the data we use have removed those numbers connected with city i. The training logic is shown in Figure 2:
Here, f 1 , , f m represents the departure demand of selected cities 1 to m, β 1 , , β m is the characteristics reflecting traffic demand, such as the weather, GDP, and so on, and α 1 , , α n are those characteristics that reflect the traffic demand of city i, such as weather, GDP, departure date, and so on. Our training set period is from 1 May 2020 to 5 June 2020, and the test set is from 6 June to 10 June.

3.3. Synthetic Control Method

The synthetic control method allows factors such as the changing over time, or those factors that cannot be observed. We can overcome the control object of sample selection bias and not being observed in other factors caused by the endogeneity problem through synthetic control. The data used in this paper are the air passenger departure data of all airports in China. However, the weather or GDP data are missing for the small cities. Therefore, before conducting research through the synthetic control method, it is necessary to sort out and screen the full data of all cities in China. Firstly, urban airports are classified according to the classification of airport grade by the Civil Aviation Administration of China. The two cities studied in this paper are Beijing and Dalian. Both of the airports in Beijing are 4F-level airports, while Dalian has 4E-level airports. Therefore, airports with a level above 4E are preferentially selected as research objects. On the other hand, due to the small number of flights at airports below 4D and the limited level of airport informatization, the number of passengers on many dates was missing in the process of data collection, and the urban weather record is not perfect. The GDP of small cities is also missing from China’s statistical yearbook, so all 4F and 4E airports, airports, and cities in China are retained in the calculation, as shown in Table 2. For comparison, the variables used in the synthetic control method are consistent with the eigenvalues used in machine learning.
The synthetic control method was first applied in the research of Abadie et al. [22] (2010). In our study, we assume that in the research period, T, there are N + 1 cities, and that the air traffic of city i is affected by a local outbreak. Y it is the real air traffic volume that we can observe after a local outbreak, and Y it N represents the potential outcome without a local outbreak. Suppose that T 0 is the time at which the intervention was applied.
The observed outcome, Y it , in region I at time t can be written in two parts; α it is the estimated effects ( α it ) of the intervention:
Y it = Y it N + α it D it
The potential outcome due to predictors, Y it N , can be written as:
Y it N = δ t + θ t Z i + λ t μ t + ε it
where δ t is a constant factor across all units, Z i is a vector composed of the predictors not affected by the intervention, μ t is a vector of the unobserved predictors, and θ t as well as λ t are two vectors of coefficients. D it is a dummy variable with a value of 1 if unit i is exposed to the intervention, and a value of 0 otherwise. ε it is an error term.
Estimating the effect of the intervention with the synthetic control method requires the creation of a “synthetic control unit”, which is a weighted combination of other units that are not exposed to the intervention. The estimation process for vector W is proposed in the literature [22], as is the significance of the estimation. The estimation of W is achieved by Stata 15.0 using the “synth” command.
At last, the impact of the local outbreak on air traffic is shown in Equation (6):
α it = Y it N Y it

3.4. Goodness of Fit

In the synthetic control method, the outputs of the “synth” command include W, variables’ balance, and the root mean square prediction error (RMSPE). The RMSPE is the average of the root-squared discrepancies between Y it in the treated unit and its synthetic counterpart Y it N during T periods, and is written as follows:
RMSPE = i = 1 T ( Y i t Y i N t ) 2 / T
By comparison, we also get the mean square prediction error (RMSPE) in the LightGBM method:
RMSE = i = 1 T ( f i t f i t ) 2 / T
where ( f i t is the actual number of air passengers departing from city i on the day, t, before the outbreak, and f i t is the number of air passengers departing from city i on the day, t, obtained through the machine learning method.

3.5. Estimation of the Impact on Aviation Network

Assume that a city affected by a local outbreak is i, and that a direct air route between the city to be estimated is j and i. In our research period, t ∈ [ t 0 , t 2 ], the outbreak point is t 1 , so city j will also be affected by correlation when t ∈ [ t 1 , t 2 ].
If the actual volume of air passengers departing from city j is Q j t , t t 0 , t 1 ,   Q j _ i t is the traffic volume of city i without passengers from j to i. In the interval, t t 1 , t 2 , Q j t is the number of passengers actually observed after being affected by the epidemic in city i. The relative influence of city i with an outbreak obtained in the previous paper is rImpact i t .
First, we estimate the air traffic volume between city i and city j if there is no epidemic in city i:
Q i j = Q j t Q j _ i t / 1 rImpact j t t t 1 , t 2
We have the traffic volume of city j without a local outbreak:
Q j t = Q j t / 1 rImpact j t + Q j _ i t t t 1 , t 2
Then, we have a related impact of city i to city j:
RImpact j t = Q j t Q j _ i t 1 Impact j t rImpact i t Q j t Q j _ i t 1 rImpact j t + Q j _ i t t t 1 , t 2
Finally, we have:
RImpact j t = ( Q j t Q j _ i t ) RImpact i t Q j t Q j _ i t RImpact i t t t 1 , t 2

4. Discussion and Result

4.1. Fit Appropriateness

In the synthetic control method, the square root of the prediction error (RMSPE) can be used to determine whether the method is appropriate. When the RMSPE is too large, it proves that the difference between the city to be studied and the synthetic city is large, and that the synthetic control method is not applicable. In this paper, the RMSPE is used to explore the fitting situation of Beijing and Dalian before their outbreaks. The result in the two cities is shown in Table 3. For Beijing, the RMSPE is large, even two orders of magnitude more than machine learning. This proves that, in the pre-epidemic fitting part, this method is not applicable to study the number of air passengers departing from Beijing. The difference of the RMSPE between the two methods is small when studying Dalian, indicating that the synthetic control method can be used to fit the variation trend in Dalian.

4.2. Air Traffic Demand Prediction of LightGBM

When machine learning is used to predict air passenger departures as the control group of counterfactual experiments, the difference between predicted and actual values cannot be known, especially for the prediction of long time series. We compared the predicted number of air passengers departing from Beijing and Dalian after the outbreak in 2020 with the historical number of air passengers departing from the same period in 2019.
According to our forecast, since 1 May 2020 the number of air passengers in Beijing has gradually recovered, as the domestic epidemic was under control and restrictive travel policies have been relaxed. If there were no local outbreaks, the number of air passengers departing from Beijing would have returned to the historical level in mid-to-late July (Figure 3). However, according to the actual results (Figure 1), the number of air passengers departing from Beijing would have returned to the historical level only in the Golden Week of National Day (the Golden Week of National Day is between 1 October to 7 October every year; it is a seven-day vacation). On the other hand, we can see from Figure 3 that the number of air passengers departing from Beijing is relatively stable in the same period of history, and that our predicted value is consistent with it in the long time series, without obvious overestimation or underestimation. As we know, forecasts of air passenger departures from time series can be overestimated by rapid growth rates during the recovery period, and it is difficult to provide stability over time. Therefore, after we abandon the prediction problem of time recursion and shift it to spatial fitting, the predicted value obtained is more consistent with that fact, and it is still stable from the long time series 105.
Similarly, the predicted value of Dalian in 2020 is consistent with the historical level of the same period in 2019 (Figure 4), which proves that our predicted value is stable in the long term.

4.3. The Impact of Local Outbreaks on Air Passenger Volume

4.3.1. The Impact on Beijing

Beijing reported 269 cases of COVID-19 caused by foreign food on 11 June 2020. The number of air passengers in Beijing has dropped sharply with the city’s rising risk level and stricter entry as well as exit policies. We draw the time series of real air traffic and predicted traffic before and after the local outbreak in Figure 5 and Figure 6. The difference between this two is the impact, and it is also dynamic.
By observing the fitted value and the actual value of the number of air passengers in Beijing before the local outbreak in Figure 5 and Figure 6, it can be found that the fitted value of the synthetic control method has a large deviation from the actual value, and the fitting curve obtained by the machine learning method has a better overlap with the actual curve. This is also consistent with the results of the RSMPE of the two methods. The machine learning method is superior to the synthetic control method for constructing the counterfactual group of air passenger volume in Beijing. This is mainly because the synthetic control method treats the weighted combination of selected cities, and the weighted coefficients add up to one. Therefore, a better fitting value cannot be obtained when the outcome is the largest among all of the research objects, such as Beijing Airport being the busiest airport in China. As the capital of China, Beijing has two 4F-level airports, namely Beijing Capital Airport and Beijing Daxing Airport, ranked first in terms of land area and population economy. The only city likely to match Beijing in terms of air passenger departures is Shanghai. Shanghai also has two airports, namely Shanghai Pudong Airport and Shanghai Hongqiao Airport. One of them is a 4F airport and the other is a 4E airport. However, through previous research on the siphoning effect in the Beijing–Tianjin–Hebei region and the Yangtze River Delta, it was found that Beijing Airport has a strong siphon effect on surrounding cities, but that Shanghai does not. The final model results also showed that the cities that used to fit Beijing before the outbreak, in addition to their weights, were Shanghai (0.844) and Harbin (0.156). However, considering the passenger carrying capacity of the airport and the travel intentions of the passengers around the city, the number of air passengers departing from Shanghai may be smaller than that of Beijing, which also leads to the underestimation of the fitting value given by this combination by about 20,000 people before the outbreak of the epidemic. In addition, due to those geographical and economic reasons, the number of Beijing’s aviation passengers grew faster in the recovery period, so we cannot obtain a suitable “synthetic Beijing” fitting of other cities.
After the outbreak of the epidemic, the overall value and changing trend of the Beijing air passengers fitted by the synthetic control method were lower than those fitted by the machine learning method. This is mainly due to the two following reasons: First, the goodness of fit of the synthetic control method was very low before the epidemic. Especially after 20 May, when the number of air passengers in Beijing increased significantly, the fitted value was completely separated from the actual value, and both the actual number and growth trend of air passengers were lower than the actual value. Second, the overall growth trend of the “synthetic Beijing air passenger flow curve” fitted by the synthetic control method is linear, which leads to a large deviation between the two when the actual Beijing air passenger flow increases substantially. With the underestimated synthetic control method, the air passenger volume of Beijing obtained by the fitting coincides with the actual air passenger volume in our research period. The number of air passengers at the overlap is about 80,000. This means that, when studying the impact of the outbreak on air passengers in Beijing through the synthetic control method, the impact of the outbreak on the number of air passengers in Beijing disappeared on the 50th day after the outbreak. However, there is still a big gap between the actual value obtained by machine learning and the predicted value. The predicted air passenger throughput of Beijing is 100,000, which is still nearly 40,000 more than the actual air passenger throughput of Beijing. The predicted results show that the impact of the outbreak on air passengers in Beijing is more long-term.

4.3.2. The Impact on Dalian

According to the result of the RMSPE, this model can be used to study the local outbreak in Dalian. The changing trend of air passengers when the outbreak happened on 22 July 2020 in Dalian is shown in Figure 7 and Figure 8. After the outbreak in Dalian on 22 July, we can see that the trend of the control group fitted by the synthetic control method is lower than that predicted by the machine learning method. According to the predicted value of Dalian in 2020 and the actual outbound volume in 2019 observed in Section 4.1, we believe that the machine learning method does not overestimate the traffic volume. From the perspective of the synthetic control method, according to the calculation results reported by Stata, the cities that synthesized the air passenger flow of Dalian on the day before the epidemic were 27.7% from Harbin, 19.4% from Taiyuan, 1.7% from Wuhan, 35.2% from Yantai, 10.4% from Yangzhou, and 5.6% from Shanghai. The traffic volume departure from Dalian increased rapidly in the middle of July, but the combined traffic volume of these cities did not have such a growth trend, which eventually led to the underestimation of the traffic. This may be because the synthetic control method is only a linear weighted combination of other cities and cannot take into account the flow changes caused by some urban characteristics. From the change curve of our actual air departure volume, we can see that, after entering July, the number of air passengers increases rapidly, and this is the peak season of Dalian as a coastal tourist city. Because the characteristic function we added in machine learning includes the traffic change trend of holidays, the number of passengers in Dalian increases rapidly in the prediction. However, among the cities used to fit Dalian in the synthetic control method, Yantai is the only city affected by season and tourism characteristics, which cannot show the changes of Dalian well. Of course, this difference may also be caused by a slight deviation in the data that we used. In the synthetic control method, our original data are domestic airports above 4C in China, but for the machine learning algorithm, the data we use are the whole of China. Synthetic control methods need high-quality data, but machine learning does not. Finally, we can see that, due to the underestimation of the passenger flow by the synthetic control method, the impact of the decline in the number of passengers caused by the outbreak has disappeared on the 60th day after the outbreak, but there is still a certain quantity difference between the actual Dalian air passenger flow and the air passenger flow predicted by the machine learning method (excluding the fluctuation value) 60 days after the outbreak. This is also consistent with our research on Beijing.
Another advantage of the machine learning method in predicting air transportation demand is that external variables such as weather can be considered in the prediction process. For example, from Figure 7 and Figure 8 the predicted values of the machine learning method and synthetic control method after 20 August can be seen. The air passenger flow predicted by machine learning shows a downward trend after 20 August and reaches a peak between 26 August and 2 September. The synthetic control method is in sudden decline at a certain point in time. This is mainly because, in the machine learning method, the prediction of air passenger flow is still a multidimensional problem. In addition to considering the change in air traffic in the fitting city, it also takes the weather as the influencing factor. In the fitting process before the epidemic, machine learning obtained the logic that bad weather will reduce air passenger flow. Therefore, when many typhoons transit after 20 August, machine learning predicts that this bad weather will lead to a large number of flight cancellations or delays, resulting in a sharp decline in the number of air passengers. Of course, there is also a decline in the flow in the synthetic control method, which may be due to the transit of typhoons, which also reduces the passenger flow of some cities used to fit Dalian, but this change is mainly related to the flow of the fitting city and cannot directly reflect the change in weather.

4.4. Impact of Local Outbreaks on Urban Air Passengers

As mentioned before, the machine learning method is better than the synthetic control method as a counterfactual group, and we use the machine learning method to obtain the impact of air passengers in this study. In order to see the changing trend more clearly and eliminate the influence of prediction noise, we smoothed all of the predicted values by five points and plotted the affected and relatively affected air passenger volumes in Beijing and Dalian in Figure 9 and Figure 10. As shown in Figure 9, the outbreak reduced the number of air passengers departing from Beijing by 70,000 to 80,000, and reduced the number of air passenger departures from Dalian by 20,000 to 25,000. With the epidemic situation under control, there is still a gap of 50,000 to 60,000 passenger departures from Beijing and 5000 from Dalian within our research period. Considering the two together with the overall flow of China in 2020 in Figure 1, it can be reasonably speculated that, if there is no local epidemic, the number of air passengers in China may return to or exceed that at the same period in history at the end of August.
As the outbreak time in each city is different, we plot the time series relative impacts of Beijing and Dalian in Figure 10, and uniformly set the outbreak node as day 42. The specific outbreak time and the diagnosis of the epidemic in each city are shown in Table 4. From the relative influence value, it can be found that Beijing and Dalian have certain commonalities. For the first three days after the outbreaks, the predicted values and the actual numbers of passengers departing from the airports are basically the same. At this time, the impact of the outbreaks is close to zero, which is mainly due to the lag in information reception. The affected value of passenger flow reaches its maximum at 7 days after the outbreak, and the number of air passengers in both cities falls by more than 90%. This is also the stage when air travel is restricted by the epidemic. Airlines have been subject to a series of travel restriction policies, including, but not limited to, the closure of some communities, residents in medium- and high-risk areas not being able to leave the city, flight cancellations, etc. In addition, the peak impact of the epidemic lasted for a long time. This is because the outbreak not only reduced the willingness of passengers to travel, but also changed the risk levels of cities. The last commonality is that, after the epidemic has been completely controlled, the outbreaks in Beijing and Dalian still reduce the numbers of departure passengers by 30% to 40%.
We can define that there are lag, decline, stable, and recovery periods after the local outbreaks. Compared with the duration of the epidemic in Table 3, we found that the decline period in Dalian is strictly consistent with the duration of the epidemic. The number of air passengers begins to recover as the epidemic is completely over, which is mainly because of the restrictive travel policies in Dalian. However, the number of passengers at Beijing Airport beings to recover on the 23rd day after the outbreak. This is related to the particularity of Beijing. As the capital of China, Beijing has a large area, from land to population. According to the classification of risk level, Beijing’s non-high-risk areas can still be released. When COVID-19 is under control, the air demand will recover early in those areas without high risk. Finally, the impact of the outbreak has a huge long-tail effect.

4.5. Impact of Local Outbreaks on Passengers on Air Routes

According to Equation (12), we calculate the impact of outbreaks in Beijing and Dalian on air routes and plot the dynamic values in Figure 11 and Figure 12. The peak impact of the Beijing epidemic on the aviation network is on the sixth day after the outbreak. Compared with Beijing itself, the impact on networks shows more of a lag period. The cities most affected were Sanya and Guilin. The number of air passengers departing from these two cities decreased by 45% due to the Beijing epidemic. Sanya and Guilin are both tourist cities in China, which proves that a local outbreak has a great impact on the tourism industry. In our research period, the city with the greatest long-term impact is Ordos, followed by Sanya, Harbin, Yinchuan, and Guilin, which are tourist cities or small stations in China. When an epidemic breaks out in Beijing, round-trip flights are canceled or tourism demand is restrained, and the outbound demand of these cities will be greatly affected. Especially for these small stations, they have few navigable cities, and Beijing is one of their main navigable cities. When a flight is cancelled due to the epidemic, air traffic will be greatly affected. For those cities with more daily round trips connected to Beijing, such as Shanghai, they are only affected greatly in the early stage, and they may recover due to better scheduling, coordination ability, and the large demand for departures. Therefore, for a big airport, the long-term impact of an outbreak is relatively small.
For Dalian, because it is an airport of a prefecture-level city, the number of navigable cities and flights is small, it has little impact on the whole aviation network. The impact of an outbreak in Dalian on its direct cities is less than 15%.

5. Conclusions

We describe the impact of COVID-19 local outbreaks on air demand by constructing a counterfactual framework. In the research, we constructed a control group of the counterfactual group through the synthetic control method and machine learning method at the same time. In the comparison between the synthetic control method and the machine learning method, we found that the synthetic control method cannot study Beijing, a city with a special population, economy, airport composition, and urban scale. For prefecture-level cities, such as Dalian, the synthetic control method is feasible, but it cannot match the impact of weather and other external characteristics on air traffic. Through machine learning, the air demand of the experimental group is closer to the fact, and the influence impact is more accurate.
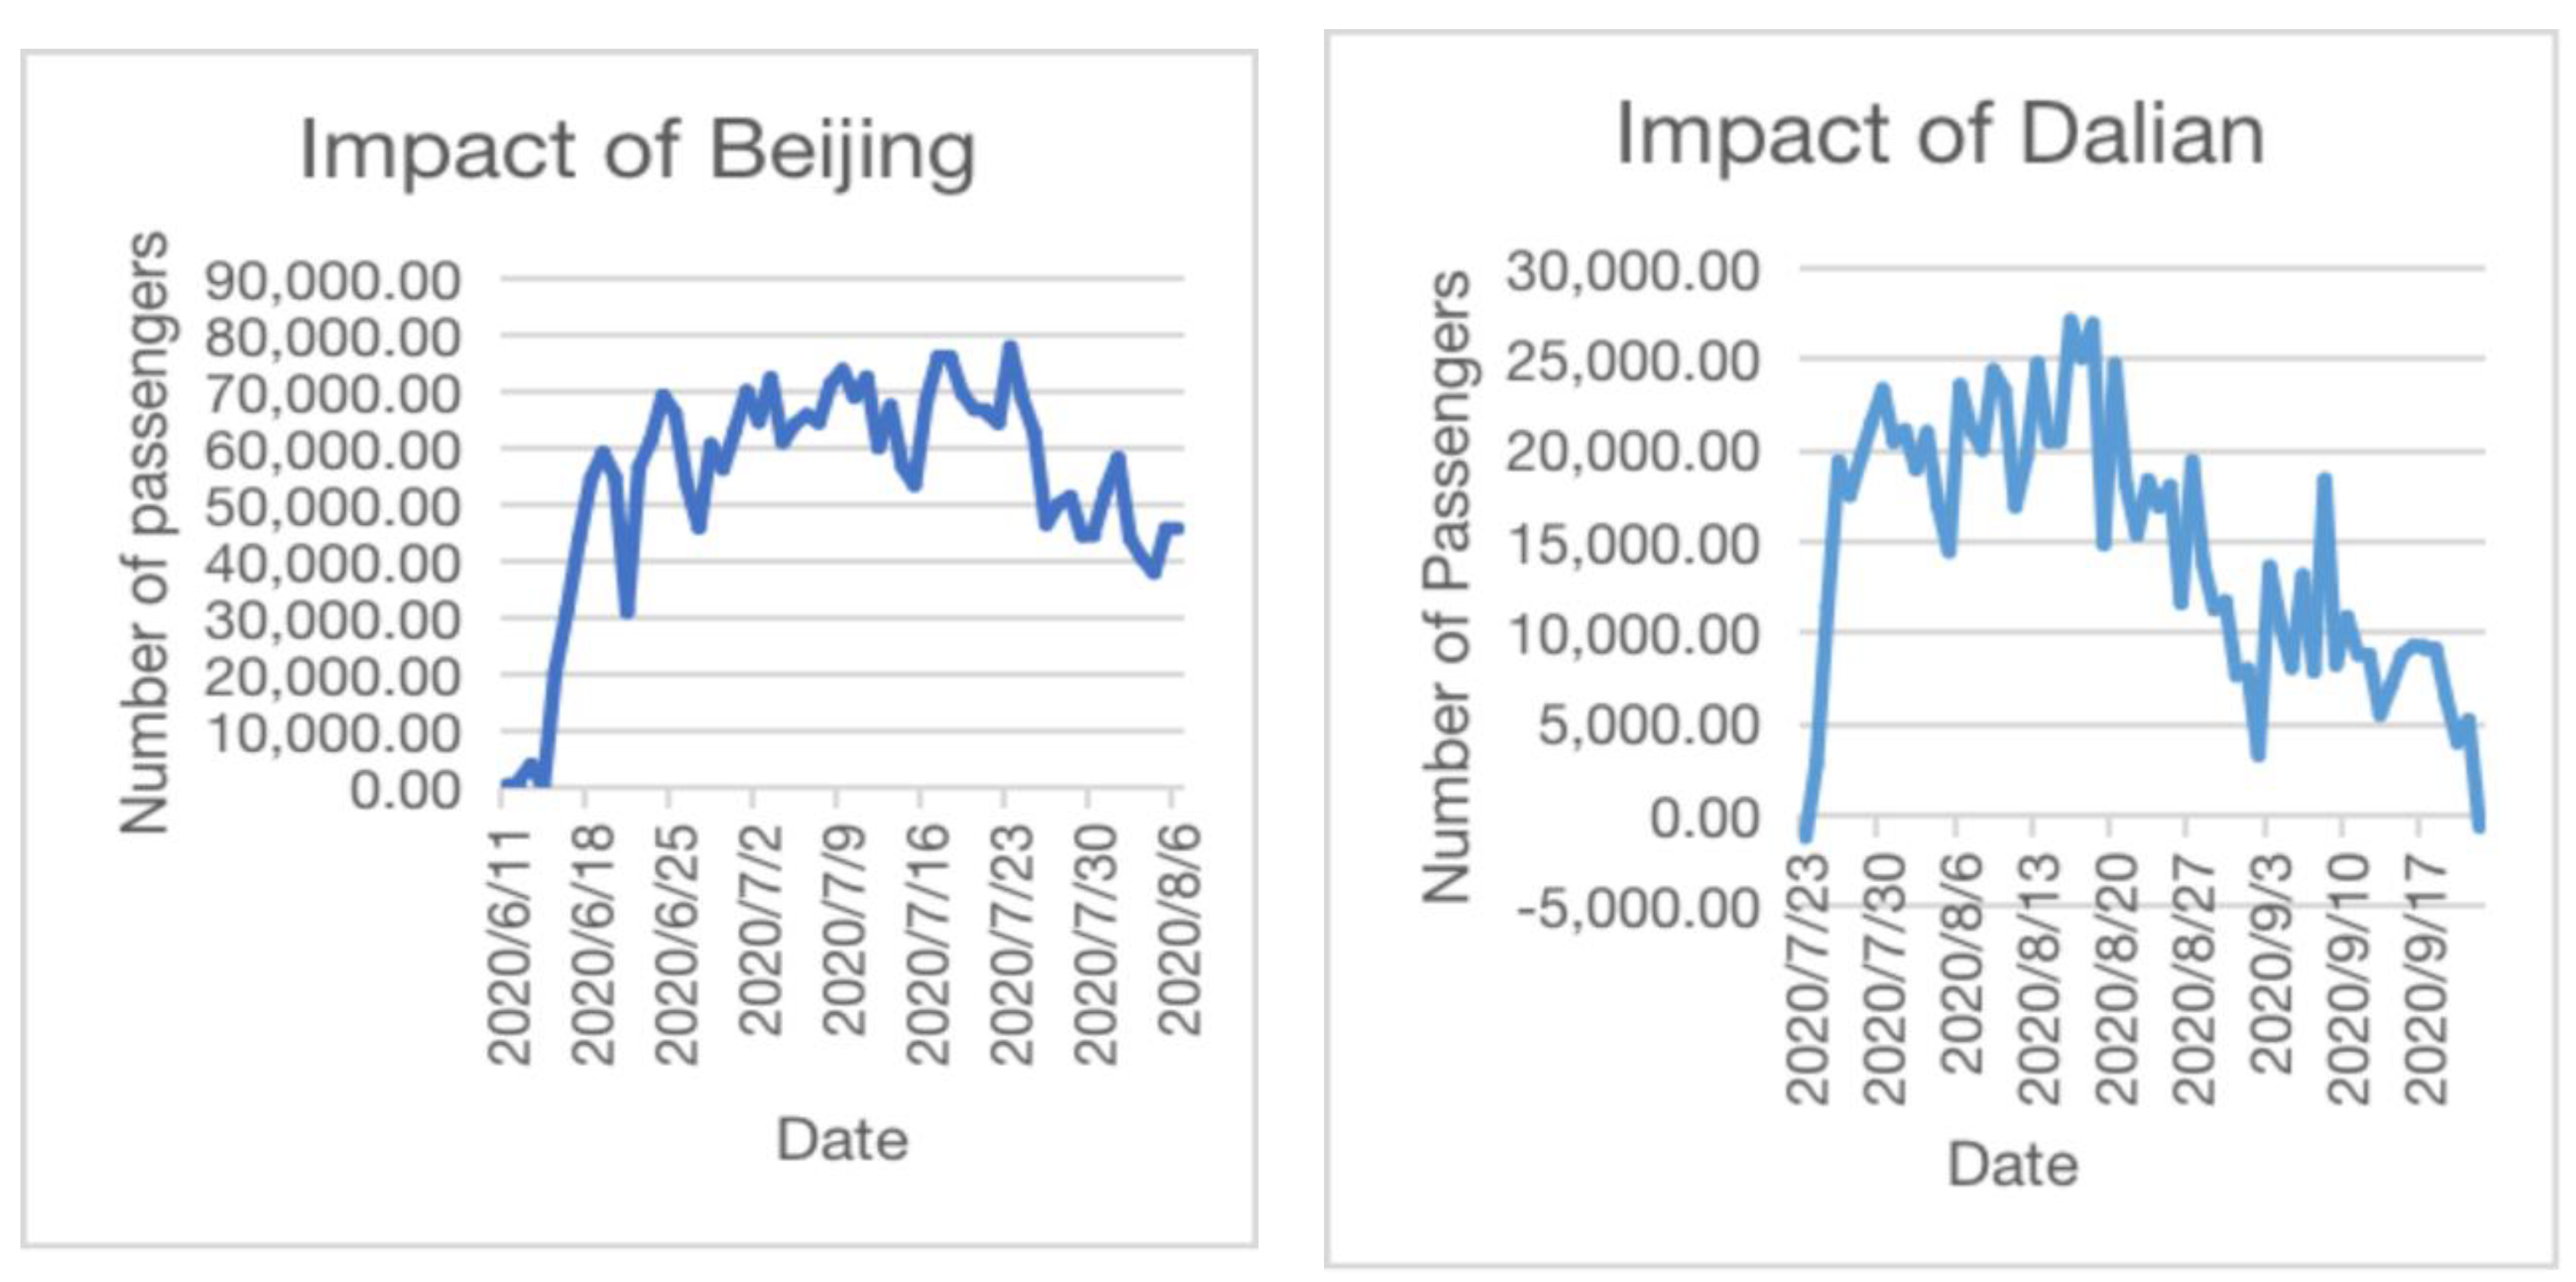
We transform the time series prediction problem into a spatial fitting problem through the LightGBM algorithm, predicting the air demand of cities without a sudden epidemic, which can avoid the problems of a small number of historical data and a short prediction period. In the study, we found that the impact of a local outbreak on air passengers will not disappear with the end of the epidemic, and that its impact is more long-term. After the epidemic situation in China was basically controlled the restrictive policies were released, and the number of air passengers began to recover. It can be found that the number of air passengers in China has fully recovered to the historical level during the Golden Week of National Day. According to the recovery trend of air passengers before the epidemic and the conclusions obtained in this study, if there is no local outbreak the number of air passengers in China may return to the historical level in August. By estimating the impact of the outbreak on the aviation network, we found that if the outbreak occurs in mega cities, it will have a great impact on the whole aviation network, especially in tourist cities. Similarly, the ability of large stations to resist the impact of sudden outbreaks is also stronger than that of small stations and tourist cities, such as Shanghai, Guangzhou, and Shenzhen. For a prefecture-level city, such as Dalian, due to the relatively small number of navigable cities and flights, the impact of the epidemic on the whole aviation network is relatively small.
The aviation industry is not only one of the carriers of virus transmission but also one of the industries most seriously affected by the epidemic. In particular, local epidemics broke out in many places in China at the beginning of 2022, which had a significant impact on China’s aviation industry, which was already on the right track. According to the research of this paper, such an impact cannot be fully recovered from in a short time after the epidemic is controlled. As we know, COVID-19 has a high socioeconomic impact in the long and short terms [42], especially on tourism and its value chain (hotels, restaurants, etc.), which are related to air transport activities that affect multiple sectors of the economy. Our research also proposed that, when local outbreaks happen, tourism may lose a lot of passenger flow. Therefore, if we want to restore the tourism economy, we must control the epidemic.

Author Contributions

Data Curation, L.Z.; Methodology, L.Z. and L.B.; Validation, L.Z., H.T., and L.B.; Conceptualization, L.B.; Funding Acquisition, H.T.; Software, H.T.; Supervision, H.T.; Writing—Original Draft, L.Z.; Writing—Review and Editing, H.T. and L.B. All authors have read and agreed to the published version of manuscript.

Funding

We gratefully acknowledge the financial support from the joint research fund of the National Natural Science Foundation of China and the Civil Aviation Administration of China (U2033205).

Institutional Review Board Statement

Not applicable.

Informed Consent Statement

Not applicable.

Data Availability Statement

Not applicable.

Conflicts of Interest

The authors declare no conflict of interest.

References

  1. Wilder-Smith, A.; Paton, N.I.; Goh, K.T. Short communication: Low risk of transmission of severe acute respiratory syndrome on airplanes: The Singapore experience. Trop. Med. Int. Health 2003, 8, 1035–1037. [Google Scholar] [CrossRef] [PubMed] [Green Version]
  2. Browne, A.; St-Onge Ahmad, S.; Beck, C.R.; Nguyen-Van-Tam, J.S. The roles of transportation and transportation hubs in the propagation of influenza and coronaviruses: A systematic revie. J. Travel Med. 2016, 23. [Google Scholar] [CrossRef] [PubMed] [Green Version]
  3. Cai, J.; Xu, B.; Chan, K.K.Y.; Zhang, X.; Zhang, B.; Chen, Z.; Xu, B. Roles of Different Transport Modes in the Spatial Spread of the 2009 Influenza A(H1N1) Pandemic in Mainland China. Int. J. Environ. Res. Public Health 2019, 16, 222. [Google Scholar] [CrossRef] [PubMed] [Green Version]
  4. Hotel, S.; Mumbower, S. The impact of COVID-19 on domestic US air travel operations and commercial airport service. Transp. Res. Interdiscip. Perspect. 2021, 9, 100277. [Google Scholar]
  5. Sobieralski, J.B. COVID-19 and airline employment: Insights from historical uncertainty shocks to the industry. Transp. Res. Interdiscip. Perspect. 2020, 5, 100123. [Google Scholar] [CrossRef] [PubMed]
  6. Bauranov, A.; Parks, S.; Jiang, X.; Rakas, J.; González, M.C. Quantifying the Resilience of the U.S. Domestic Aviation Network During the COVID-19 Pandemic. Front. Built Environ. 2021, 7. [Google Scholar] [CrossRef]
  7. Pillai, S.; Siddika, N.; Apu, E.H.; Kabir, R. COVID-19: Situation of European Countries so Far. Arch. Med Res. 2020, 51, 723–725. [Google Scholar] [CrossRef]
  8. Filonchyk, M.; Hurynovich, V.; Yan, H. Impact of Covid-19 lockdown on air quality in the Poland, Eastern Europe. Environ. Res. 2020, 198, 110454. [Google Scholar] [CrossRef]
  9. Schumann, U.; Bugliaro, L.; Dörnbrack, A.; Baumann, R.; Voigt, C. Aviation Contrail Cirrus and Radiative Forcing Over Europe During 6 Months of COVID-19. Geophys. Res. Lett. 2021, 48. [Google Scholar] [CrossRef]
  10. Sun, X.; Wandelt, S.; Zhang, A. How did COVID-19 impact air transportation? A first peek through the lens of complex networks. J. Air Transp. Manag. 2020, 89, 101928. [Google Scholar] [CrossRef]
  11. Zhang, L.; Yang, H.; Wang, K.; Zhan, Y.; Bian, L. Measuring imported case risk of COVID-19 from inbound international flights—A case study on China. J. Air Transp. Manag. 2020, 89, 101918. [Google Scholar] [CrossRef] [PubMed]
  12. Zhang, Y.; Zhang, A. COVID-19 and bailout policy: The case of Virgin Australia. Transp. Policy 2021, 114, 174–181. [Google Scholar] [CrossRef] [PubMed]
  13. Zhang, L.; Yang, H.; Wang, K.; Bian, L.; Zhang, A. ‘Wild Your weekends’ promotion and its effect on traffic recovery during COVID-19 pandemic. Transp. B: Transp. Dyn. 2022, 1–19. [Google Scholar] [CrossRef]
  14. Ng, K.T.; Fu, X.; Hanaoka, S.; Oum, T.H. Japanese aviation market performance during the COVID-19 pandemic—Analyzing airline yield and competition in the domestic market. Transp. Policy 2021, 116, 237–247. [Google Scholar] [CrossRef]
  15. Hanson, D.; Delibasi, T.T.; Gatti, M.; Cohen, S. How do changes in economic activity affect air passenger traffic? The use of state-dependent income elasticities to improve aviation forecasts. J. Air Transp. Manag. 2021, 98, 102147. [Google Scholar] [CrossRef]
  16. Zhang, L.; Hou, M.; Liu, Y.; Wang, K.; Yang, H. Measuring Beijing’s international air connectivity and suggestions for improvement post COVID-19. Transport Policy 2022, 116, 132–143. [Google Scholar]
  17. Dube, K.; Nhamo, G.; Chikodzi, D. COVID-19 pandemic and prospects for recovery of the global aviation industry. J. Air Transp. Manag. 2021, 92, 102022. [Google Scholar] [CrossRef]
  18. Gudmundsson, S.; Cattaneo, M.; Redondi, R. Forecasting temporal world recovery in air transport markets in the presence of large economic shocks: The case of COVID-19. J. Air Transp. Manag. 2020, 91, 102007. [Google Scholar] [CrossRef]
  19. Gelhausen, M.C.; Berster, P.; Wilken, D. Post-COVID-19 Scenarios of Global Airline Traffic until 2040 That Reflect Airport Capacity Constraints and Mitigation Strategies. Aerospace 2021, 8, 300. [Google Scholar] [CrossRef]
  20. Kitsou, S.P.; Koutsoukis, N.S.; Chountalas, P.; Rachaniotis, N.P. International Passenger Traffic at the Hellenic Airports: Impact of the COVID-19 Pandemic and Mid-Term Forecasting. Aerospace 2022, 9, 143. [Google Scholar] [CrossRef]
  21. Zhang, L.; Yang, H.; Wang, K.; Bian, L.; Zhang, X. The impact of COVID-19 on airline passenger travel behavior: An exploratory analysis on the Chinese aviation market. J. Air Transp. Manag. 2021, 95, 102084. [Google Scholar] [CrossRef]
  22. Abadie, A.; Gardeazabal, J. The Economic Costs of Conflict: A Case Study of the Basque Country. Am. Econ. Rev. 2003, 93, 113–132. [Google Scholar] [CrossRef] [Green Version]
  23. Varian, H.R. Causal inference in economics and marketing. Proc. Natl. Acad. Sci. USA 2016, 113, 7310–7315. [Google Scholar] [CrossRef] [PubMed] [Green Version]
  24. Athey, S. Beyond prediction: Using big data for policy problems. Science 2017, 355, 483–485. [Google Scholar] [CrossRef] [Green Version]
  25. Yan, J.; Fu, X.; Oum, T.H.; Wang, K. Airline horizontal mergers and productivity: Empirical evidence from a quasi-natural ex-periment in China. Int. J. Ind. Organ. 2019, 62, 358–376. [Google Scholar] [CrossRef]
  26. Ma, W.; Wang, Q.; Yang, H.; Zhang, Y. Evaluating the price effects of two airline mergers in China. Transp. Res. Part E: Logist. Transp. Rev. 2020, 141, 102030. [Google Scholar] [CrossRef]
  27. Borbely, D. A case study on Germany’s aviation tax using the synthetic control approach. Transp. Res. Part A: Policy Pr. 2019, 126, 377–395. [Google Scholar] [CrossRef] [Green Version]
  28. Xin, M.; Shalaby, A.; Feng, S.; Zhao, H. Impacts of COVID-19 on urban rail transit ridership using the Synthetic Control Method. Transp. Policy 2021, 111, 1–16. [Google Scholar] [CrossRef]
  29. Chi, J.; Baek, J. Price and income elasticities of demand for air transportation: Empirical evidence from US airfreight industry. J. Air Transp. Manag. 2012, 20, 18–19. [Google Scholar] [CrossRef]
  30. Jungmittag, A. Combination of Forecasts across Estimation Windows: An Application to Air Travel Demand. J. Forecast. 2016, 35, 373–380. [Google Scholar] [CrossRef] [Green Version]
  31. Long, W.H. The economics of air travel gravity models. J. Reg. Sci. 1970, 10, 353–363. [Google Scholar] [CrossRef]
  32. Bhadra, D.; Kee, J. Structure and dynamics of the core US air travel markets: A basic empirical analysis of domestic passenger demand. J. Air Transp. Manag. 2008, 14, 27–39. [Google Scholar] [CrossRef] [PubMed]
  33. Alexander, D.; Merkert, R. Applications of gravity models to evaluate and forecast US international air freight markets post-GFC. Transp. Policy 2020, 104, 52–62. [Google Scholar] [CrossRef] [PubMed]
  34. Olmedo, E. Comparison of Near Neighbour and Neural Network in Travel Forecasting. J. Forecast. 2015, 35, 217–223. [Google Scholar] [CrossRef]
  35. Plakandaras, V.; Papadimitriou, T.; Gogas, P. Forecasting transportation demand for the U.S. market. Transp. Res. Part A: Policy Pr. 2019, 126, 195–214. [Google Scholar] [CrossRef]
  36. Ma, X.; Tao, Z.; Wang, Y.; Yu, H.; Wang, Y. Long short-term memory neural network for traffic speed prediction using remote microwave sensor data. Transp. Res. Part C Emerg. Technol. 2015, 54, 187–197. [Google Scholar] [CrossRef]
  37. Alekseev, K.; Seixas, J. A multivariate neural forecasting modeling for air transport—Preprocessed by decomposition: A Brazilian application. J. Air Transp. Manag. 2009, 15, 212–216. [Google Scholar] [CrossRef]
  38. Srisaeng, P.; Baxter, G.S.; Wild, G. The evolution of low cost carriers in Australia. Aviation 2014, 18, 203–216. [Google Scholar] [CrossRef] [Green Version]
  39. Xie, G.; Wang, S.; Lai, K.K. Short-term forecasting of air passenger by using hybrid seasonal decomposition and least squares support vector regression approaches. J. Air Transp. Manag. 2014, 37, 20–26. [Google Scholar] [CrossRef]
  40. Lin, Y.; Zhang, J.-W.; Liu, H. Deep learning based short-term air traffic flow prediction considering temporal–spatial correlation. Aerosp. Sci. Technol. 2019, 93, 105113. [Google Scholar] [CrossRef]
  41. Zhao, Z.; Chen, W.; Wu, X.; Chen, P.C.Y.; Liu, J. LSTM network: A deep learning approach for short-term traffic forecast. IET Intell. Transp. Syst. 2017, 11, 68–75. [Google Scholar] [CrossRef] [Green Version]
  42. Iacus, S.M.; Natale, F.; Satamaria, C.; Spyratos, S.; Vespe, M. Estimating and Projecting Air Passenger Traffic during the COVID-19 Coronavirus Outbreak and its Socio-Economic Impact. arXiv 2020, arXiv:2004.08460. [Google Scholar] [CrossRef] [PubMed]
Figure 1. Changes of air passengers before and after COVID-19 in China.
Aerospace 09 00250 g001
Figure 2. Framework for LightGBM.
Aerospace 09 00250 g002
Figure 3. Passenger numbers departing from Beijing (2020 prediction and 2019 reality).
Aerospace 09 00250 g003
Figure 4. Passenger numbers departing from Dalian (2020 prediction and 2019 reality).
Aerospace 09 00250 g004
Figure 5. Beijing air passenger changing trend (SCM).
Aerospace 09 00250 g005
Figure 6. Beijing air passenger changing trend (LightGBM).
Aerospace 09 00250 g006
Figure 7. Dalian air passenger changing trend (SCM).
Aerospace 09 00250 g007
Figure 8. Dalian air passenger changing trend (LightGBM).
Aerospace 09 00250 g008
Figure 9. Impact of the local outbreaks in Beijing and Dalian.
Aerospace 09 00250 g009
Figure 10. Relative impact of the local outbreaks in Beijing and Dalian.
Aerospace 09 00250 g010
Figure 11. The impact of outbreaks in Beijing on air routes.
Aerospace 09 00250 g011
Figure 12. The impact of outbreaks in Dalian on air routes.
Aerospace 09 00250 g012
Table 1. Research period.
CityLocal Outbreak TimeResearch PeriodDays
Beijing11 June 20201 May 20203 August 202095
Dalian22 July 202011 June 202013 September 202095
Table 2. Airport level and city.
Airport LevelAirport Code and City
4FPEK (Beijing), PVG (Shanghai), CAN (Guangzhou), CKG (Chongqing), KMG (Kunming), CTU (Chengdu), WUH (Wuhan), CGO (Zhengzhou), TNS (Tianjin), HGH (Hangzhou), SZX (Shenzhen), XIY (Xian), NKG (Nanjing), CSX (Changsha), KWL (Guilin), and HKG (Xianggang)
4ETPE (Taibei), SHA (Shanghai), XMN (Xiamen), TYN (Taiyuan), TNA (Jinan), SHE (Shenyang), HFE (Hefei), ZUH (Zhuhai), HAK (Haikou), SYX (Sanya), CZX (Changzhou), NNG (Nanning), NGB (Ningbo), LHW (Lanzhou), TAO (Qingdao), FOC (Fuzhou), KHN (Nanchang), WUX (Sunan), INC (Yinchuan), YNT (Yantai), CGQ (Changchun), XUZ (Xuzhou), DDG (Dandong), YTY (Yangzhou), LXA (Lasa), DSN (Erdos), KHG (Kashgar), SJW (Shijiazhuang), KWE (Guiyang), DLC (Dalian), HRB (Harbin), HET (Hohhot), WNZ (Wenzhou), URC (Urumqi), TLQ (Turpan), and MFM (Macao)
Table 3. Square root of the prediction error, RMSPE.
CityLightGBMSCM
Beijing517.860720,742.86
Dalian749.8749933.8532
Table 4. Epidemic situation in Beijing and Dalian.
LocationOutbreak DateNumbers of New InfectionsNo Cases for 14 Consecutive DaysDuration Days
Beijing11 June 202026920 July 202039
Dalian22 July 20205719 August 202028
Publisher’s Note: MDPI stays neutral with regard to jurisdictional claims in published maps and institutional affiliations.

