
Impact Pressure Distribution Recognition for Large Non-Cooperative Target in Ground Detumbling Experiment


Abstract
:1. Introduction
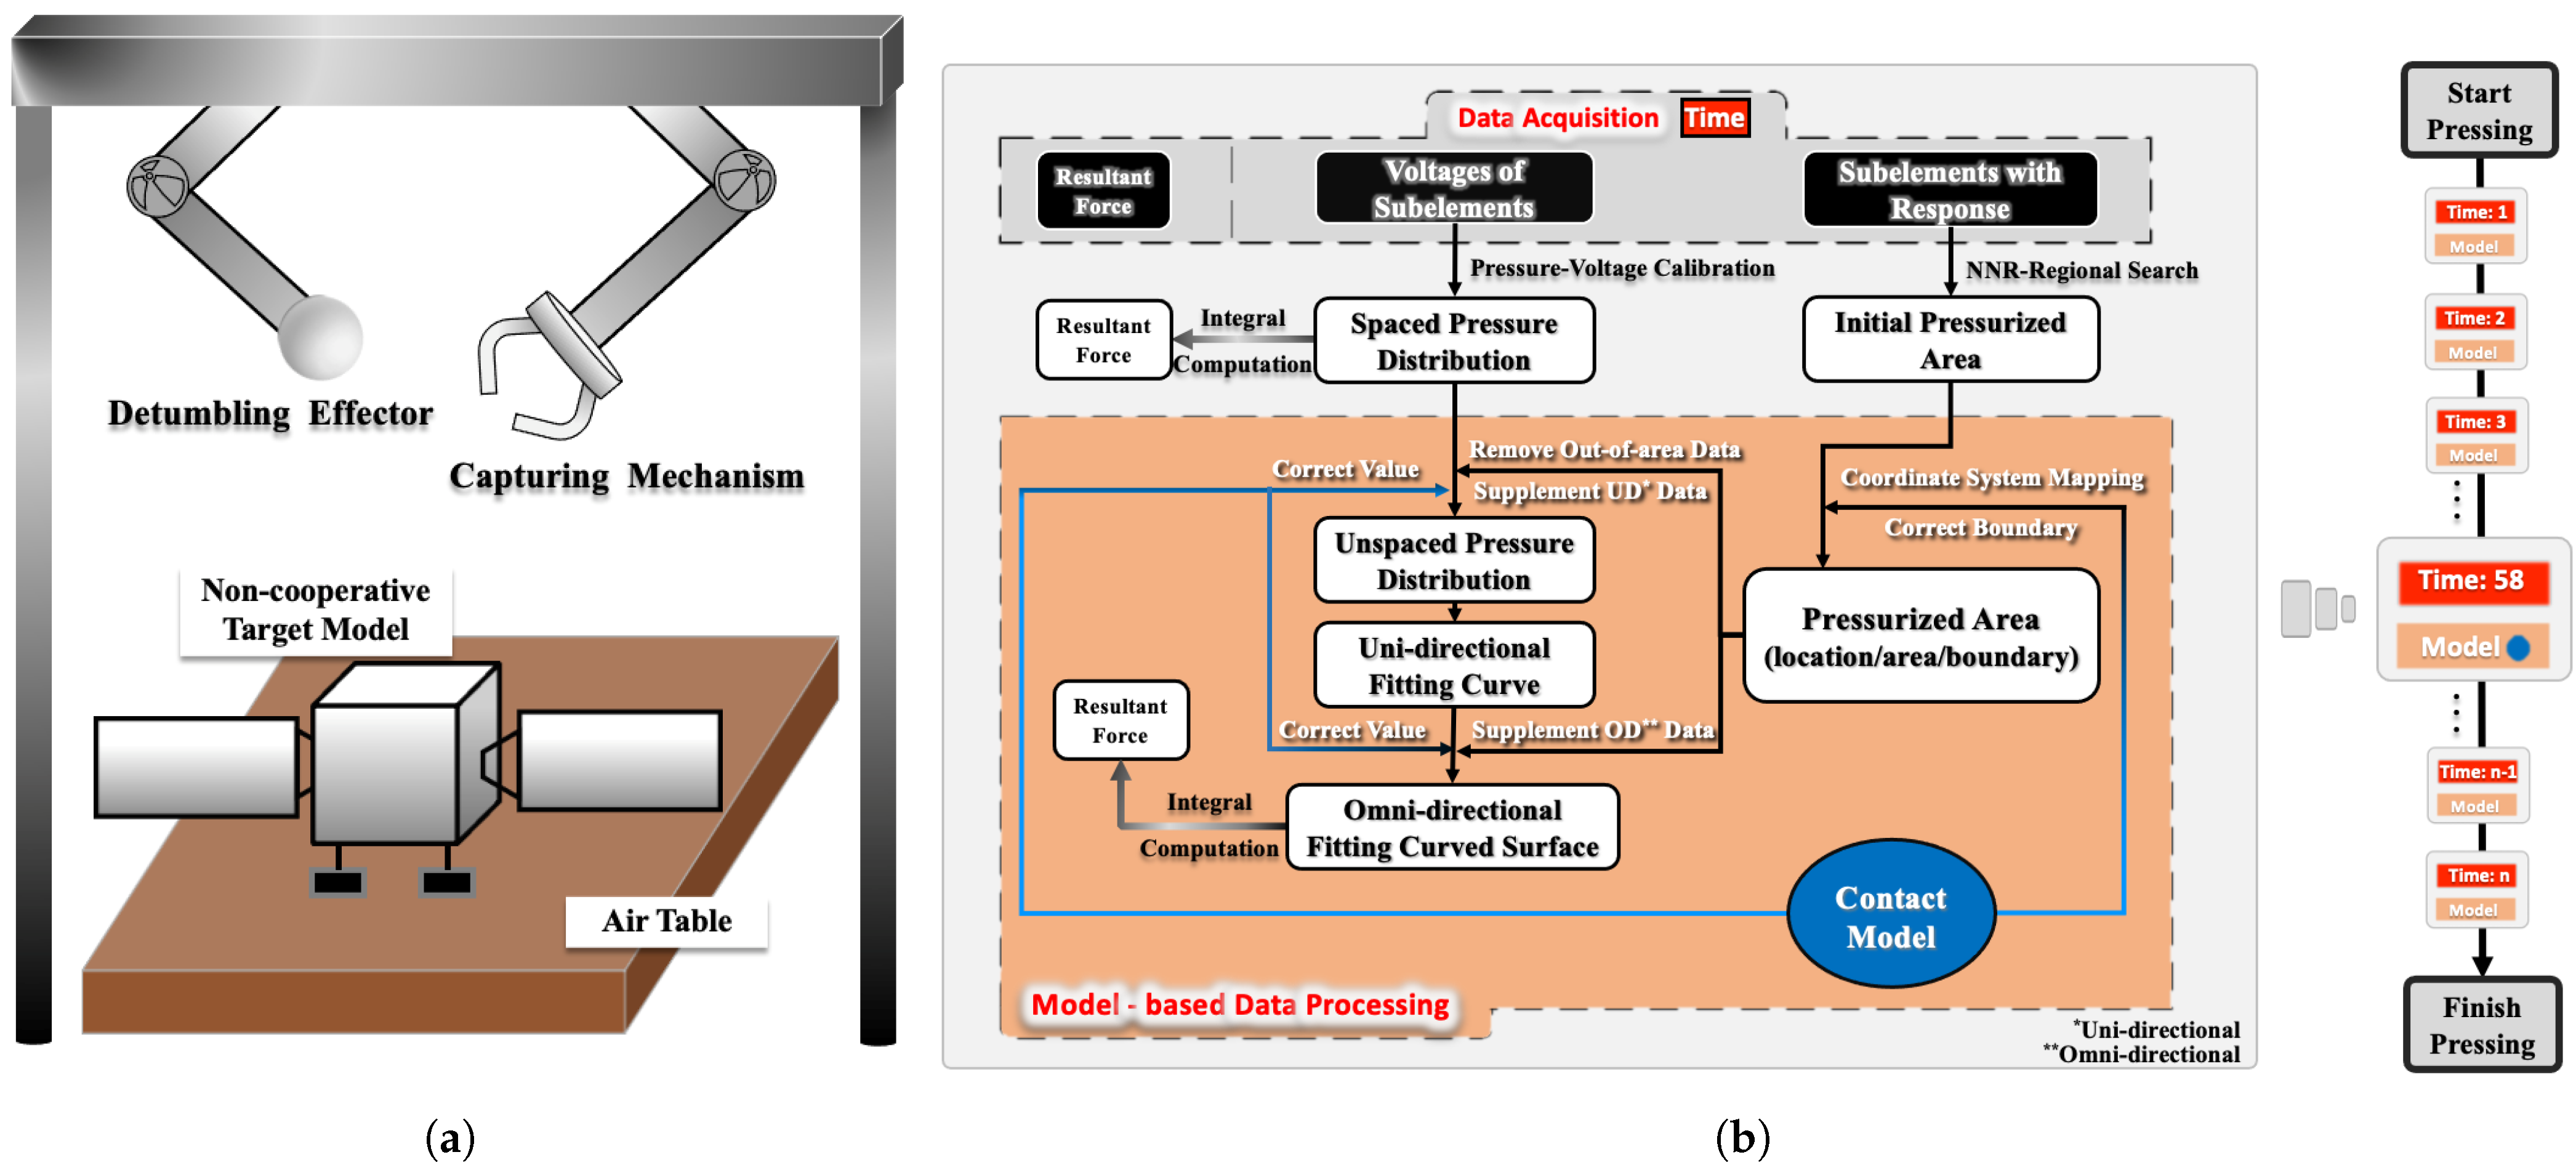
2. Proposed Methods
3. Preliminary
3.1. Contact Model
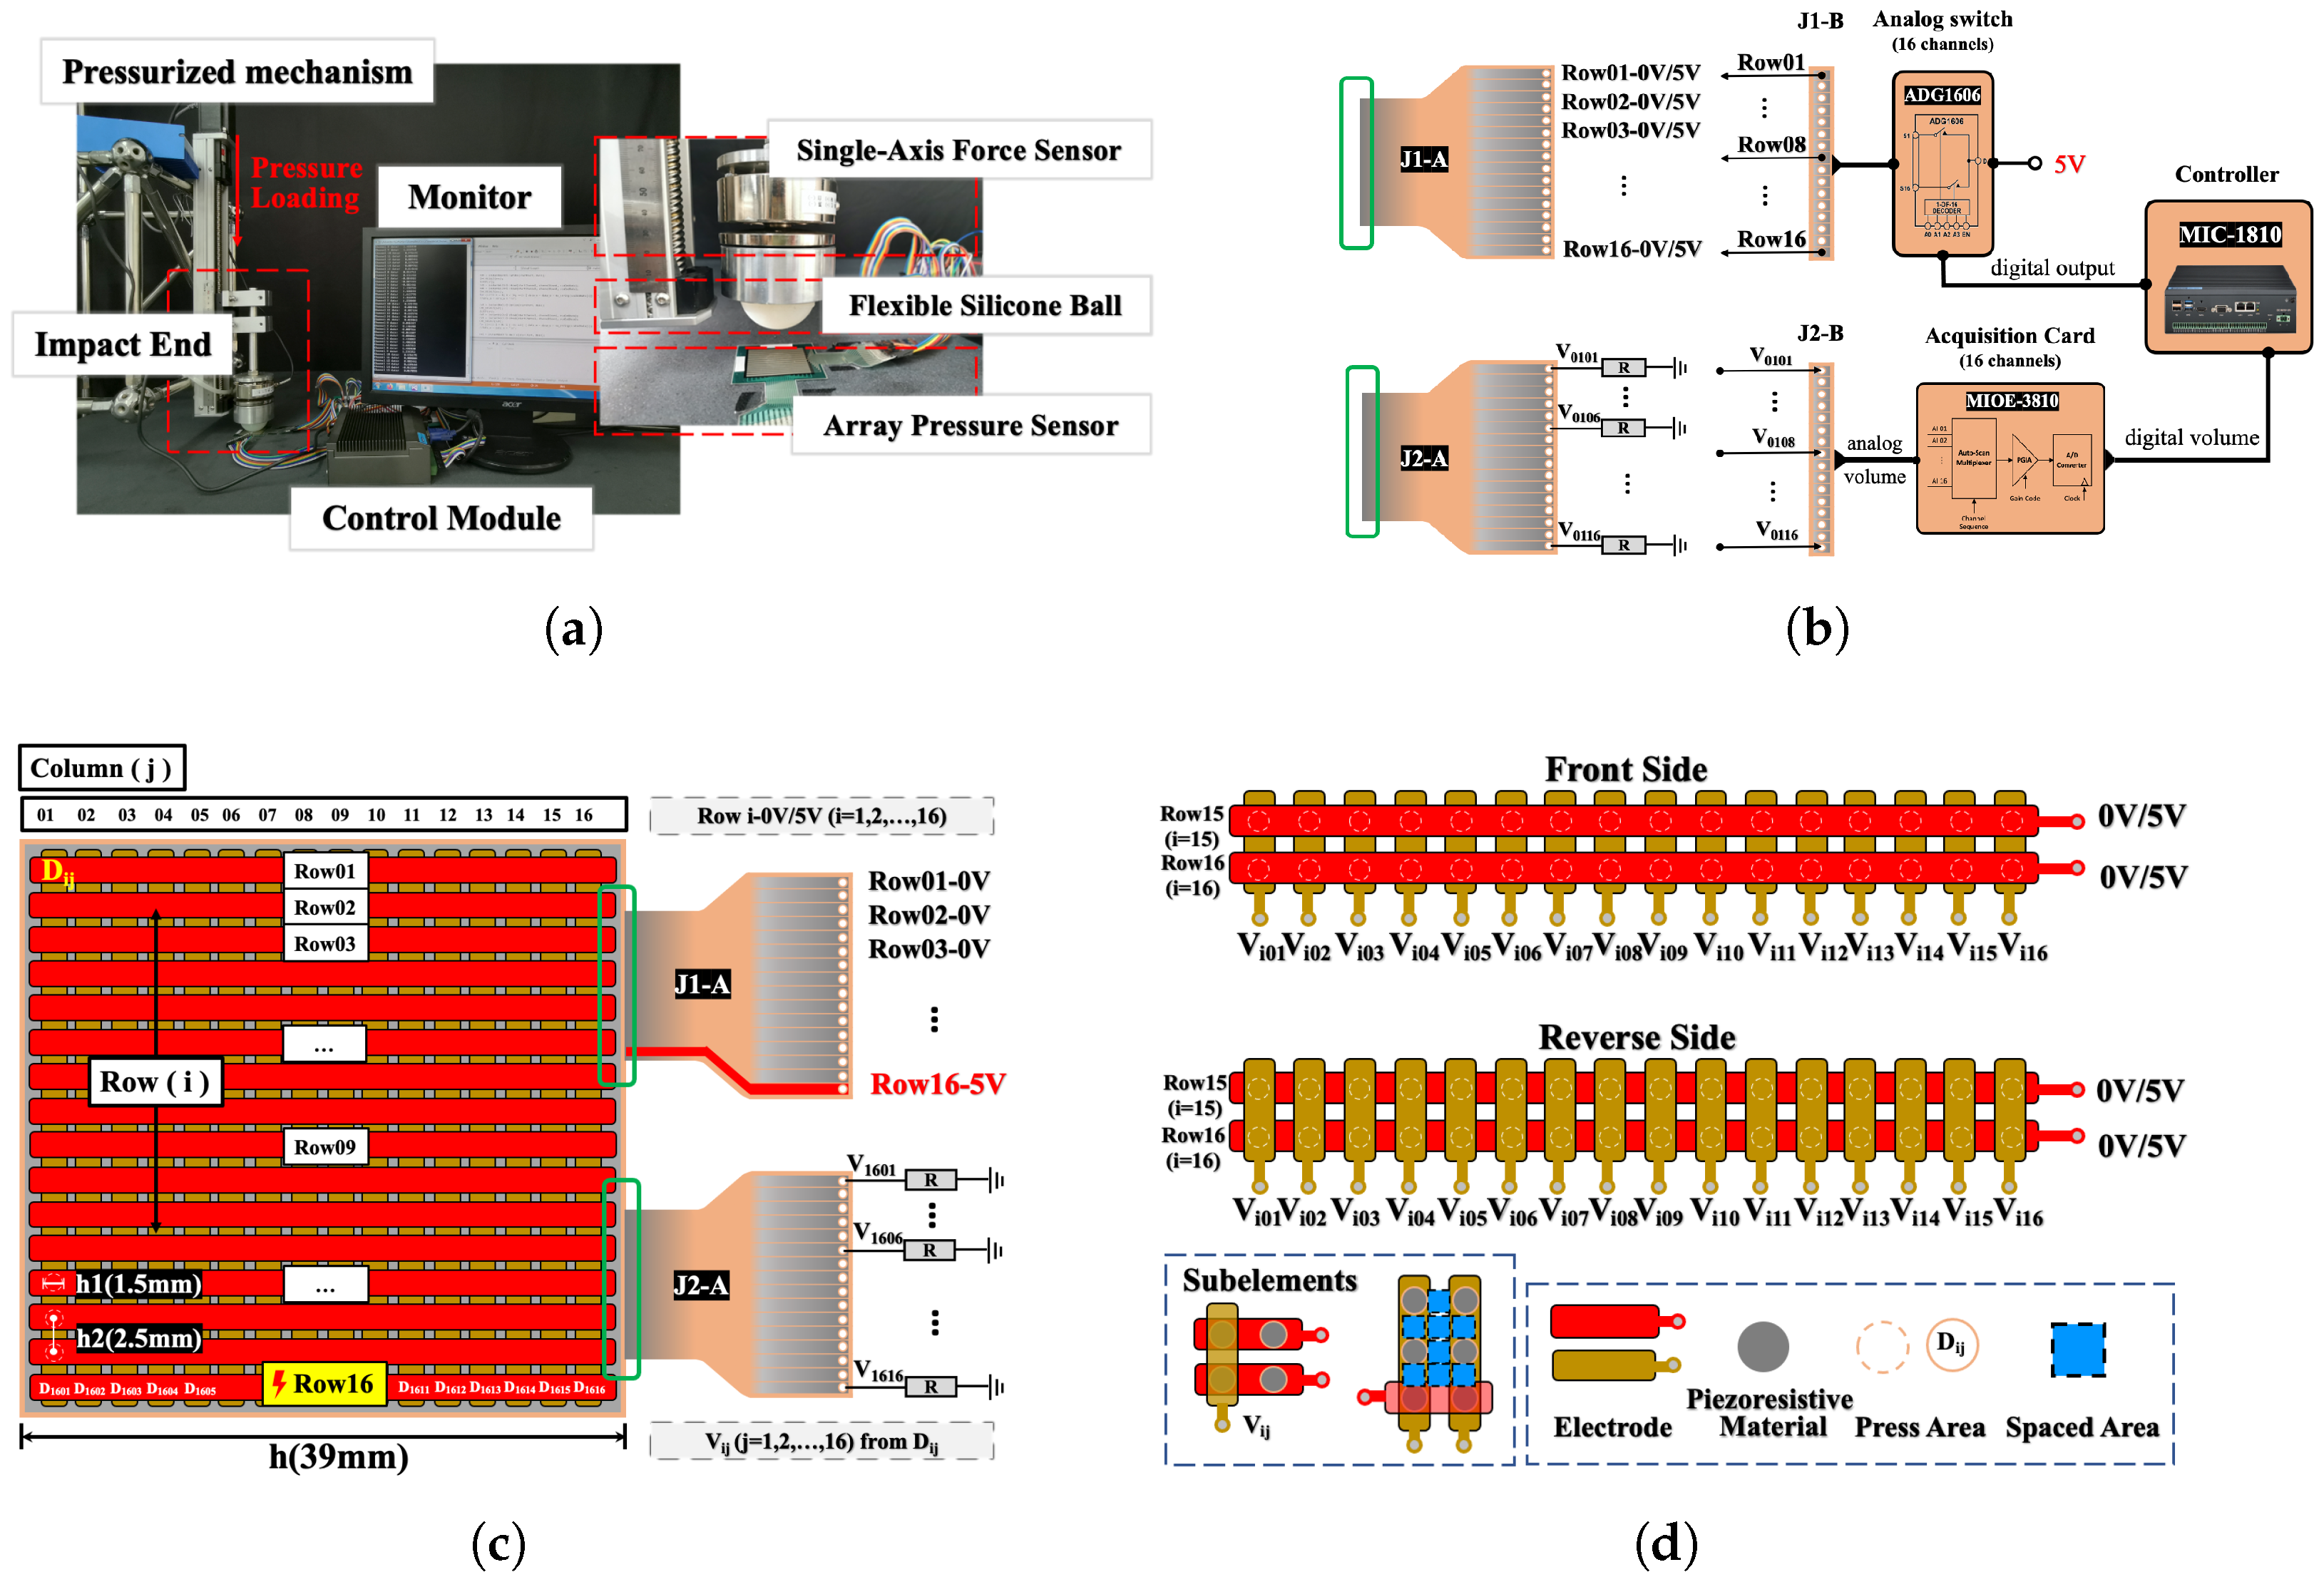
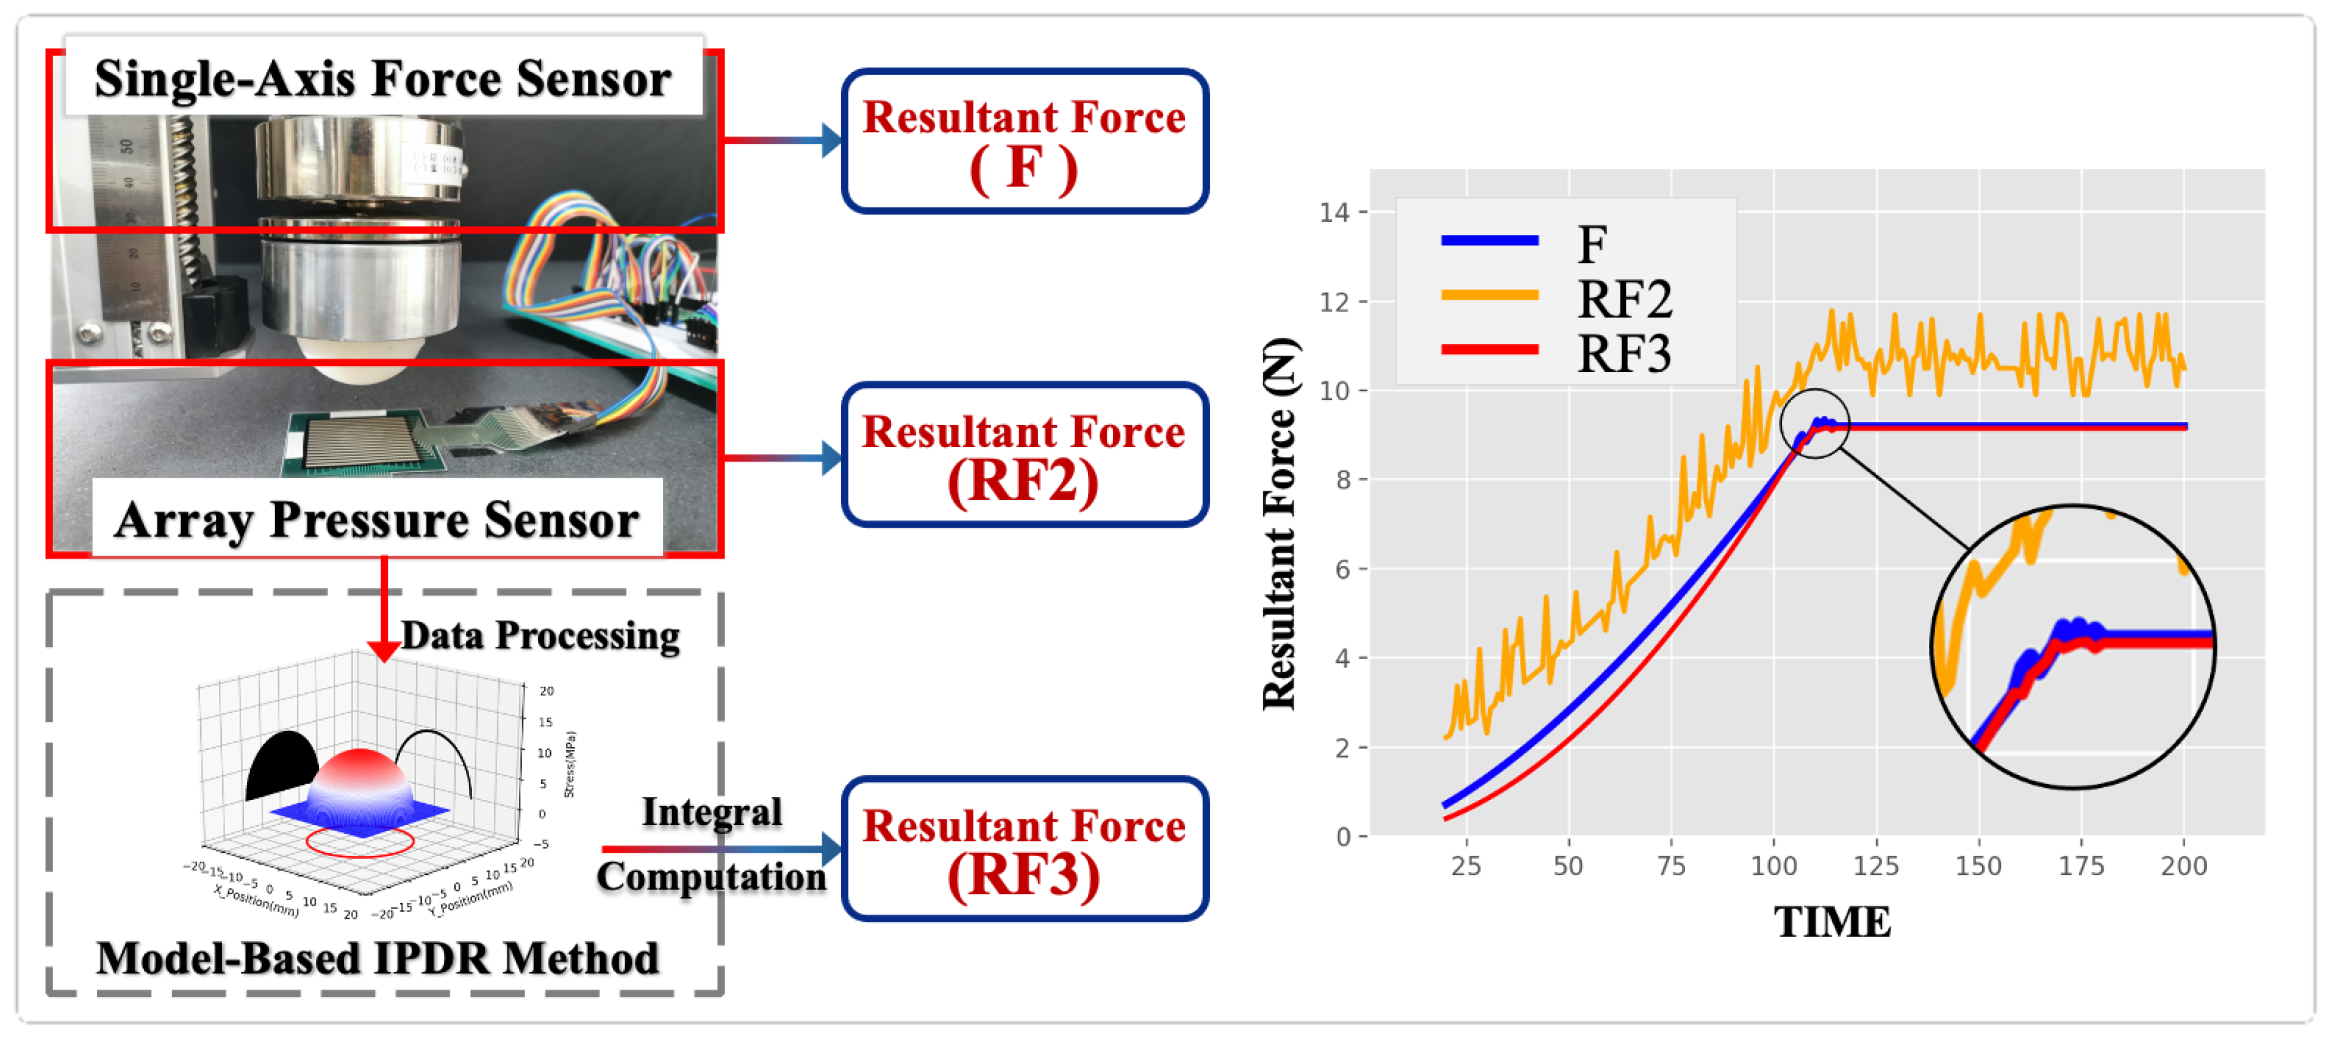
3.2. Data Acquisition
4. Experiment Analysis
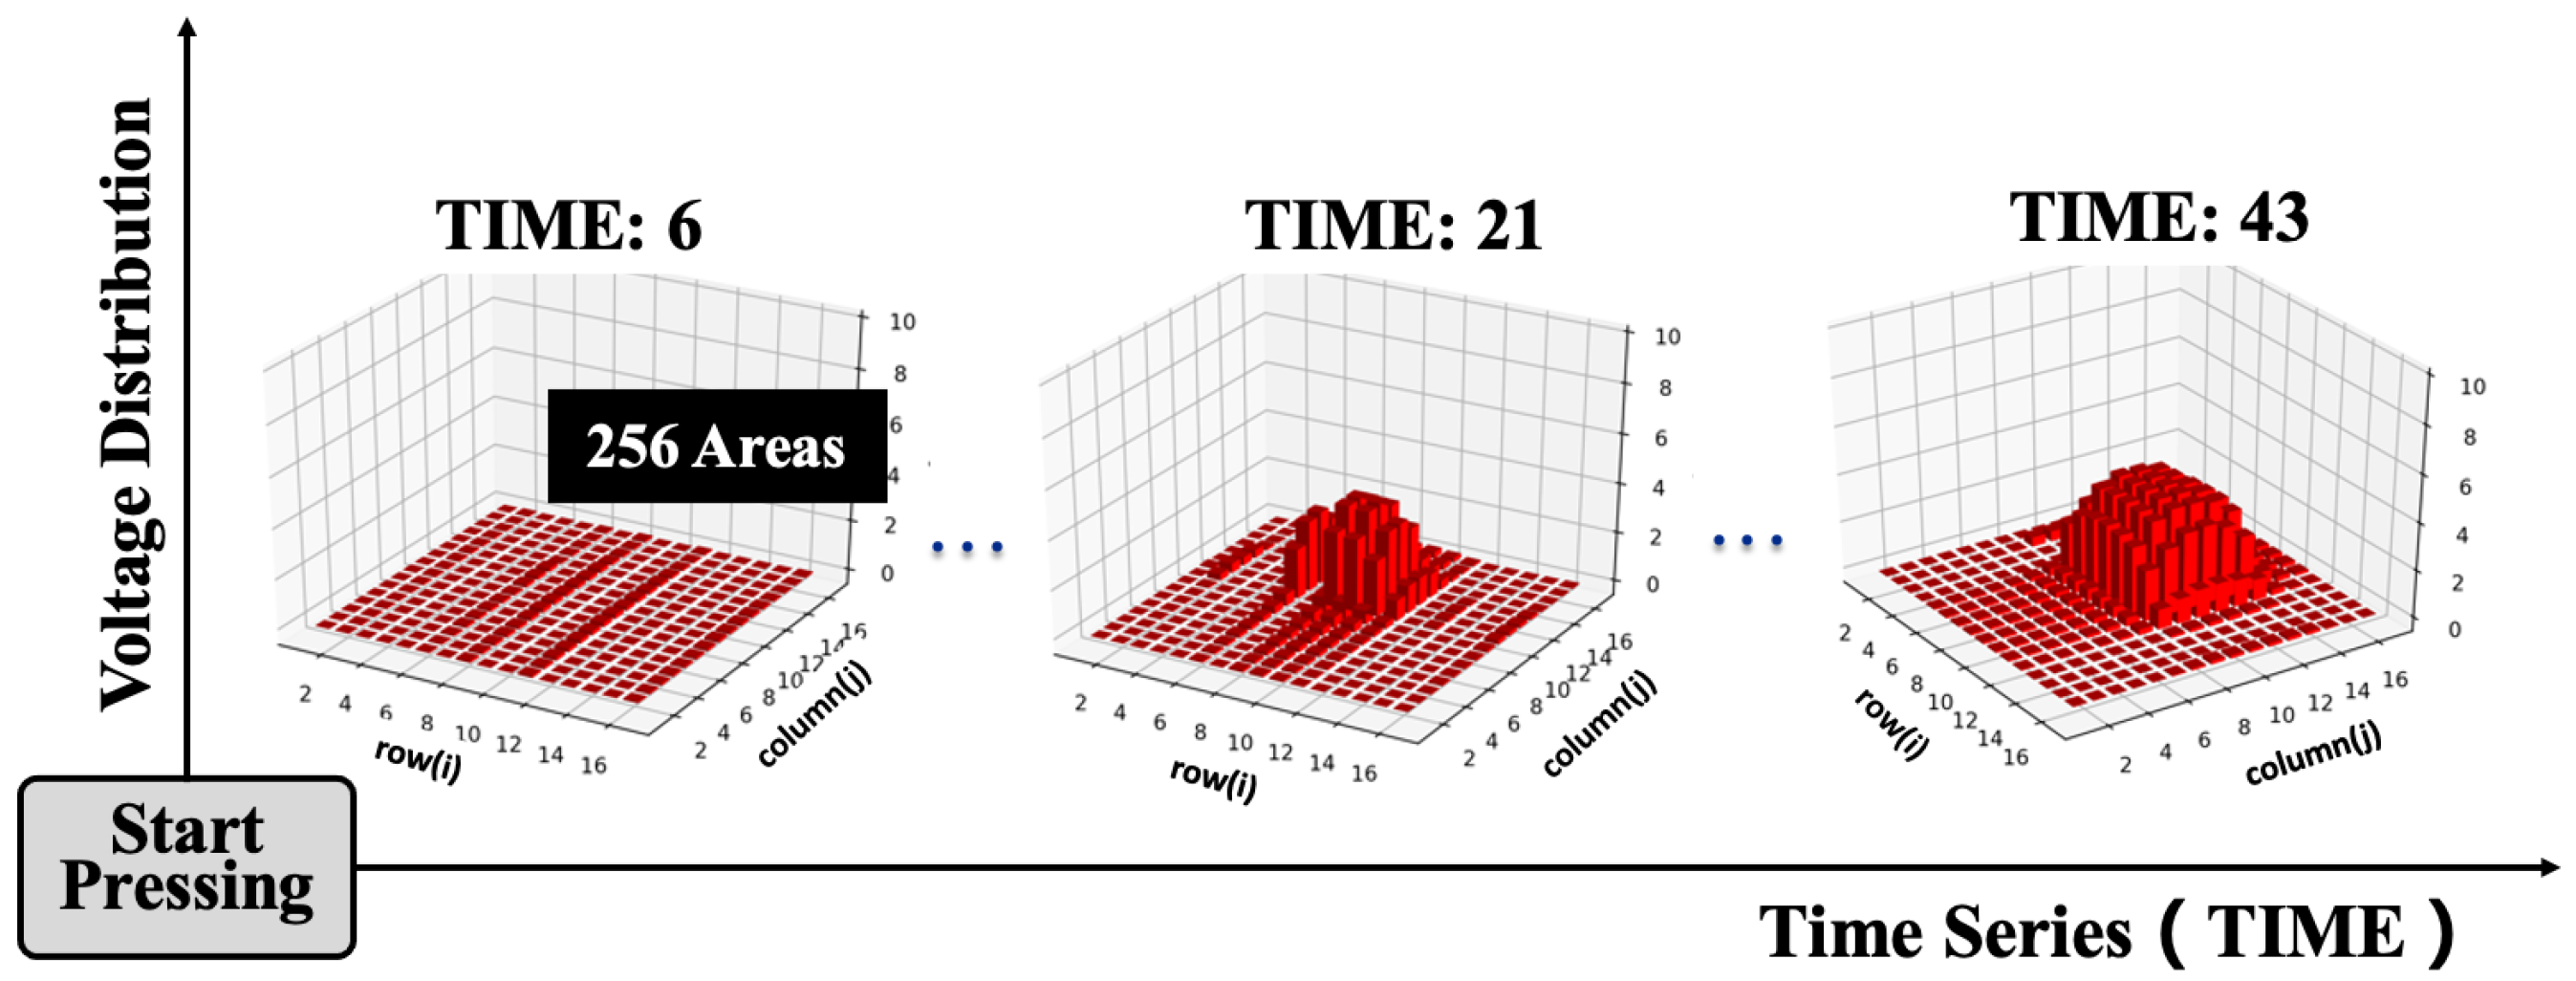
4.1. Raw Data Distribution
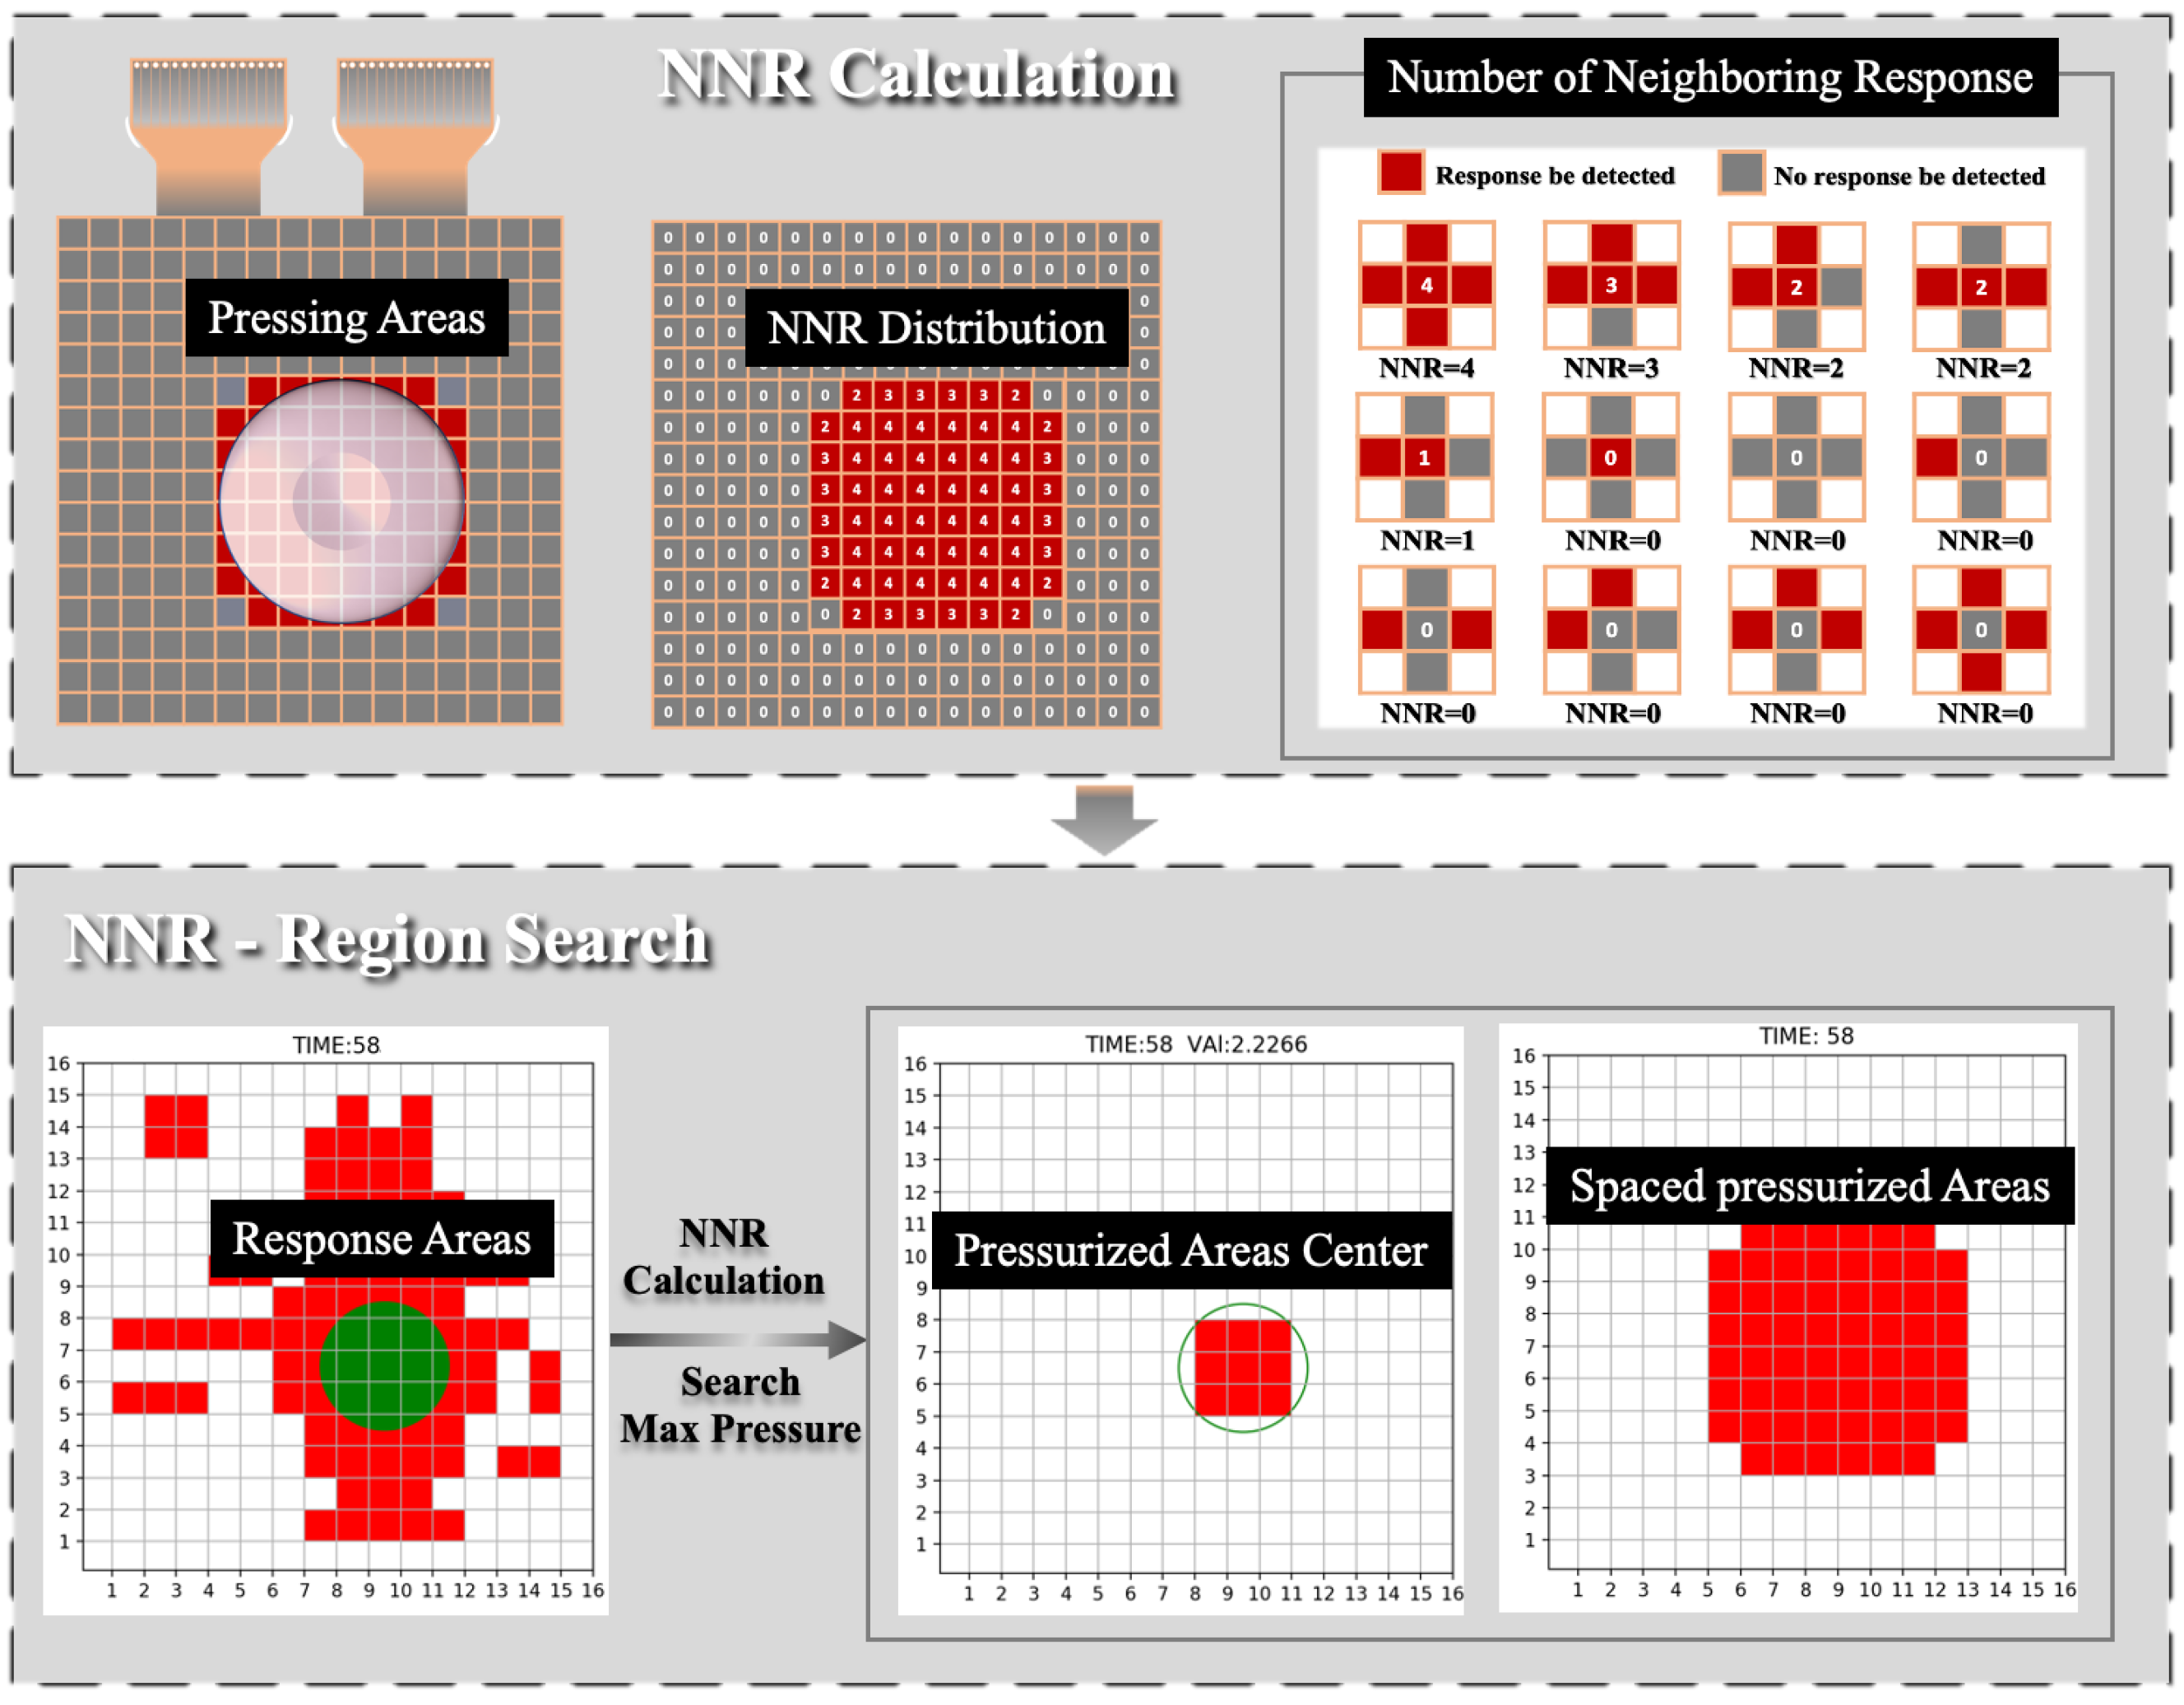
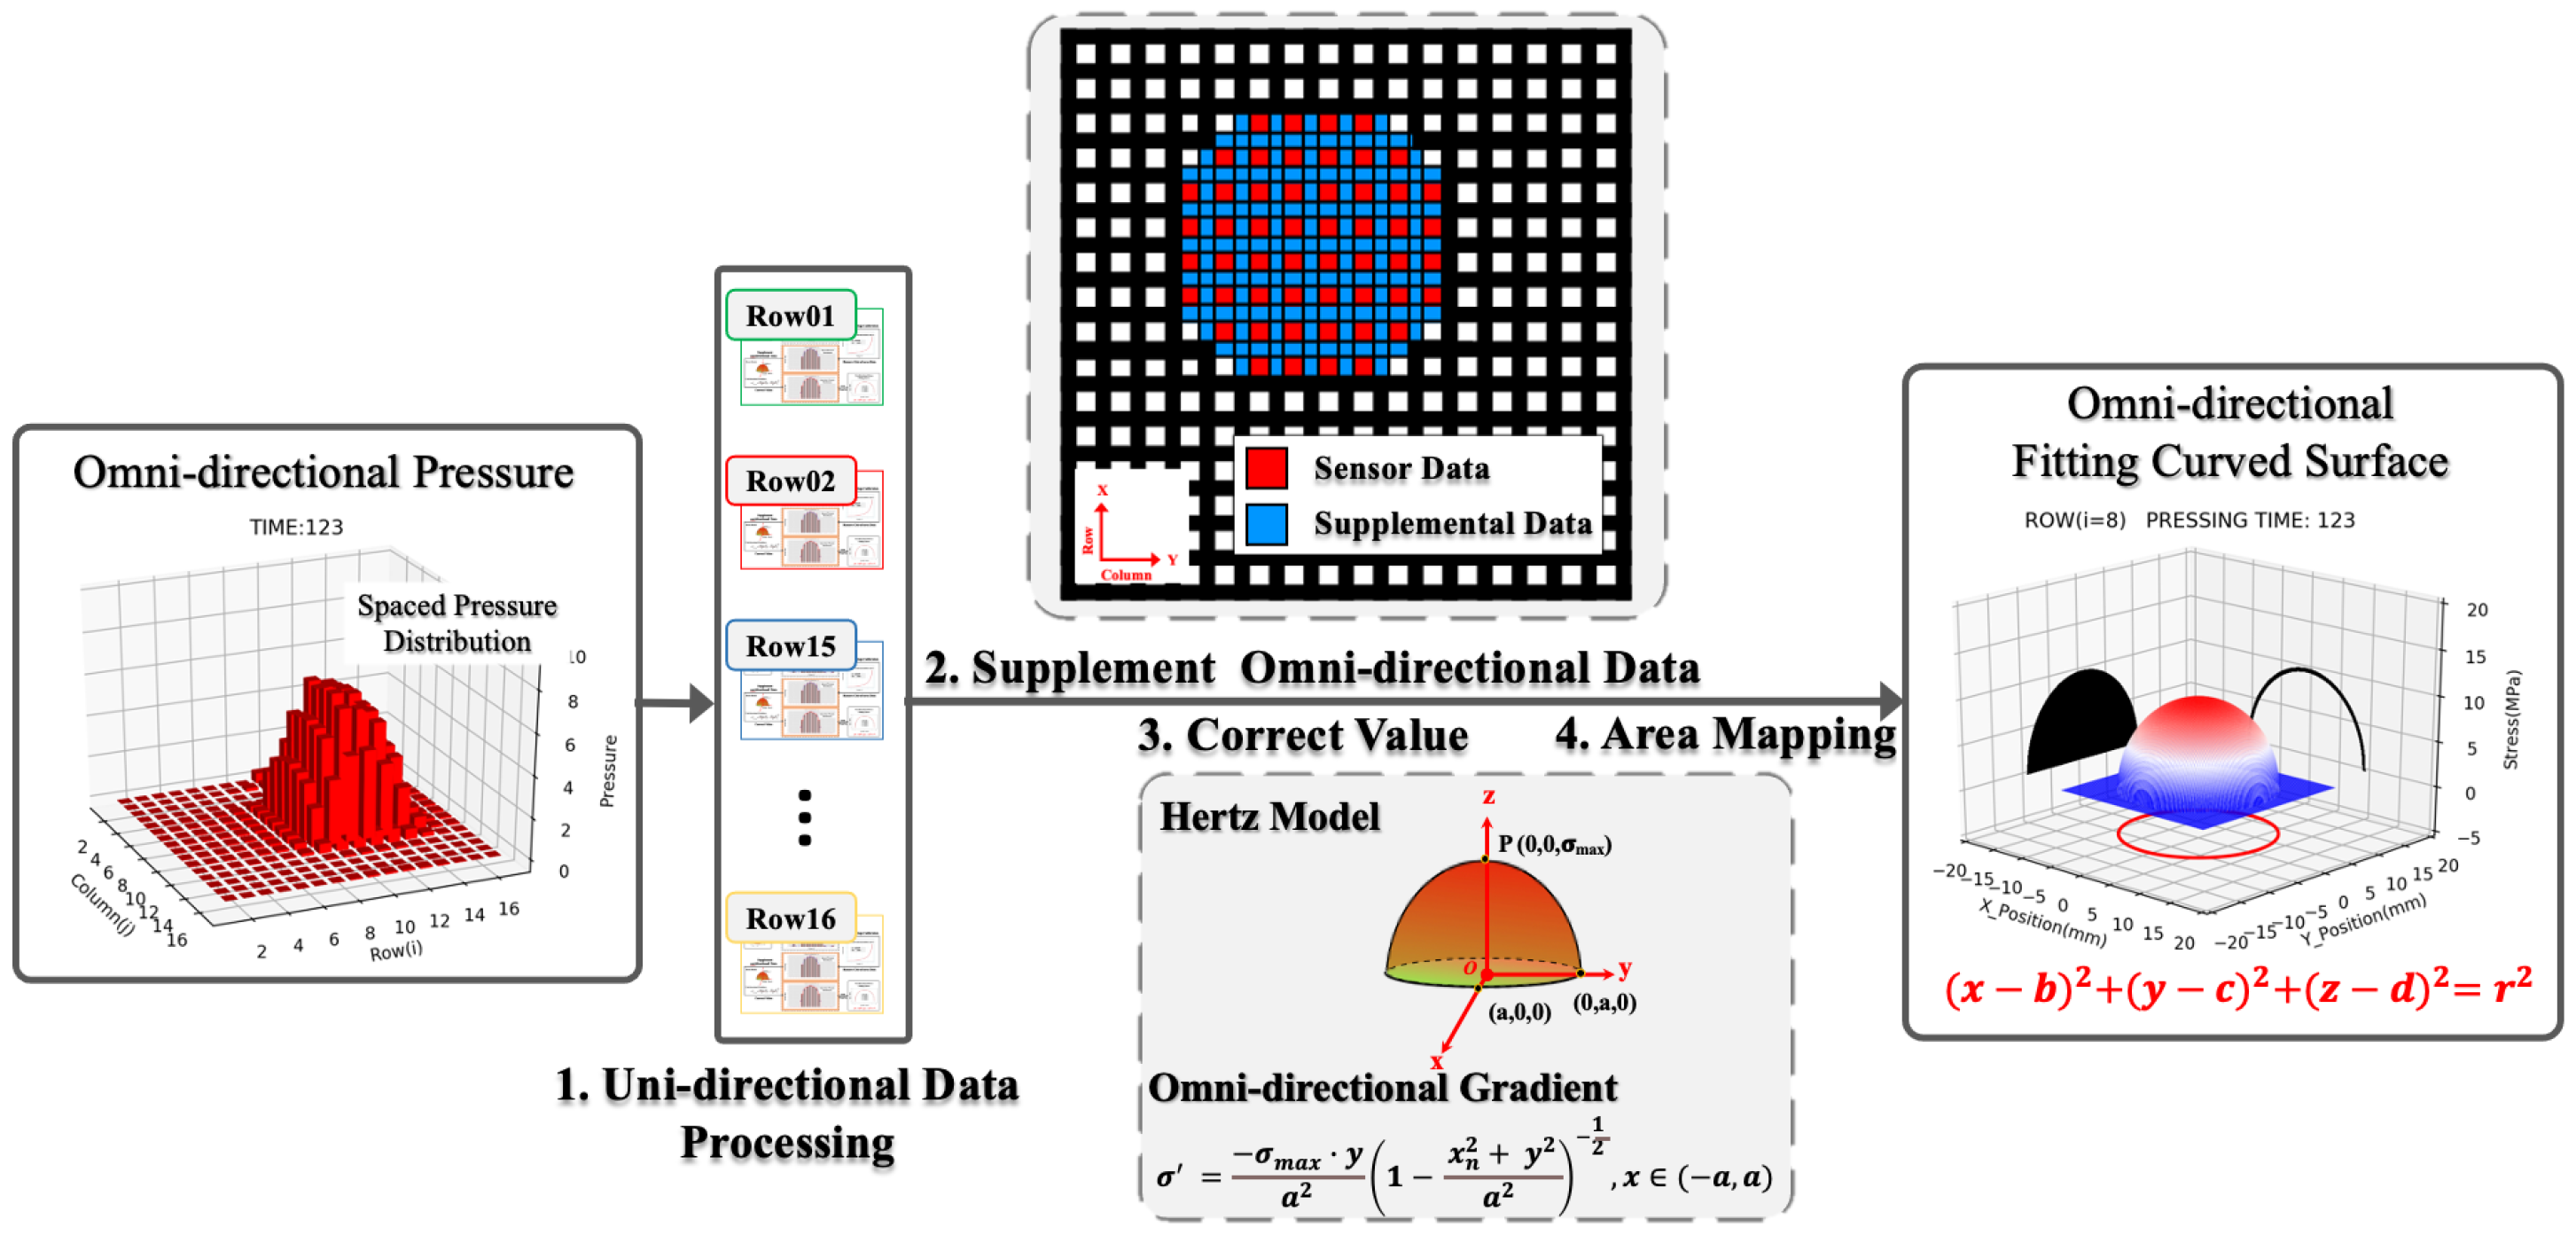
4.2. Pressurized Area Searching Method
4.3. Impact Pressure Data Processing
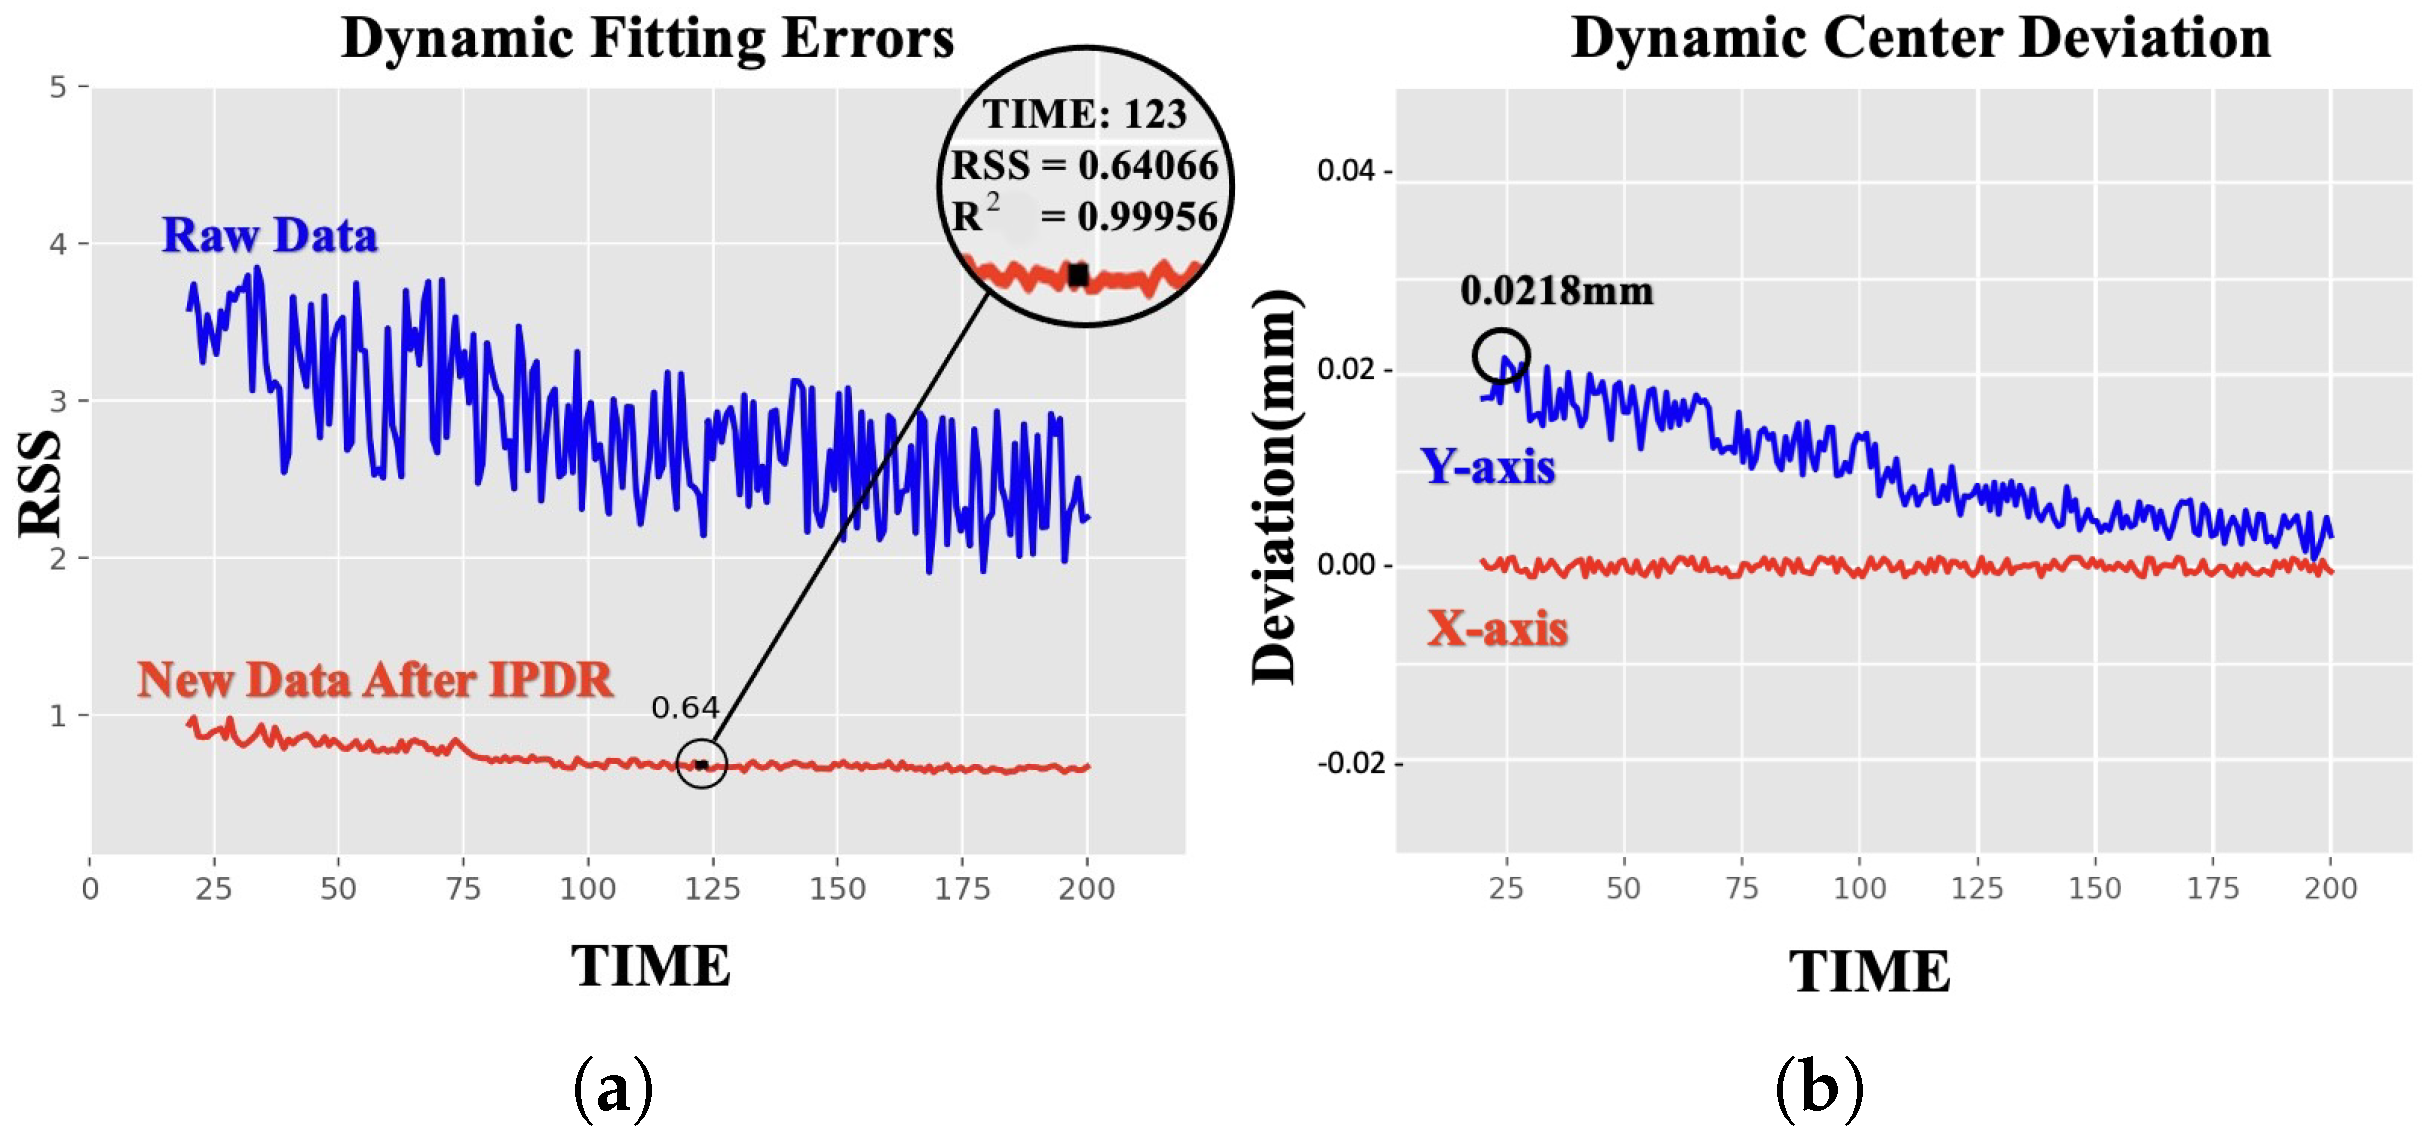
4.4. Effectiveness Analysis of IPDR Method
5. Conclusions
Author Contributions
Funding
Institutional Review Board Statement
Informed Consent Statement
Data Availability Statement
Conflicts of Interest
References
- Murtaza, A.; Pirzada, S.J.H.; Xu, T.; Liu, J. Orbital debris threat for space sustainability and way forward (Review Article). IEEE Access 2020, 8, 61000–61019. [Google Scholar] [CrossRef]
- Gao, X.; Liang, B.; Xu, W. Attitude determination of large non-cooperative spacecrafts in final approach. In Proceedings of the 11th International Conference on Control Automation Robotics & Vision, Singapore, 7–10 December 2010. [Google Scholar]
- Shan, M.; Guo, J.; Gill, E. Review and comparison of active space debris capturing and removal methods. Prog. Aerosp. Sci. 2016, 80, 18–32. [Google Scholar] [CrossRef]
- Koryanov, V.V.; Kazakovtsev, V.P.; Toporkov, A.G.; Nedogarok, A.A. Using inflatable structures to remove space debris from orbit. In Proceedings of the IEEE 10th International Conference on Mechanical and Aerospace Engineering, Brussels, Belgium, 22–25 July 2019. [Google Scholar]
- Liou, J.C. Engineering and technology challenges for active debris removal. Prog. Propuls. Phys. 2013, 4, 735–748. [Google Scholar]
- Medina, A. Validation results of satellite mock-up capturing experiment using nets. Acta Astronaut. 2017, 134, 314–332. [Google Scholar] [CrossRef]
- Liu, X.; Zhang, X.; Cai, G.; Wang, M. A collision control strategy for detumbling a non-cooperative spacecraft by a robotic arm. Multibody Syst. Dyn. 2021, 53, 1–31. [Google Scholar] [CrossRef]
- Sun, K.; Wang, Z.; Zhang, Y.; Liu, H. Detumbling space debris via thruster plume impingement. In Proceedings of the IEEE 3rd Advanced Information Technology, Electronic and Automation Control Conference (IAEAC), Chongqing, China, 12–14 October 2018. [Google Scholar]
- Nakajima, Y. Detumbling space debris via thruster plume impingement. In Proceedings of the AIAA/AAS Astrodynamics Specialist Conference, Long Beach, CA, USA, 13–16 September 2016. [Google Scholar]
- Bennett, T.; Schaub, H. Touchless electrostatic three-dimensional detumbling of large axi-symmetric debris. J. Astronaut. Sci. 2015, 62, 233–253. [Google Scholar] [CrossRef]
- Sugai, F.; Abiko, S.; Tsujita, T.; Jiang, X.; Uchiyama, M. Detumbling an uncontrolled satellite with contactless force by using an eddy current brake. In Proceedings of the IEEE Transactions on Aerospace and Electronic Systems, Tokyo, Japan, 3–7 November 2013. [Google Scholar]
- Wang, D.; Huang, P.; Meng, Z. Coordinated stabilization of tumbling targets using tethered space manipulators. IEEE Trans. Aerosp. Electron. Syst. 2015, 51, 2420–2432. [Google Scholar] [CrossRef]
- Amel’kin, N.I.; Kholoshchak, V.V. Rotational motion of a non-symmetrical satellite with a damper in a circular orbit. Mech. Solids 2019, 83, 190–203. [Google Scholar] [CrossRef]
- Nishida, S.I.; Kawamoto, S. Strategy for capturing of a tumbling space debris. Acta Astronaut. 2011, 68, 113–120. [Google Scholar] [CrossRef]
- Kawamoto, S.; Matsumoto, K.; Wakabayashi, S. Ground Experiment of Mechanical Impulse Method for Uncontrollable Satellite Capturing. In Proceedings of the 6th International Symposium on Artificial Intelligence and Robotics & Automation in Space: I-SAIRAS 2001, Montreal, QC, Canada, 18–22 June 2001. [Google Scholar]
- Khademi, W.; Rao, S.; Minnerath, C.; Hagen, G.; Ventura, J. Self-Supervised Poisson-Gaussian Denoising. In Proceedings of the IEEE Winter Conference on Applications of Computer Vision, Waikoloa, HI, USA, 3–8 January 2021. [Google Scholar]
- Kim, M.; Choi, H.; Cho, K.J.; Jo, S. Single to Multi: Data-Driven High Resolution Calibration Method for Piezoresistive Sensor Array. IEEE Robot. Autom. Lett. 2021, 6, 4970–4977. [Google Scholar] [CrossRef]
- Han, S.; Kim, T.; Kim, D.; Park, Y.-L.; Jo, S. Use of deep learning for characterization of microfluidic soft sensors. IEEE Robot. Autom. Lett. 2018, 3, 873–880. [Google Scholar] [CrossRef]
- Valle-Lopera, D.A.; Castaño-Franco, A.F.; Gallego-Londoño, J.; Hernández-Valdivieso, A.M. Test and fabrication of piezoresistive sensors for contact pressure measurement. Rev. Fac. Ing. 2017, 82, 47–52. [Google Scholar] [CrossRef] [Green Version]
- Wang, L.; Nan, M.; Lei, M.; Ling, Y.; Lv, D. Space resolution improvement for pressure measurement by using a single conductive polymer composite sheet in area array. Sens. Actuators A Phys. 2019, 295, 324–335. [Google Scholar] [CrossRef]
- Jin, D.; Hu, H.; Wu, Z. Analysis of Vibro-Impacting Flexible Beams Based on Hertzian Contact Model. J. Vib. Eng. 1998, 11, 46–51. [Google Scholar]
- Alluhydan, K.; Razzaghi, P.; Hurmuzlu, Y. On planar impacts of cylinders and balls. J. Appl. Mech. 2019, 86, 071009. [Google Scholar] [CrossRef]
- Johnson, K.L. Contact Mechanics, 3rd ed.; Cambridge University Press: Cambridge, UK, 1985. [Google Scholar]


Publisher’s Note: MDPI stays neutral with regard to jurisdictional claims in published maps and institutional affiliations. |
© 2022 by the authors. Licensee MDPI, Basel, Switzerland. This article is an open access article distributed under the terms and conditions of the Creative Commons Attribution (CC BY) license (https://creativecommons.org/licenses/by/4.0/).
Share and Cite
Peng, S.; Zhang, H.; Qi, C.; Xu, J.; Ma, R.; Dai, S. Impact Pressure Distribution Recognition for Large Non-Cooperative Target in Ground Detumbling Experiment. Aerospace 2022, 9, 226. https://doi.org/10.3390/aerospace9050226
Peng S, Zhang H, Qi C, Xu J, Ma R, Dai S. Impact Pressure Distribution Recognition for Large Non-Cooperative Target in Ground Detumbling Experiment. Aerospace. 2022; 9(5):226. https://doi.org/10.3390/aerospace9050226
Chicago/Turabian StylePeng, Siqi, Huibo Zhang, Chaoqun Qi, Jialiang Xu, Rui Ma, and Shijie Dai. 2022. "Impact Pressure Distribution Recognition for Large Non-Cooperative Target in Ground Detumbling Experiment" Aerospace 9, no. 5: 226. https://doi.org/10.3390/aerospace9050226
APA StylePeng, S., Zhang, H., Qi, C., Xu, J., Ma, R., & Dai, S. (2022). Impact Pressure Distribution Recognition for Large Non-Cooperative Target in Ground Detumbling Experiment. Aerospace, 9(5), 226. https://doi.org/10.3390/aerospace9050226