Article

A Study on Dynamic Characteristics of Thin-Walled Cylindrical Cavities with a Large Aspect Ratio

College of Aerospace and Civil Engineering, Harbin Engineering University, Harbin 150001, China
*
Author to whom correspondence should be addressed.
Aerospace 2022, 9(4), 174; https://doi.org/10.3390/aerospace9040174
Submission received: 5 February 2022 / Revised: 4 March 2022 / Accepted: 18 March 2022 / Published: 22 March 2022

Abstract

:
The unstable combustion problem in small-sized solid rocket engines with a large aspect ratio is so complicated that its causes remain unclear. In this study, the coupled vibration between the sound field and shell in the engines was proposed as a possible cause. A solid rocket engine structure was abstracted into a multilayer thin-walled cylindrical cavity in this study, followed by the theoretical calculation and simulation calculation of its inherent frequency. Next, a thin-walled cylindrical cavity fluid-solid coupling experimental platform with the function of modal measurement was established to verify the accuracy of simulated modes for the shell structure and acoustic cavity. Then, the mode of the finite element model (FEM) for the solid rocket engine was theoretically calculated and simulated, accompanied by finite element calculation and experiment of the acoustic mode of the internal acoustic cavity. Subsequently, the engine mode was compared with the acoustic mode of the internal acoustic cavity. On this basis, a new cause for the damage and disintegration of the solid rocket engines in the final working stage was revealed. Moreover, a brand-new idea of inhibiting the pressure oscillation-induced unstable combustion in the solid rocket engines was put forward.

1. Introduction

The unsteady combustion of solid rockets with a large aspect ratio at the end of the flight is a crucial problem in the design of solid rockets. According to the published literature, the main reason for the unsteady combustion is related to the unstable internal flow field [1]. However, the real mechanism is unclear. In recent years, the problem of pressure oscillation has taken place frequently in the process of developing the solid rockets with a large aspect ratio by China. It was also observed that the whole body is subjected to the fundamental-frequency vibration or multiple-frequency vibration with the acoustic field of engine combustion, so the changes of engine structure during the flight can exert key impacts on the unsteady combustion. Based on the observed phenomenon, simulation methods validated through experiments were adopted to study the transient dynamics of the engine finite element models of the stably flying solid rockets under the cruising condition, so as to provide new ideas for studying the problem of unsteady combustion of the solid rocket engines.
The unsteady combustion occurred in the solid rocket engines is also called combustion oscillation or combustion instability, running through the whole development history of the modern solid rocket engines. Its main features are the periodic changes in combustion chamber pressure and propellant combustion velocity and the change frequency is fluctuating around the natural frequency of the acoustic cavity. And the anomalous change of shell temperature and the violent structural oscillation may also happen [2,3,4,5,6]. If coupling takes place between the unstable internal flow field and structural oscillation, the instability effect may be enlarged, thereby causing a series of chain reactions, which include but are not limited to the unstable flight attitude, external trajectory deviation, and shell destruction or even explosion.
In accordance with the research results of the previous literature, it is generally thought that combustion instability within the large size segmented solid rocket engines is mainly led by the acoustic-vortex coupling [7,8,9,10] and the main reasons for combustion instability within the small size tactical engines are diverse, which may be relevant to the coupling between the acoustic field and combustion [11,12]. Besides, unsteady combustion within the small size tactical engines may also be induced by the vibration of the engine case [13,14,15]. In addition, periodic air intake disturbance and combustion of aluminum droplets are also considered as driving mechanism of unsteady combustion within the small size tactical engines [16,17]. It can be seen that the problem of unsteady combustion is quite complex, involving the integration of multiple disciplines, and the knowledge about vibration mechanics and aerodynamics of body structure is needed to deeply understand the physical process [18,19,20,21,22,23,24,25]. Two algorithms for an automatic optimal block decomposition for complex geometries with arbitrary profiles based on genetic algorithm theory are proposed by Lu. Z. [26]. Mohammad Rezaiee-Pajand and Amir R. Masoodi developed an efficient three-node triangular element, for geometrically nonlinear analysis of FG doubly-curved thin and moderately thick shells [27]. M. Rezaiee-Pajand and Amir R. Masoodi studied the buckling and post-buckling behavior of plates and shells using the full Lagrange formula [28]. Free vibration analysis of sandwich composite joined conical-cylindrical-conical shells is implemented using first-order shear deformation theory (FSDT) by Emad Sobhani [29]. Moreover, the major inducements for combustion instability of different solid rocket engines are distinct, so this problem has not been solved in its true sense.
In this paper, the theoretical and simulation calculation was conducted on the natural frequency of the shell structure (a multilayer thin-walled cylindrical cavity with a large slenderness ratio) of a solid rocket engine, so as to investigate the problem of coupling vibration in the solid rocket engine during the flight. Besides, an experimental platform for verification was established for the cylindrical cavity with a large slenderness ratio, and the correctness of the simulation calculation of acoustic mode and shell mode was validated through the measured natural frequency of the acoustic excitation acoustic cavity mode and the shell. Next, the theoretical and simulation calculations were made on the shell mode of the solid rocket engine finite element model set, and the finite element calculation of the acoustic mode of the internal acoustic cavity was carried out.

2. Materials and Methods

2.1. Calculation of Natural Frequency of Three-Layer Cylindrical Shell

The structure of the solid rocket engine was abstracted into a three-layer cylindrical shell comprising a shell, a thermal insulation layer and a grain. The displacement in the thickness direction of the three-layer cylindrical shell could be expressed by the displacement of the middle plane, where w , ν and u stood for the radial, axial and tangential directions, respectively. The turning angles were expressed as ψ 1 and ψ 2 , respectively. Based on the first-order shear deformation theory (FSDT), the total displacement field was expressed by:
u i s , θ , ζ , t = u 0 i s , θ , t + ζ ψ 1 i s , θ , t v i s , θ , ζ , t = v 0 i s , θ , t + ζ ψ 2 i s , θ , t h i 2 < ζ < h i 2   w i = v i s , θ , t
i = b , t and c represent the outermost, middle and innermost layers, respectively. ζ 1 , ζ 2 , and ζ are the coordinates of the outermost, middle and the innermost layers in the thickness direction, respectively. h i is radial thickness. With u , ν, and w for the displacements in the axial direction s , the rotation angle θ and the thickness direction, respectively and full contact as the boundary condition, the following equation was obtained:
ζ 1 = h 1 / 2   ζ = h c / 2 u t = u c   v t = v c   w t = w c ζ 2 = h b / 2   ζ = h c / 2 : u b = u c   v b = v c   w b = w c
Under the above boundary condition, the displacement field was expressed as:
u t = u 0 c + h t ψ 1 t + h c ψ 1 c 2 + ζ 1 ψ 1 t h t 2 < ζ 1 < h t 2 v t = v 0 c + h t ψ 2 t + h c ψ 2 c 2 + ζ 1 ψ 2 t   u b = u 0 c h b ψ 1 b + h c ψ 1 c 2 + ζ 2 ψ 1 b h b 2 < ζ 2 < h b 2
v b = v 0 c h b ψ 2 b + h c ψ 2 c 2 + ζ 2 ψ 2 b  
According to the boundary conditions in equation (2), the translational displacements u c 0 , v c 0 and w c 0 and the rotation angles ψ 1 c , β 1   and β 2 of the innermost and innermost layers are as follows:
u t = u 0 c + h c 2 2 1 + v c β 1 w 0 c s h c 2 8 ψ 1 c s + h c 3 48 2 β 1 s 2 + 2 β 2 a θ s + h t 2 ψ 1 t + ζ 1 ψ 1 t v t = v 0 c + h c 2 2 1 + v c β 1 w 0 c a θ h c 2 8 ψ 1 c a θ + h c 3 48 2 β 1 a θ s + 2 β 2 a 2 θ 2 + h t 2 ψ 2 t + ζ 1 ψ 2 t w t = w 0 c + h c 2 ψ 1 c h c 2 8 β 1 s + β 2 a θ  
u b = u 0 c h c 2 2 1 + v c β 1 w 0 c s h c 2 8 ψ 1 c s h c 3 48 2 β 1 s 2 + 2 β 2 a θ s h b 2 ψ 1 b + ζ 2 ψ 1 b v b = v 0 c h c 2 2 1 + v c β 2 w 0 c a θ h c 2 8 ψ 1 c a θ h c 3 48 2 β 1 a θ s + 2 β 2 a 2 θ 2 h b 2 ψ 2 b + ζ 2 ψ 2 b w b = w 0 c h c 2 ψ 1 c h c 2 8 β 1 s + β 2 a θ  
β is the ratio of shear stress to elastic modulus.
The total kinetic energy U T and strain energy U E were written into the matrix of each element:
U T = 1 2 q ˙ e T M e q ˙ e U E = h 2 h 2 0 2 π L 2 L 2 1 2 σ T ε d V = 1 2 q e T K e q e  
where, σ is the stress, ε is the strain, V is the volume, L is the length of cylinder, M e is the mass matrix, K e is the stiffness matrix.
The following kinematic equation was established using Hamilton’s principle:
δ t 0 t 1 U U T W = 0  
where, W is the work from the external force, U T stands for the total kinetic energy, and U is the total strain energy ( U = U E + U G ). t 1 and t 2 were always constant [30]. After substituting all energy equations and element stiffness and mass matrices into the above equation, the following kinematic equation was acquired:
M q ¨ + K q = F t  
where, F t is the equivalent nodal force of the system, K   =   K G + K E is the stiffness matrix of the system, and [M] is the mass matrix.
Under the static condition, the change in strain energy was equivalent to the internal/external pressure of the cylindrical shell ( δ U s = δ W p ) introduced by energy changes based on Hamilton’s principle. After plugging the energy, the following force item was obtained in U s introduced by heat:
K s e q s e F T h = F p  
where, F T h and F P are thermal and external forces, K S is the static stiffness matrix of the element, and q S is the static deflection. After substituting, the displacement field and stress components were defined as initial stress at each layer. A dynamic response equation was determined based on consideration of these prestress. In free vibration analysis, the constitutive equation was as follows:
ω 2 M + K ω q = 0  
where, K = K ω + i K ω is a complex damping layer stiffness matrix, related to frequency. The eigenvalue problem was not directly solved due to relevant characteristics of frequency. The natural frequency could be calculated by developing the frequency range of the frequency response band of the structure under harmonic loading. Besides, the natural frequency could be solved by calculating stiffness matrix iteration, thus solving the eigenvalue problem in the above equation. During iteration, the natural frequency of the bare cylindrical shell was the best starting point. Iteration was continuously performed until reaching the following convergence:
ω i ω i 1 ω i 1 λ 1  
where, λ 1 is the convergence tolerance, which is 10−5.
The time-varying grain thickness was expressed as below:
h b t = h b 0 t h 0  
where h b 0 is the initial thickness, t denotes time, and h 0 stands for the grain combustion thickness per second.
H b   in the formula was substituted by h b t .
Then, the following holds true in Equation (2):
ζ 2 = h b t 2  
Equation (4) was written into the following form:
u b = u 0 c h b t ψ 1 b + h c ψ 1 c 2 + ζ 2 ψ 1 b h b t 2 < ζ 2 < h b t 2 v b = v 0 c h b t ψ 2 b + h c ψ 2 c 2 + ζ 2 ψ 2 b  
Equation (6) was expressed as follows:
u b = u 0 c h c 2 2 1 + v C β 1 w 0 c s h c 2 8 ψ 1 c s h c 3 48 2 β 1 s 2 + 2 β 2 a θ s h b t 2 ψ 1 b + ζ 2 ψ 1 b v b = v 0 c h c 2 2 1 + v C β 2 w 0 c a θ h c 2 8 ψ 1 c a θ h c 3 48 2 β 1 a θ s + 2 β 2 a 2 θ 2 h b t 2 ψ 2 b + ζ 2 ψ 2 b

2.2. Experiment of Natural Frequency of Three-Layer Cylindrical Shell

In the modal experiment, a specimen was generally supported by two ways: free suspension and maintaining the original boundary conditions of the specimen. The free suspension generally refers to suspending the entire system with elastic ropes or installing the entire system on a foam pad, requiring that the resonance frequency of the support itself is much lower than the first-order resonance frequency of the specimen. The latter method is generally used in studies on structural resonance frequencies and vibration isolation technologies.
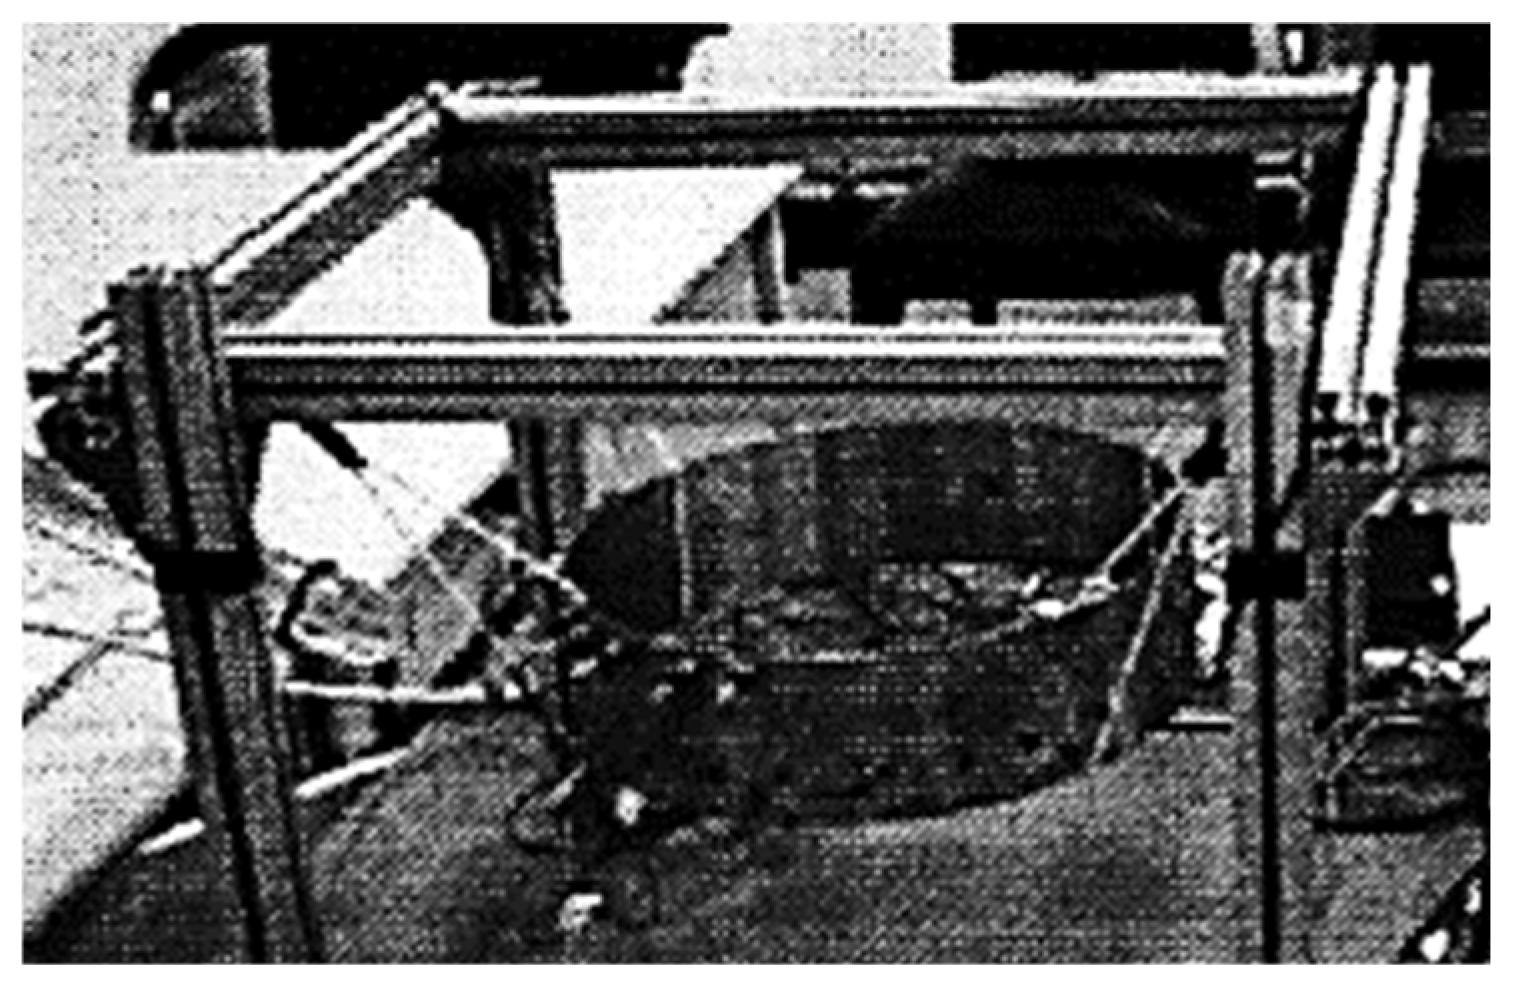
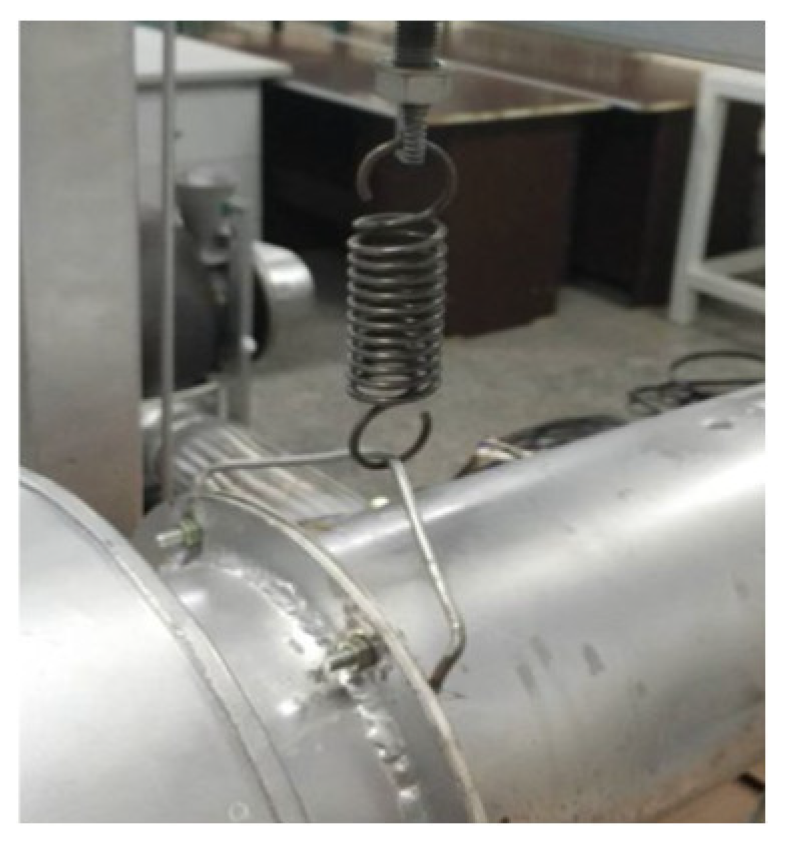
As shown in Figure 1, the three-layer cylindrical shell specimen was suspended using flexible ropes, better approximating the free state. At this time, the system had six stiffness modes, namely three translational modes and three rotational modes. In the experiment, the hammer impulse method was employed for vibration excitation, with one-point excitation and multi-point response measurement for testing.
A viscoelastic three-layer cylindrical shell was adopted as the calculation and experimental model, consisting of the outermost shell (steel), the middle layer (rubber) and the innermost layer (galvanized sheet), with size parameters as follows:
L = 80 mm; h 1 = 2 mm, h 2 = 2 mm, h 3 = 0.5 mm, R = 143 mm
Among them, L was the length of the cylindrical shell, h 1 , h 2 , and h 3 stood for the thickness of the outermost shell, the middle layer and the innermost layer, respectively, and R was the radius of the middle surface of the outermost layer.

2.3. The Cylindrical Cavity Fluid-Solid Coupling Experimental Platform

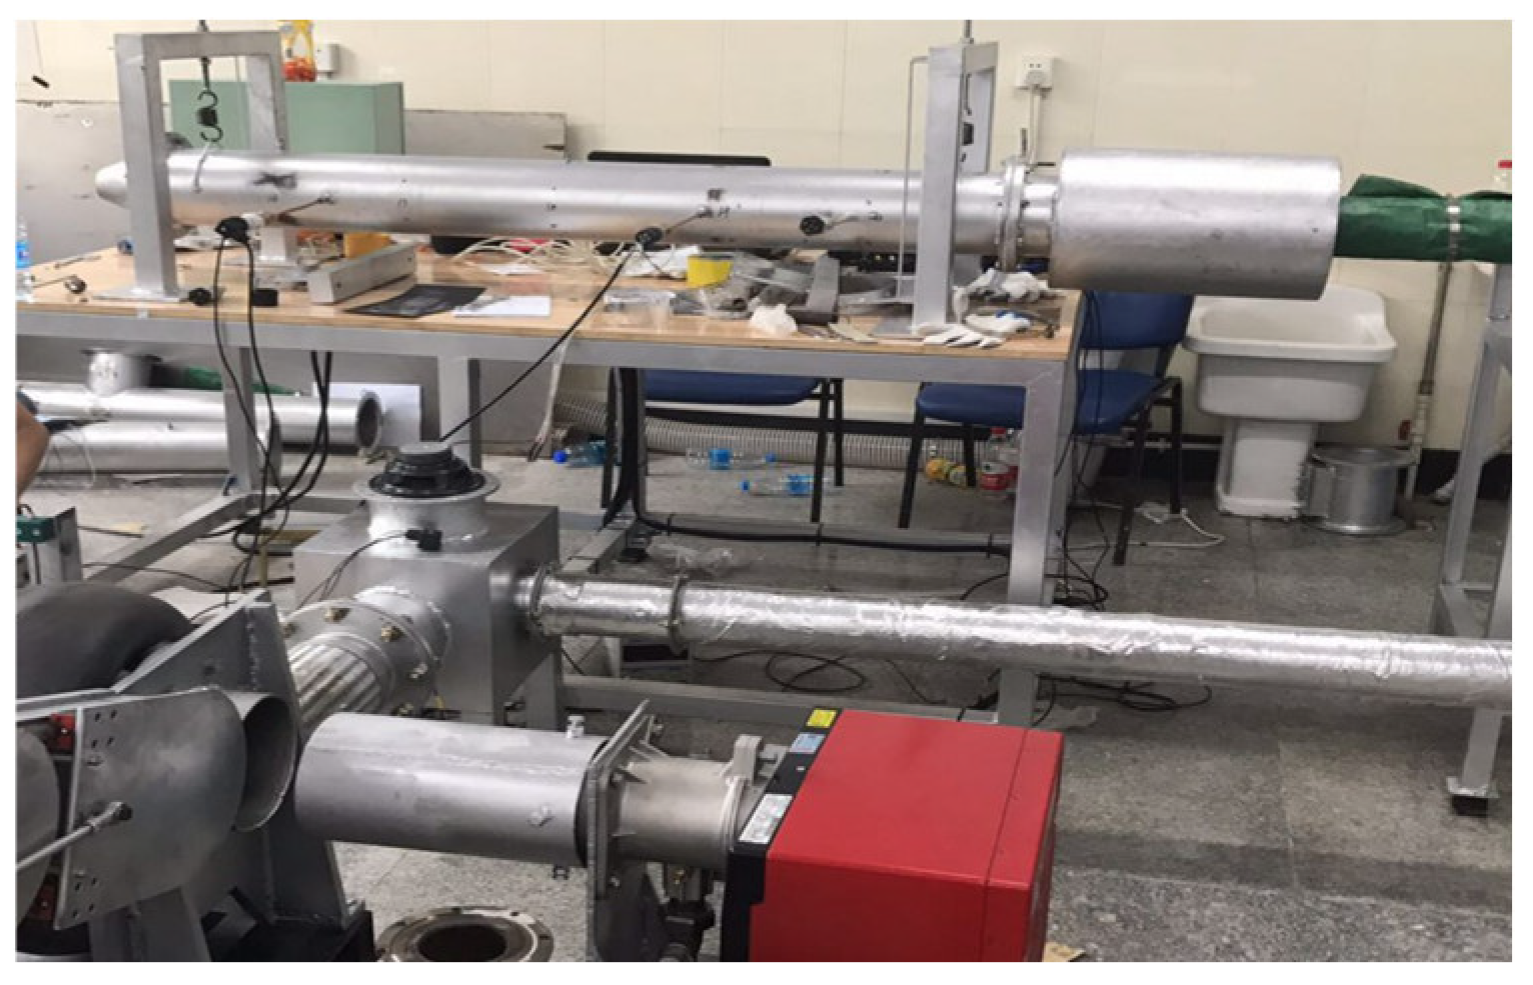
The cylindrical cavity fluid-solid coupling experimental platform is shown in Figure 2, where rectifying device was set at the right end of the cylindrical cavity and the air outlet caliber was adjustable to ensure the air-in at one end and air-out at the other. Mount points were set on the flanges at the two ends of the cavity, which is shown in Figure 3 could be mounted by springs with different stiffness or steel hoops onto the experimental benches to realize different constraints.
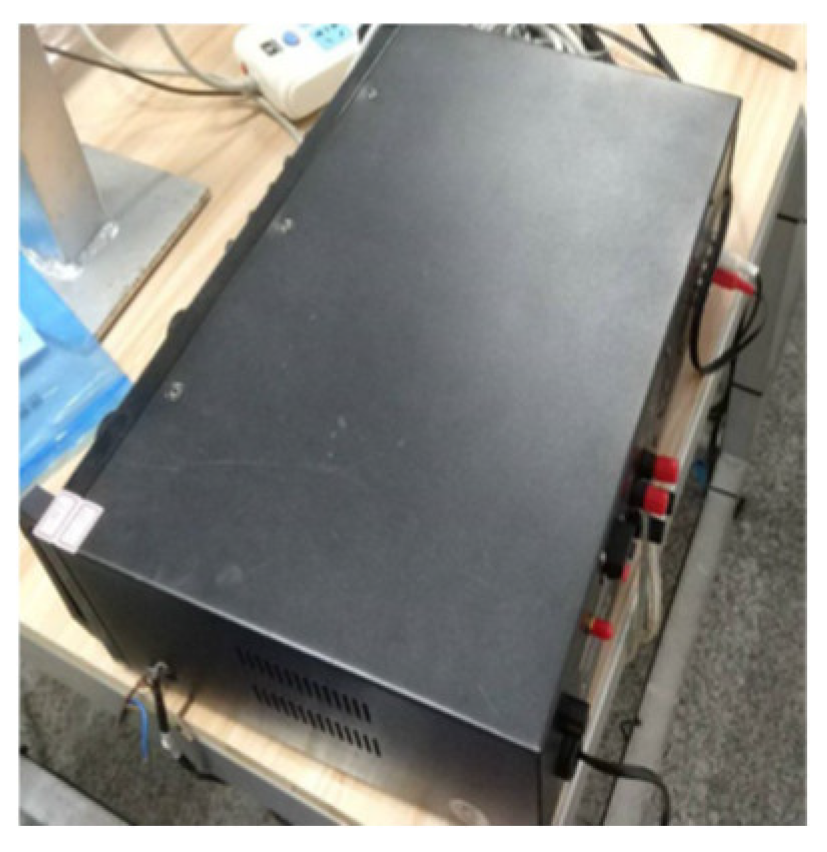
Different acoustic excitation signals were provided by high power loudspeakers and acoustic power amplifiers. The model of acoustic pressure sensors and acceleration sensors arranged at different positions in the cavity was CYB41 and 2258A-10. The power amplifiers is shown in 
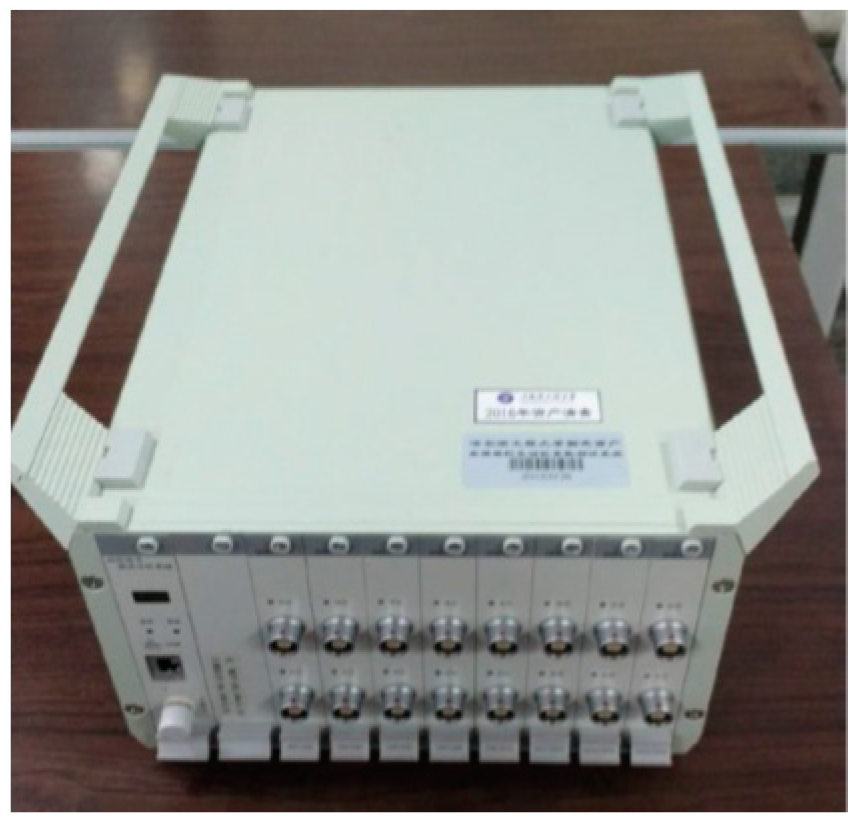
Figure 4. The dynamic signal acquisition card with model of Donghua DH8302 which is shown in Figure 5 communicated with computers through computer network cards to reach real-time data transmission, showing high test accuracy and strong anti-interference ability and guaranteeing the accurate and reliable test results.
Experiments under different conditions could be carried out on the experimental platform built: (1) pulsed excitation (force hammer), white noise excitation, acoustic excitation with constant frequency, acoustic swept frequency excitation, and cold flow and hot flow excitations could be selected. Specifically, the sensors under hot flow excitation should be replaced with high temperature sensors. (2) the models could be changed in thickness, length and shape. (3) soft spring constraint, hard spring constraint, and clamped constraint at different positions were available. (4) time domain information of various physical quantity could be obtained by collecting signals such as wind speed, pressure, acceleration, and strain. In addition, frequency domain measurement technology based on the discrete Fourier transform method offered by software could be applied to acquire the real-time frequency domain information for the corresponding signals.
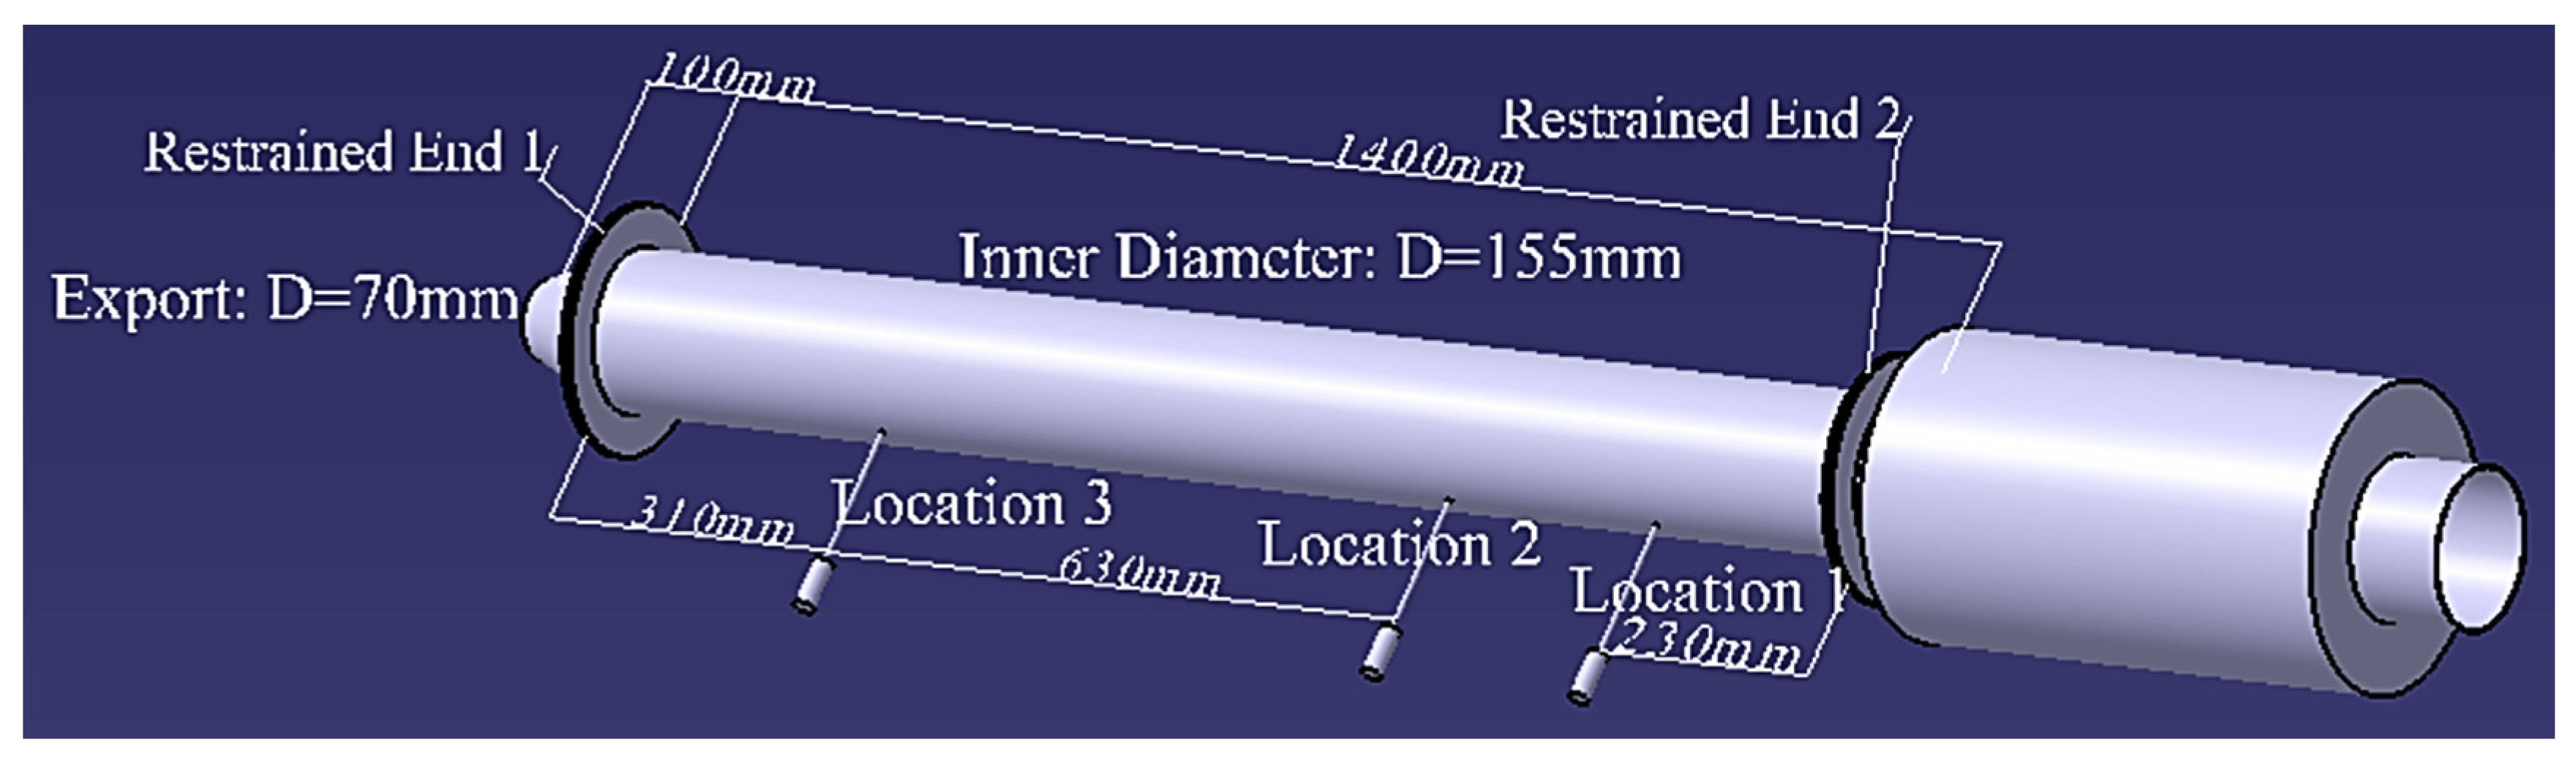
The cylindrical shell is shown as Figure 2, and its dimension, and position of sensor and constraint are presented in Figure 6. To be specific, clamped or spring constraint could be carried out at the restrained ends 1 and 2, the pressure sensor or microphone could be installed at position 1, 2, and 3, the microphone or anemograph could be set at position 4 and the acceleration sensor could be arranged between the two restrained ends.
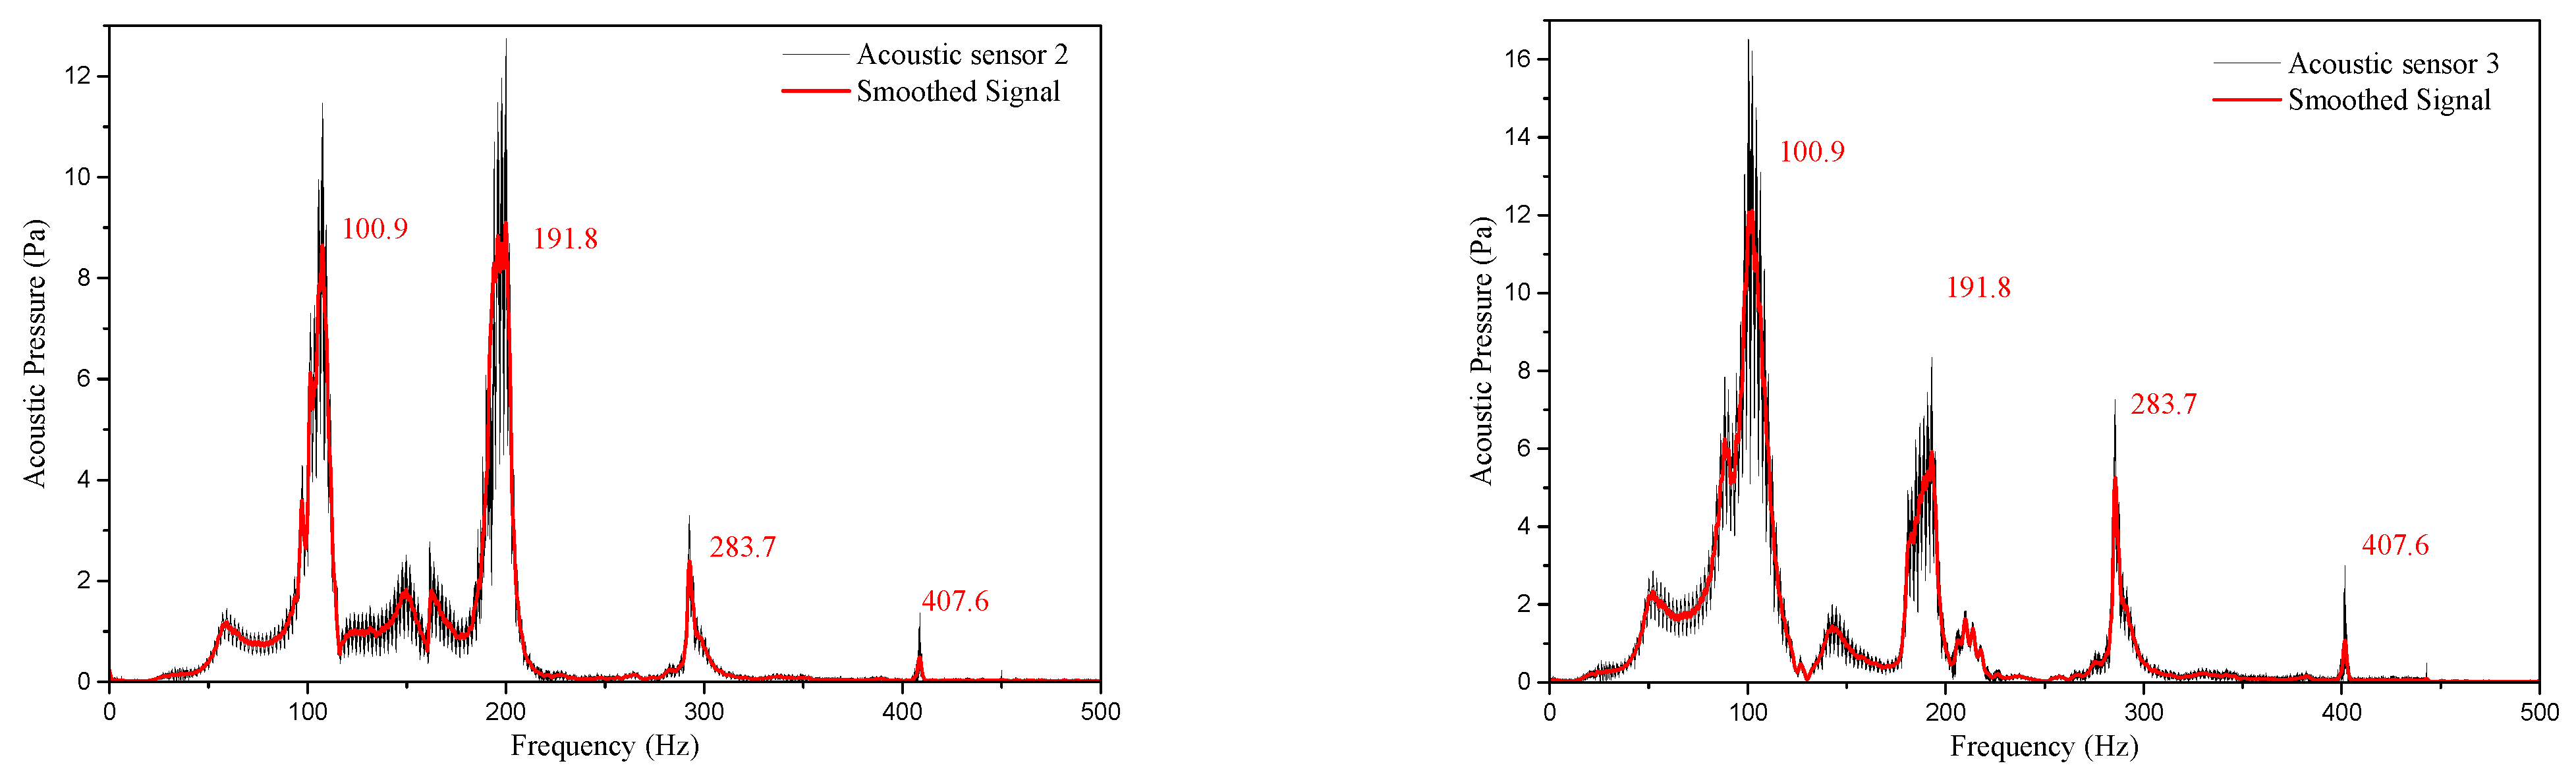
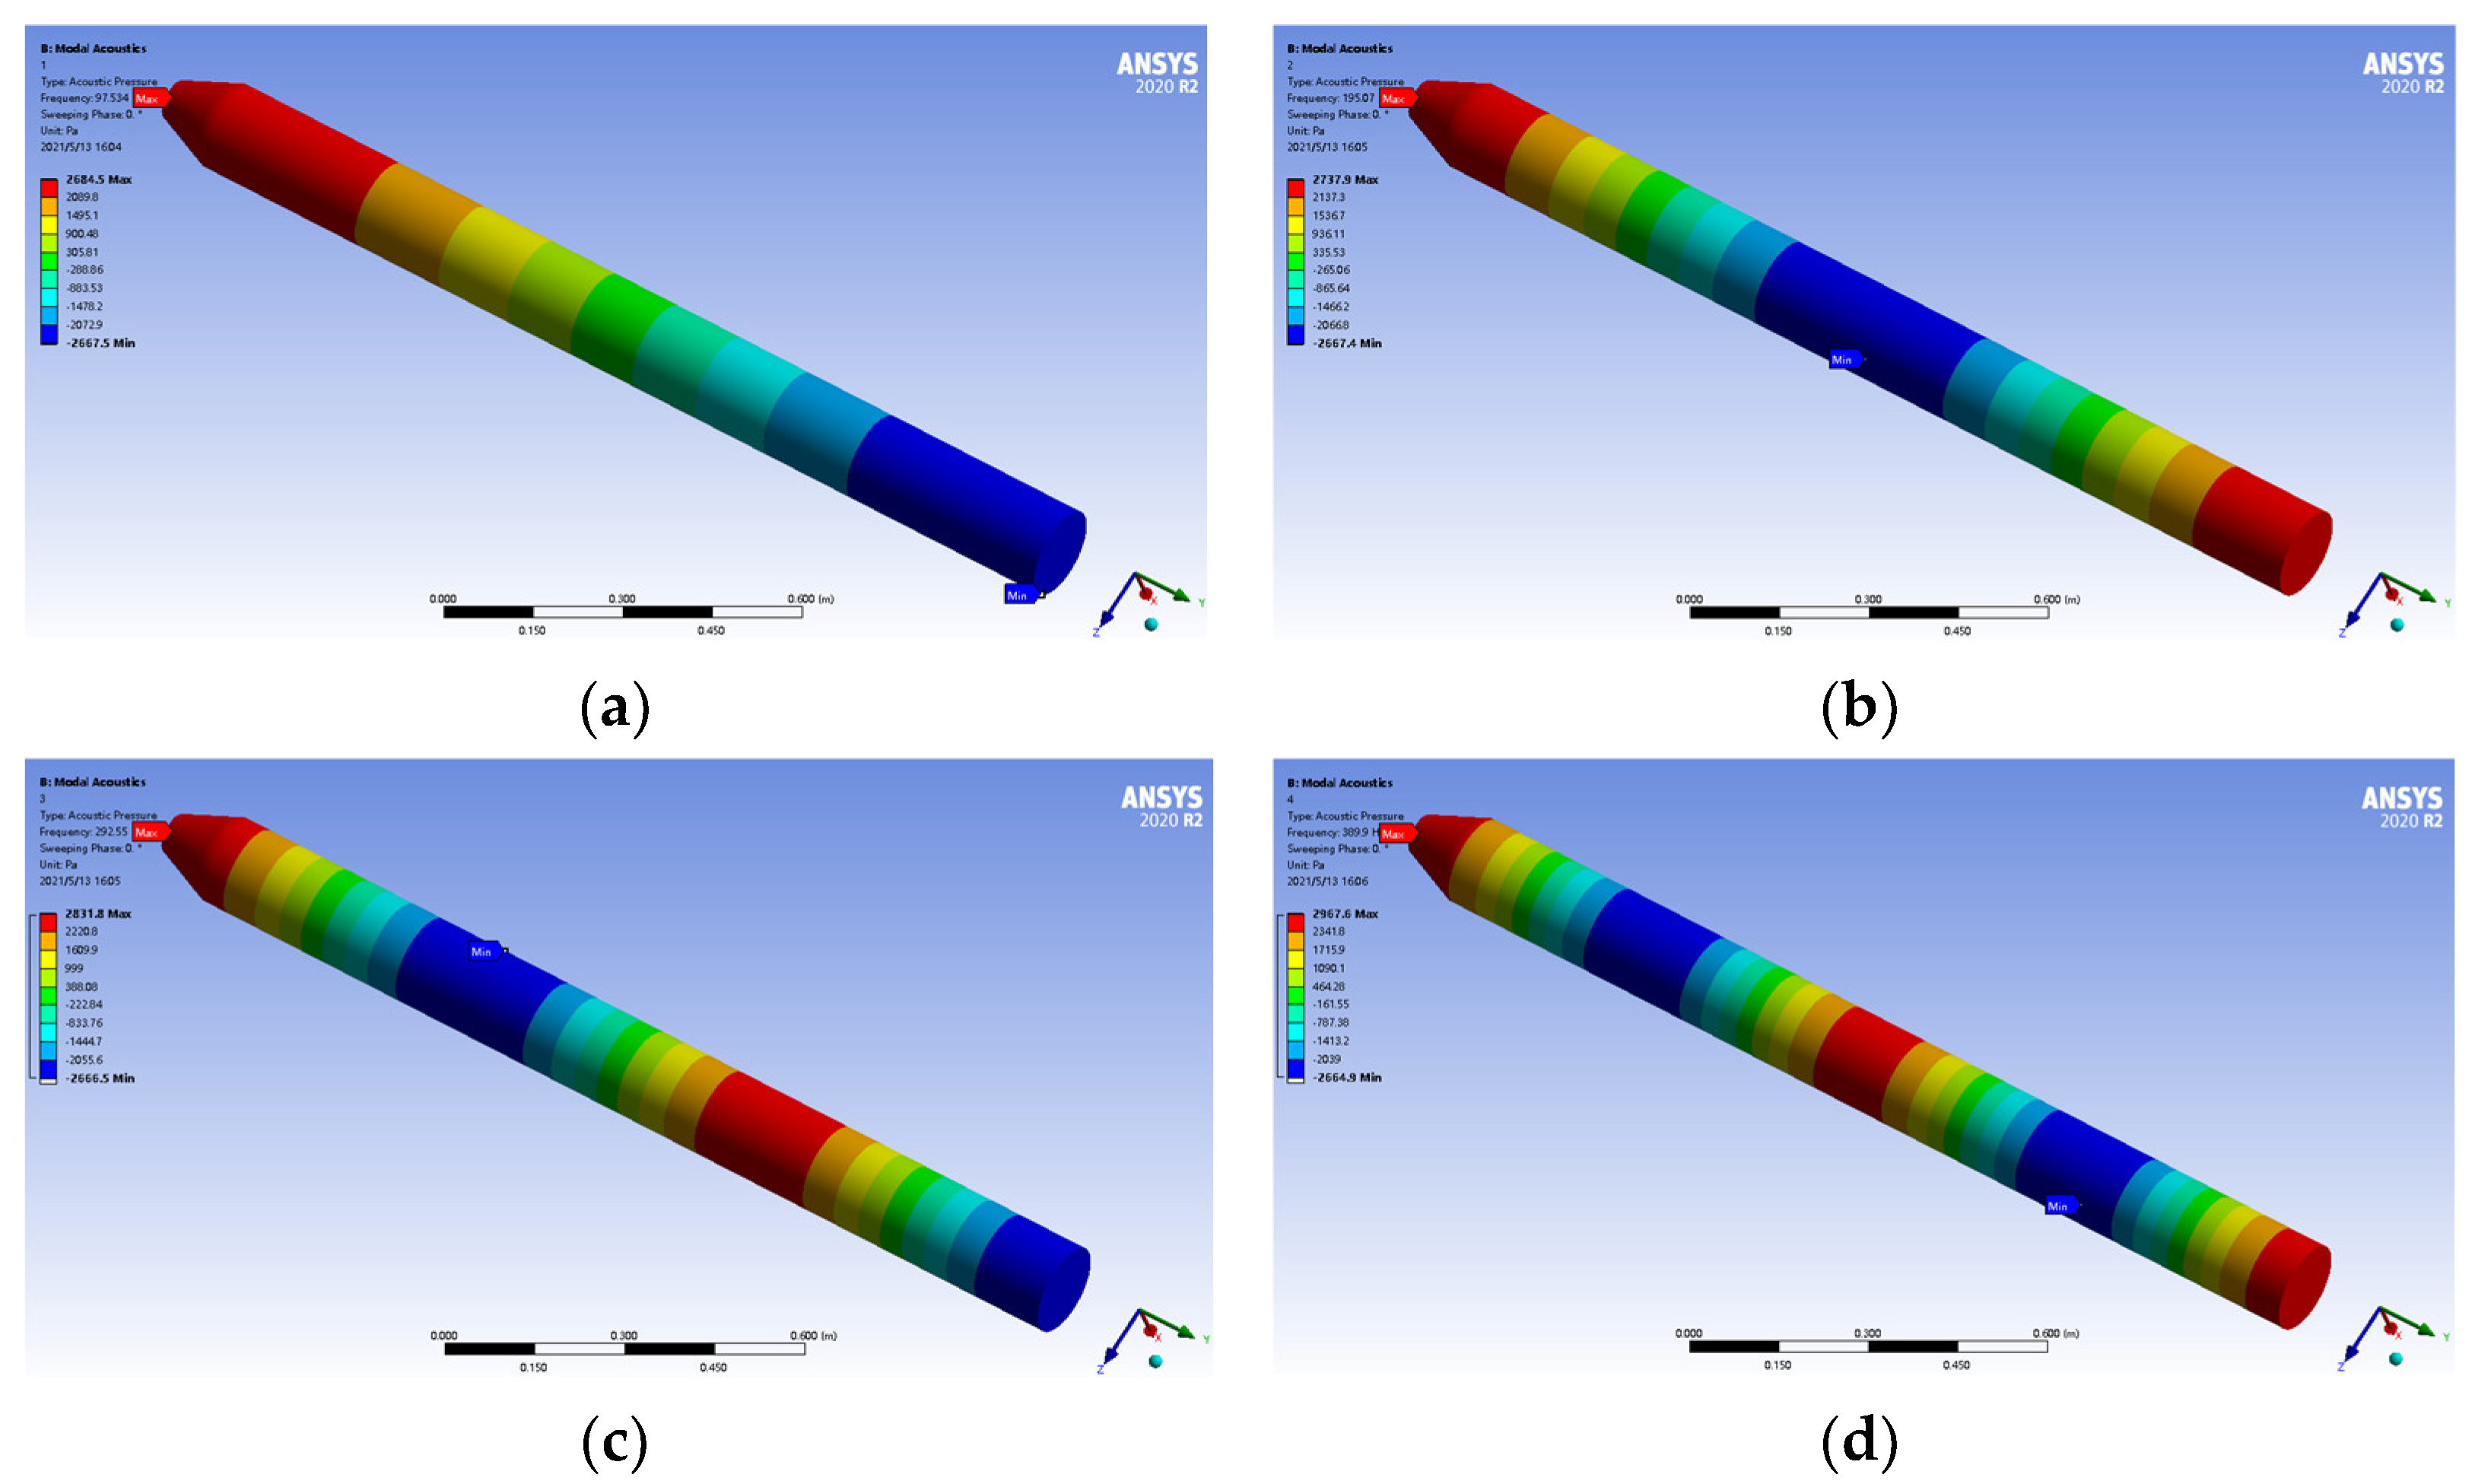
In accordance with the experimental devices and conditions, the implementable random excitation signal was adopted to measure the acoustic mode of the acoustic cavity. An open-source toolkit could be applied to gain the white noise signal. The signal was firstly amplified by the power amplifiers, and was transformed into acoustic pressure signals through high power loudspeakers. The acoustic waves entered the cylindrical-like acoustic cavity through the hard pipelines, soft pipelines and rectifying devices successively and were measured by pressure sensors or microphones at different positions.

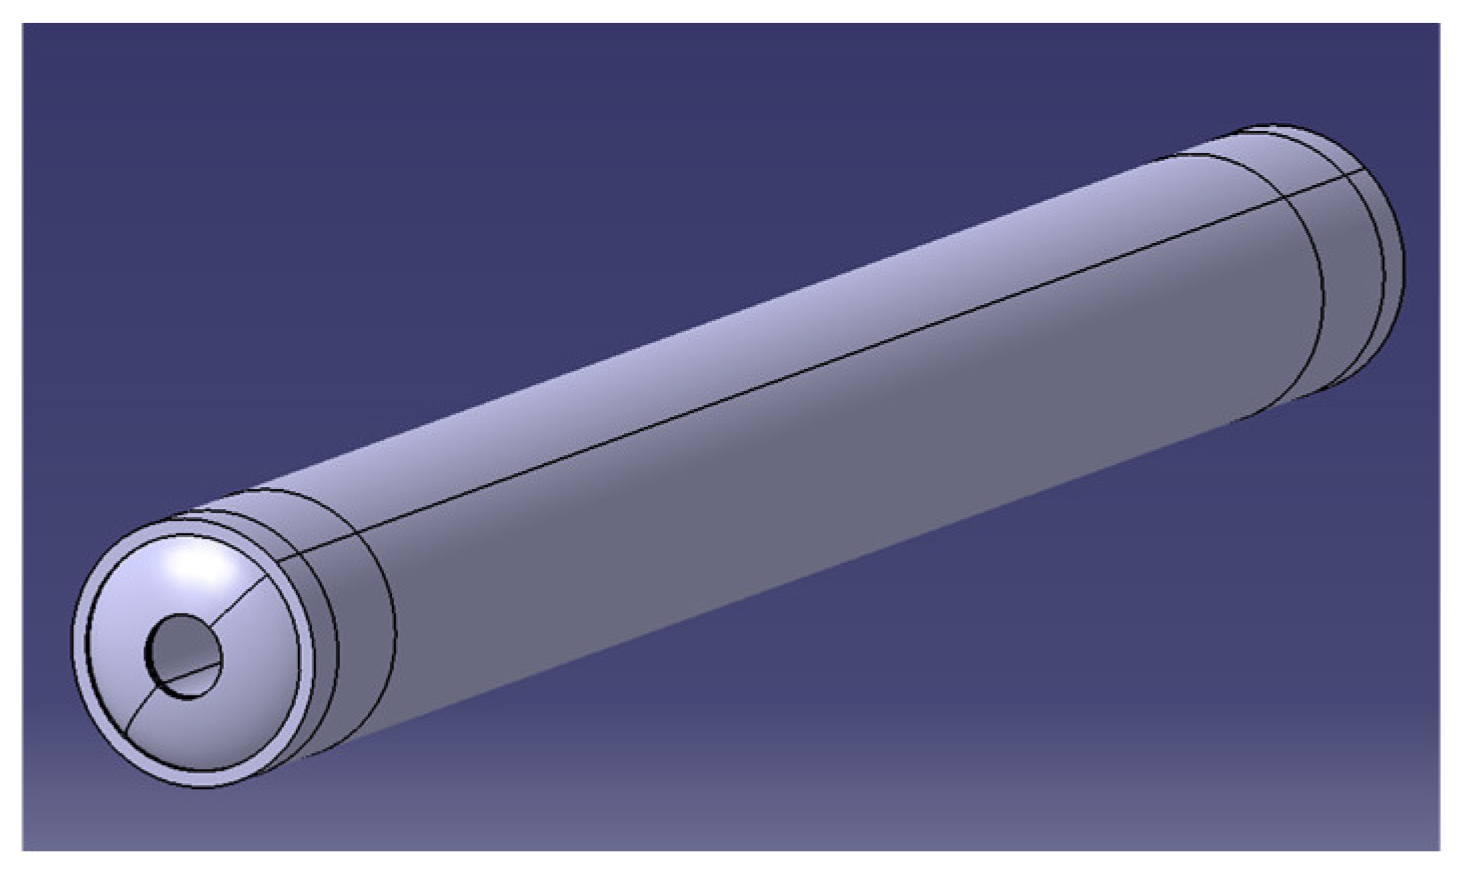
2.4. Model of the Natural Frequency of the Shell in Case of Time-Varying Grain Thickness under the Working Condition of the Solid Rocket Engine

The rocket engine parameters in related literatures [31] were referenced for the model. The rocket engine was made of three-layer materials, i.e., shell, heat insulating layer and propellant grain from the outside to the inside. The material parameters are listed in the following Table 1 and the model structure is shown in Figure 1. In theoretical calculation, the model was abstracted into a three-layer cylindrical shell. Structure of the solid rocket engine model is shown in Figure 7.
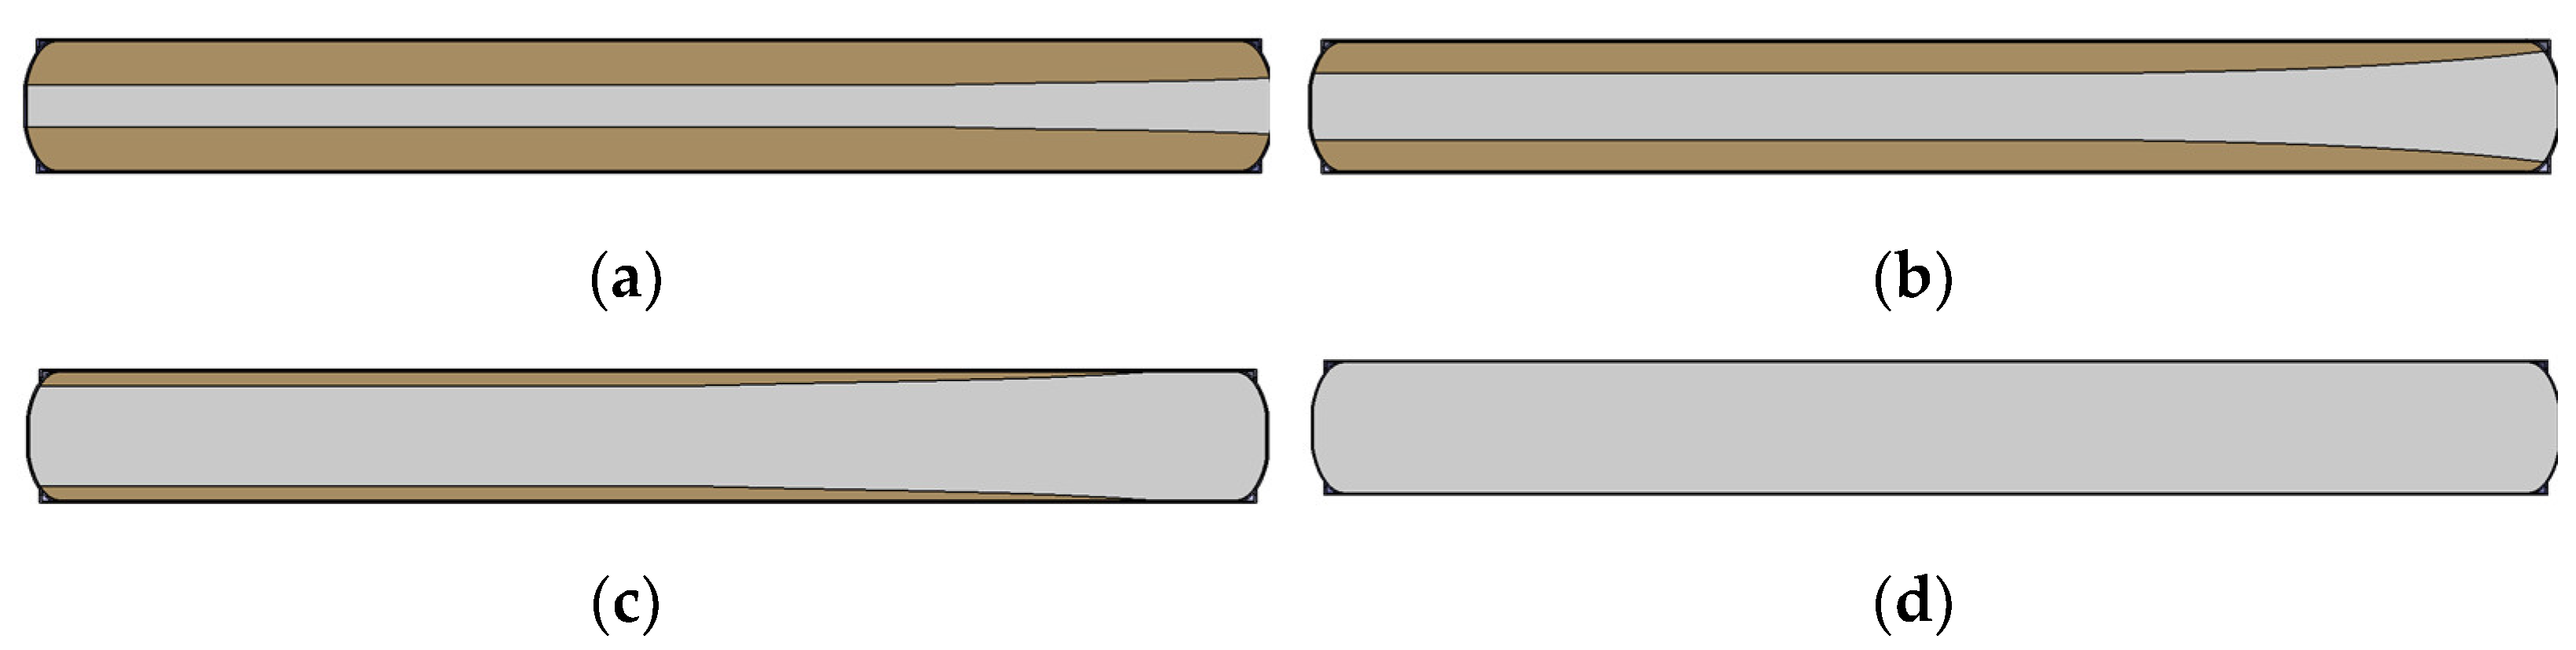
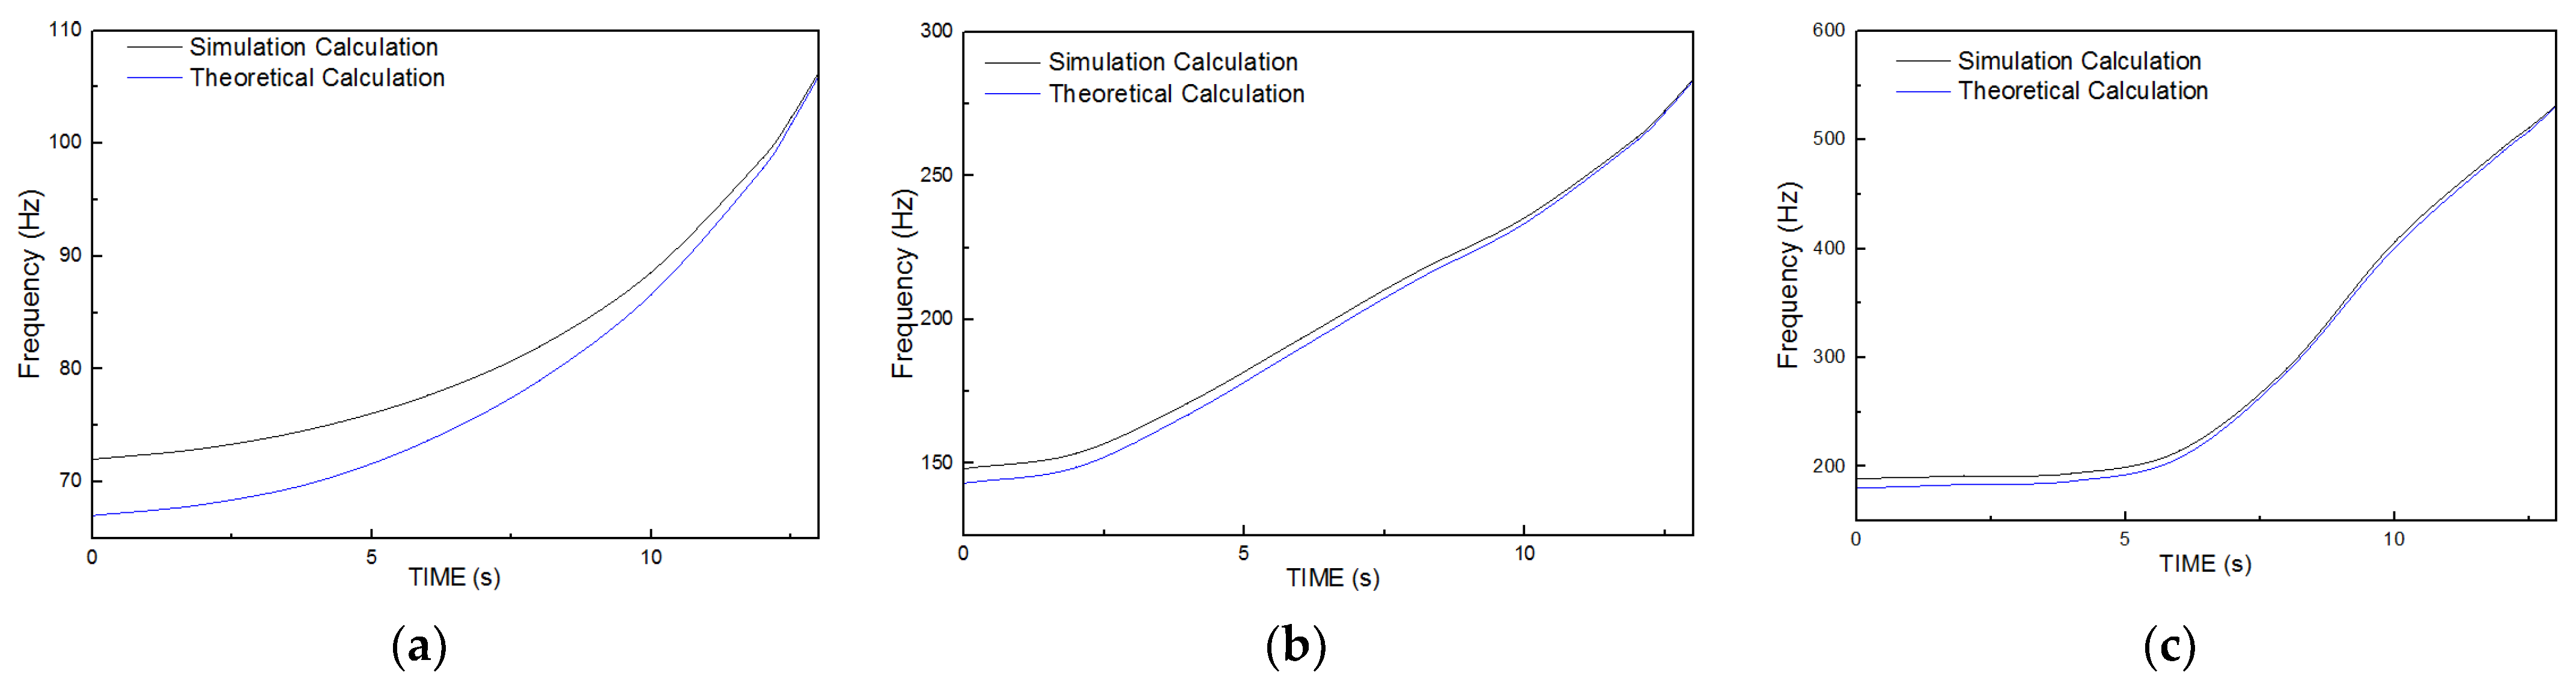
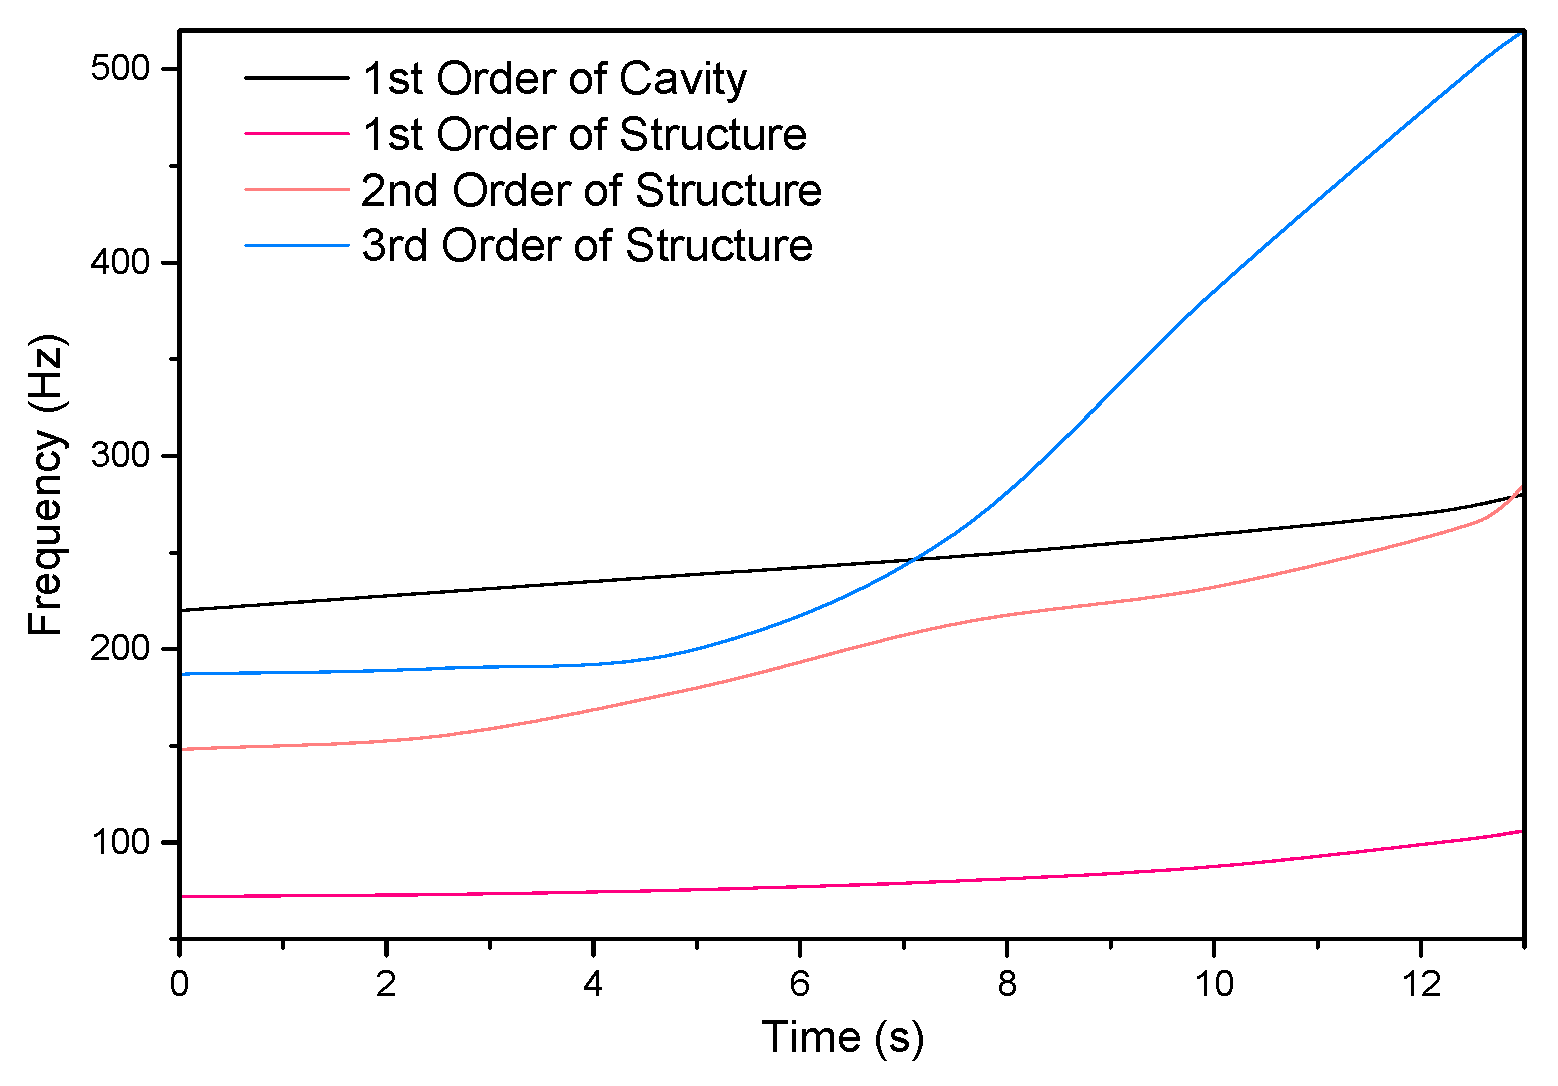
As for the combustion parameters of the propellant grain, the combustion velocity was h 0 = 5 mm/s, and the propellant grain was burned out after the engine working for 13 s. The changes of engine internal structure during grain combustion are shown in Figure 8. The model was divided into hexahedral elements with a size of 10 mm. Element numbers of each model are as follows: 2s-103700, 6s-87350, 10s-63680 and 13s-54800.

3. Results

3.1. Natural Frequency of Three-Layer Cylindrical Shell

3.1.1. Theoretical Calculation

Theoretical calculation was carried out on the model under two boundary conditions: (1) completely free constraint of the three-layer cylindrical shell, and (2) employment of the spring constraint to simulate the suspension rope in the experiment. The calculation results are shown in Table 2.

3.1.2. Simulation Calculation

Ansys simulation was utilized for the calculation of the natural frequency of the three-layer cylindrical shell. Modeling was conducted with solid model, with completely free constraints. The model was divided into 18320 hexahedral elements with a size of 10 mm. The first six-order natural frequencies were translation and rotation in the three directions, so the seventh to the ninth-order natural frequencies were the first three-order valid natural frequencies of the model. The first three-order natural frequencies of the model obtained via simulation calculation are shown in Table 3.

3.1.3. Experiment and Comparison

Theoretical and simulation calculations of the natural frequency of the viscoelastic three-layer cylindrical shell are introduced in Section 3.1.2 and Section 3.1.3, respectively. Their results were compared with experimental results (Figure 9). It was found that the results of theoretical calculation were similar to the simulation and experimental results under the two boundary conditions with the same tendencies.

3.2. Experimental Validation of Acoustic Mode of the Cylindrical Cavity

In this paper, finite element software ANSYS Workbench 2020 was adopted to calculate the acoustic mode of the acoustic cavity in the cylindrical case, and white noise experiment was made on the fluid-solid coupling experimental platform to validate the acoustic frequency in the acoustic cavity in the cylindrical shell.
Figure 10 reveals the pressure amplitude-frequency characteristic curves at position 2 and 3, where the black solid lines referred to the original experimental results and the red solid lines referred to the results after the smoothing treatment.
ANSYS Workbench software was applied to calculate and analyze the mode of internal acoustic cavity of the shell model as shown in Figure 6, where the material parameter of air under indoor temperature was selected with air density of 1.29 kg/m3 and average sound speed of 345 m/s. Figure 11 presents the first four order vibration modes of the acoustic cavity, which could be figured out as the axial vibration mode.
Different hexahedral mesh element sizes were set by using ANSYS ICEM software to divide the mesh for the structure, so the acoustic mode of acoustic cavity with different mesh numbers was obtained as shown in Table 4. It could be observed in the table that the first four order natural frequencies of the acoustic cavity were not sensitive to the mesh size, i.e., the result tended to be stable when the mesh size was smaller than 15 mm. The mesh size of 10 mm was chosen in the acoustic mode calculation in this paper.

3.3. Experimental Validation of Cylindrical Shell Structure Mode

Furthermore, the correctness of the calculated mode for the cylindrical shell structure was verified using a cylindrical cavity fluid-solid coupling experimental platform. The model structure shown in Figure 6 was used as well. According to the experimental conditions, this structure was experimented through the hammer impulse method.
A solid rocket presents approximately free-free boundaries during its flight, which can be hardly realized in the laboratory environment. The methods commonly used to simulate free boundaries include rubber rope suspension, air spring support, sponge pad support, air cushion support, and soft flexible support or suspension. Based on the system features and experimental conditions, the soft spring suspension constraint was selected.
The time-domain signals of acceleration sensors at different positions were acquired through the hammer impulse method, followed by Fourier transform to acquire frequency domain signals. It was experimentally found that the peak acceleration frequencies at different system positions were basically identical, but the peak values were varied, which accorded with the pressure signal laws in an acoustic cavity. Next, the acceleration signals of two sensors at different positions were taken for the analysis. The acceleration amplitude-frequency characteristic curves monitored by the sensors 2 and 3 are displayed in Figure 12. The low frequencies that could be easily externally excited were worthy of the main attention.
The mode of the cylindrical shell structure shown in Figure 2 was computationally analyzed. The material parameters of ordinary steel were selected for this shell structure, with the structural dimensions displayed in Figure 6. The first four order vibration modes of the engine shell are presented in Figure 13.
Meshes were generated for the shell structure via ANSYS ICEM by hexahedral element. Next, the inherent vibration frequency of this engine shell under different mesh quantities (mesh element size) was acquired, as seen in Table 5. It could be observed that the first four-order inherent frequencies of the engine shell were not sensitive to the mesh size, i.e., the result was basically stable when the mesh size was smaller than 10 mm. In this study, the mesh size was chosen as 10 mm in the modal calculation of this engine shell.

3.4. Inherent Characteristic of Solid Rocket Engine Shells

3.4.1. Theoretical and Simulation Calculations of Inherent Frequencies of Solid Rocket Engine Shells

The comparison between theoretical and simulation calculation results for the natural frequency of the rocket engine are as shown in Figure 14.

3.4.2. Comparison between Theoretical Calculation and Simulation Calculation Results Regarding the Changes in the Natural Frequency of the Engine under the Reduction of Propellant Grain Thickness with Time

The natural frequency of the rocket engine shell after working for 0–13 s was calculated theoretically and via ANSYS, respectively.
The theoretical calculation and simulation calculation results of the working time-varying first three order inherent frequencies of the rocket engine shell are as shown in Figure 15a–c.
After the rocket engine worked from 0 s until 13 s, the propellant grain was combusted from the thickness of 65 mm to 0 mm, and the first-order natural frequency of this multi-layer shell rose from about 70 Hz to 106 Hz or so. Within the initial working time, the first-order natural frequency grew slowly, but it increased rapidly after the medium working time, reaching the peak at 13 s (i.e., the ending time when the propellant grain was burned out). The second-order natural frequency of the multi-layer shell grew from about 145 Hz to 282 Hz or so, reaching the peak at 13 s (i.e., the ending time when the propellant grain was burned out). The third-order natural frequency of the multi-layer shell grew from about 188 Hz to 530 Hz or so. Within the initial working time, the third-order natural frequency rose slowly, but it increased rapidly after the medium working time, reaching the maximum value at 13 s (i.e., the ending time when the propellant grain was burned out).

3.4.3. Acoustic Mode of Internal Acoustic Cavity of the Solid Rocket Engine

After the rocket engine worked from 0 s until 13 s, the minimum diameter of the internal acoustic cavity rose from 23 mm to 153 mm. The calculation method in Section 3.4.2 was utilized. The acoustic cavity model is shown in Figure 9, with the temperature of 3000 K, the density of 12.35 Kg/m3, and the sound speed of 1098.2 m/s. The acoustic mode of the acoustic cavity at each moment was obtained through finite element calculation. Figure 16 displays the comparison of natural frequencies of the acoustic cavity and the shell structure over combustion time.

4. Discussion

4.1. Natural Frequency of Three-Layer Cylindrical Shell

Under the second boundary condition, the theoretical calculation results were closer to the experimental results, possibly due to the fact that the second boundary condition is closer to the experiment since there will inevitably be errors in practice although the completely free constraint condition is simulated in the experiment as much as possible. Moreover, the simulation calculation results were closer to the theoretical calculation results under the first boundary condition. It is due to the fact that the completely free constraints in the simulation calculation are more in line with the constraint condition of the theoretical calculation under the first boundary condition.
Based on comparison of theoretical calculation results with experimental results, the correctness of theoretical algorithm was proved. The theoretical algorithm can also be adopted to solve for the natural frequency of other three-layer cylindrical shells with a viscoelastic core. Additionally, the correctness of the simulation method was also confirmed. Hence, it offers a method for calculating the natural frequency of three-layer cylindrical shells with a viscoelastic core of a complex structure.

4.2. Experimental Validation of Acoustic Mode of the Cylindrical Cavity

It could be figured out that the cylindrical-like acoustic cavity used in the experiment showed four obvious peaks lower than 500 Hz. The peak frequencies measured at two measuring points presented good consistency but different values, and the rule of acoustic pressure measured at the other two measuring points also kept consistent with the abovementioned. The acoustic pressure in the acoustic cavity was not only a function of time but also a function of spatial position, which might be the reason for the same acoustic pressure peak frequency and different peak values at different measuring points. It was also found in the experiment that the change of shell constraint form exerted few effects on the acoustic mode of the internal acoustic cavity.
Table 6 exhibits the comparison between the simulated value and experimental value of the first four order modes of the acoustic cavity and it could be found that the two values were close. The minimum error value was 1.7% and the maximum error value was 4.34%, both of which were less than 5%. The possible reasons for the errors are as follows:
  • The acoustic waves produced from the loudspeakers were not directly connected to the entrance of the acoustic cavity, but transmitted through the pipelines, so long pipelines would have influences on the acoustic vibration.
  • The models for modal calculation were relatively ideal, but the acoustic cavity in the pipelines of the experiment was linked to a part of rectifying devices. Therefore, the measured acoustic mode might be that of the whole system.
Despite slight errors, the experimental and theoretical values of acoustic frequency in acoustic cavity showed good consistency, so it can be believed that the simulation methods are credible in the acoustic mode calculation of complex cavity.

4.3. Experimental Validation of Cylindrical Shell Structure Mode

It could be discovered from Figure 13 that four peak accelerations appeared mainly within 600 Hz, the frequencies measured by the two sensors were fairly consistent, and the maximum peak frequency error was 0.75%, which was also ascribed to the spatial position difference between the measuring points.
The simulated values and experimental values of the first four order inherent frequencies of this engine shell were compared (Table 7). It appeared that the two were relatively approximate, with the minimum error of −0.053% and the maximum error of 5%, both of which were not greater than 5%. The possible reasons for such errors were analyzed as follows: The free boundary was simulated using soft spring suspension in the experiment instead of a real free boundary. The experimented structure could not be completely separated from the experimental bench, and the acceleration sensors were arranged on the pipeline, which might bring about additional concentrated mass.
Despite slight differences, the experimental value and theoretical value of the natural frequency of this engine shell were fairly consistent. Therefore, the simulation method can be considered reliable and applicable to the modal calculation of complex shells.

4.4. Inherent Characteristic of Solid Rocket Engine Shells

According to the comparison between theoretical and simulation calculation results for the natural frequency of the rocket engine (Figure 14), the first-order natural frequency had the smallest error (1.96%), whereas the third-order natural frequency had the largest error (5.98%). The trend of the two calculation results was consistent, so simulation calculation can be adopted to calculate natural frequency of the rocket engine, a multilayer shell.
It could be observed from Figure 16 that the simulation calculation results of the working time-varying first three order inherent frequencies of the rocket engine shell accorded with the theoretical calculation results from the angle of variation trend. With the increase in the working time, the propellant grain was gradually combusted, indicating the gradual reduction of grain thickness, and the natural frequency of this engine shell showed a gradual increasing trend, with a more rapid increase in high-order frequency.
According to Figure 16, the first-order acoustic frequency was far away from the first-order natural frequency of the structure, but the difference was decreased as the grain combusted. In the middle and late combustion phases, the first-order acoustic frequency intersected with the curves of the second- and third-order natural frequencies, implying that when the gas in the internal acoustic cavity oscillates at the first-order acoustic frequency, there may be a resonance between the shell structure and the internal acoustic cavity. It will be quite dangerous in the case of such a resonance.

5. Conclusions

The shell structure of the solid rocket engine is similar to a multi-layer thin-walled cylindrical cavity with a large aspect ratio. In this study, the simulation calculation mode accuracy for the shell structure and acoustic cavity were verified on the cylindrical cavity fluid-solid coupling experimental platform established. Furthermore, the simulation and theoretical calculations were performed on the finite element model of the solid rocket engine constructed, and the results were compared and analyzed. It was discovered that as the propellant grain of the solid rocket engine was gradually combusted, the grain thickness gradual declined, while the natural frequency of the engine shell was gradually elevated. Moreover, finite element calculation of the acoustic mode of the internal acoustic cavity was carried out, and the results revealed that there might be a resonance between the acoustic cavity and the shell structure, which should be avoided as much as possible in engineering.
Since the acoustic field and combustion coupling as well as the shell vibration may both lead to unstable combustion, the unstable combustion can be even intense due to the resonance of acoustic field and shell structure. This circumstance can be avoided as far as possible by structural checking means such as simulation and experiment in the future R & D design.
The abovementioned studies manifest that in the final working stage of a solid rocket engine, the shell structure may resonate with the internal acoustic cavity, thus leading to fierce pressure oscillation-induced unstable combustion and further trigger the damage and even disintegration of this rocket engine. This renders a new idea for designing and checking solid rocket engine structures in the future.
Due to the increasingly stringent requirements for weight reduction, the current solid rocket motor casings are mostly made of carbon fiber composite materials. In the follow-up research, the shell material can be replaced with carbon fiber composite material to study the influence trend of the material change on the coupled vibration.

Author Contributions

Conceptualization, F.X.; methodology, F.X.; software, F.X.; validation, F.X. and D.Z.; formal analysis, F.X.; investigation, F.X.; resources, F.X.; data curation, F.X.; writing—original draft preparation, F.X.; writing—review and editing, F.X.; visualization, F.X.; supervision, F.X.; project administration, F.X. This paper presents the results of a recent research, conducted by F.X. under the supervision of H.L. All authors have read and agreed to the published version of the manuscript.

Funding

This research received no external funding.

Institutional Review Board Statement

Not applicable.

Informed Consent Statement

Not applicable.

Data Availability Statement

All data generated or analyzed during this study are included within the article.

Acknowledgments

Supports provided by College of Aerospace and Civil Engineering of Harbin Engineering University are acknowledged.

Conflicts of Interest

The authors declare no conflict of interest.

References

  1. Culick, F.E.C. Research on combustion instability and application to solid propellant rocket motors. In Proceedings of the AIAA/SAE 7th Propulsion Joint Specialist Conference, Salt Lake City, UT, USA, 14–18 June 1971; p. 753. [Google Scholar]
  2. Oyediran, A.; Darling, D.; Radhakrishnan, K. Review of combustion-acoustic instabilities. In Proceedings of the 31st Joint Propulsion Conference and Exhibit, San Diego, CA, USA, 10–12 July 1995; p. 2469. [Google Scholar]
  3. Langhorne, P.J. Reheat buzz: An acoustically coupled combustion instability. Part 1. Experiment. J. Fluid Mech. 1988, 193, 417–443. [Google Scholar] [CrossRef]
  4. Bloxsidge, G.J.; Dowling, A.P.; Langhorne, P.J. Reheat buzz: An acoustically coupled combustion instability. Part 2. Theory. J. Fluid Mech. 1988, 193, 445–473. [Google Scholar] [CrossRef]
  5. Blomshield, F.S. Lessons learned in solid rocket combustion instability. In Proceedings of the 43rd AIAA/ASME/SAE/ASEE Joint Propulsion Conference and Exhibit, Cincinnati, OH, USA, 8–11 July 2007; p. 5803. [Google Scholar]
  6. Li, S.; Zhao, D. Heat flux and acoustic power in a convection-driven t-shaped thermoacoustic system. Energy Convers. Manag. 2013, 75, 336–347. [Google Scholar] [CrossRef]
  7. Culick, F.E.C.; Magiawala, K. Excitation of acoustic modes in a chamber by vortex shedding. J. Sound Vib. 1979, 64, 455–457. [Google Scholar] [CrossRef]
  8. Dunlap, R.; Brown, R.S. Exploratory experiments on acoustic oscillations driven by periodic vortex shedding. AIAA J. 1981, 19, 408. [Google Scholar] [CrossRef]
  9. Francois, V. Vortex-shedding phenomena in solid rocket motors. J. Propuls. Power 1995, 11, 626–639. [Google Scholar]
  10. Dotson, K.W.; Koshigoe, S.; Pace, K.K. Vortex shedding in a large solid rocket motor without inhibitors at the segment interfaces. J. Propuls. Power 1997, 13, 197–206. [Google Scholar] [CrossRef]
  11. Greatrix, D.R. Scale effects on solid rocket combustion instability behaviour. Energies 2011, 4, 90–107. [Google Scholar] [CrossRef] [Green Version]
  12. Flandro, G.A.; Fischbach, S.R.; Majdalani, J. Nonlinear rocket motor stability prediction: Limit amplitude, triggering, and mean pressure shift. In Proceedings of the 40th AIAA/ASME/SAE/ASEE Joint Propulsion Conference and Exhibit, Fort Lauderdale, FL, USA, 11–14 July 2004; p. 4054. [Google Scholar]
  13. Fabignon, Y.; Dupays, J.; Avalon, G.; Vuillot, F.; Lupoglazoff, N.; Casalis, G.; Prevost, M. Instabilities and pressure oscillations in solid rocket motors. Aerosp. Sci. Technol. 2003, 7, 191–200. [Google Scholar] [CrossRef]
  14. Blomshield, F.S. Historical perspective of combustion instability in motors: Case studies. In Proceedings of the 37th AIAA/ASME/SAE/ASEE Joint Propulsion Conference and Exhibit, Salt Lake City, UT, USA, 8–11 July 2001; p. 3875. [Google Scholar]
  15. Lei, Y.; Shen, C. Computational investigation on combustion instabilities in a rocket combustor. Acta Astronaut. 2016, 127, 634–643. [Google Scholar]
  16. Orlandi, O.; Plaud, M.; Godfroy, F.; Larrieu, S.; Cesco, N. Aluminium droplets combustion and SRM instabilities. Acta Astronaut. 2019, 158, 470–479. [Google Scholar] [CrossRef]
  17. Wang, D.; Yang, Y.; Fan, W.; Li, X.; Gao, Y. Simulation of pressure oscillations in a combustion chamber under periodic inlet disturbances. Acta Astronaut. 2018, 152, 859–871. [Google Scholar] [CrossRef]
  18. Greatrix, D.R. Structural vibration and solid rocket combustion instability. Can. Aeronaut. Space J. 1998, 44, 9–24. [Google Scholar]
  19. Greatrix, D.R. Combined structural oscillation effects on solid rocket internal ballistics. In Proceedings of the 35th Joint Propulsion Conference and Exhibit, Los Angeles, CA, USA, 20–24 June 1999; p. 2509. [Google Scholar]
  20. Greatrix, D.R.; Harris, P. Structural vibration considerations for solid rocket internal ballistics modeling. In Proceedings of the 36th AIAA/ASME/SAE/ASEE Joint Propulsion Conference and Exhibit, Las Vegas, NV, USA, 24–28 July 2000; p. 3804. [Google Scholar]
  21. Loncaric, S.; Greatrix, D.R.; Fawaz, Z. Star-grain rocket motor nonsteady internal ballistics. Aerosp. Sci. Technol. 2004, 8, 47–55. [Google Scholar] [CrossRef]
  22. Dotson, K.W.; Sako, B.H. Interaction between solid rocket motor internal flow and structure during flight. J. Propuls. Power 2007, 23, 140–145. [Google Scholar] [CrossRef]
  23. Montesano, J.; Behdinan, K.; Greatrix, D.R.; Fawaz, Z. Internal chamber modeling of a solid rocket motor: Effects of coupled structural and acoustic oscillations on combustion. J. Sound Vib. 2008, 311, 20–38. [Google Scholar] [CrossRef]
  24. Greatrix, D.R. Use of reactive particles for solid rocket combustion instability suppression. In Proceedings of the 50th AIAA/ASME/SAE/ASEE Joint Propulsion Conference, Cleveland, OH, USA, 28–30 July 2014; p. 3493. [Google Scholar]
  25. Greatrix, D.R. Numerical evaluation of the use of aluminum particles for enhancing solid rocket motor combustion stability. Energies 2015, 8, 1195–1215. [Google Scholar] [CrossRef] [Green Version]
  26. Zhao, L.; Liu, Y.; Zhang, C.; Zhang, X. Automatic optimal block decomposition for structured mesh generation using genetic algorithm. J. Braz. Soc. Mech. Sci. Eng. 2019, 41, 10. [Google Scholar] [CrossRef]
  27. Rezaiee-Pajand, M.; Masoodi, A.R. Analyzing FG shells with large deformations and finite rotations. World J. Eng. 2019, 16, 636–647. [Google Scholar] [CrossRef]
  28. Rezaiee-Pajand, M.; Masoodi, A.R. Shell instability analysis by using mixed interpolation. J. Braz. Soc. Mech. Sci. Eng. 2019, 41, 419. [Google Scholar] [CrossRef]
  29. Sobhani, E.; Masoodi, A.R.; Ahmadi-Pari, A. Vibration of FG-CNT and FG-GNP Sandwich Composite Coupled Conical-Cylindrical-Conical Shell. Compos. Struct. 2021, 273, 114281. [Google Scholar] [CrossRef]
  30. Soedel, W. Vibrations of Shells and Plates, 3rd ed.; Marcel Dekker Inc.: New York, NY, USA, 2004. [Google Scholar]
  31. Cao, Y.; Huang, W.; Li, J. Effect of ambient vibration on solid rocket motor grain and propellant/liner bonding interface. In American Institute of Physics Conference Series; AIP Publishing LLC: Melville, NY, USA, 2017; p. 020078. [Google Scholar]
Figure 1. Three-layer cylindrical shell specimen.
Aerospace 09 00174 g001
Figure 2. Cylindrical cavity fluid-solid coupling experimental platform.
Aerospace 09 00174 g002
Figure 3. Experimental constraint spring.
Aerospace 09 00174 g003
Figure 4. Signal enhancement device.
Aerospace 09 00174 g004
Figure 5. Data acquisition device.
Aerospace 09 00174 g005
Figure 6. Cylindrical cavity fluid-solid coupling experimental model and schematic diagram of dimension measuring points.
Aerospace 09 00174 g006
Figure 7. Structure of the solid rocket engine model.
Aerospace 09 00174 g007
Figure 8. Changes of engine internal structure during grain combustion, (a) 2 s, (b) 6 s, (c) 10 s and (d) 13 s.
Aerospace 09 00174 g008
Figure 9. Comparison of theoretical calculation and simulation calculation results with experimental results of natural frequency of three-layer cylindrical shell.
Aerospace 09 00174 g009
Figure 10. Amplitude-frequency characteristic curves at different positions of the cylindrical acoustic cavity.
Aerospace 09 00174 g010
Figure 11. The first four-order vibration modes of the acoustic cavity models, (a) 1st Order vibration modes, (b) 2nd Order vibration modes, (c) 3rd Order vibration modes and (d) 4th Order vibration modes.
Aerospace 09 00174 g011
Figure 12. Acceleration amplitude-frequency characteristic curves at different positions of cylindrical shell structure.
Aerospace 09 00174 g012
Figure 13. The first four-order vibration modes of the shell model, (a) 1st Order vibration modes, (b) 2nd Order vibration modes, (c) 3rd Order vibration modes and (d) 4th Order vibration modes.
Aerospace 09 00174 g013
Figure 14. Comparison between theoretical and simulation calculation results.
Aerospace 09 00174 g014
Figure 15. Working time-varying first-order natural frequency of the rocket engine shell, (a) 1st Order natural frequency, (b) 2nd Order natural frequency (c) 3rd Order natural frequency.
Aerospace 09 00174 g015
Figure 16. Natural frequencies of the acoustic cavity and the shell structure over working time.
Aerospace 09 00174 g016
Table 1. Material parameters of rocket engine shell.
Density (Kg/m3)Elastic Modulus (MPa)
shell78002.06 × 104
heat insulating layer130030
propellant grain14506.7
Table 2. The first three-order natural frequencies of the model obtained through theoretical calculation.
Order1st Order2nd Order
natural frequencies of the first boundary condition (Hz)74.72194.16
natural frequencies of the second boundary condition (Hz)71.81193.92
Table 3. The first three-order natural frequencies of the model obtained via simulation calculation.
Order1st Order2nd Order3rd Order
natural frequencies (Hz)72.21195.35366.73
Table 4. Comparison of simulated values of the first four acoustic modes with different mesh sizes.
Order/Shell Quantity39900 (20 mm)77550 (15 mm)114400 (10 mm)580880 (5 mm)
1 (Hz)97.53797.53497.53597.533
2 (Hz)195.1195.07195.07195.06
3 (Hz)292.65292.55292.55292.49
4 (Hz)390.14389.9389.9389.78
Table 5. Comparison of simulated values for the first four order shell modes with different mesh sizes.
Order/Shell Quantity10880 (15 mm)48240 (10 mm)86720 (7 mm)158400 (5 mm)
1 (Hz)133.2132.83132.71132.61
2 (Hz)311.13310.67310.68310.68
3 (Hz)446.11442.68441.71441.25
4 (Hz)603.4597.04595.15594.29
Table 6. Comparison between the simulated value and experimental value of the first four order modes.
Order/Gird NumberExperiment (Hz)Simulation (Hz)Error Value
1 (Hz)100.997.535−3.34%
2 (Hz)191.8195.071.7%
3 (Hz)283.7292.553.23%
4 (Hz)407.6389.9−4.34%
Table 7. Comparison of the first four order inherent frequencies obtained through shell simulation and experiment.
Order/Gird NumberExperiment (Hz)Simulation (Hz)Error Value
1 (Hz)132.9132.83−0.053%
2 (Hz)318.7310.67−0.25%
3 (Hz)421.6442.685%
4 (Hz)591.1597.041%
Publisher’s Note: MDPI stays neutral with regard to jurisdictional claims in published maps and institutional affiliations.

