Article

Design Evolution and Wind Tunnel Tests of a Three-Lifting Surface Regional Transport Aircraft

Department of Industrial Engineering, University of Naples “Federico II”, Via Claudio 21, 80125 Naples, Italy
*
Author to whom correspondence should be addressed.
Aerospace 2022, 9(3), 133; https://doi.org/10.3390/aerospace9030133
Submission received: 28 January 2022 / Revised: 22 February 2022 / Accepted: 26 February 2022 / Published: 3 March 2022
(This article belongs to the Section Aeronautics)

Abstract

:
This paper deals with the experimental assessment of the aerodynamic characteristics of an innovative large turboprop aircraft. The configuration is a three-lifting surfaces airplane with rear engine installation at tail tips, conceived to carry up to 130 passengers and targeting a minimum economic and environmental impact, which is competitive with regional jets on short and medium hauls. The three-lifting surfaces layout is the output of previous research made by the authors, and it has been selected to fully comply with the market and design constraints. An experimental test campaign was required to validate the aerodynamics, stability, and control of this innovative configuration. From the results of the first campaign, it appeared that the aircraft had insufficient longitudinal and directional stability. Thus, the authors worked to improve these characteristics, updating the design and executing a second wind tunnel test campaign. The evolution of the design is described in the first part of the paper. In the second part, the authors discuss the aerodynamic interference effects among aircraft components, detailing how the combined downwash coming from both the canard and wing, as well as their wakes, affects the empennage aerodynamics. Experimental tests have revealed a significant reduction of the longitudinal stability due to canard additional downwash, especially at low attitudes. Furthermore, it was found that the canard generates a non-linearity on the aircraft directional stability derivative at moderate sideslip angles because of its tip vortex impinging on the vertical tail. Despite the detrimental interference due to the canard, the updated aircraft proved to be statically stable with sufficient margin at the most rearward center of gravity. Lessons learned in this research may be useful to aerodynamicists and aircraft designers facing similar issues.

1. Introduction

This research work is framed within the European research project named IRON. The research program is addressed to the performance improvement of regional aircraft within the 90–150 passenger segment. Even if the market forecasts made by the most important manufactures at the beginning of 2020 have been completely changed by the unexpected COVID-19 outbreak [1], when a full recovery from this pandemic disease will be reached most of the major airlines will still have to face a key factor influencing the regional market scenario, which is represented by the need to replace several hundred heritage aircrafts and the world demand for new aircrafts in the segment of 20–150 seats [2,3,4,5,6]. This segment is characterized by the predominance of regional jets. Despite their success, turboprop engines are 10–30% more efficient in terms of fuel consumption [7]. Thus, the introduction of a large turboprop should help in reducing the aviation environmental impact.
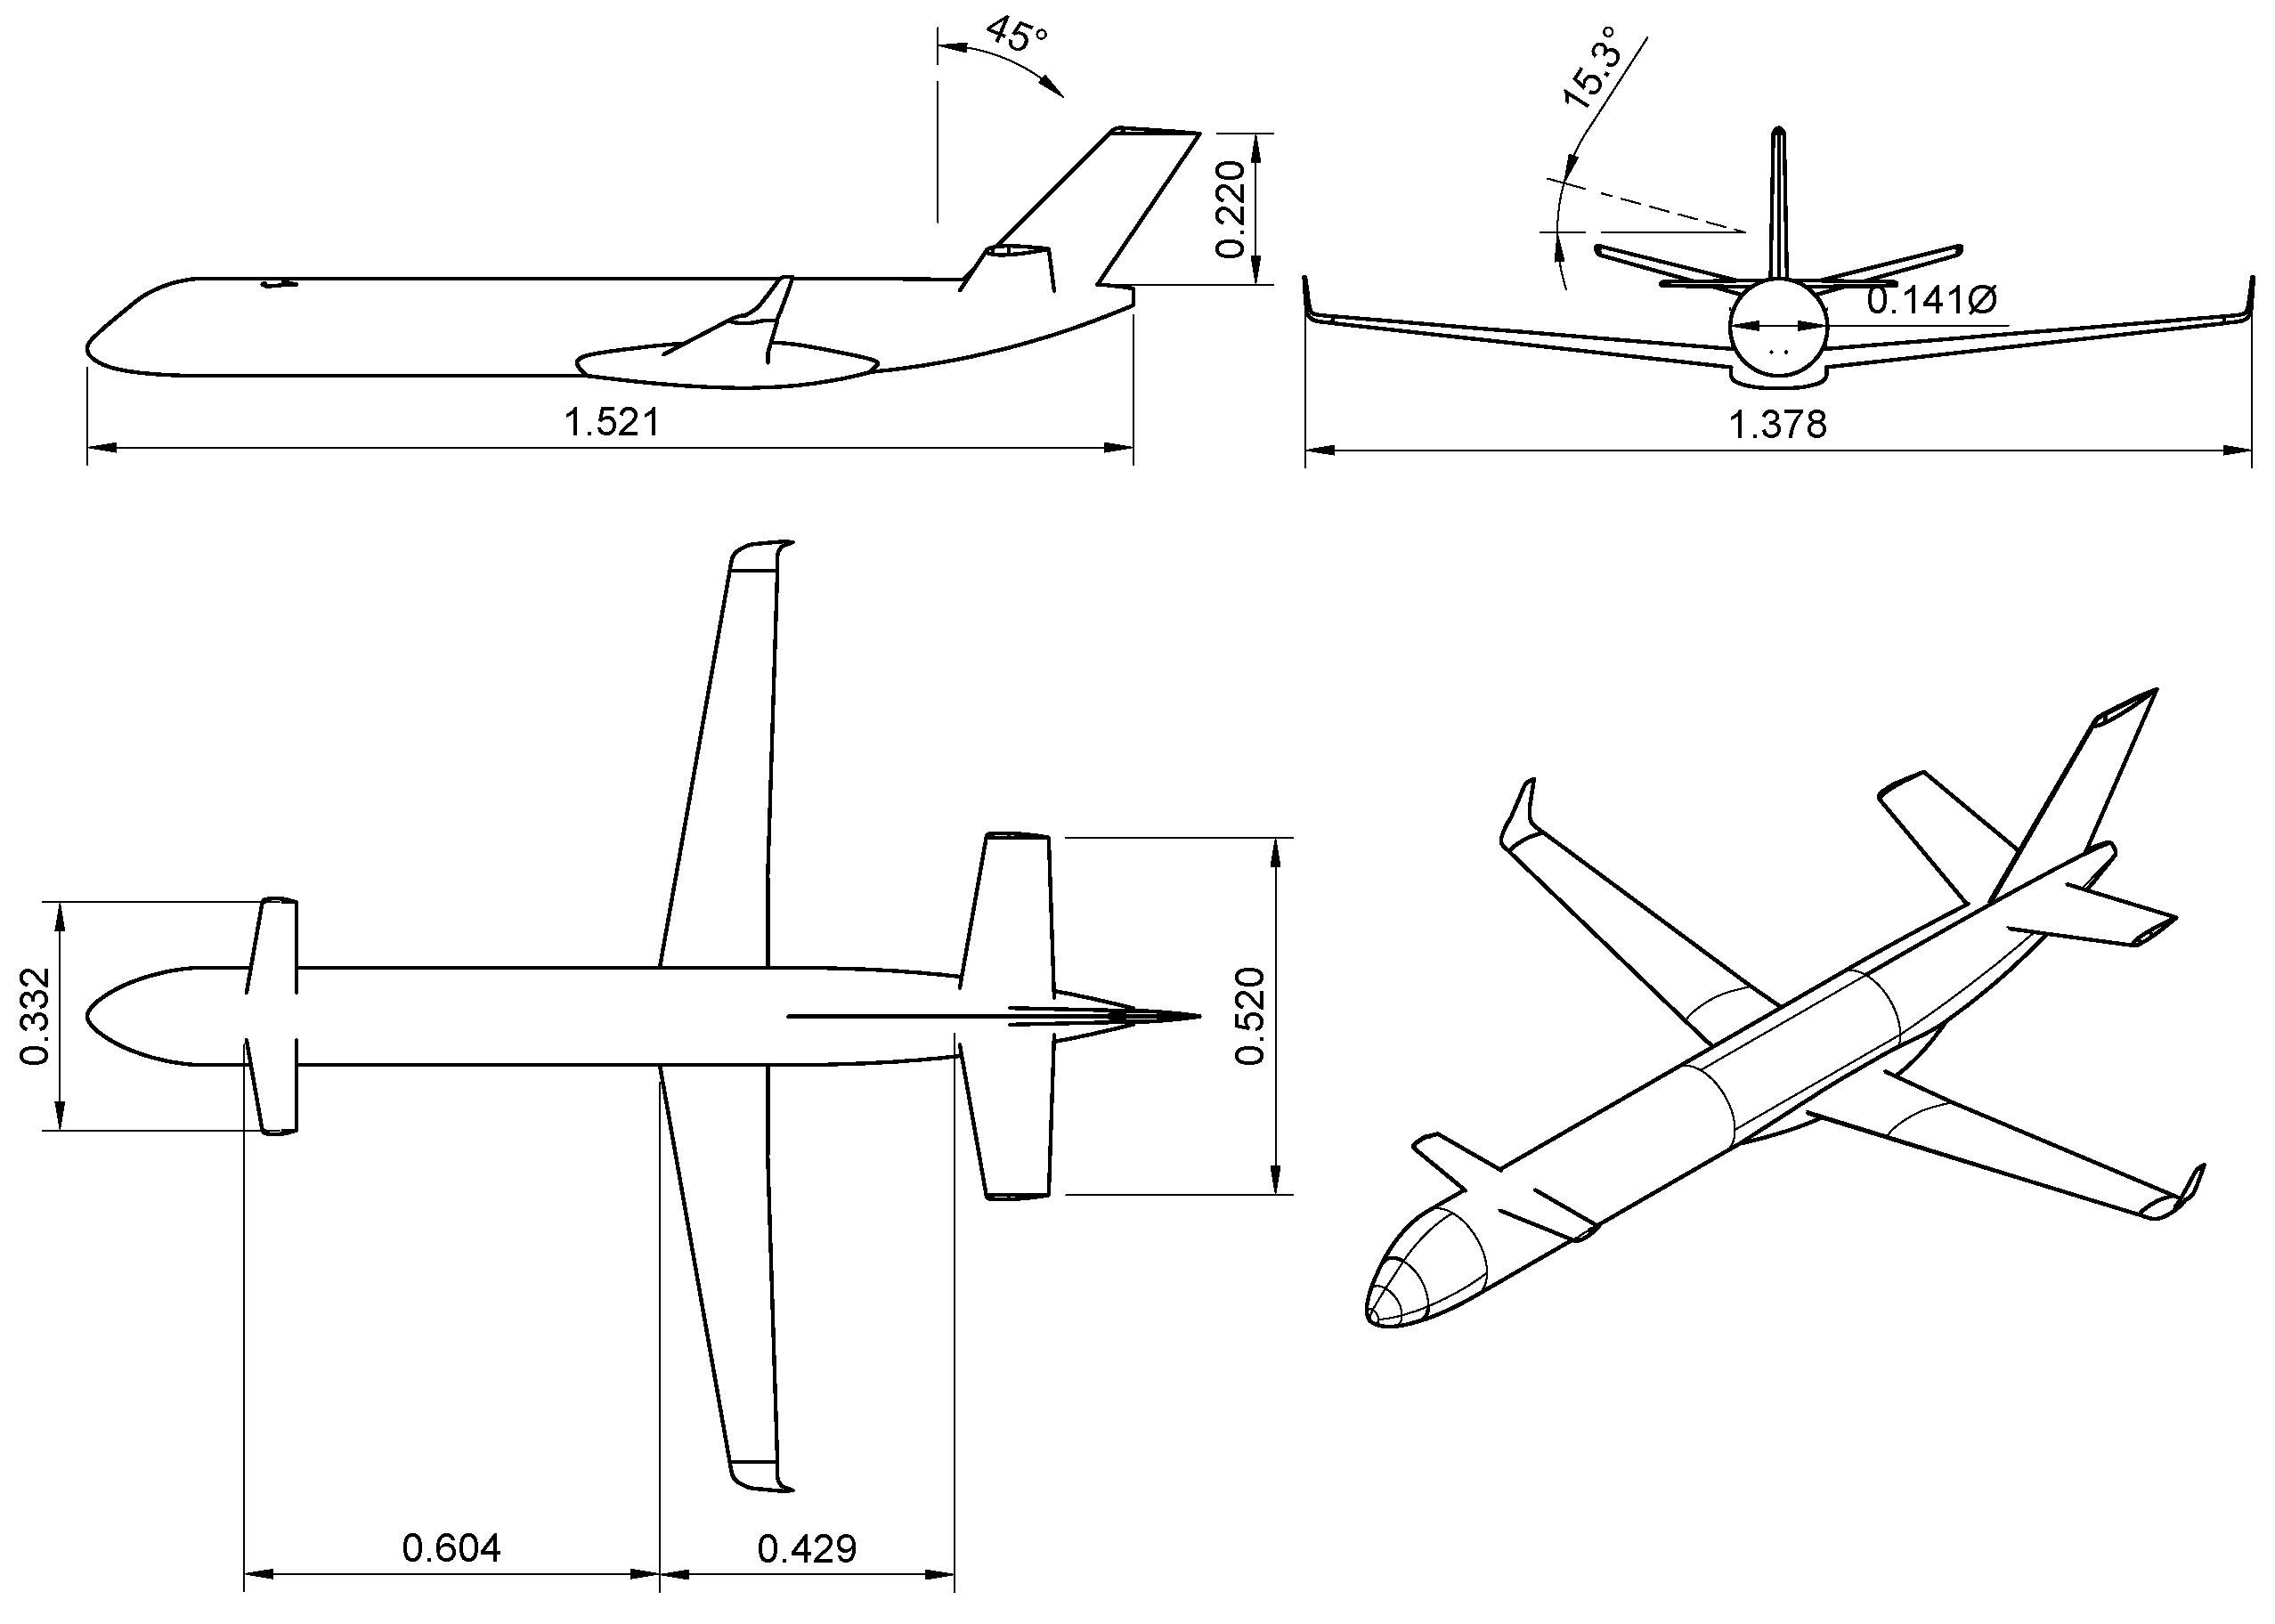
The aircraft configuration object of this work has been designed and optimized through two different design loops with increasingly level of fidelity. Starting from a baseline with the classic wing-tailplane configuration but with rear-mounted turboprop engines, a Multi-Disciplinary Analysis and Optimization (MDAO) has identified in the three-lifting surfaces layout the most promising configuration, being compliant at the same time with the aerodynamic targets to be competitive with regional jets and the aircraft weight-and-balance issues due to the rear engines installation. Details about the design considerations and optimization process of such an innovative aircraft have been provided by the authors in Refs. [8,9,10]. At the end of the first design loop, a scaled model has been manufactured to evaluate the aircraft static stability with wind tunnel tests and to assess the quality of preliminary design. The three-view of the wind tunnel model is illustrated in Figure 1.
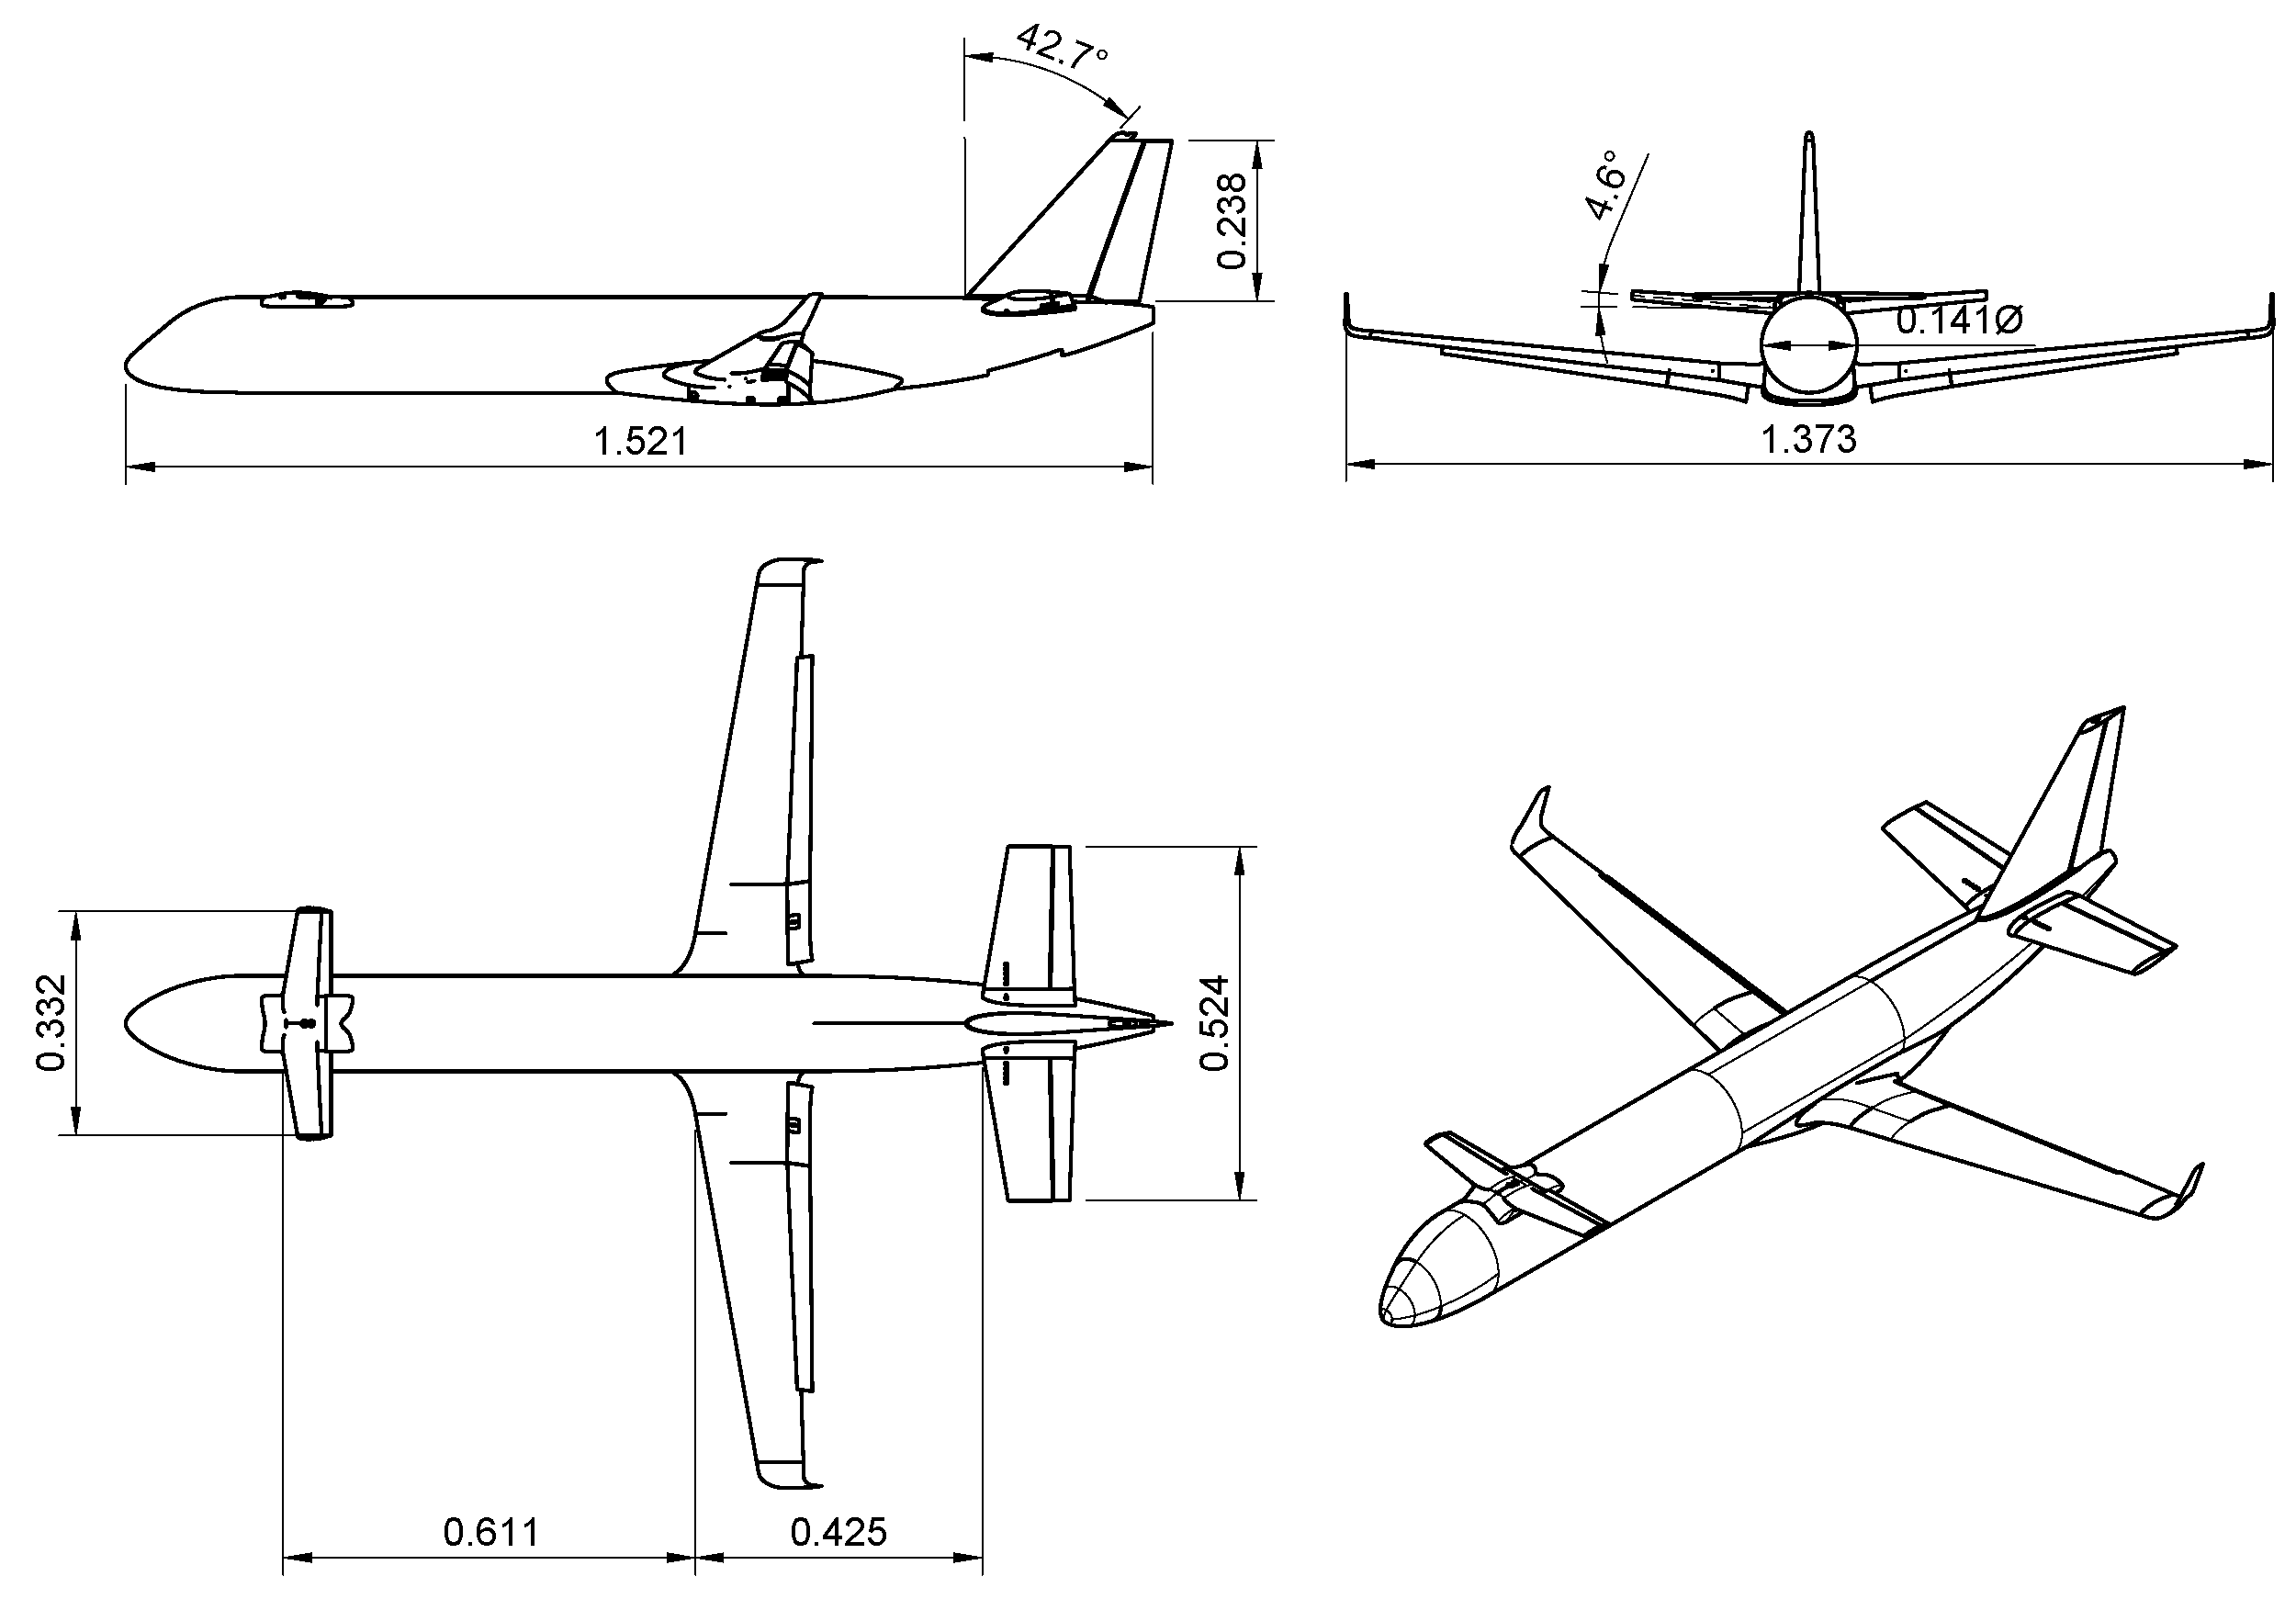
The first experimental test campaign ended with some concerns about aircraft stability. In fact, the design of a three-lifting surfaces airplane with a reduced vertical stagger between wings involves several aerodynamic issues coming from the combined downwash of both canard and wing, as well as the canard wake interference on the lifting capabilities of the horizontal tailplane and consequently on the aircraft longitudinal stability. Apparently, the complicated interactions among the wakes of the lifting surfaces was not well predicted by the MDAO process of Refs. [8,11]. Thus, from the results of the first test campaign, the canard and the tailplane group were re-designed and a second test campaign on the updated scaled model, shown in Figure 2, was performed. This constitutes the output of the design loop 2.
This paper discusses the aircraft evolution from the first to the second design loop and describes, in detail, the complex aerodynamic interference and wake phenomena among the lifting surfaces on the last configuration. A literary review of the three-lifting surfaces aircraft configuration follows this first part of the introduction.
A crucial issue for the aerodynamic assessment of this innovative configuration is an accurate estimation of the canard downwash. In literature, various references present the downwash phenomenon and methods to estimate its effects on an aft lifting surface. These methods include linear approaches as proposed by Roskam [12], Silverstein [13,14], and DATCOM [15], and the non-linear approach presented by Slingerland [16]. However, these works emphasize the case where an aft tail has a much smaller span than the main wing. The influence of the wing on the tail is calculated by first estimating the downwash gradient in the plane of symmetry at the longitudinal and vertical location of the tail and then correcting for the spanwise variation across the tail. However, the data in Roskam [12] and Silverstein [13,14] are limited to a span ratio equal to 0.4 and to a relatively small change of downwash gradient with tail span, leading to a single value for the downwash derivative for a conventional tailplane.
In case of a canard configuration, where the forward wing has a smaller span than the main wing, the above-cited methods do not work properly since the spanwise variation of the downwash gradient becomes quite significant. A first attempt to provide a method to evaluate the downwash for a canard configuration is proposed by Philips. He evaluated the downwash in the plane of symmetry for an elliptically loaded wing [17] and then calculated the integral downwash gradient effect [18]. This method approximated a generic wing as an elliptical one, not accounting for the actual planform parameters. Moreover, Philips’ method did not account for wing span loading distribution, avoiding any design indication for the twist angle distribution.
A method was subsequently proposed by Levy [19] where a vortex lattice approach was used to build up a simplified methodology to account for both downwash in the symmetry plane and spanwise attenuation factor. However, it only investigated the case with wing and canard having the same aspect ratio.
An optimization study about the longitudinal aerodynamic load distribution resulting in the minimum trim drag in level, steady state flight for airplanes with three or more lifting surfaces and propulsive control effects was performed by Goodrich et al. by means of classical linearised flight mechanics equations [20]. They were able to identify the best solution in terms of trim drag, but nothing is stated about the interference phenomena among lifting surfaces or downwash effects. The third lifting surface could be also adopted to improve the flying qualities of an aircraft by including an additional elevator on the canard surface as shown in [21]. The evaluation of flying qualities of a three-lifting surface aircraft has been also evaluated through experimental flight tests of a scaled model [22]. However, they took into account a configuration similar to the Piaggio P-180, where the canard, wing, and tailplane are conveniently staggered, contrary to the IRON configuration where the tail and wing positions are imposed by design constraints such as number of passengers, propeller clearance, and landing gear height.
So far as it concerns this research, a fundamental role concerns the feasibility study conducted by the authors in [11]. In this work, the authors investigated three possible high-capacity turboprop configurations conceived to be competitive with regional jets on short/medium haul and providing, at the same time, a lower environmental impact. The three possible layouts are: a high-wing arrangement with under-wing engine installation; and two- and three-lifting surfaces designs, both with low wing and rear engines installed at the tail tips. All of the proposed concepts went through an MDAO process to achieve the minimum block fuel on a design range of 1600 NM. By comparing the proposed concepts with both an existing regional jet as the Airbus A220-300 operating on such a range and with a jet platform specifically designed for the same range, the three-lifting surfaces aircraft has been identified as the solutions having the maximum potential fuel saving, about 17% with respect to the reference regional jet [11]. This work also highlights that a reliable prediction of the downwash gradient at the horizontal tail is of a primary importance to perform a correct sizing of the horizontal tailplane in order to provide sufficient longitudinal static stability. The downwash gradient at the tailplane in a three-lifting surfaces aircraft is a result of mutual, non-linear aerodynamic interference between the canard and the wing wakes.
The design and optimization of a canard for a three-surface aircraft (TSA) was the objective of Strohomeyer’s research with a higher-order panel method [23]. Primary aim of the canard study was the preliminary design of an optimum canard geometry for the DLR-F11 TSA wind-tunnel model under the design constraints of a realistic aircraft. Based on the conventional design for the wind tunnel model, the retrofit of the geometrically fixed aircraft with a canard was simulated. The analyses show that a sweptback canard in low position, located downstream to the divergent nose part of the body, with a high aspect ratio, low taper ratio, and moderate span, promises optimum performance. In addition, the canard lift of the TSA configuration allows one to achieve higher cruise lift coefficients for an improved induced drag at transonic speeds, without the risk of additional wave drag. However, the static margin decreases significantly with the integration of the canard. Actually, this was expected to occur also in IRON case, despite the fact low-fidelity studies did not reveal any problems in this respect.
The canard effect on longitudinal stability and trim requirements was also examined by McGeer and Kroo [24] using methods based on the lifting line theory for the aerodynamic calculations. In particular, they compared the relative efficiency of canard and conventional aft-tailed aircraft configurations in terms of trimmed maximum lift coefficient, drag, and structural weight. They conclude the paper by stating that:
The clear inferiority of the two-surface systems is just the price that one pays for a moderate amount of stability and control.
This sentence invokes two valuable concepts for this paper: (i) the possible aerodynamic and performance advantages of a three-lifting surface configuration; and (ii) the arising of stability issues related to distribution of the lift among the surfaces to balance the system.
Most of the references described so far dealt with low-fidelity analyses. As concerns experimental investigations, wind-tunnel tests of a model of an advanced general aviation aircraft with canard were conducted in the Langley 30- by 60-Foot Tunnel [25]. The objective of the tests was to determine the aerodynamic stability and control characteristics of the test article for a large range of angles of attack and sideslip for several power conditions. For forward center-of-gravity locations, the model did not exhibit any stability and control characteristics that would be viewed as unsafe. The results also indicate that the configuration would be extremely stall-resistant. This highly desirable stall-resistance characteristic resulted from the fact that the canard was designed to stall prior to the wing. Stalling of the canard resulted in increased longitudinal stability and decreased elevator effectiveness. Both effects limited the maximum achievable trim angle of attack to values below those required for wing stall for all power conditions tested. For aft center-of-gravity locations and high-power, low-speed conditions, the combined effects of nose-up trim changes due to power and reduced longitudinal stability overpowered the stall resistance provided by the canard. Large nose-up elevator control inputs in this condition could result in stalling of the wing, which in turn yield to longitudinal instability and large nose-up moments, which would tend to further increase angle of attack to a deep-stall condition. The findings of this work were held in high regard because similar results on longitudinal stability were expected on the IRON wind tunnel model for aft center-of-gravity locations, despite the difference between the two models.
An aircraft configuration similar to IRON was tested by Ostowari and Naik [26]. Their paper presents measurements of aerodynamic forces and moments from a series of wind tunnel experiments using a modular airplane configuration to ascertain how non-elliptical lift distributions affect the lift, drag, and static longitudinal stability for a three-surfaces configuration. Among the several outcomes of the work, the change of neutral point position for configuration with low tailplane position—more or less in line with wing and canard—is particularly of interest because it is a sign of stability reduction.
As concerns the evaluation of lateral-directional characteristics of three-lifting surfaces configuration, some experimental data are available for a fighter aircraft. Grafton and Croom in [25] have studied the low-speed, high-angle-of-attack stability characteristics of a three-surfaces fighter concept based on the F-15 configuration. They have measured static force data over the angle of attack and sideslip range of 0° to 85° and −10° to 10°, respectively. Their results have highlighted that the canard adversely affects both static directional and lateral stability at high angles of attack. According to the authors, this loss is due to the canard causing a large flow separation on the windward fuselage region in sideslip.
Similar results have been also highlighted by Agnew et al. in [27]. In this work, they have provided detailed understanding of the aerodynamics of a close-coupled horizontal canard in a three-lifting configuration (canard-wing-tail) for a fighter aircraft. This study has highlighted that the vortex interaction phenomenon has a beneficial effect in terms of extending the angle of attack range for the aerodynamic linearity since the vortex interaction maintains the flow attached over large areas that would be normally separated. The abrupt nature of the breakdown of this vortex system causes an adverse effect in terms of lateral-directional characteristics.
However, it is worth to underline that the last two works considering military applications are very far from the passenger aircraft herein considered. It is also true that very poor data are available concerning a three-lifting surfaces configuration for a high-capacity passenger aircraft. The innovation of this work is properly intended in this direction. The aerodynamics of this kind of a three-lifting surfaces aircraft are such that only high-fidelity investigations could lead to a deep comprehension of the above-mentioned interactions phenomena, especially when the vertical separation among the lifting surfaces is small. The aerodynamic characteristics relevant to the static stability of a three-lifting surface turboprop aircraft are investigated and discussed. The results of this paper enhance the comprehension of crucial aspects in terms of stability and aerodynamic interference among aircraft components for this kind of innovative turboprop configuration.
The rest of this paper is organized as follows. Section 2 describes the experimental apparatus, the wind tunnel test setup, and the procedures used to derive the key aerodynamic characteristics of interest. Section 3 shows the experimental results of the first wind tunnel test campaign, highlighting all issues introduced by the canard wake interference on the aircraft stability characteristics. A short discussion about the evolution from the first to the second design loop is also made. Section 4 gives details on the aerodynamic interference effects on the last aircraft configuration, with a focus on the evaluation of downwash gradients. Here, it is discussed how the longitudinal and directional stability change with the canard. Conclusions are drawn in Section 5.

2. Experimental Setup and Procedures

2.1. Wind Tunnel Facility

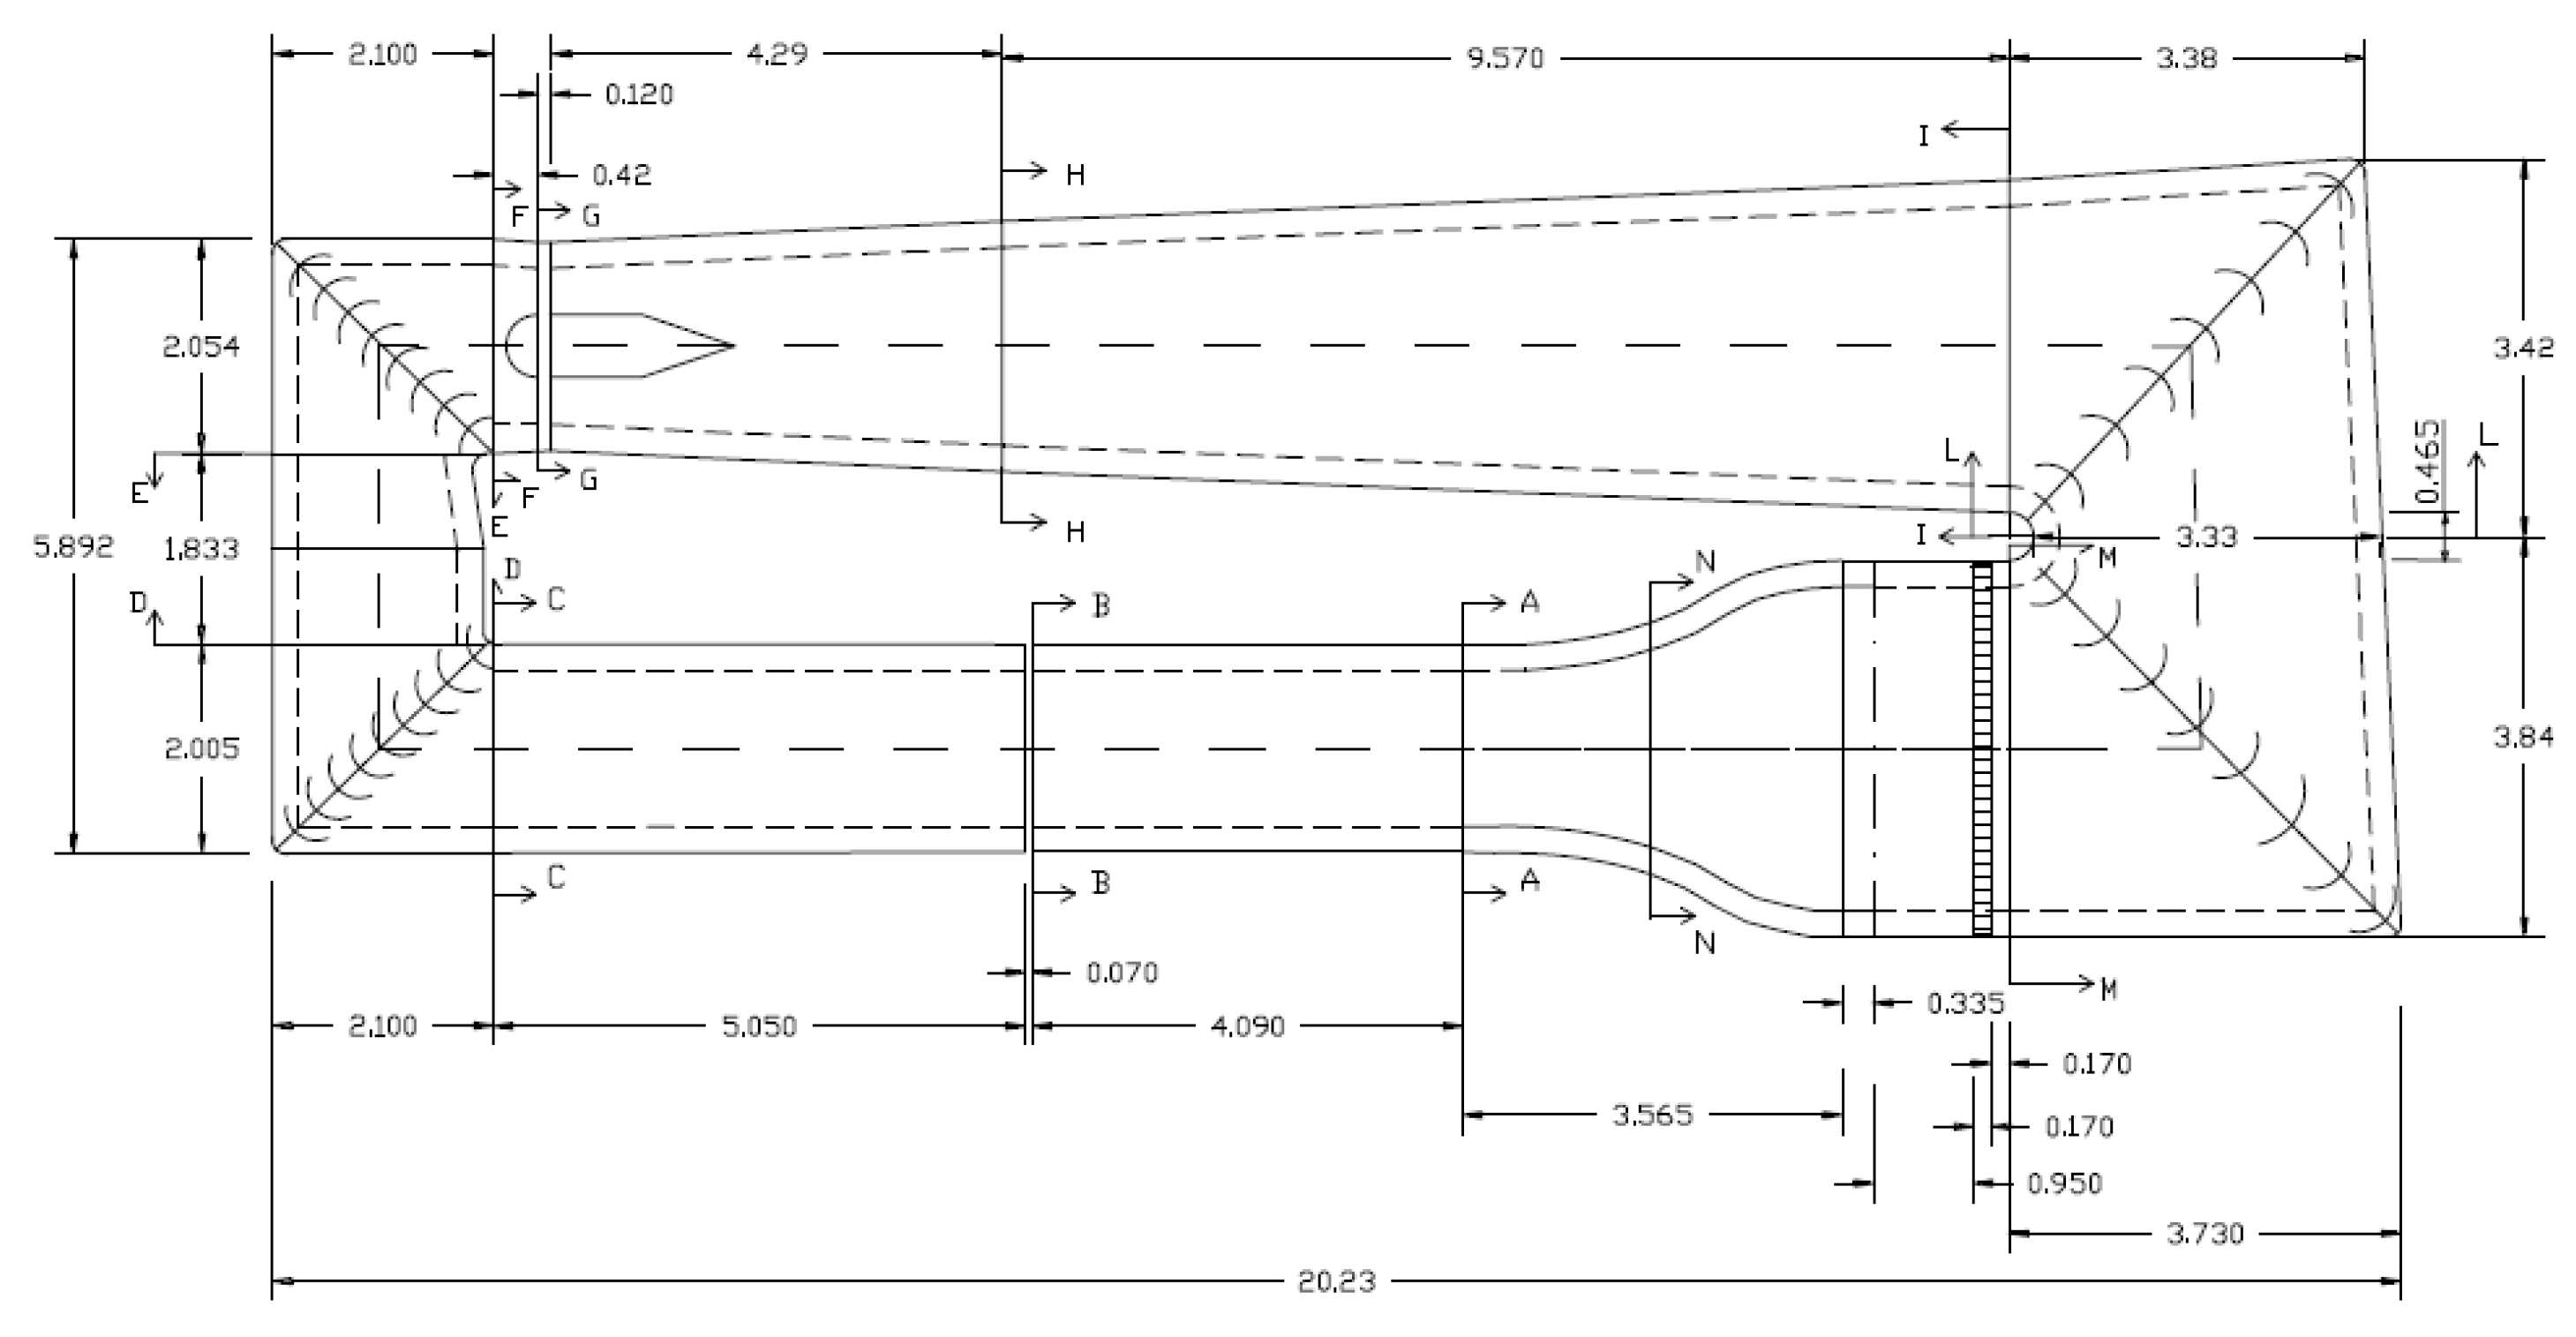
The main objective test campaign is to estimate the aerodynamic effects of the canard on the wing and tailplane. The experimental tests campaign has been performed in the main wind tunnel facility of the Dept. of Industrial Engineering of the University of Naples “Federico II”. It is a subsonic, closed circuit tunnel, with a rectangular cross section with tempered edges, shown in Figure 3. The main wind-tunnel characteristics are summarized in Table 1.
The measurement instrumentation consists of two internal strain gage balances for the measurement of aerodynamic forces and moments, a Venturi system to measure the dynamic pressure, an inclinometer to measure the angle of attack, a potentiometer to measure the sideslip angle, and a temperature probe to measure the static temperature in the test section.
The wind speed in the test section is calculated from the measurement of the dynamic pressure by the Venturi system, which is equipped with 4 static pressure probes placed on the side faces of the initial and final sections of the convergent leg. A pressure transducer with a 2500 Pa full-scale and a 3 Pa accuracy measures the static pressure variation between these sections and—through the continuity equation—provides the dynamic pressure immediately ahead of the test section. From the measurement of the dynamic pressure and the estimation of the air density from a temperature measurement, the flow velocity in the test section is finally calculated.
The strain gage balances—one measuring lift, drag, and pitching moment, the other measuring sideforce, yawing moment, and rolling moment—are made of aluminum alloy 2024-T3. Table 2 summarizes the full-scale readings and the maximum errors per axis. The angle of attack has been measured with the mono-axial tilt sensor CrossBow CXTA01, which has an accuracy of 0.05° and a range from −75° to 75°. The sideslip angle is measured by a linear potentiometer whose installation provides an accuracy of 0.1° and a range from −15° to 25°.
All the aerodynamic forces have been reduced to the usual aerodynamic coefficients, assuming as reference parameters the test section dynamic pressure q , the wing mean aerodynamic chord (MAC), wing span b, and wing area S, except where otherwise stated. The Reynolds number is also based on the MAC, and it has an average value of 315,000. Wind tunnel corrections have been applied by following the procedure described in [28].
The test articles have been machines in aluminium alloy. The three-view of the two versions of the model have been shown in Figure 1 and Figure 2. Aluminum zig-zag tape strips have been positioned to promote flow transition. Specifically, the strips were installed at 5% of the local chord from the leading edge of the lifting surfaces and at 10% of the fuselage nose length.
To evaluate the repeatability of the measurements and to quantify spread in test data, in Table 3 the statistics concerning five tests on the same model configuration—Wing-Body (WB)—have been reported. Standard deviation (SD) values are shown for the lift, drag, and pitching moment coefficients. As concerns uncertainty in yawing moment coefficient, data have been reported in Table 4 for the complete aircraft configuration, that is, Wing-Body-Horizontal-Vertical-Canard (WBHVC).

2.2. Evaluation of Longitudinal Stability and Neutral Point

An aircraft is considered to be longitudinally statically stable if, from a trimmed state, a disturbance in the angle of attack results in a pitching moment which tends to restore the aircraft to its original state of equilibrium [29]. The stability of an aircraft is closely tied to the position of its center of gravity (CG) and that of the neutral point N 0 . This latter is defined as the position of the center of gravity about which the pitching moment coefficient is invariant with the angle of attack [12]. An aircraft is neutrally stable in longitudinal motion if the CG coincides with the N 0 .
It can be shown [30] that the distance between the non-dimensional, longitudinal CG position x ¯ CG and the neutral point N 0 is given by the slope of the pitching moment coefficient evaluated about the CG C M CG versus the lift coefficient C L :
C M C L | CG = C M C L = x ¯ CG N 0
In other words, the slope C M C L , which is a measure of longitudinal stability, is numerically equal to the difference between the CG position and the neutral point, both expressed as fraction of MAC. Usually, the distance between CG and N 0 is assigned by the aircraft designer and it is named Static Stability Margin (SSM). To get longitudinal stability, the CG must be ahead of the neutral point, so that:
x ¯ CG N 0 = SSM < 0
where the minus sign is due to get a positive SSM for a stable aircraft.
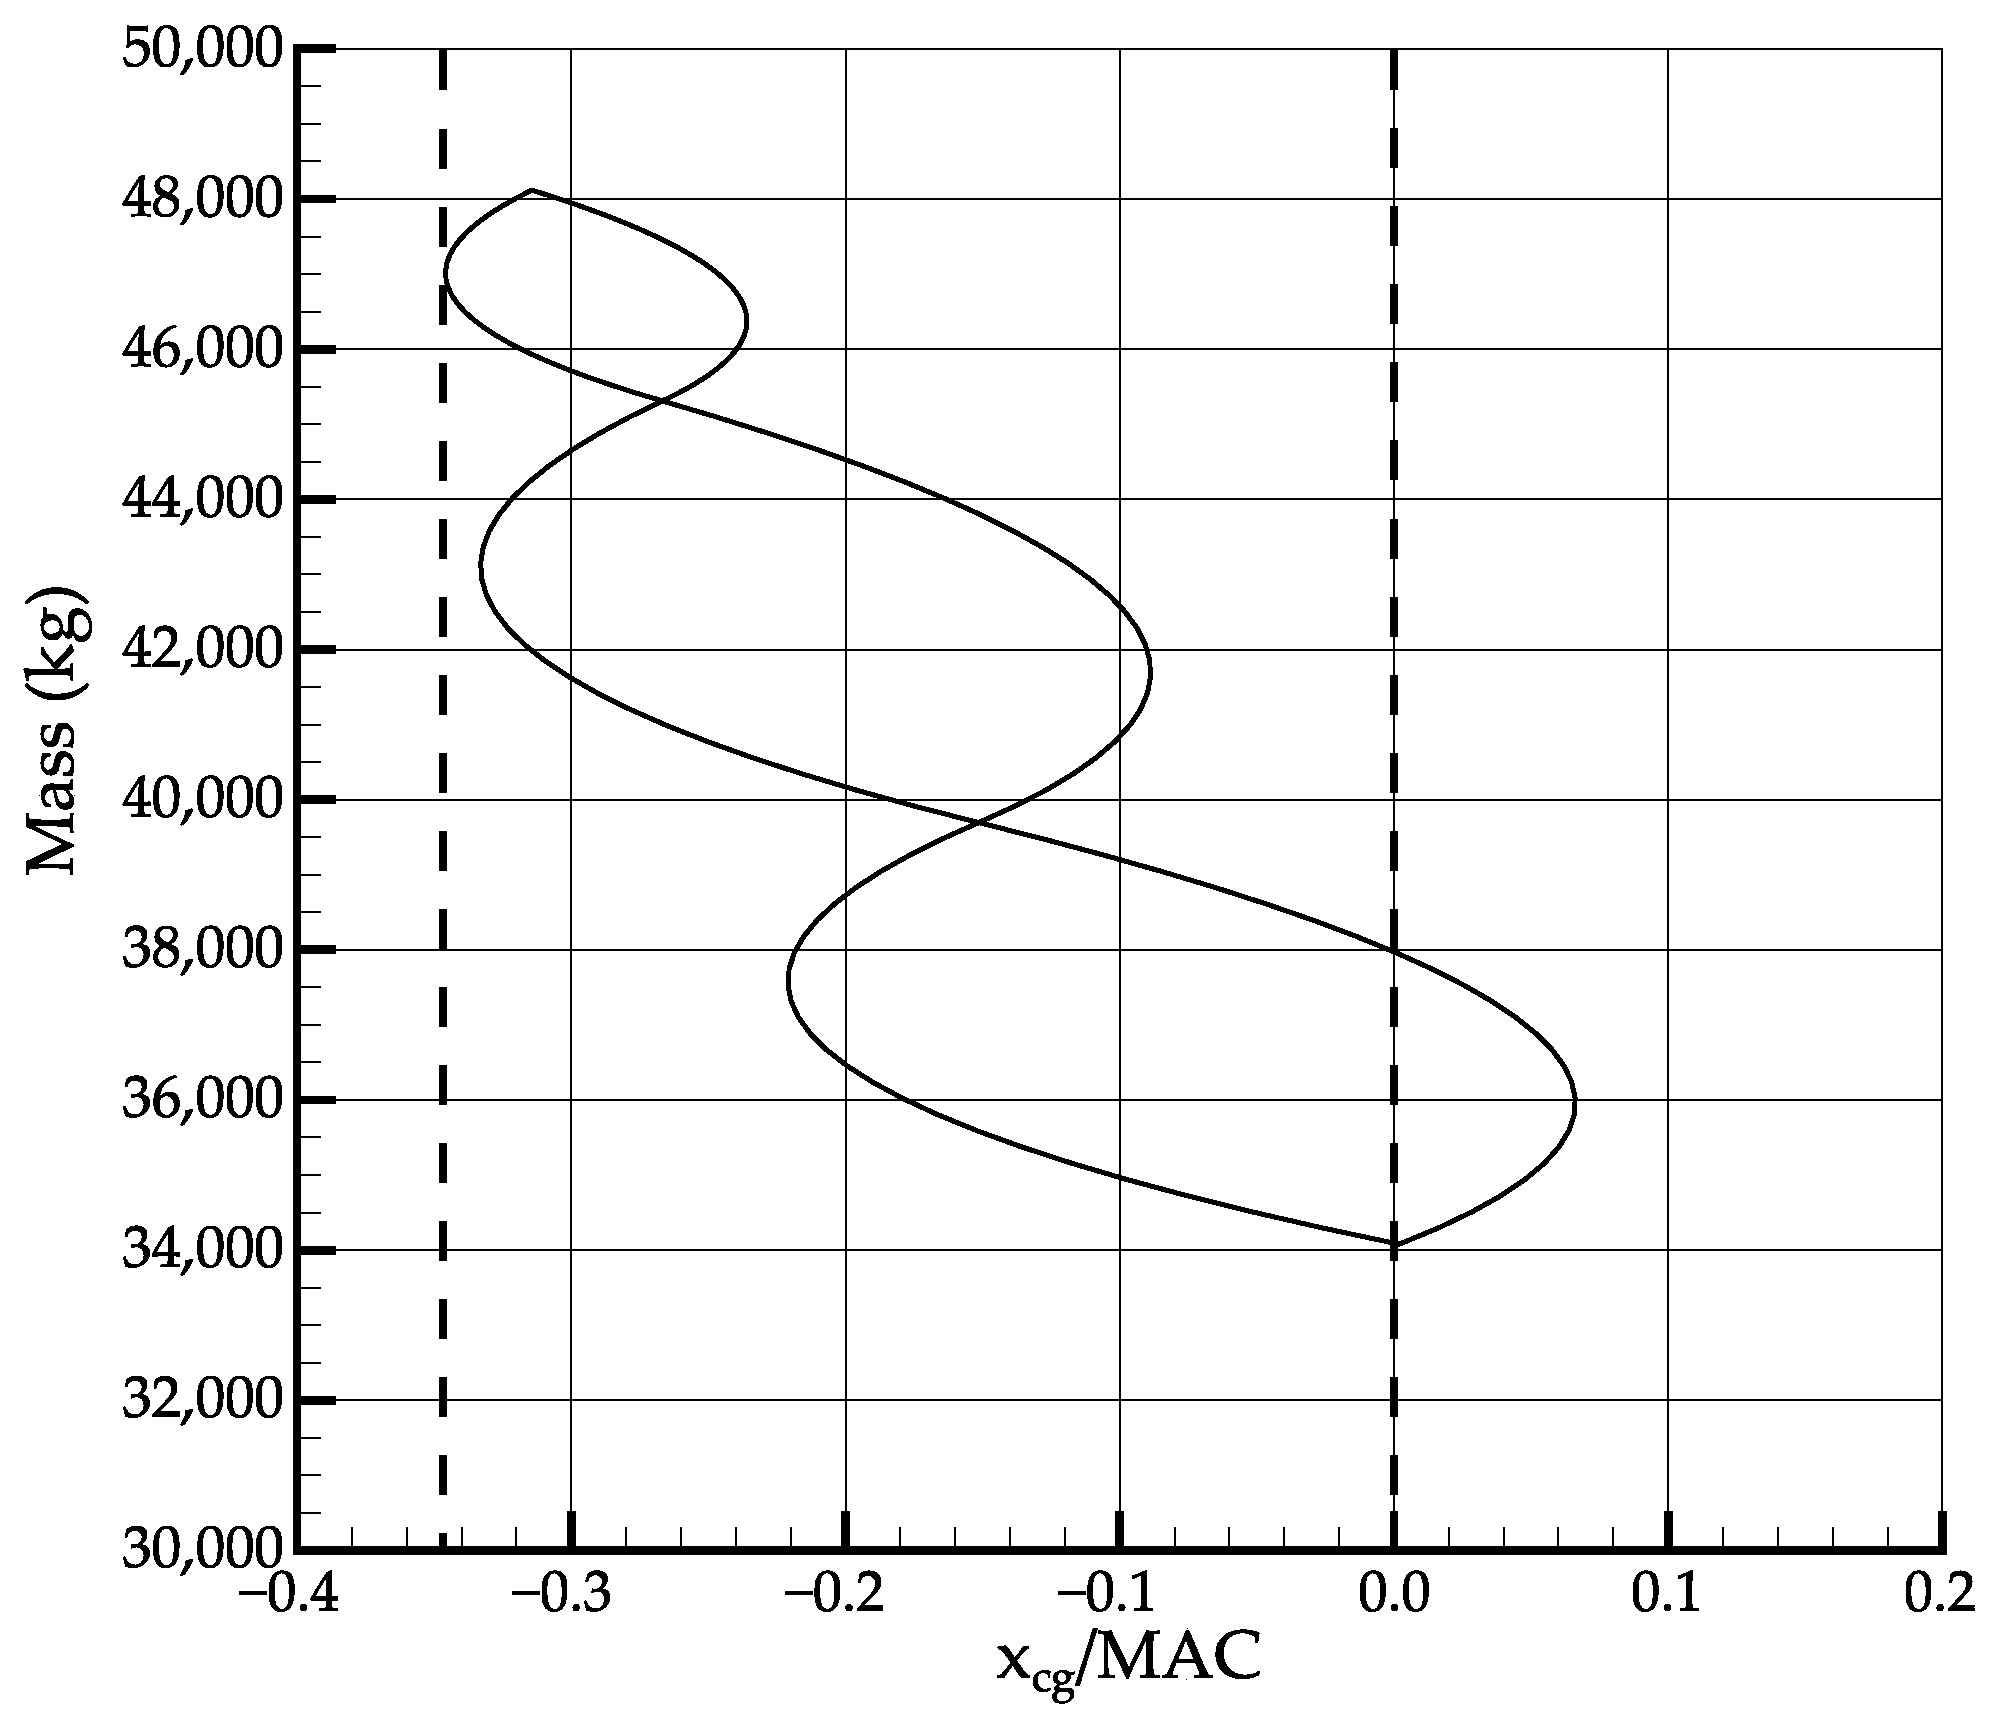
The IRON three-lifting surfaces configuration exhibits a large excursion of CG mainly due to the rearward engines position, as shown in Figure 4. For more details, the reader may refer to [8].
For stability analysis, the aircraft has been investigated at the most unfavourable CG position, which is the most rearward position here coincident with the leading edge of the MAC, that is, x ¯ CG = 0 . This to ensure a minimum stability margin over the entire possible operability range of the aircraft. Therefore, in this work the C M C L is numerically equal to the opposite of N 0 . Furthermore, in the performed stability estimation, the SSM has not been considered as an input but rather as an output since the CG position has been assigned. The sentences just stated could be translated into the following expressions:
  • C M C L = N 0 from Equation (1) with x ¯ CG = 0
  • SSM = C M C L > 0 if test article is longitudinally stable
It is worth to remark that the CG position and excursion shown in Figure 4 are a desired result obtained with a proper wing longitudinal position. The excursion is typical of canard or three-lifting surface configuration, while it is largely unusual for the classical wing and aft tail configurations, where the typical CG excursion is within 15–30% [31].

3. Design Evolution

The design loop 1 configuration has been shown in Figure 1. Wind tunnel data highlighted unsatisfactory static stability characteristics, leading to a design review of the canard position and of the empennage layout. In fact, the interaction of the wing and canard wakes was such to provide a neutral longitudinal stability at low lift coefficients, with a tendency to instability at moderate lift coefficients.
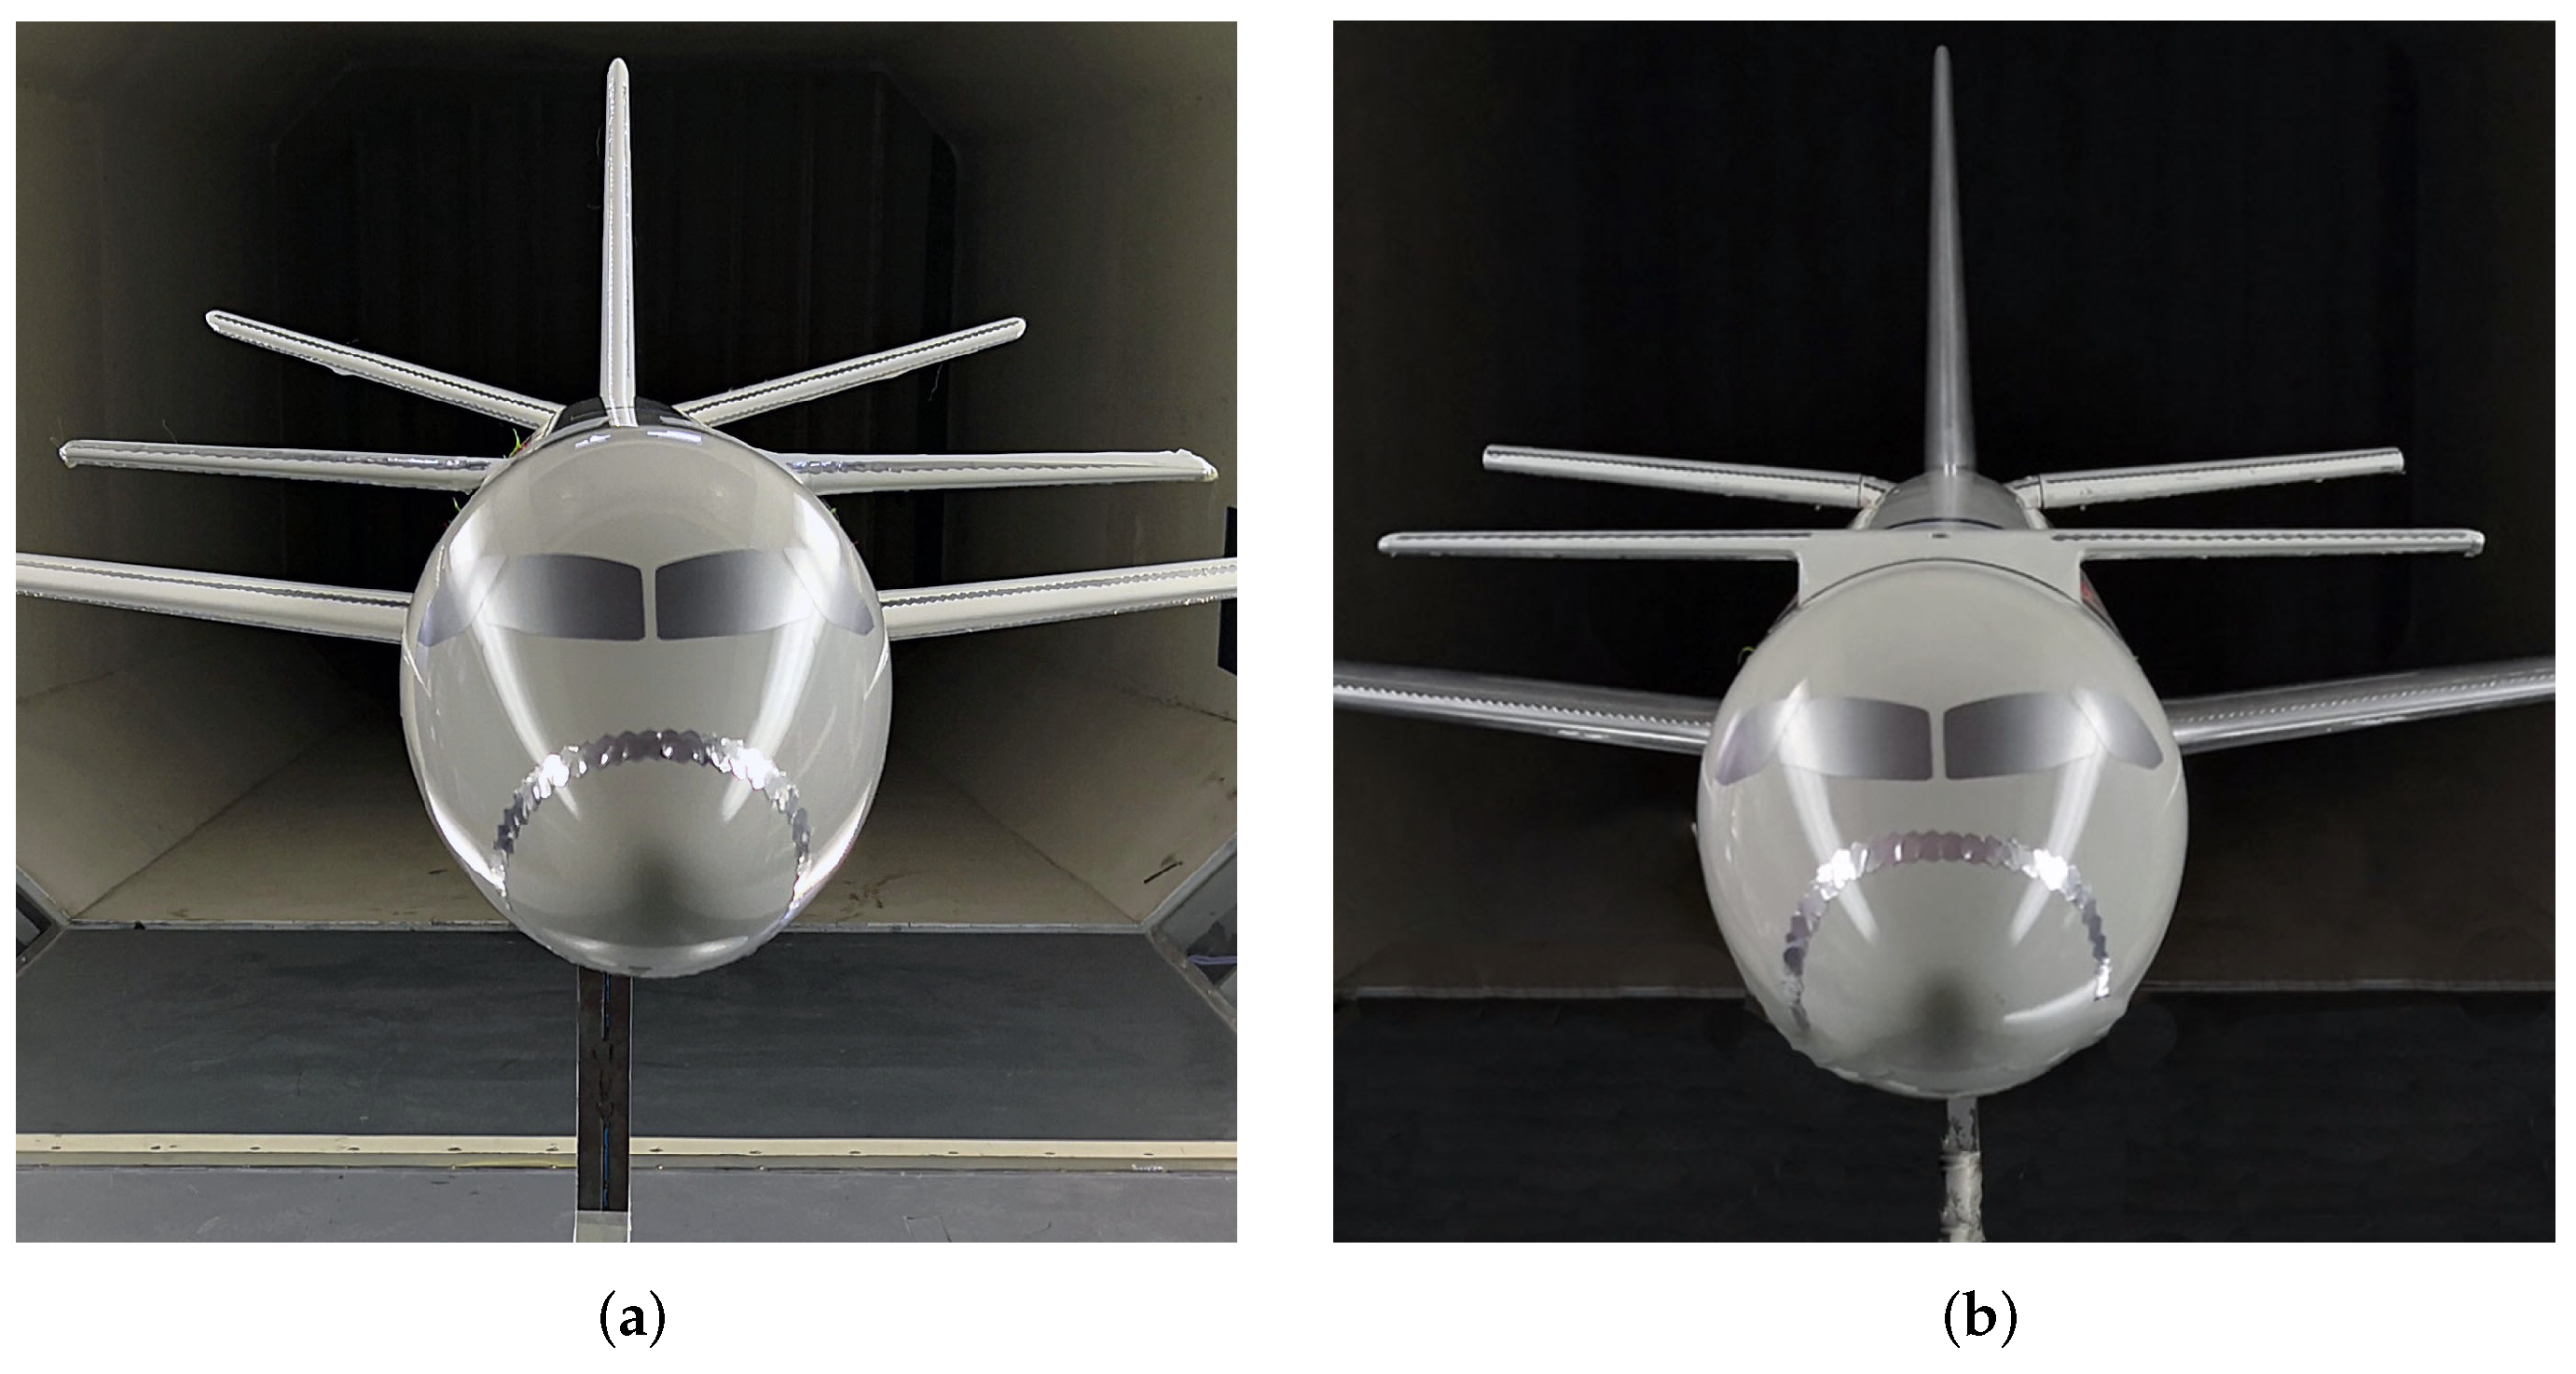
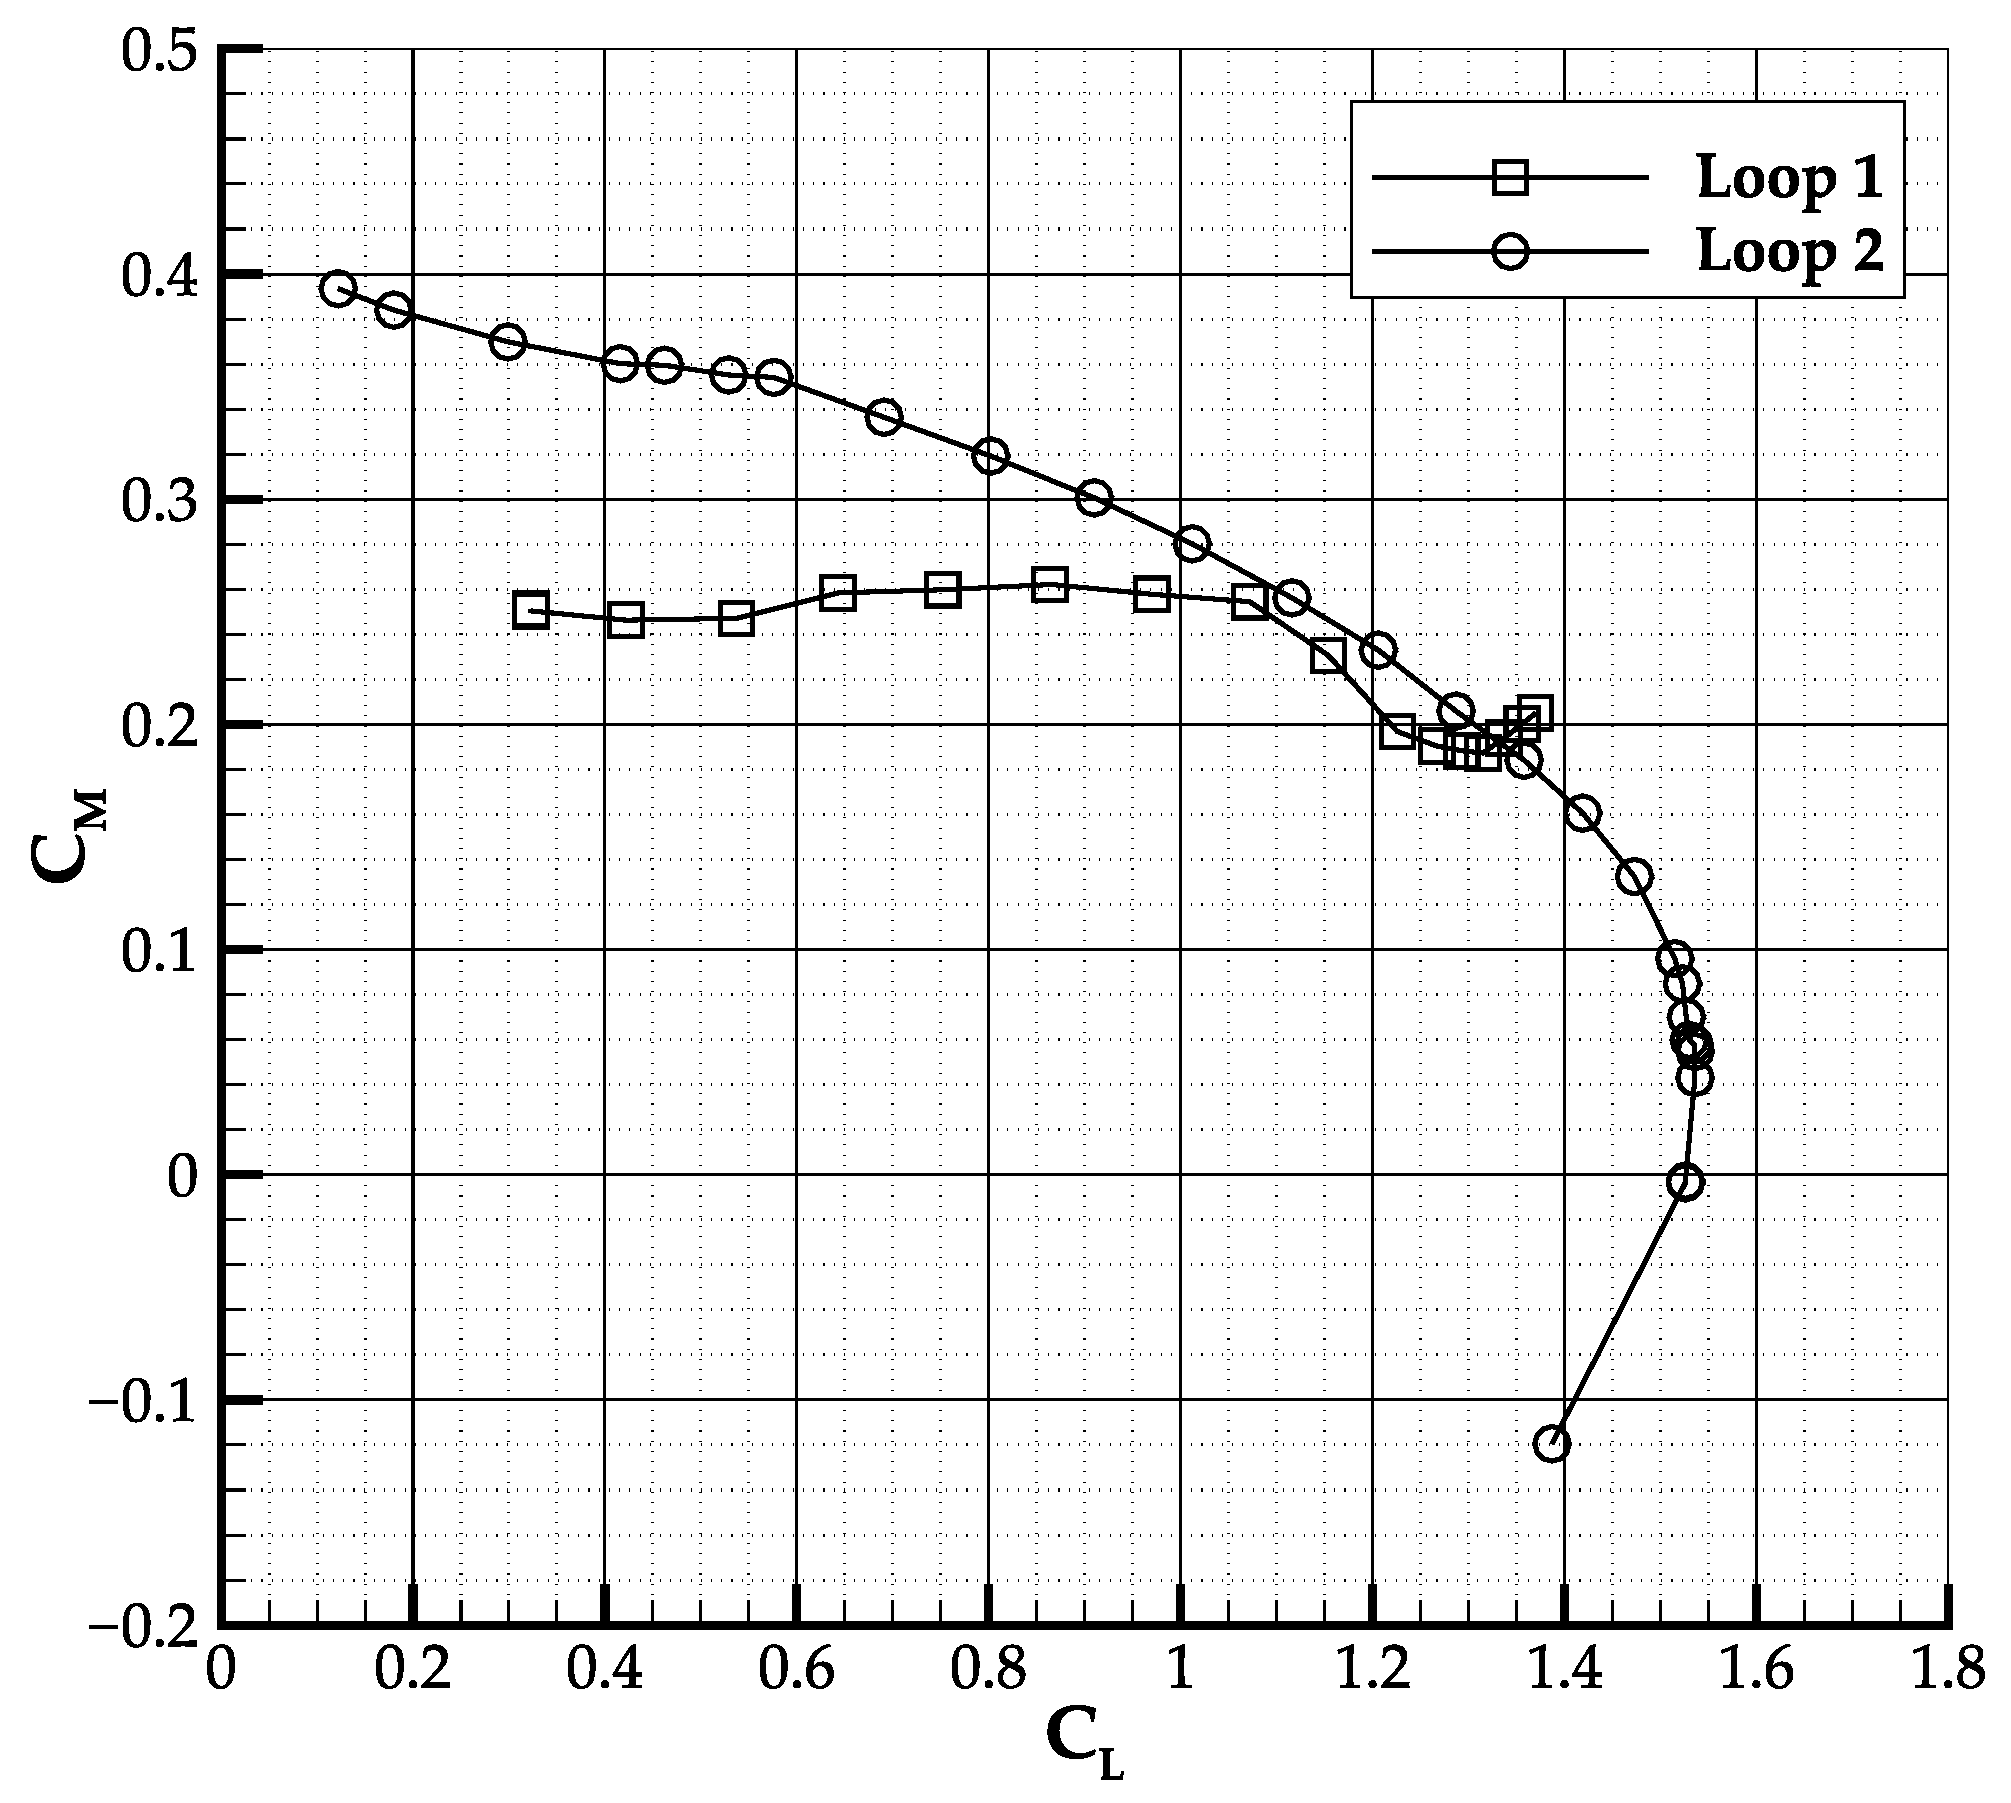
To keep the aircraft naturally stable in pitch, it was decided to increase the vertical stagger between the canard and the wing. By design constraint imposed by the IRON project leader, the only way to purse this was to shift the canard as high as possible. This shift was about 8.5% of the fuselage maximum diameter, and it is shown in Figure 5. This position is slightly above the fuselage; hence, an additional fairing was provided. At the same time, to counteract the longitudinal stability reduction introduced by the canard downwash and its wake at low attitude angles, the horizontal tailplane dihedral angle was reduced from 15° to 5.5°, increasing its planform area. The comparison between the main geometric characteristics is shown in Table 5. The effect of canard re-positioning and horizontal tailplane dihedral change on the pitching moment coefficient is shown in Figure 6. The increased longitudinal stability is evident, and the stability derivative in the range of lift coefficient from 0.5 up to 1.0 changes from +0.011 (unstable) to −0.16 (stable).
As concerns the sideslip, the application of wool yarns on the canard has shown that its tip vortex interacts with the vertical stabilizer at low and moderate angles of sideslip. As the sideslip angle increases, the tip vortex generated by the canard approaches and leaps over the vertical tailplane, as shown in Figure 7. From the flow visualization, it can be observed that at a low sideslip angle, the canard tip vortex is impinging the windward side of the vertical tail, reducing its capability to produce sideforce. As the sideslip angle increases, the tip vortex moves across the vertical tail, and when it reaches the leeward side, the vertical tail lifting capabilities are suddenly recovered. This latter occurs at sideslip angles higher than 10°. This is particularly detrimental for aircraft directional stability in the range 5–10° of sideslip, and it is expected to be worse at higher angles of attack. A similar phenomenon has been also observed by Agnew et al. in [27] on a three-surfaces fighter aircraft.
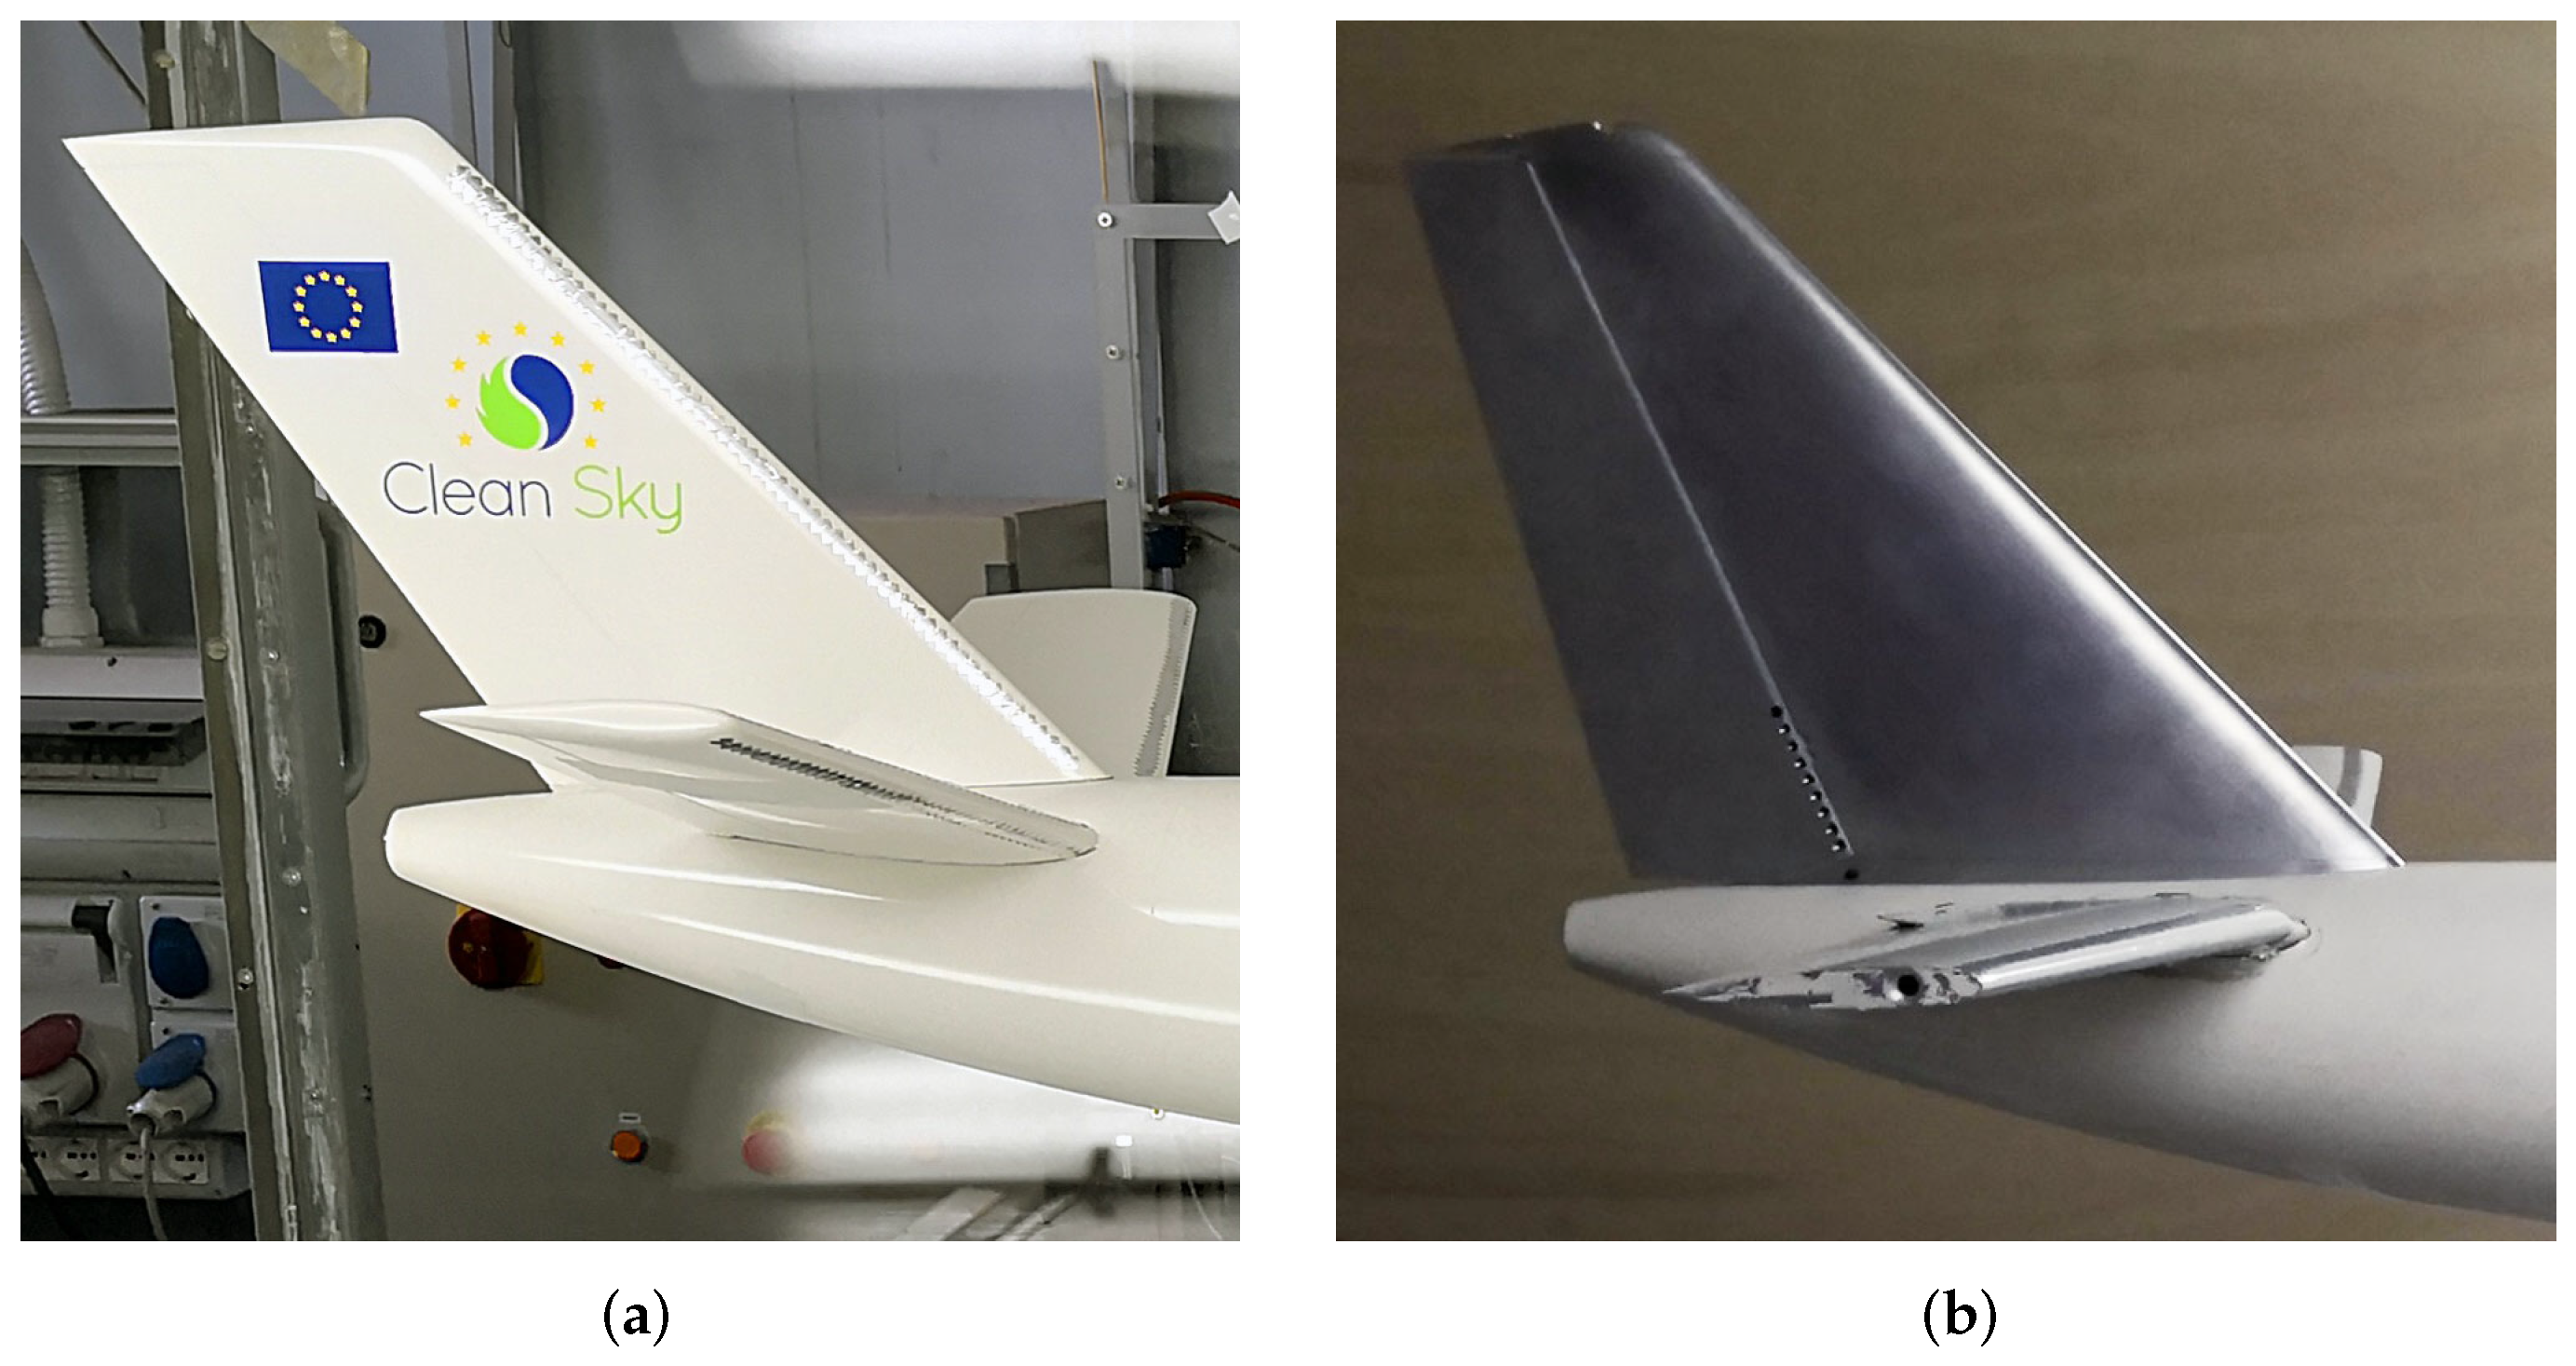
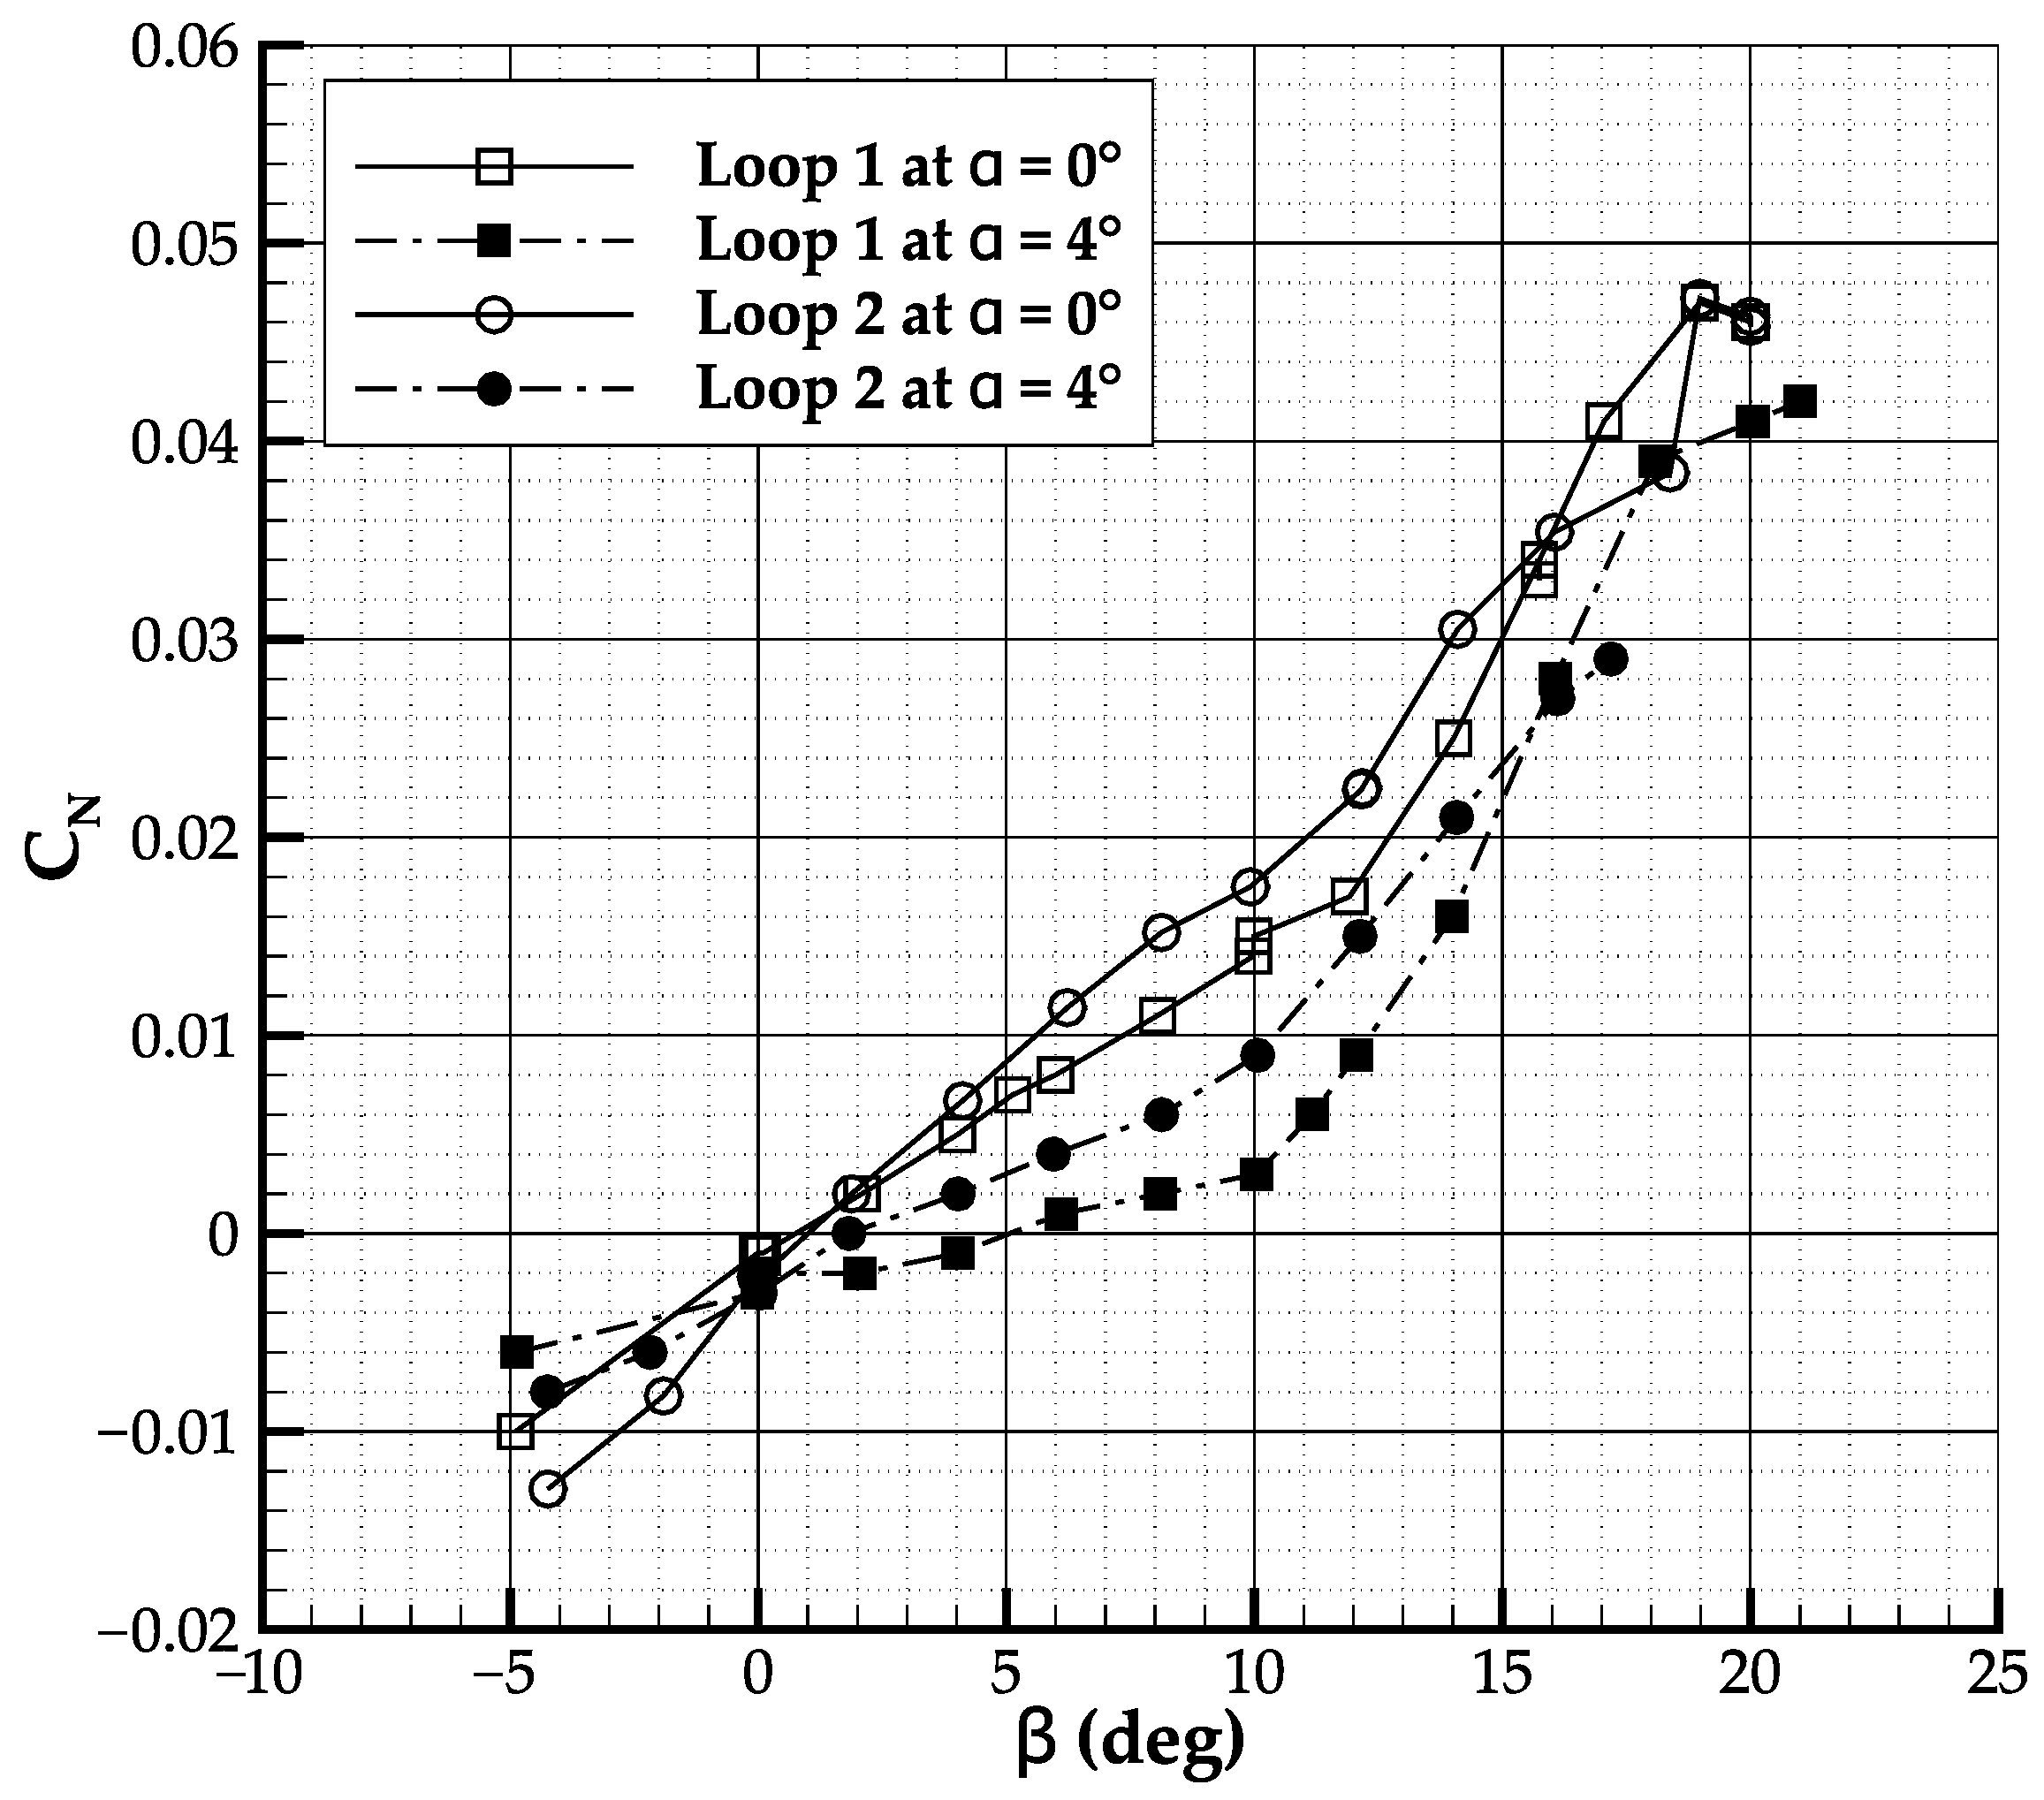
To mitigate the effect of the canard tip vortex in sideslip, the vertical tailplane planform has been re-designed, see Figure 8. The planform area has been increased by 6%, a taper ratio of 0.35 has been introduced, and the sweep angle at half-chord has been lowered. These modifications increase the lift curve slope of the vertical tailplane [32] The actual configuration is much more similar to the vertical stabilizer of a jet aircraft than the one of a conventional turboprop. This has improved the directional stability characteristics as shown in Figure 9, where at α = 0 ° the sideslip stability derivative about β = 0 ° changes from 0.0016 deg−1 to 0.0023 deg−1.
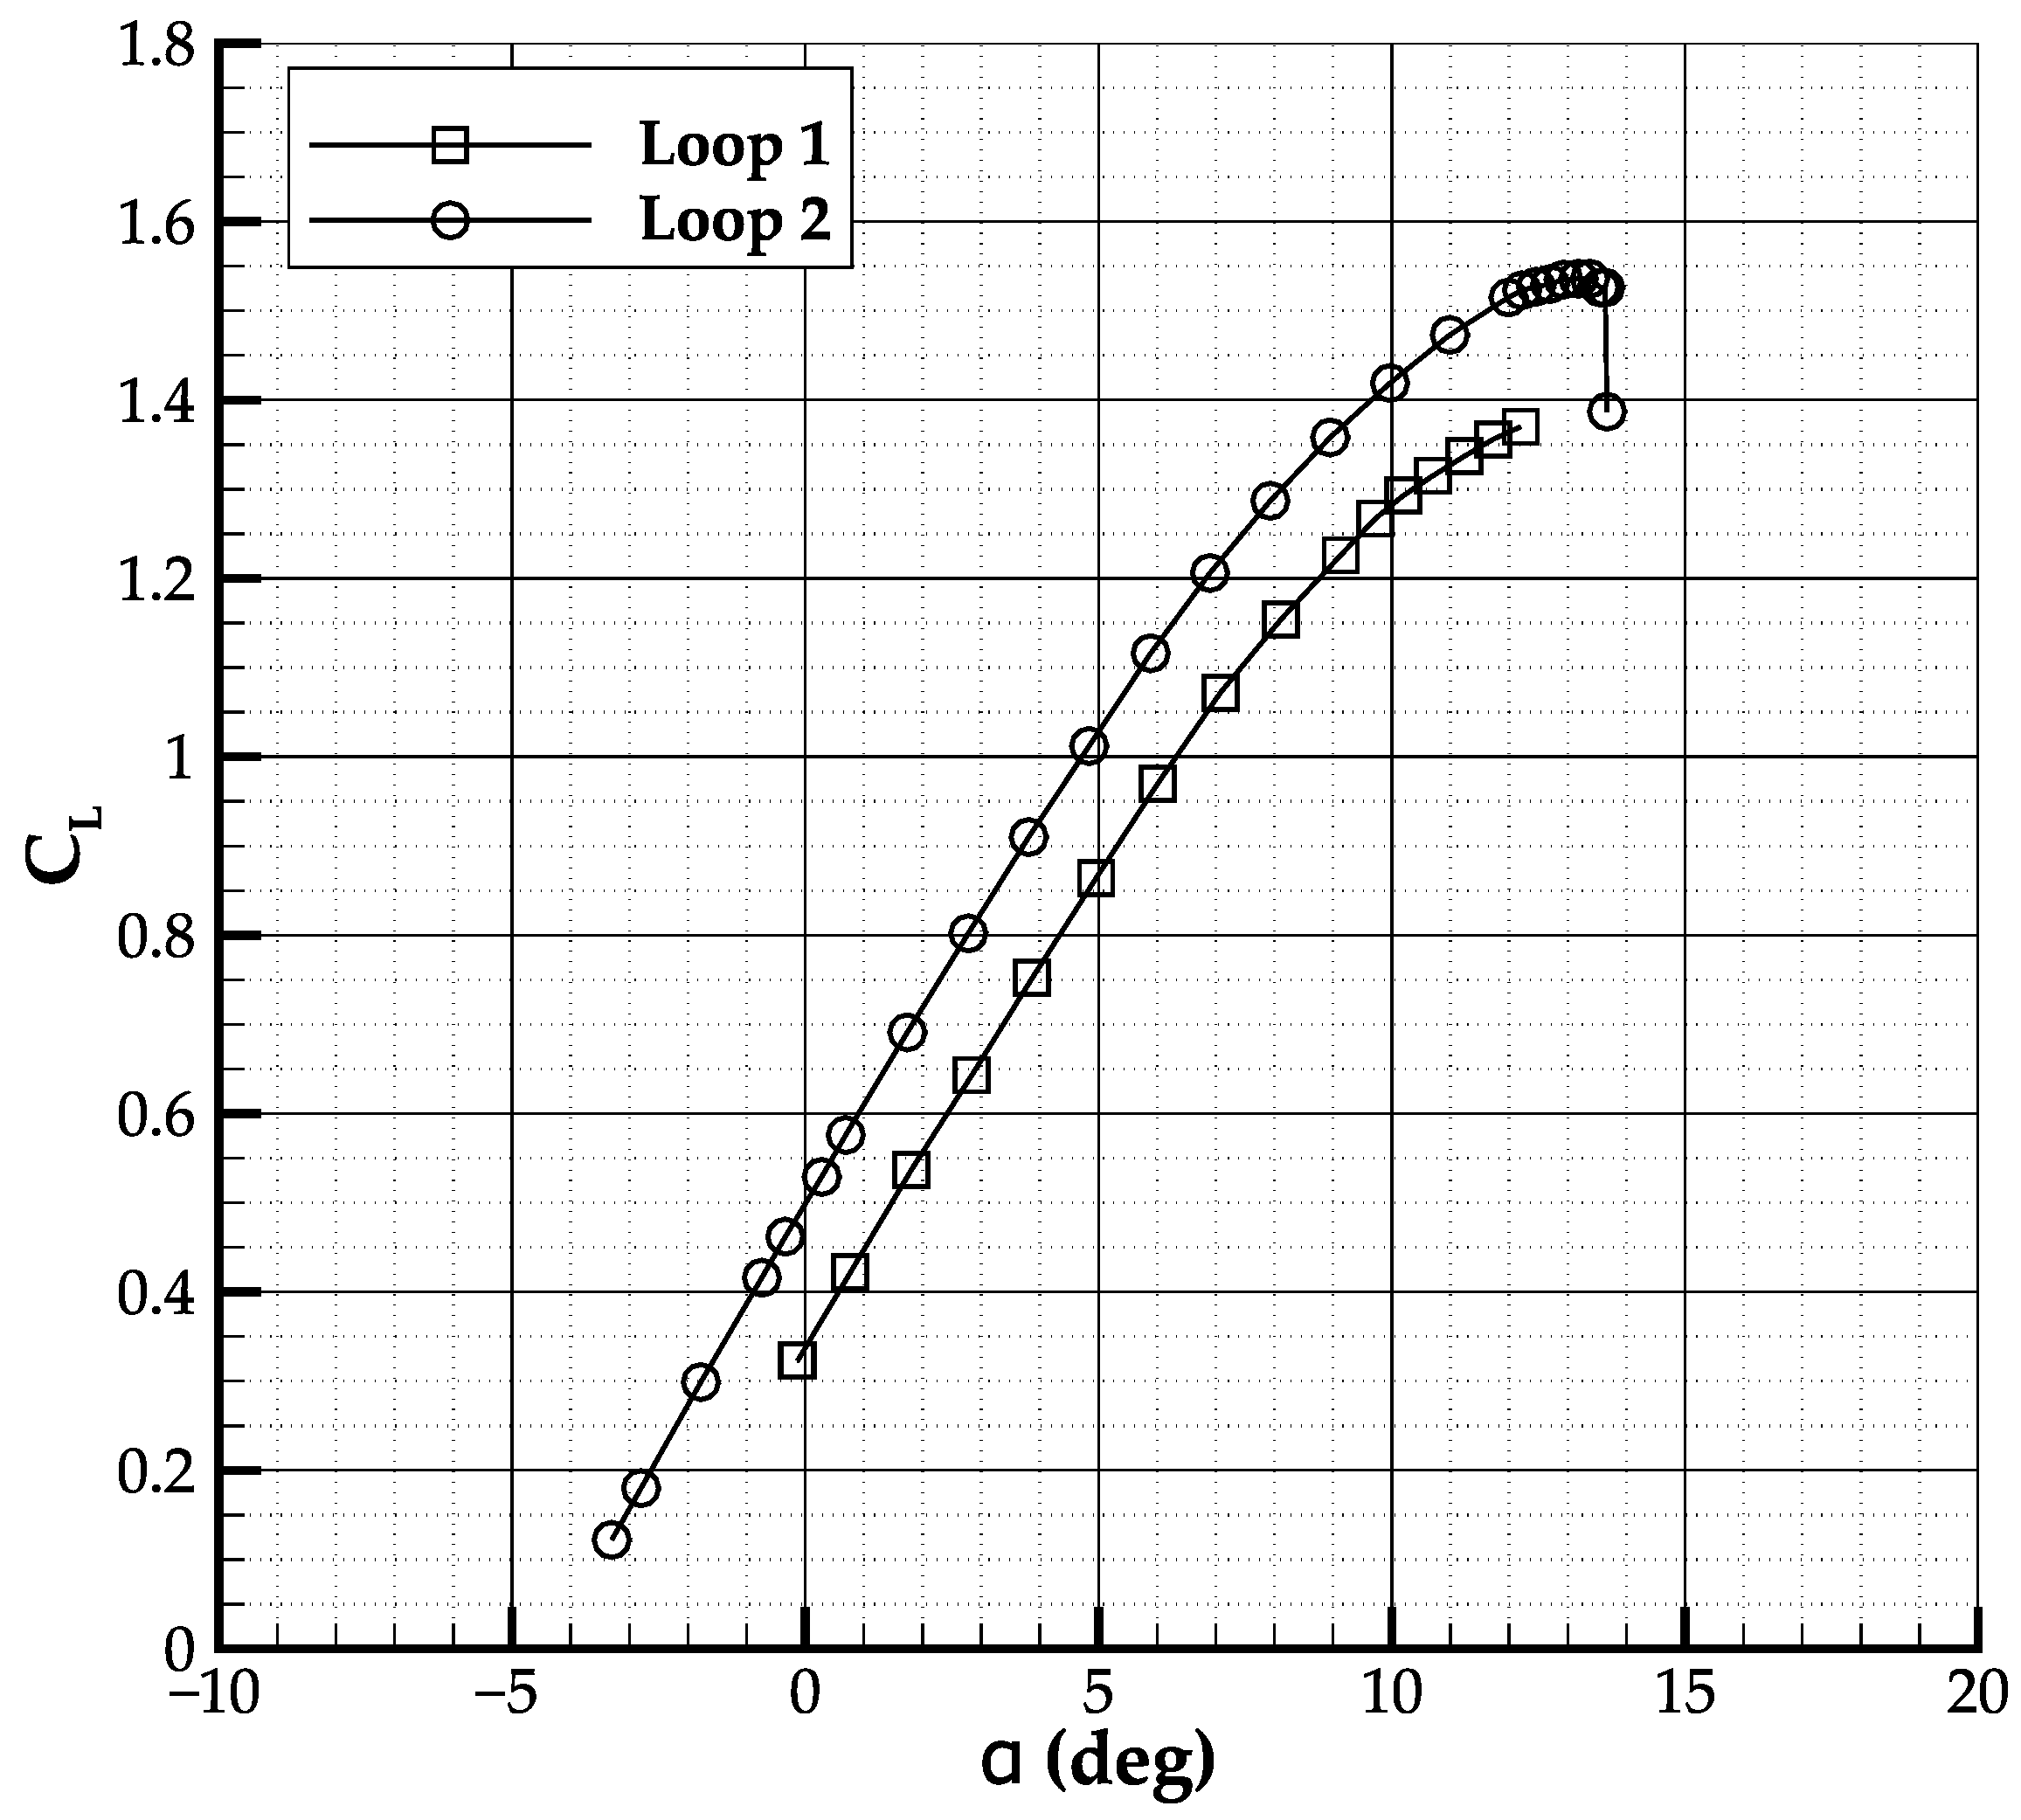
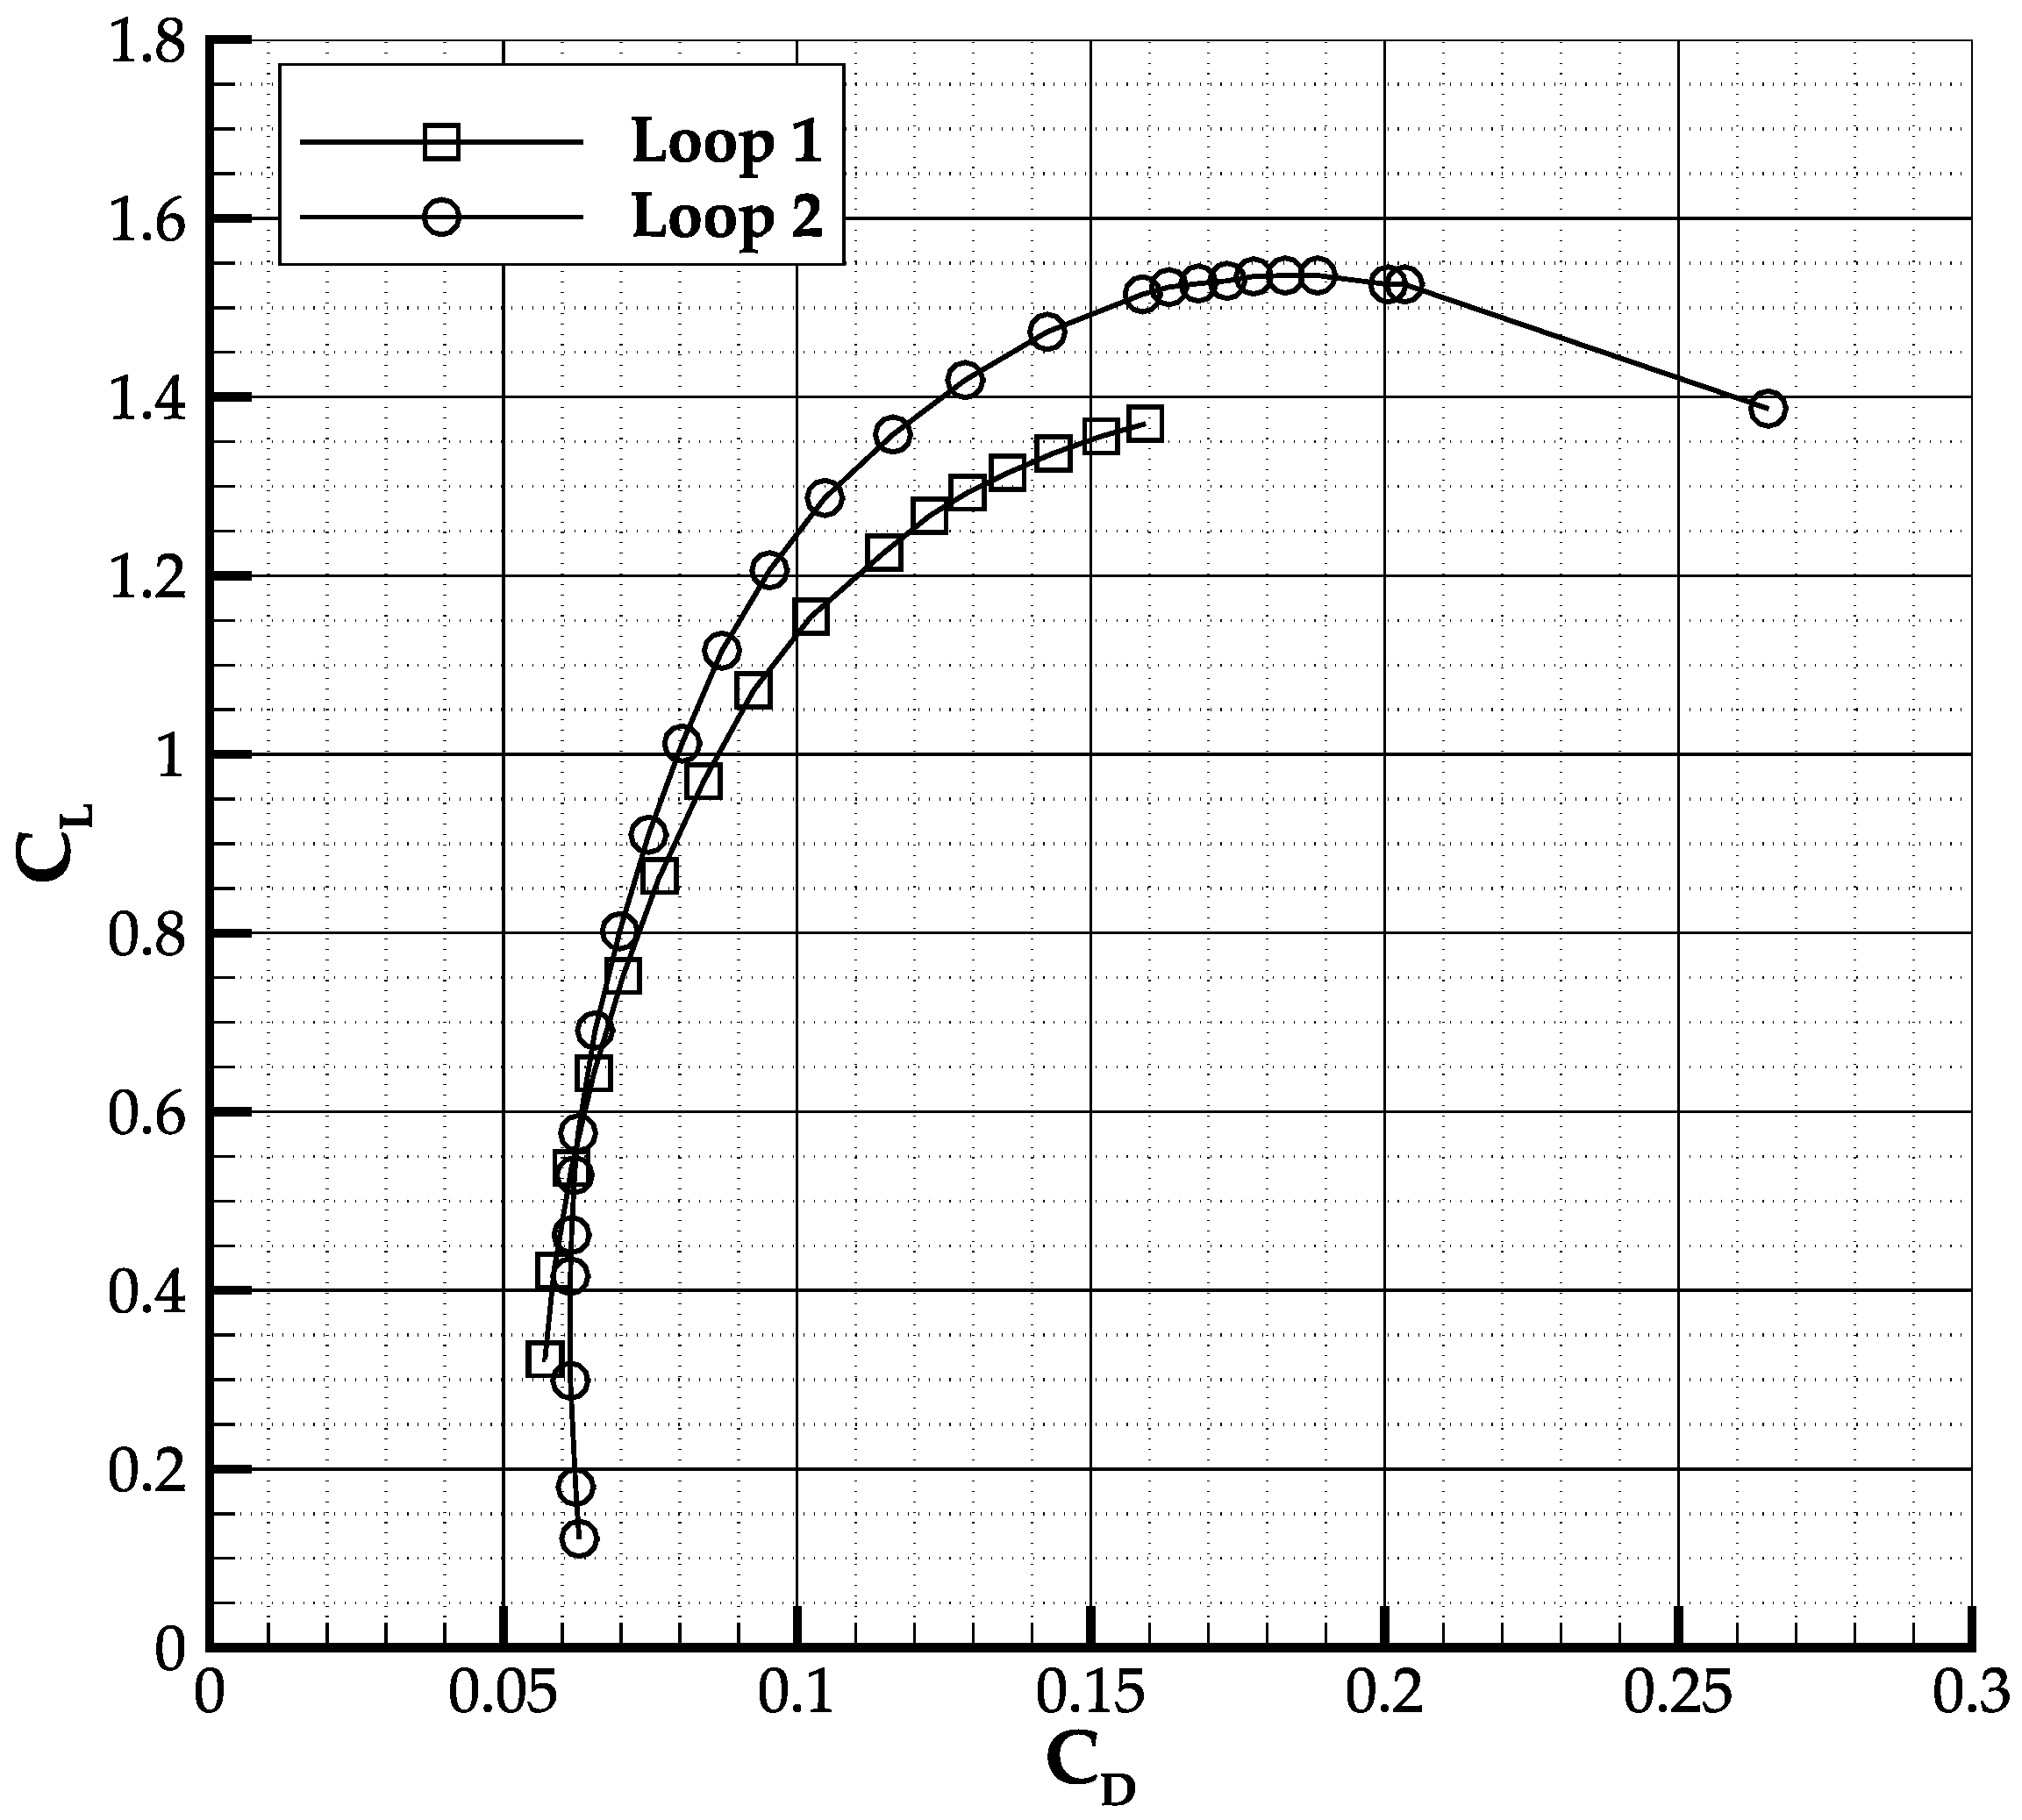
Finally, a non-critical change was also made on the wing root incidence angle and fairing [33], which shifted up the lift curve, achieving an increase of C L max of 0.2, as shown in Figure 10. As concerns the drag polars shown in Figure 11, it is here remarked that the drag coefficient values attained in low Reynolds wind tunnels are usually higher than those in full-scale conditions. Nonetheless, the maximum aerodynamic efficiency achieved by the test article is about 13. The main changes in aerodynamic coefficients, efficiency, and stability derivatives are resumed in Table 6.

4. Insight on the Aerodynamic Interference Effects

The evolved design at the end of loop 2 was shown in Figure 2. In this section, details are given on the data extracted from the wind tunnel tests results on this last configuration. The focus is on the effects of the canard on the longitudinal and directional stability. Additionally, the estimation of the downwash effect is given.

4.1. Longitudinal Tests

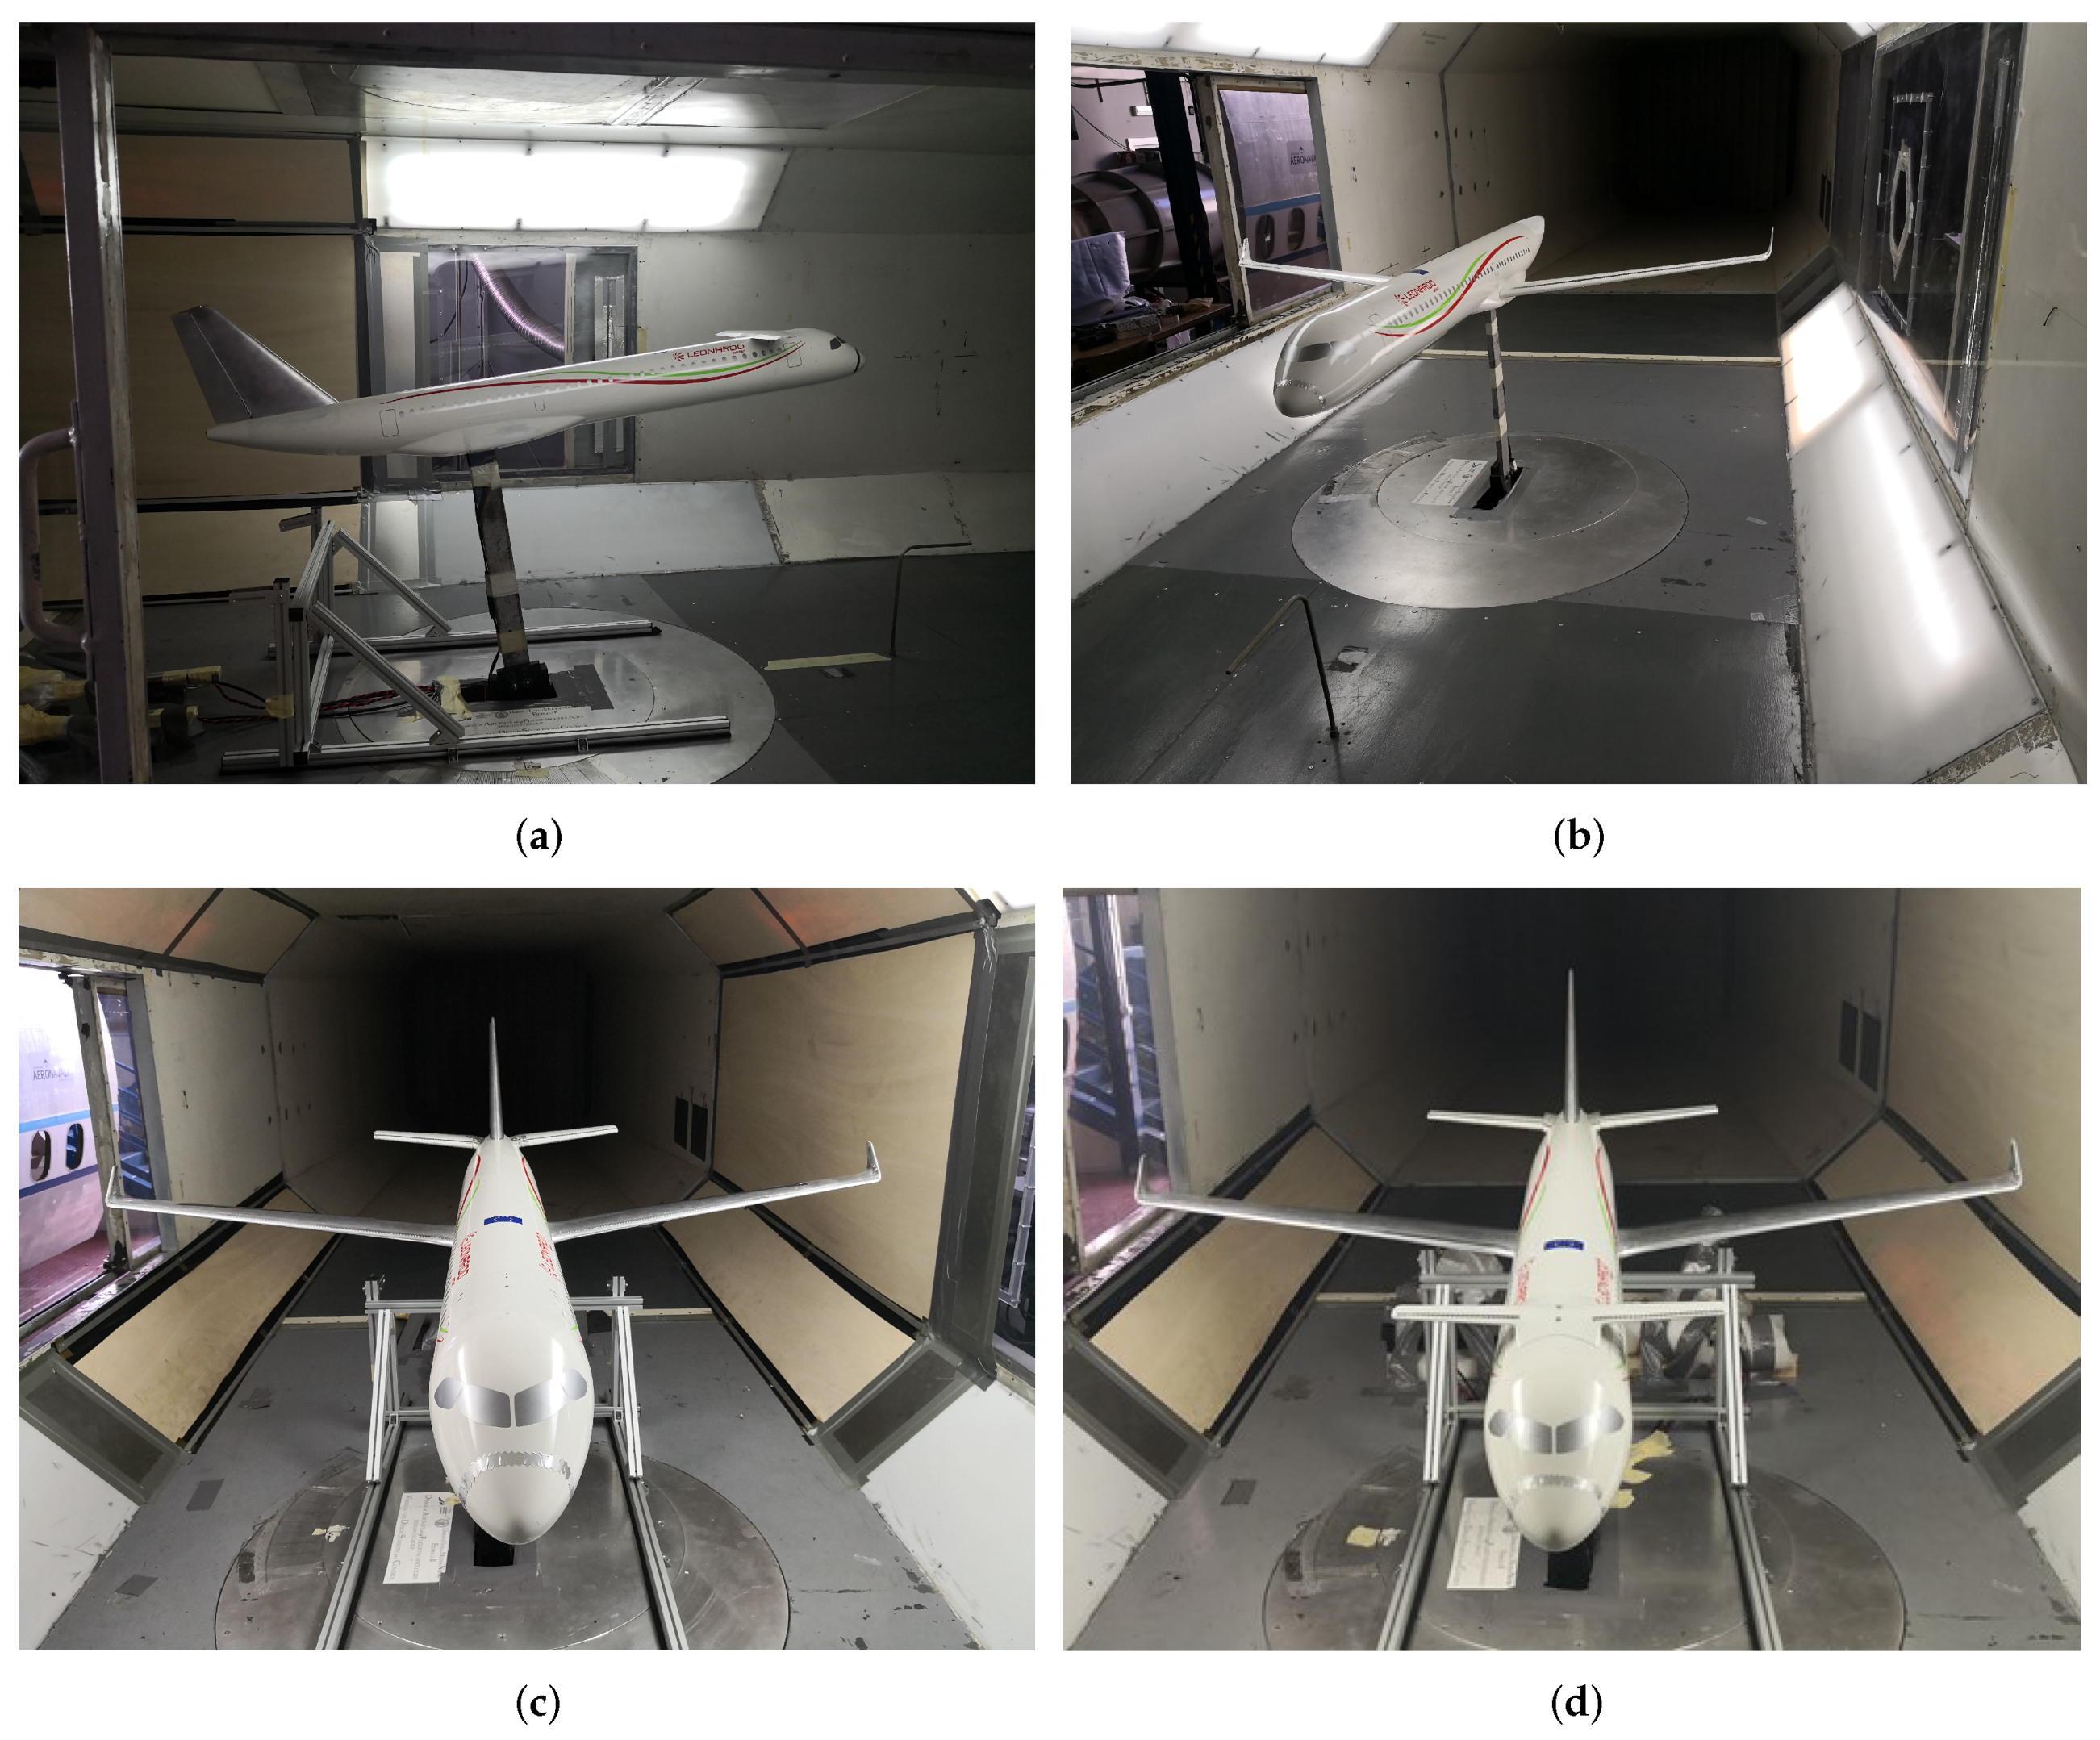
Several experimental tests have been conducted on different combinations of aircraft components (wing, body, and tailplane), as illustrated in Figure 12, where some of the tested configurations are shown. It could be useful for a designer to have an estimation of the downwash for a such three-lifting surfaces configuration.
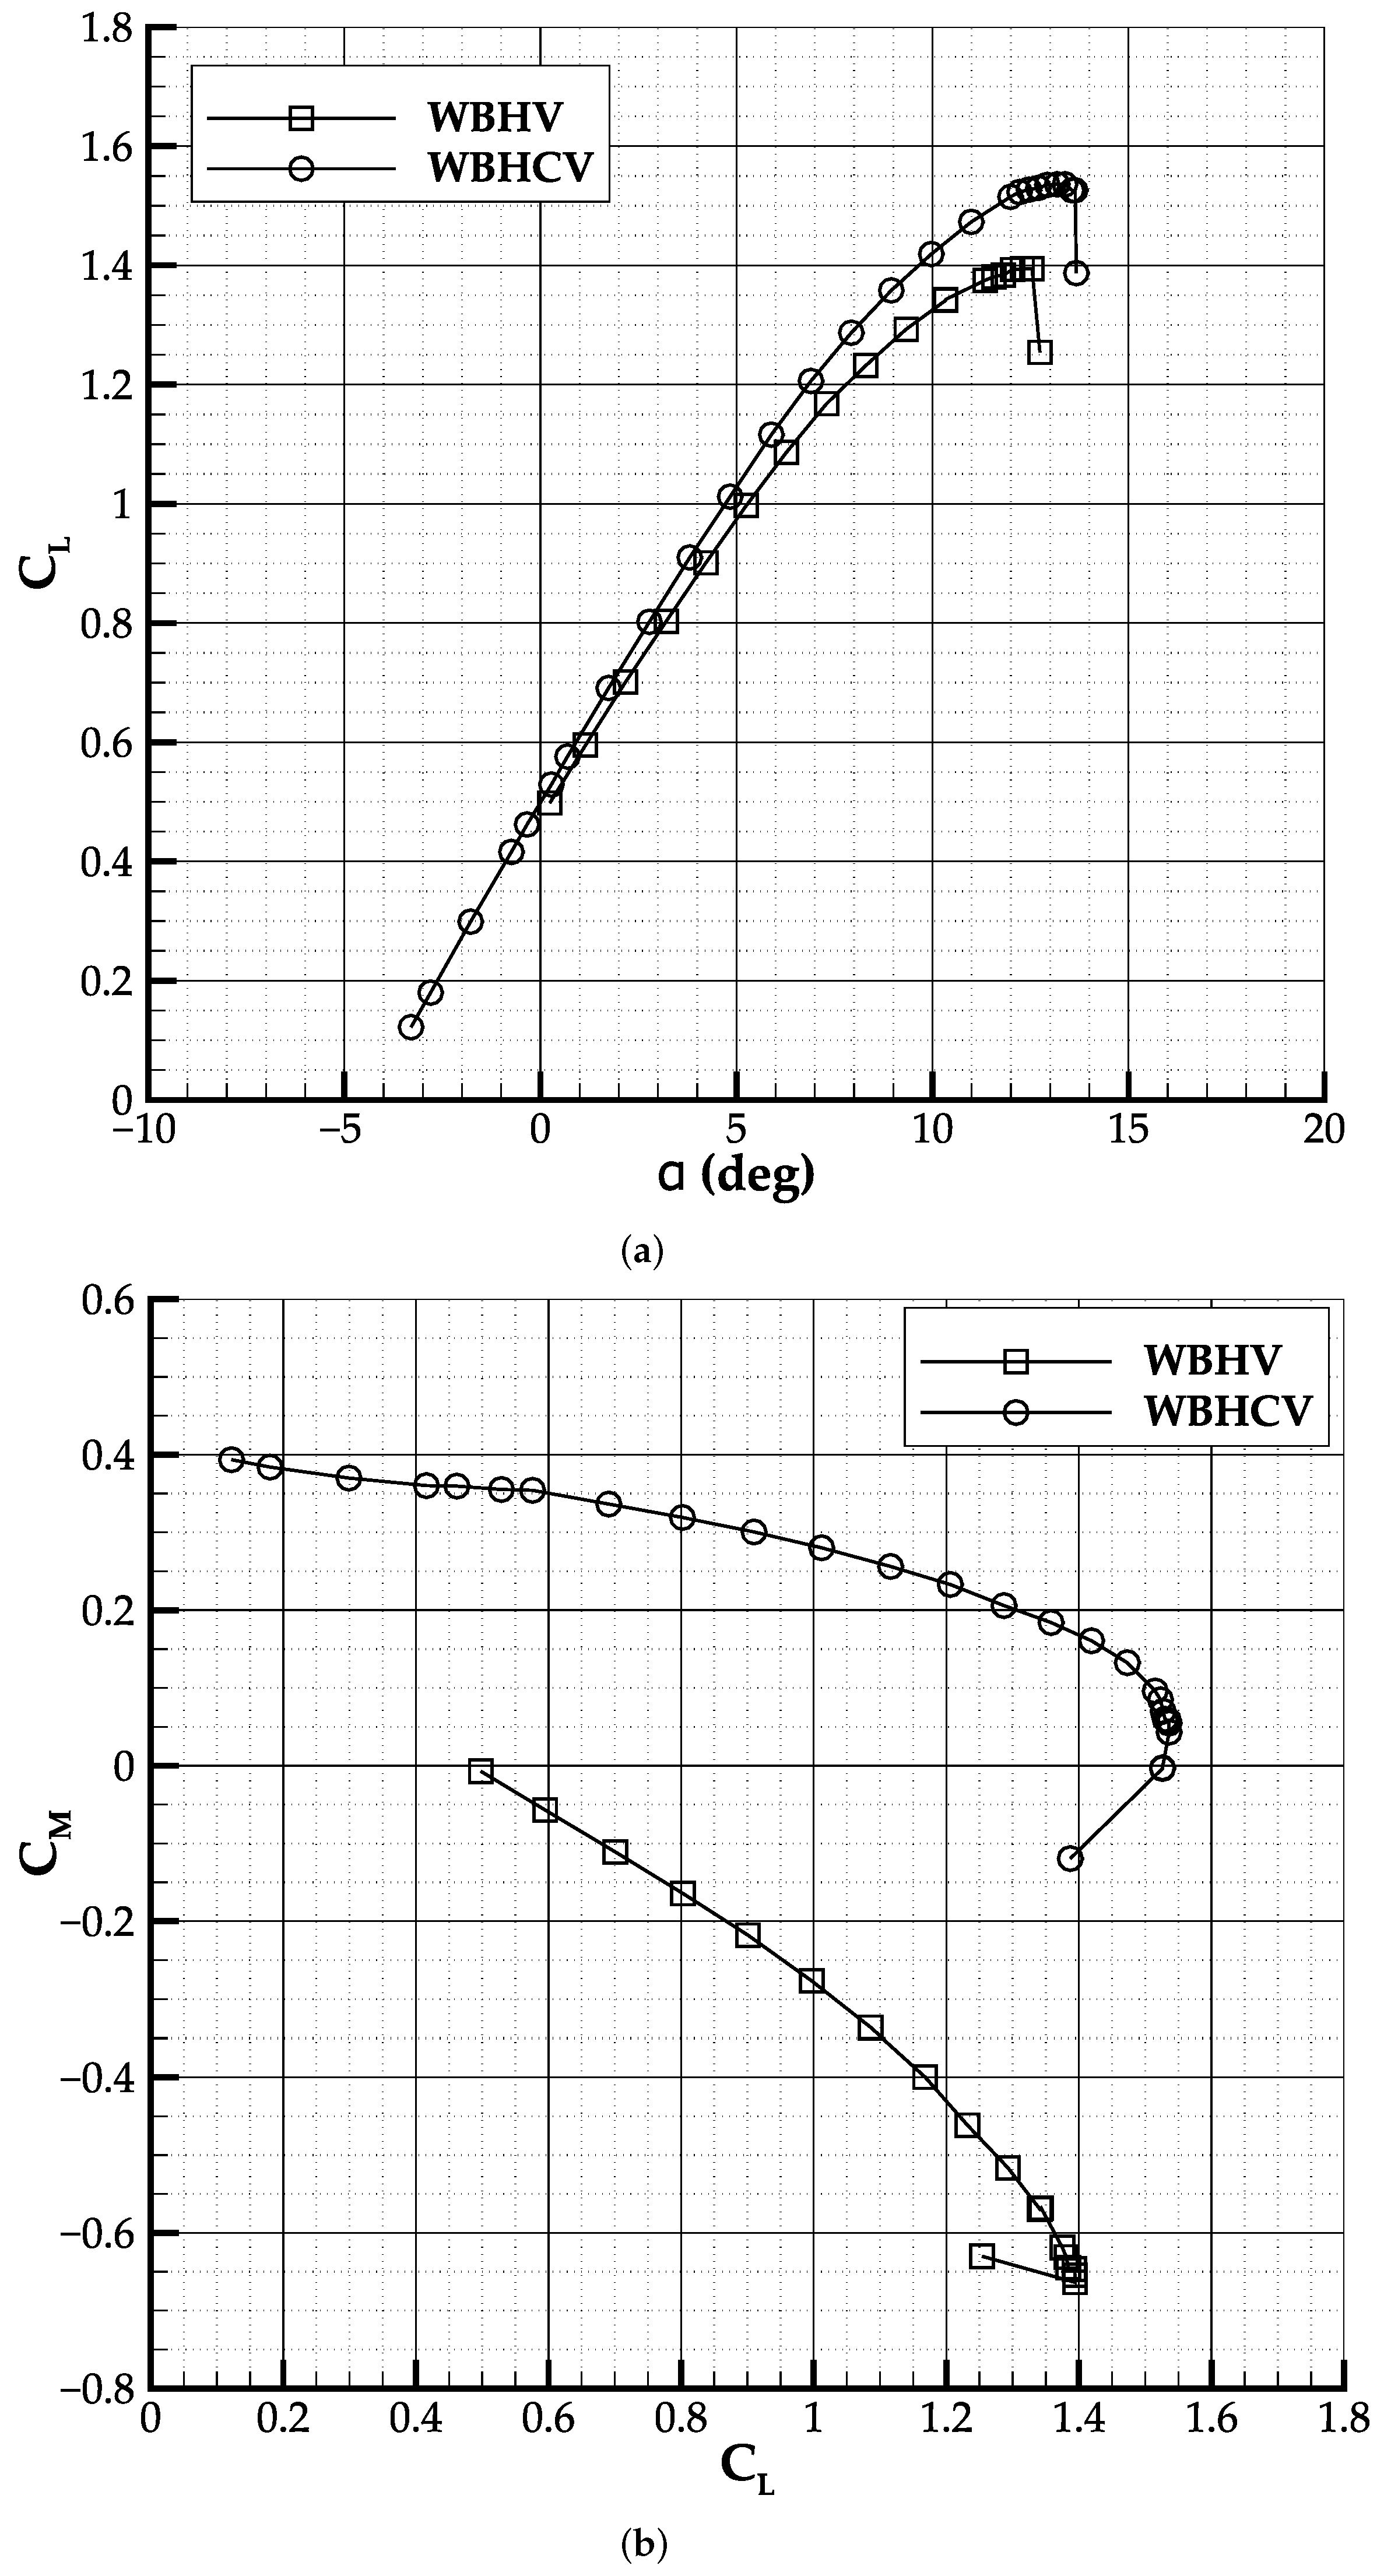
Tests confirmed that the canard allows one to achieve a higher maximum lift coefficient, in line with [23], splitting the lift force among the three lifting surfaces. It is here remarked that the wind tunnel runs are related to a small-scale test article. The Reynolds number with respect to the wing mean aerodynamic chord is about 315,000; thus, the wind tunnel estimation of the maximum lift capability is not a reliable prediction of the values attainable by the full-scale aircraft. Nonetheless, it is important to understand the effects of the third lifting surface on the main lifting surface. As also underlined by Strohomeyer in [23], the static margin was expected to significantly decrease with the integration of a canard, even if lower order analyses did not reveal any issues [8,11].
In this respect, it is interesting to compare the pitching moment curves for configurations with and without canard, as done in Figure 13. Test results for the canard-off curve are related to a configuration where the canard was simply removed from the aircraft model. Technically speaking, this approach is not strictly correct because the large SSM exhibited by the aircraft configuration without the canard is unrealistic for such a design since the aircraft is conceived as a three-lifting surfaces configuration. In fact, if the innovative turboprop were to be designed with a conventional configuration—wing and aft tail—it would have a completely different layout. The wing would have a larger planform area and it would be placed more forward. The horizontal tail would be larger to face a completely different center of gravity excursion range [8]. Thus, the curve relative to the canard-off configuration is just a partial result, and it is only useful to figure out the impact of the canard on aircraft longitudinal stability.
The observed reduction of stability margin with canard is in line with the trend reported in [26]. The SSM of the complete aircraft is about 7.8% MAC at low angles of attack (0–4°) and increases to 10.8% MAC in the linear range of higher angles of attack (8–10°).

4.2. Downwash Estimation

Under the assumption of superposition principle, it was possible to estimate the canard downwash on tailplane by comparing the lift curve slopes of the horizontal tail from the results of test on the Body-Horizontal-Canard (BHC) configuration with those on the Body-Horizontal (BH) configuration. As suggested by Barlow et al. [28], downwash can be estimated from the experimental data as the ratio of C L α H between these two configurations:
q H q 1 d ε d α C on H = C L α BHC C L α BC C L α H BHC C L α BH C L α B C L α H BH
where the lift curve slope of the horizontal tailplane C L α H cannot be directly measured, but it is calculated as the difference between the measurements of the C L α of a given configuration with tail-on and tail-off, respectively.
Similar considerations hold for the downwash estimation of the wing on the horizontal tailplane, and the combination of wing and canard on the horizontal tailplane:
q H q 1 d ε d α W on H = C L α WBH C L α WB C L α H WBH C L α BH C L α B C L α H BH
q H q 1 d ε d α WC on H = C L α WBHC C L α WBC C L α H WBHC C L α BH C L α B C L α H BH
Interestingly, the effect of the canard downwash on the wing turns out to be negligible ( d ε / d α 0.03 ) , probably due to the sensible differences in terms of span and aspect ratio, in line with Ref. [19]. However, it is worth to underline that the estimation of downwash gradient is affected also by the dynamic pressure. As a matter of fact, the procedure above described does not allow one to decouple the dynamic pressure effect from the pure downwash calculation. In this respect, the ratio of the tailplane lift curve slopes includes the effects of both the dynamic pressure ratio and the downwash. The calculated tailplane lift curve slopes and the downwash gradients of Equations (3)–(5) are reported in Table 7.
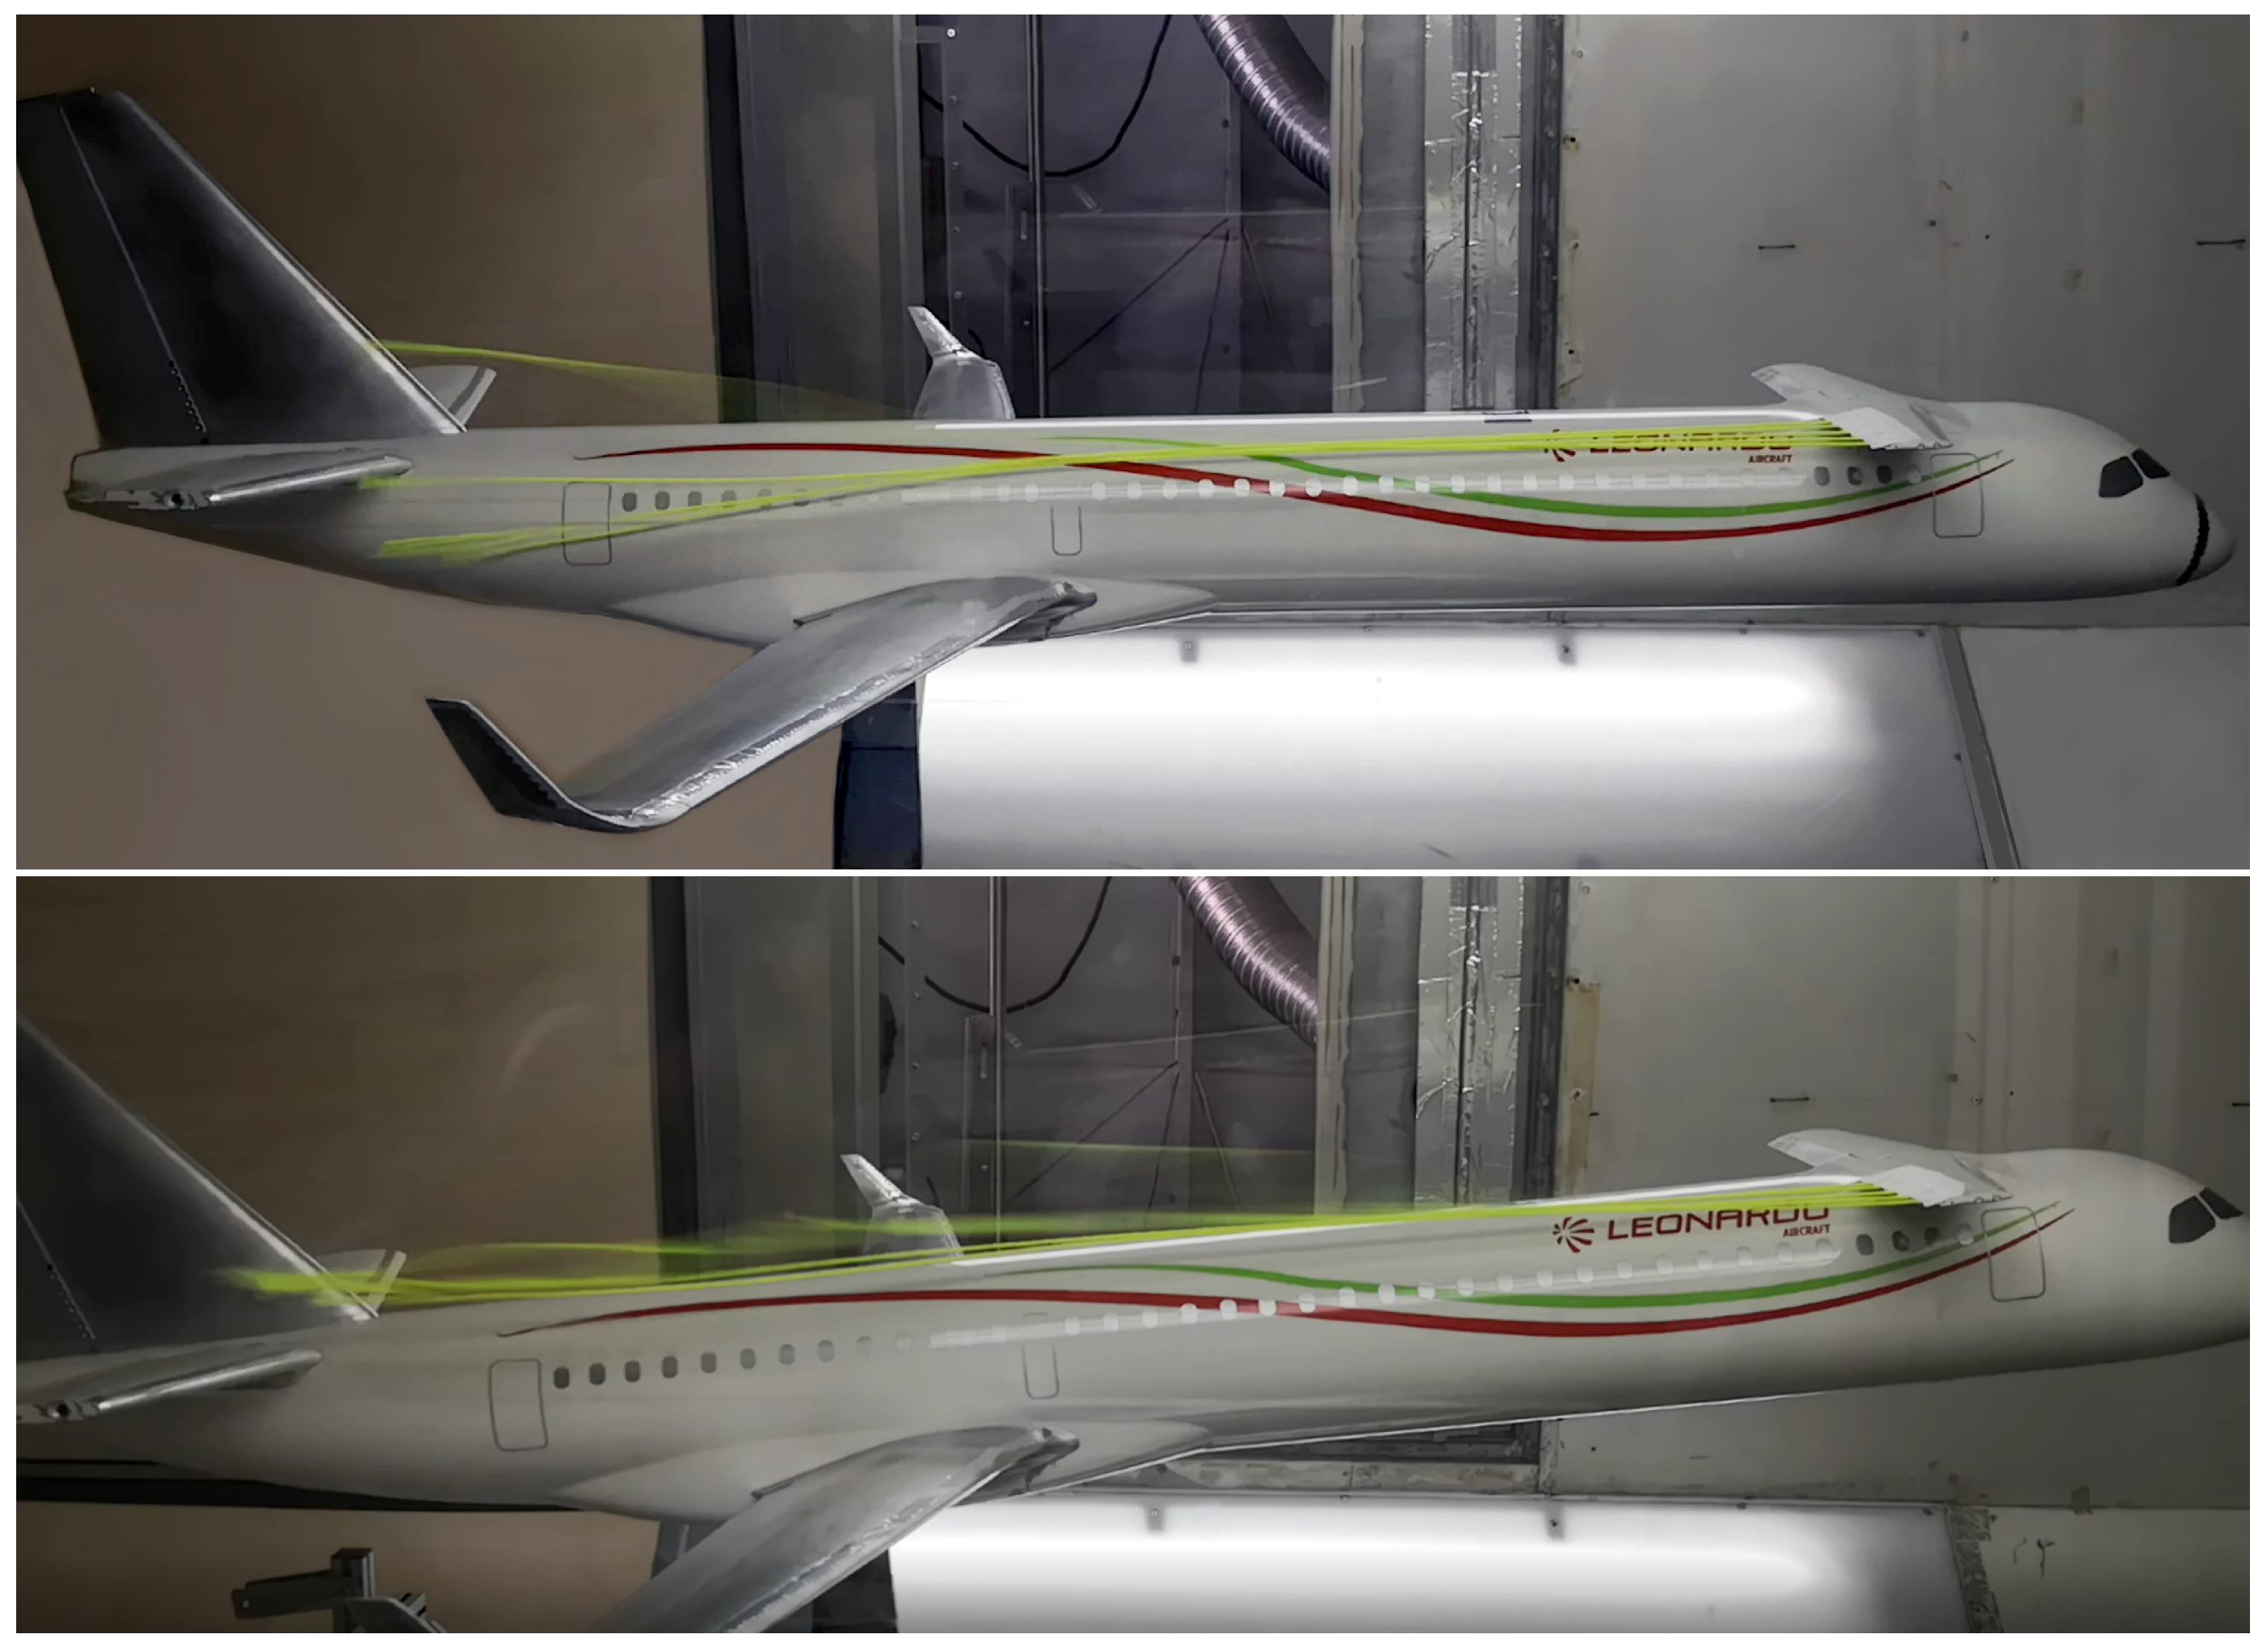
In Figure 14, experimental and numerical flow visualization has been used to visualize the wake during a wind tunnel test.These tests show how canard wake crosses the horizontal tail plane affecting the aircraft longitudinal stability. The third lifting surface leads to a non-linear behavior in the pitching moment coefficient curve, as in Figure 13.

4.3. Directional Tests

This section is devoted to the evaluation of the aerodynamic interference effects on the directional stability of this innovative aircraft configuration. The objective is the evaluation of the interference effects of the canard on the fuselage and empennage. To address this objective, the experimental tests have been carried out on different components’ combinations, from the isolated fuselage to the complete aircraft. Table 8 reports the sideslip stability derivative C N β for the configurations investigated at two angles of attack. In the body reference system, C N β > 0 means that the aircraft is directionally stable. The sideslip derivative is evaluated at β = 0 ° , unless otherwise stated. Again, the reference point for the calculation of the moments is the leading edge of the mean aerodynamic chord, which is a plausible location of the center of gravity for this rear-engines aircraft configuration.
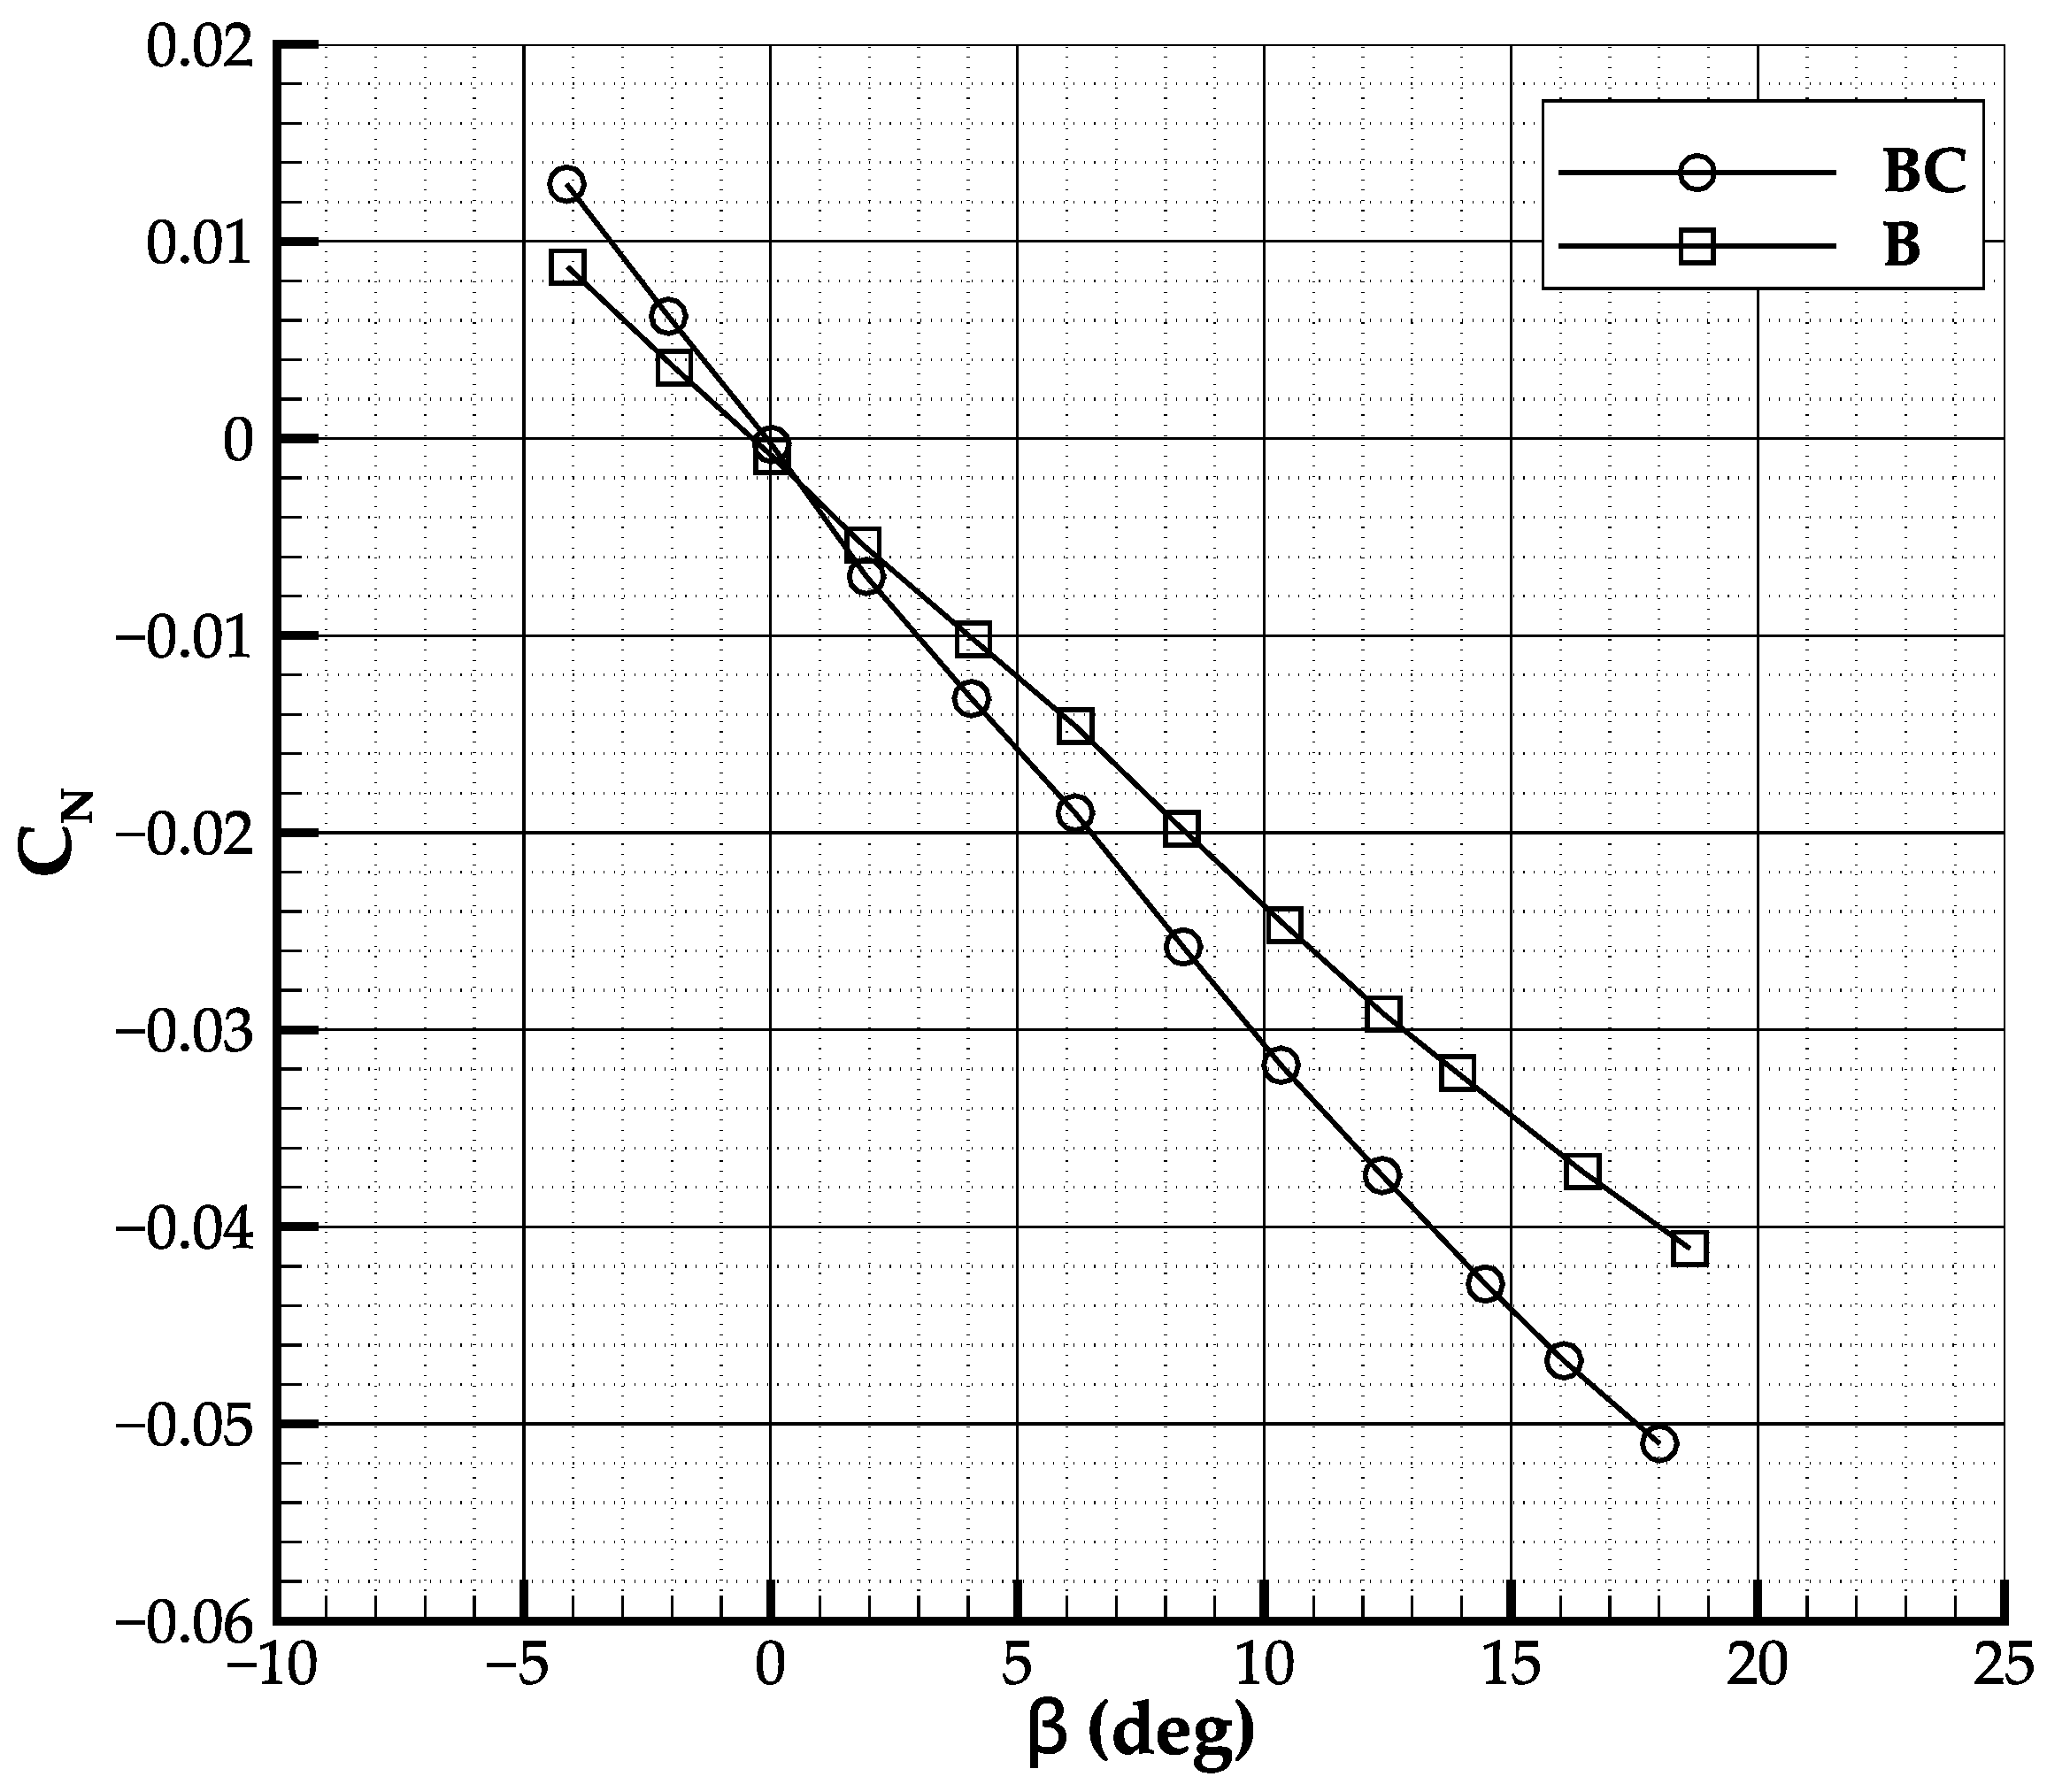
In Figure 15, the yawing moment coefficient of the isolated body (B) is compared to that with the canard installed (BC). The canard increases the fuselage instability by about 30%, as can be observed from the change in C N β from the first to the second row of Table 8. This is due to the wing-body sidewash [15,34]. For a high-wing configuration, the wing surface creates a high-pressure region on the windward side of the fuselage. In this case, this effect is magnified because of the longitudinal position of the canard that is placed quite forward the chosen reference point. A minor influence is due to the horizontal tail, which leads to an increment of about 5% of the overall aircraft C N β . In fact, the value increases from the third to the fourth row of Table 8.
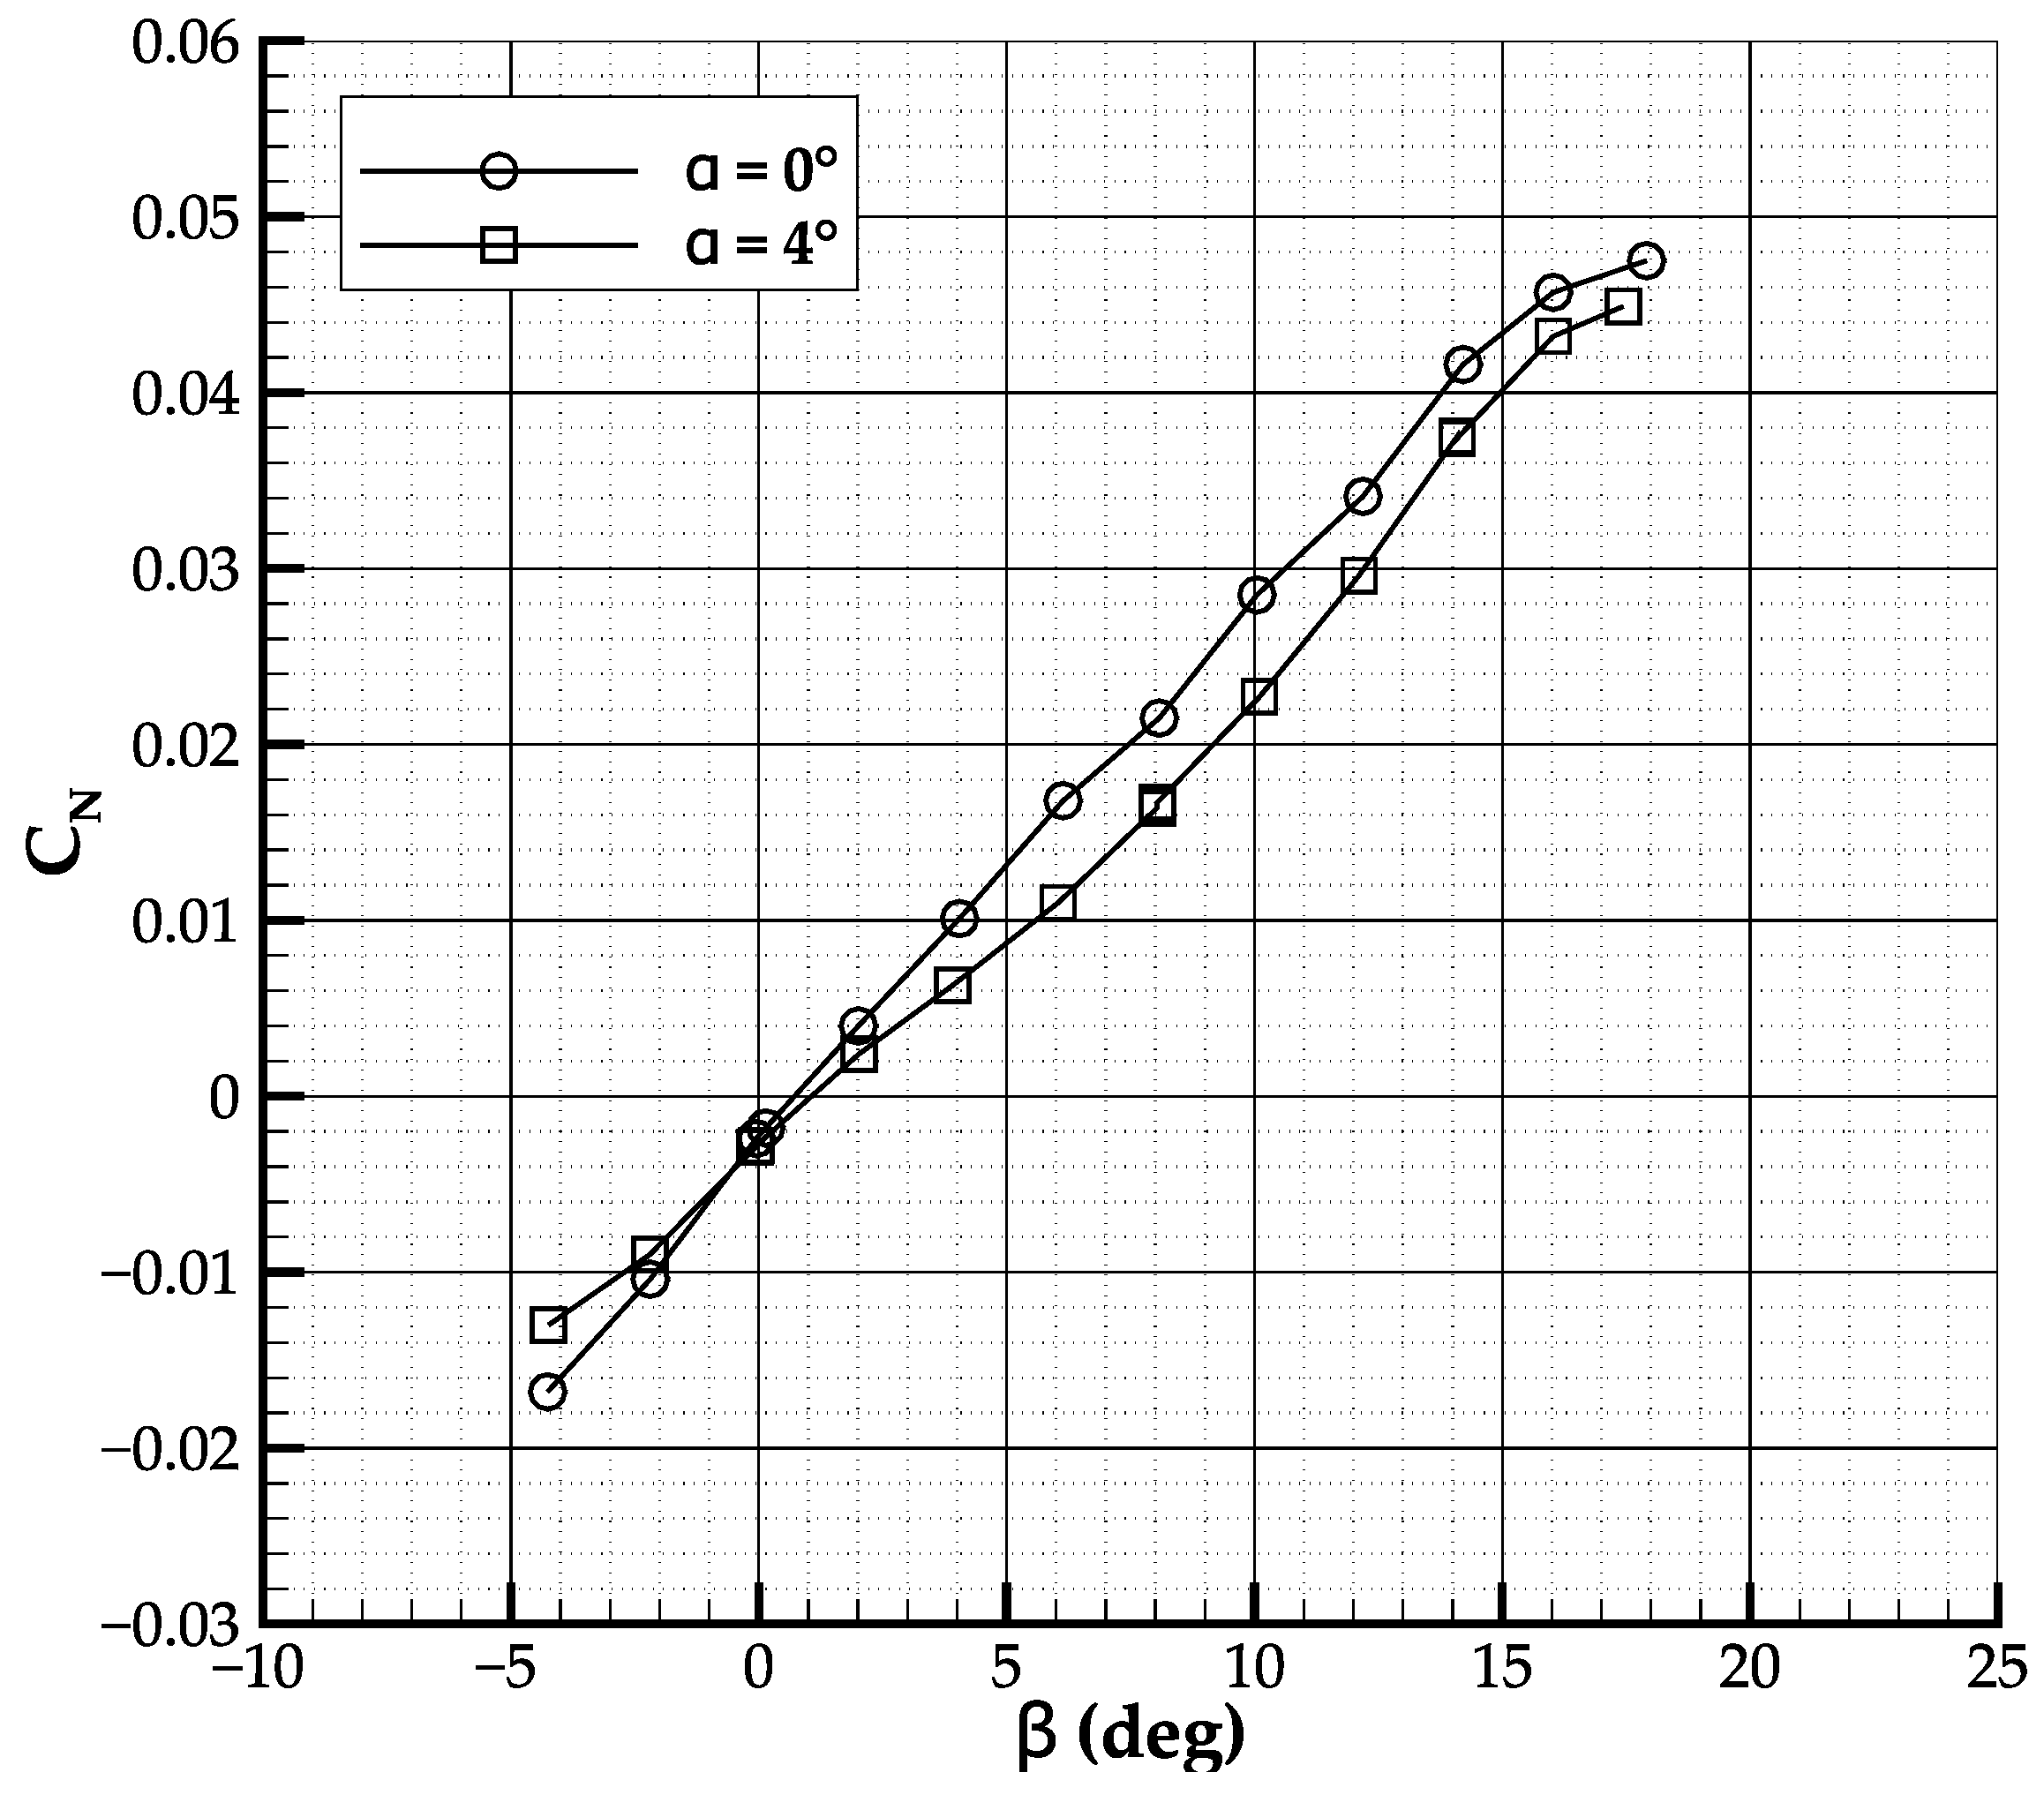
The effects of the angle of attack are illustrated in Figure 16, where the yawing moment coefficient of the complete aircraft configuration without canard (WBHV) at α = 0 ° and α = 4 ° are compared. The stabilizing contribution of the vertical tail decreases because the sidewash changes with the angle of attack. Since the sidewash also depends on the vertical distance between the wing and the vertical tail [35], its effects are even larger in the case of the investigated three-lifting surface aircraft. By looking again at Table 8, the reduction in directional stability is significant, achieving a value of 21% for the WBHV at α = 4 .
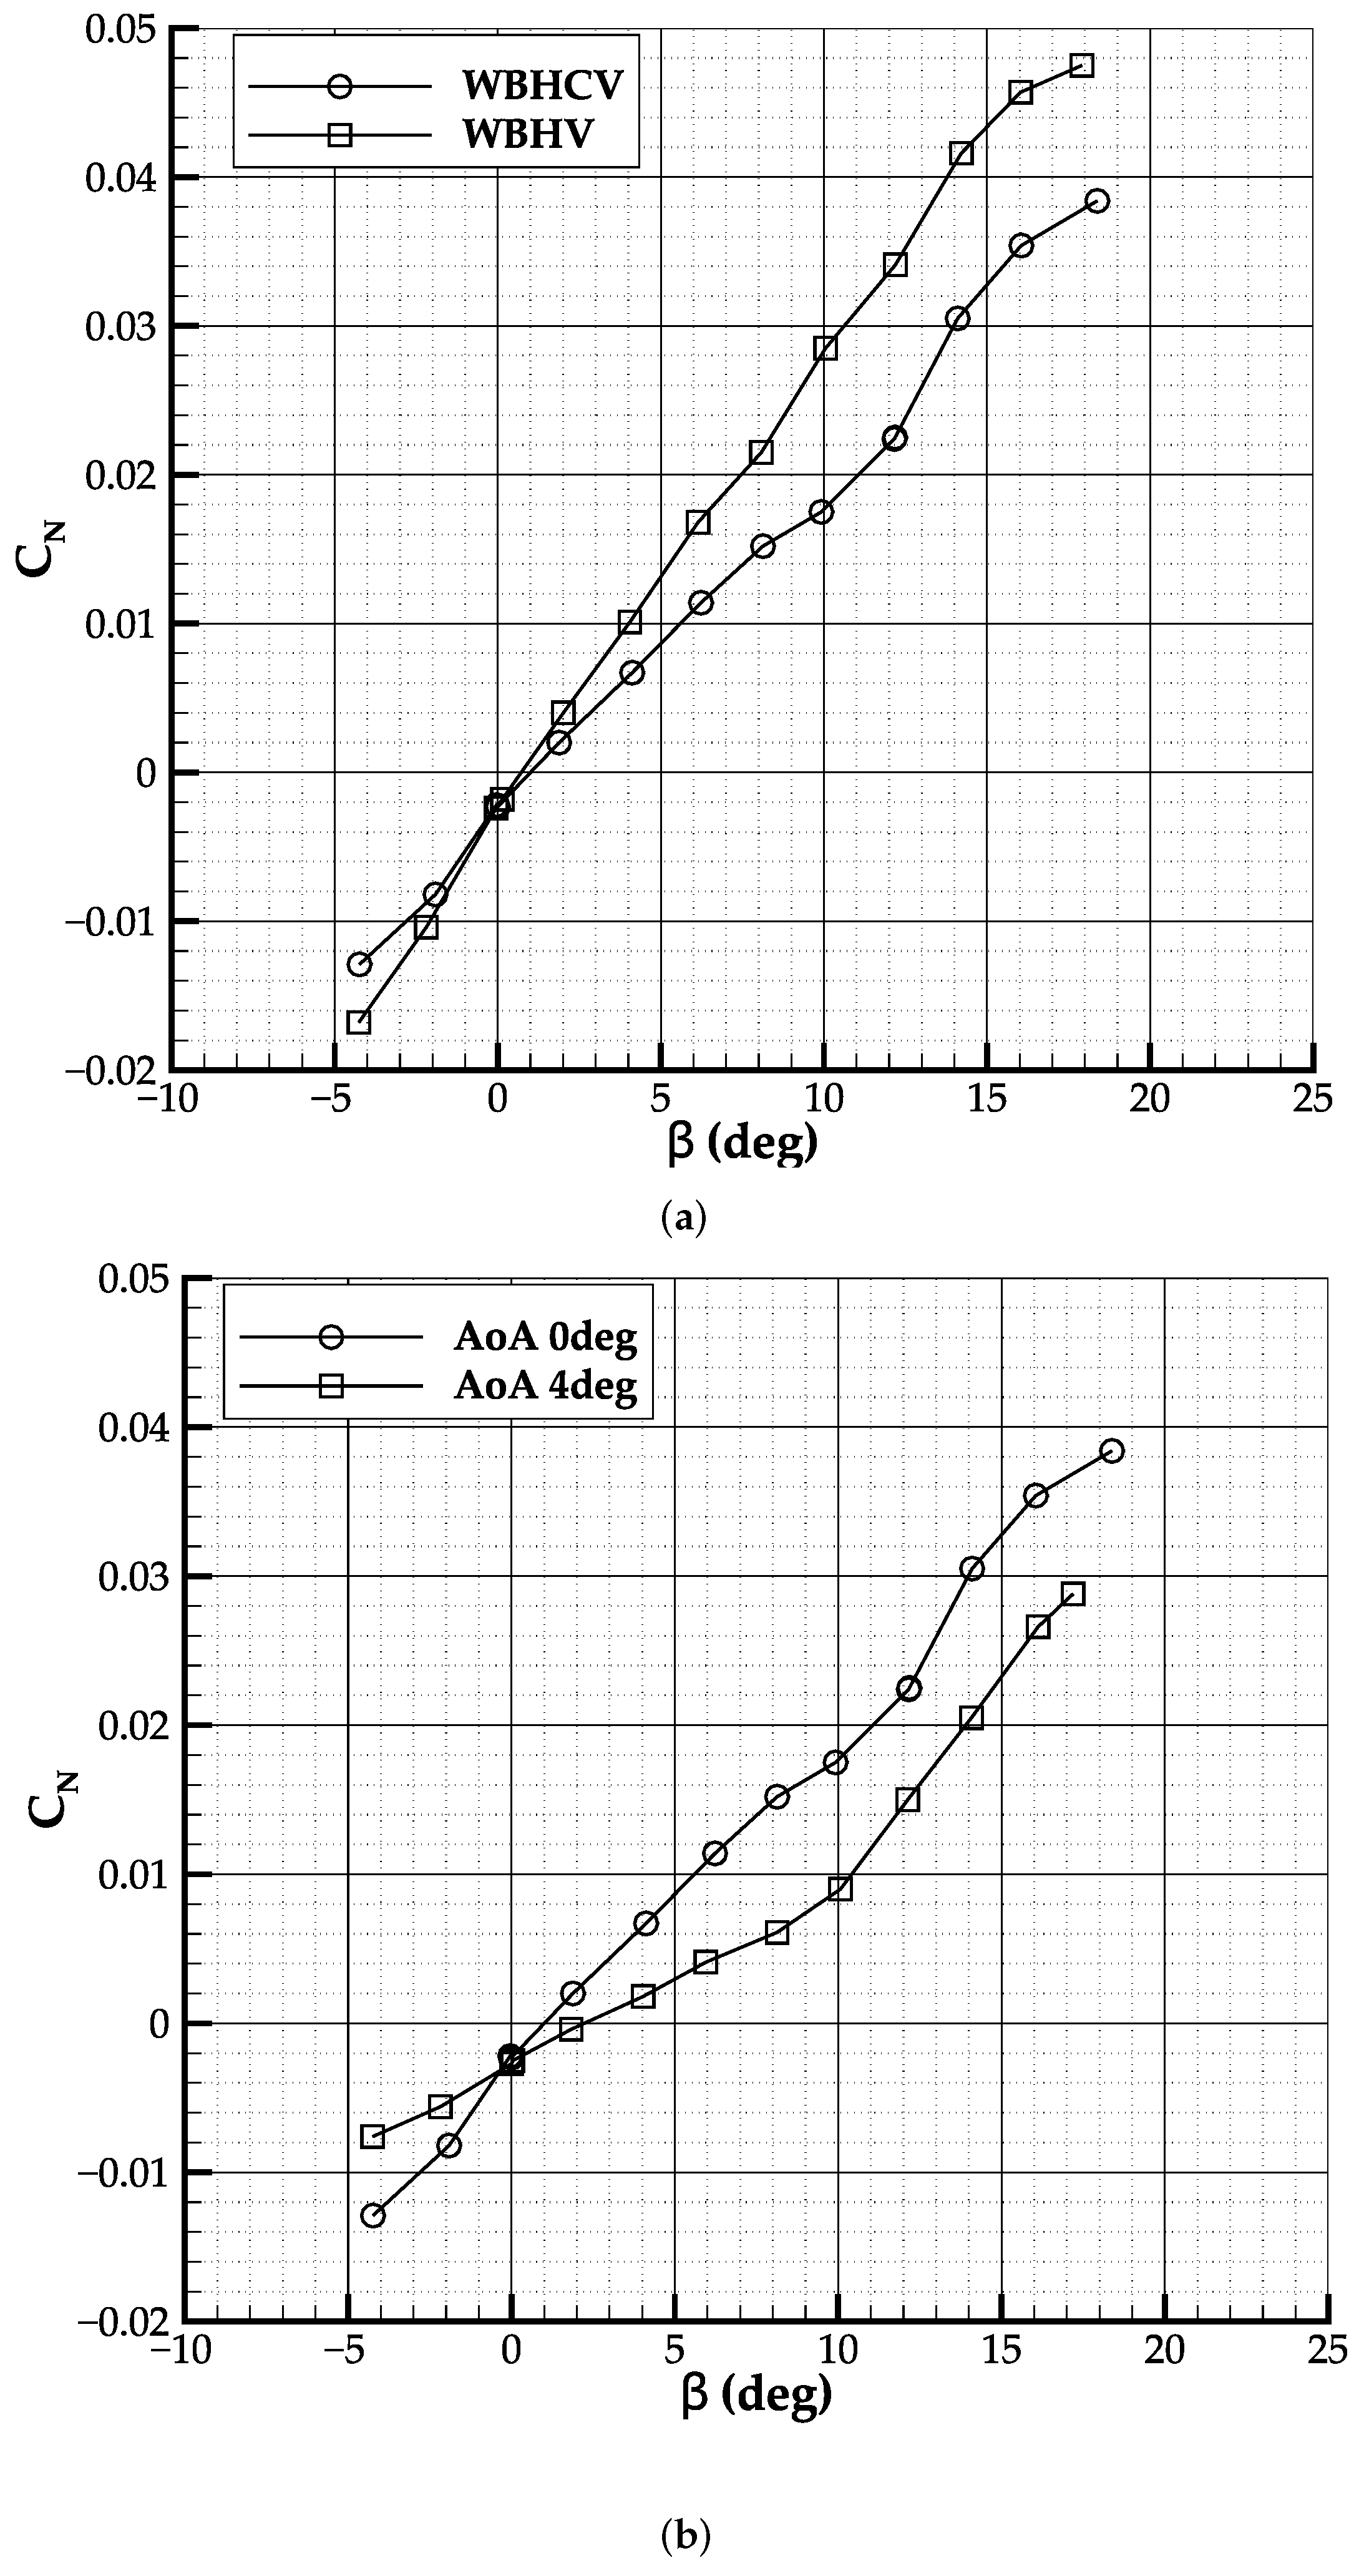
So far, the effect of the canard on the isolated fuselage in sideslip and the effect of the angle of attack on the complete aircraft without canard have been discussed. The effect of the canard on the complete aircraft in sideslip and the effect of the angle of attack on this configuration are described as follows. As it is shown in Figure 17a and reported in Table 8, the canard reduces the aircraft directional stability derivative by 28% at zero angle of attack, as can be observed from the change in C N β from the fourth to the last row of Table 8. The combined effects of incidence angle and canard downwash and sidewash lead to a large reduction of the directional stability, with a reduction by 52% at α = 4 ° with respect to the complete aircraft without canard at zero angle of attack. This strong effect is introduced by the vortex system that is impinging on the vertical empennage. The change in yawing moment coefficient of the complete aircraft with canard (WBHCV) with the angle of attack is apparent in Figure 17b. Notwithstanding the vertical tailplane re-design, the detrimental effect of the canard on directional stability could not be canceled.

5. Conclusions

This paper dealt with the experimental assessment of the aerodynamic characteristics of an innovative high-capacity turboprop aircraft, a three-lifting surfaces configuration with rear-engines installation. It is believed that such innovative configuration—capable of transporting 130 passengers—could mitigate the pollutant emissions impact of the aircraft, remaining competitive with respect to short- and medium-haul regional jets. Indeed, both aircraft manufacturers and airlines foresee that the 100–149 seat aircraft segment will experience major fleet transformation with the entry-into-service of new clean-sheet aircraft designs powered by new-technology engines, especially with regard to the Asian and North-American markets.
Because of the inherent complexity of the three-lifting surfaces configuration, some aerodynamic interference issues were not anticipated in the preliminary design phase and were highlighted only during the first wind tunnel test campaign. In fact, the first test article—output of the design loop 1 process—provided unsatisfactory longitudinal and directional stability characteristics. After re-designing some of the lifting surfaces, a second test campaign was performed on the updated model. On this last configuration—output of the design loop 2 process—the SSM of the complete aircraft is 7.8% MAC, ensuring that the aircraft is longitudinally stable, even if the canard still exhibits a detrimental effect on both longitudinal and directional stability.
Once the static stability issues were solved, the focus of the tests moved on the above mentioned aerodynamic interference effects. In particular, most of the experimental investigations on the updated model were performed with the aim to detail how the combined downwash coming from both canard and wing, together with their wakes, affect the tail aerodynamics and consequently the aircraft static stability. Several configurations were tested in the wind tunnel to investigate the mutual effects among the aircraft components (wing, fuselage, tail, and canard) in both longitudinal and directional motions.
While tests on configurations without canard showed a larger SSM, no effective benefit could be inferred. In fact, if the innovative large turboprop were to be designed with a conventional configuration—wing and aft tail—it would have a completely different layout: the wing would have a larger area, and it would be placed more forward, while the horizontal tail would be larger to face a completely different center of gravity excursion range. Therefore, the curves relative to the canard-off configurations presented in the paper represent only a partial result that is useful to break down the contributions to downwash. Furthermore, tests confirmed that updated design achieves a higher maximum lift coefficient, splitting the lift force among the three lifting surfaces.
As concerns directional stability, wind tunnel tests have highlighted the detrimental effects of the canard on the vertical tailplane capability of generating sideforce. The canard tip vortex moves across the windward and the leeward side of the empennage, introducing non-linearity to the directional response of the aircraft, even at moderate angles of sideslip. The re-design of the vertical tailplane has mitigated but not canceled this effect.
In conclusion, this paper has provided a deep insight into the aerodynamic interference effects and stability derivatives on a three-lifting surfaces regional-transport aircraft, which is scarcely found in literature. The initial wind tunnel tests have highlighted insufficient stability margins for the aircraft. Despite all the aerodynamic issues and design constraints, the authors managed to solve the most critical problems, re-designed some of the aerodynamic surfaces, and proved the final aircraft to be statically stable.
Designers and aerodynamicists may exploit the high-fidelity data from this paper to check their analyses on a similar configuration, which are scarcely found in the literature, at least regarding trends on aerodynamic coefficients and stability derivatives.
Author Contributions

Conceptualisation, V.C. and S.C.; methodology, V.C. and S.C.; experimental setup, D.C., S.C. and V.C.; tests, V.C. and S.C.; resources, F.N.; data curation, V.C. and S.C.; writing—original draft preparation, V.C., S.C. and D.C.; writing and editing, V.C. and S.C.; review V.C., S.C. and D.C.; visualization, V.C. and S.C.; supervision, F.N. All authors have read and agreed to the published version of the manuscript.

Funding

The IRON project has received funding from the Clean Sky 2 Joint Undertaking under the European Union Horizon 2020 research and innovation program under Grant Agreement no. 699715.

Institutional Review Board Statement

Not applicable.

Informed Consent Statement

Not applicable.

Data Availability Statement

Not applicable.

Acknowledgments

The authors are grateful to the partners of the IRON consortium for their contributions and feedback.

Conflicts of Interest

The authors declare no conflict of interest. The funders had no role in the design of the study; in the collection, analyses, or interpretation of data; in the writing of the manuscript; or in the decision to publish the results.

Abbreviations

The following abbreviations and symbols are used in this manuscript:
Bisolated Body configuration
BCBody and Canard configuration
CADComputer-Aided Design
CGCenter of Gravity
IRONInnovative turbopROp configuratioN
MACMean Aerodynamic Chord
SDStandard Deviation
SSMStatic Stability Margin
WTTWind Tunnel Test
WBWing, and Body configuration
WBVWing, Body, and Vertical tail configuration
WBHVWing, Body, Horizontal and Vertical tailplanes configuration
WBHCVWing, Body, Horizontal tailplane, Canard and Vertical tailplane configuration
α Angle of attack
β Angle of sideslip
ε Angle of downwash
bWing span
C L Lift coefficient
C D Drag coefficient
C M Pitching moment coefficient
C N Yawing moment coefficient
C ( · ) α Derivative of the aerodynamic coefficient with respect to α
C ( · ) β Derivative of the aerodynamic coefficient with respect to β
C ( · ) C L Derivative of the aerodynamic coefficient with respect to C L
DDrag force
LLift force
MPitching moment
NYawing moment
N 0 Neutral point
q Free-stream dynamic pressure
R e Reynolds number
SLifting surface planform area
VWind tunnel flow speed
x ¯ CG Longitudinal position of the CG in fraction of MAC

References

  1. ICAO. Effects of Novel Coronavirus (COVID-19) on Civil Aviation: Economic Impact Analysis. Available online: https://www.icao.int/sustainability/Pages/Economic-Impacts-of-COVID-19.aspx (accessed on 15 January 2022).
  2. BOEING. Commercial Market Outlook 2021–2040. Available online: https://www.boeing.com/commercial/market/commercial-market-outlook/ (accessed on 15 January 2022).
  3. AIRBUS. Airbus Global Market Forecast 2021–2040. Available online: https://www.airbus.com/en/products-services/commercial-aircraft/market/global-market-forecast (accessed on 15 January 2022).
  4. FAA. FAA Aerospace Forecast 2021–2041. Available online: https://www.faa.gov/data_research/aviation/aerospace_forecasts/ (accessed on 15 January 2022).
  5. ATR. Turboprop Market Forecast 2018–2037. Available online: https://perma.cc/X4VZ-JKW8 (accessed on 15 January 2022).
  6. Embraer SA. Embraer Market Outlook 2021. Available online: https://www.embraermarketoutlook2021.com/ (accessed on 15 January 2022).
  7. Babikian, R.; Lukachko, S.P.; Waitz, I.A. The historical fuel efficiency characteristics of regional aircraft from technological, operational, and cost perspectives. J. Air Transp. Manag. 2002, 8, 389–400. [Google Scholar] [CrossRef] [Green Version]
  8. Nicolosi, F.; Corcione, S.; Trifari, V.; Della Vecchia, P.; De Marco, A. Design Guidelines for High Capacity Innovative Regional Turboprop Aircraft. In Proceedings of the AIAA Scitech 2019 Forum, San Diego, CA, USA, 7–11 January 2019. [Google Scholar] [CrossRef]
  9. Nicolosi, F.; Corcione, S.; Trifari, V.; Cusati, V.; Ruocco, M.; Della Vecchia, P. Performance evaluation and DOC estimation of an innovative turboprop configuration. In Proceedings of the 2018 Aviation Technology, Integration, and Operations Conference, Atlanta, GA, USA, 25–29 June 2018. [Google Scholar] [CrossRef]
  10. Nicolosi, F.; Corcione, S.; Della Vecchia, P.; Trifari, V.; Ruocco, M. Aerodynamic design and analysis of an innovative regional turboprop configuration. In Proceedings of the 31st Congress of the International Council of the Aeronautical Sciences, ICAS 2018, Belo Horizonte, Brazil, 9–14 September 2018. [Google Scholar]
  11. Nicolosi, F.; Corcione, S.; Trifari, P.; De Marco, A. Design and Optimization of a Large Turboprop Aircraft. Aerospace 2021, 5, 132. [Google Scholar] [CrossRef]
  12. Roskam, J. Airplane Flight Dynamics and Automatic Flight Controls; DARcorporation: Lawrence, KS, USA, 2001; Volume s11-VI. [Google Scholar] [CrossRef]
  13. Silverstein, A. Downwash and Wake behind Plain and Flapped Wings—NACA Technical Report 651; Technical Report; National Advisory Committee for Aeronautics: Washington, DC, USA, 1939.
  14. Silverstein, A.; Katzoff, S. Report No. 648, Design charts for predicting downwash angles and wake characteritics behind plain and flapped wings. J. Frankl. Inst. 1939, 227, 581. [Google Scholar] [CrossRef]
  15. Finck, R. USAF Stability and Control DATCOM; Technical Report; Defense Technical Information Center, 1978. Available online: https://apps.dtic.mil/sti/citations/ADB072483 (accessed on 15 January 2022).
  16. Slingerland, R. Prediction of a Tail Downwash, Ground Effect and Minimum Unstick Speed of Jet Transport Aircraft; University of Delft, NLD, 2005; Available online: http://resolver.tudelft.nl/uuid:6f647fd6-7cda-4351-b9e2-701b560055e1 (accessed on 15 January 2022).
  17. Phillips, J.D. Approximate Neutral Point of a Subsonic Canard Aircraft; NASA TM-86694; National Aeronautics and Space Administration, 1985. Available online: https://ntrs.nasa.gov/citations/19850016894 (accessed on 15 January 2022).
  18. Phillips, J.D. Downwash in the Plane of Symmetry of an Elliptically Loaded Wing; NASA Technical Paper; 1985. Available online: https://ntrs.nasa.gov/citations/19850007384 (accessed on 15 January 2022).
  19. Levy, D. Prediction of Average Downwash Gradient for Canard Configurations. In Proceedings of the 30th Aerospace Sciences Meeting and Exhibit, Reno, NV, USA, 6–9 January 1992. [Google Scholar] [CrossRef] [Green Version]
  20. Goodrich, K.; Sliwa, S.; Lallman, F. A Closed-Form Trim Solution Yielding Minimum Trim Drag for Airplanes with Multiple Longitudinal-Control Effectors; Technical Report; NASA, Langley Research Center Hampton: Hampton, VA, USA, 1989. Available online: https://ntrs.nasa.gov/citations/19890014097 (accessed on 15 January 2022).
  21. Cacciola, S.; Arnoldi, R.C. Three-Surface Model with Redundant Longitudinal Control: Modeling, Trim Optimization and Control in a Preliminary Design Perspective. Aerospace 2021, 8, 139. [Google Scholar] [CrossRef]
  22. Goetzendorf-Grabowski, T.; Antoniewski, T. Three surface aircraft (TSA) configuration—Flying qualities evaluation. Aircr. Eng. Aerosp. Technol. 2016, 88, 277–284. [Google Scholar] [CrossRef]
  23. Strohmeyer, D.; Seubert, R.; Braunschweig, D.L.R.; Heinze, W.; Io, J. Three Surface Aircraft—A Concept for Future Transport Aircraft. In Proceedings of the 38th AIAA Aerospace Sciences Meeting and Exhibit, Reno, NV, USA, 10–13 January 2000. [Google Scholar] [CrossRef]
  24. McGeer, T.; Kroo, I. A fundamental comparison of canard and conventional configurations. J. Aircr. 1983, 20, 983–992. [Google Scholar] [CrossRef]
  25. Chambers, R.; Yip, L.P.; Moul, T.M. Wind-Tunnel Investigation of an Advanced General Aviation Canard Configuration; TM-85760; NASA, 1984. Available online: https://ntrs.nasa.gov/citations/19840013471 (accessed on 15 January 2022).
  26. Ostowari, C.; Naik, D. Experimental study of three-lifting surface configuration. J. Aircr. 1988, 25, 106–112. [Google Scholar] [CrossRef]
  27. Agnew, J.W.; Lyerla, G.W.; Grafton, S.B. Linear and nonlinear aerodynamics of three-surface aircraft concepts. J. Aircr. 1981, 18, 956–962. [Google Scholar] [CrossRef]
  28. Barlow, J.B.; Rae, W.H.; Pope, A. Low-Speed Wind Tunnel Testing, 3rd ed.; Wiley: New York, NY, USA, 1999. [Google Scholar]
  29. Torenbeek, E. Synthesis of Subsonic Airplane Design: An Introduction to the Preliminary Design, of Subsonic General Aviation and Transport Aircraft, with Emphasis on Layout, Aerodynamic Design, Propulsion, and Performance; Delft University Press: Delft, The Netherlands, 1982. [Google Scholar]
  30. Courtland, W.J.D.; Perkins, D.; Hage, R.E. Airplane Performance, Stability and Control. J. R. Aeronaut. Soc. 1950, 54, 607–608. [Google Scholar]
  31. Goldsmith, I.M. A Study to Define the Research and Technology Requirements for Advanced Turbo/Propfan Transport Aircraft; Technical Report; NASA, Ames Research Center: Mountain View, CA, USA, 2017. Available online: https://ntrs.nasa.gov/citations/19820010328 (accessed on 15 January 2022).
  32. Ciliberti, D.; Della Vecchia, P.; Nicolosi, F.; De Marco, A. Aircraft directional stability and vertical tail design: A review of semi-empirical methods. Prog. Aerosp. Sci. 2017, 95, 140–172. [Google Scholar] [CrossRef]
  33. Corcione, S.; Nicolosi, F.; Della Vecchia, P.; Ciliberti, D.; Cusati, V. High Lift Aerodynamic characteristics of a Three Lifting Surfaces Turboprop Aircraft. In Proceedings of the AIAA Aviation 2019 Forum, Dallas, TX, USA, 17–21 June 2019. [Google Scholar] [CrossRef]
  34. Roskam, J.H. Methods for Estimating Stability and Control Derivatives of Conventional Subsonic Airplanes; Roskam Aviation and Engineering Corporation: Lawrence, KS, USA, 1971. [Google Scholar]
  35. Roskam, J. Airplane Design VI: Preliminary Calculation of Aerodynamic, Thrust and Power Characteristics; Number v. 1 in Airplane Design/by Jan. Roskam, Design, Analysis and Research Corporation (DARcorporation); DARcorporation: Lawrence, Kansas, 1985. [Google Scholar]
Figure 1. Scaled aircraft model at the end of design loop 1. Units in meters.
Aerospace 09 00133 g001
Figure 2. Scaled aircraft model at the end of design loop 2. Units in meters.
Aerospace 09 00133 g002
Figure 3. Main subsonic wind tunnel of the DII. Units in meters.
Aerospace 09 00133 g003
Figure 4. IRON three-lifting surface loading diagram. The vertical lines represent the imposed constraints to the CG excursion to limit the horizontal tailplane size [8].
Aerospace 09 00133 g004
Figure 5. Change in canard position and horizontal tail dihedral. (a) Design Loop 1 front view; (b) Design Loop 2 front view.
Aerospace 09 00133 g005
Figure 6. Comparison of the pitching moment coefficient curves for the two design loops. Reference point at x ¯ CG = 0 , V = 35   m / s , R e = 315,000.
Aerospace 09 00133 g006
Figure 7. Canard wake impingement on the vertical tailplane: visualization test through wool yarns. V = 35   m / s , R e = 315,000. (a) Canard tip vortex hitting upwind the vertical tail at β = 6 ; (b) canard tip vortex hitting downwind the vertical tail at β = 12 .
Aerospace 09 00133 g007
Figure 8. Re-design of the vertical tailplane. (a) Design Loop 1 vertical tail; (b) Design Loop 2 vertical tail.
Aerospace 09 00133 g008
Figure 9. Comparison of the yawing moment coefficient curves for the two design loop. Reference point at x ¯ CG = 0 , V = 35   m / s , R e = 315,000.
Aerospace 09 00133 g009
Figure 10. Comparison of the lift coefficient curves for the two design loop. V = 35   m / s , R e = 315,000.
Aerospace 09 00133 g010
Figure 11. Comparison of the drag polar curves for the two design loop. V = 35   m / s , R e = 315,000.
Aerospace 09 00133 g011
Figure 12. Some of aircraft configurations tested in the wind tunnel. (a) BCV configuration; (b) WB configuration; (c) WBHV configuration; and (d) WBHCV configuration.
Aerospace 09 00133 g012
Figure 13. Wind tunnel results. Reference point at x ¯ CG = 0 , V = 35   m / s , R e = 315,000. (a) Effect of the canard on the complete aircraft lift curve; (b) comparison of longitudinal stability curves for configuration with and without canard.
Aerospace 09 00133 g013
Figure 14. Canard wake impingement on the horizontal tailplane: visualization test through wool yarns. V = 35   m / s , R e = 315,000 at α = 4 ° and 8°.
Aerospace 09 00133 g014
Figure 15. Effect of the canard on the yawing moment coefficient of the fuselage, experimental results. Reference point at x ¯ CG = 0 , V = 35   m / s , R e = 315,000.
Aerospace 09 00133 g015
Figure 16. Effect of the angle of attack on the yawing moment coefficient for the WBHV configuration. Reference point at x ¯ CG = 0 , V = 35   m / s , R e = 315,000.
Aerospace 09 00133 g016
Figure 17. Effect of the canard and angle of attack on the yawing moment coefficient. Reference point at x ¯ CG = 0 , V = 35   m / s , R e = 315,000. (a) Effect of the canard at α = 0 ° . (b) Effect of the angle of attack on the WBHVC configuration.
Aerospace 09 00133 g017
Table 1. Wind tunnel of the DII, main characteristics.
Test section dimensions 2.0   m × 1.4   m
Maximum available wind speed 50   m / s
Turbulence Intensity0.10%
Maximum power 150   k W
Table 2. Strain gage balances characteristics.
Force/MomentMax. ErrorFull-Scale Value
Lift 0.03 kgf (0.06%)80 kgf
Drag 0.02 kgf (0.10%)20 kgf
Pitching moment 0.02 kgf  m (0.10%)20 kgf  m
Side force 0.02 kgf (0.10%)20 kgf
Yawing moment 0.02 kgf  m (0.10%)20 kgf  m
Rolling moment 0.02 kgf  m (0.10%)20 kgf  m
Table 3. Uncertainty in measurements of lift, drag, and pitching moment coefficients. WB configuration. Test conditions: V = 35   m / s , R e = 315,000 at β = 0 ° .
α C L C D C M
± 0 . 1 MeanSDMeanSDMeanSD
0.10 0.4571.21%0.05550.24% 0.2079 0.58%
0.810.5411.14%0.05800.29% 0.2052 0.62%
3.880.8030.83%0.07030.35% 0.1857 0.53%
5.910.9520.59%0.08170.34% 0.1636 0.50%
Table 4. Uncertainty in measurements of yawing moment coefficient. WBHVC configuration. Test conditions: V = 35   m / s , R e = 315,000 at α = 0 ° .
β C N
± 0 . 1 MeanSD
0.0−0.00230.05%
4.10.00670.08%
6.20.01140.08%
8.10.01520.08%
9.90.01750.10%
Table 5. Summary of the main geometric parameters.
LOOP 1LOOP 2
Wing
Surface (m2)0.1580.158
Aspect Ratio12.812.8
MAC (m)0.1230.123
x LE position (m)0.8200.820
z LE position (m)−0.052−0.052
incidence angle [root, kink, tip] (deg)[+1, +1, −1][+3, +1, −3]
Fuselage
Length (m)1.5251.525
Maximum diameter (m)0.1410.141
Canard
Surface (m2)0.01900.0190
Aspect Ratio6.876.87
MAC (m)0.0640.064
x LE position (m)0.2240.224
z LE position (m)0.1410.152
incidence angle (deg)02
Horizontal tailplane
Surface (m2)0.0620.064
Aspect Ratio4.44.5
MAC (m)0.1200.120
x LE position (m)1.2611.261
z LE position (m)0.0400.040
incidence angle (deg)−24
Vertical tailplane
Surface (m2)0.0410.044
Aspect Ratio1.371.37
MAC (m)0.1720.193
Taper Ratio0.6840.337
x LE position (m)1.2551.235
z LE position (m)0.0580.058
Table 6. Aerodynamics summary table.
LOOP 1LOOP 2
C L α ( deg 1 )0.1020.107
C L m a x 1.381.54
C M C L 0.011 (unstable)−0.16
Maximum efficiency (L/D) at α 6 ° 1112.8
C N β ( deg 1 )0.00160.0023
Table 7. Comparison of downwash gradient estimations.
CanardWingWing-Canard
on Tailplaneon Tailplaneon Tailplane
d ε / d α 0.4550.2130.179
Table 8. Aircraft configurations and directional stability derivatives. Reference point at x ¯ CG = 0 , V = 35   m / s , R e = 315,000.
C N β ( α = 0 ) C N β ( α = 4 )
B−0.0022n.a.
BC−0.0029n.a.
WBV0.00280.0023
WBHV0.00340.0027
WBHCV0.00270.0013
Publisher’s Note: MDPI stays neutral with regard to jurisdictional claims in published maps and institutional affiliations.