Abstract
The initiating explosive shock environment of an aerospace mission has the characteristics of instantaneity, high amplitude and a wide frequency domain. An improved method based on the acceleration frequency response function (FRF) and virtual mode synthesis method (VMSS) is proposed to predict the pyroshock response of a spacecraft structure in a wide frequency domain. Firstly, the statistical energy analysis (SEA) model of the spacecraft structure was established, and the FRF and modal density of the model were obtained. Then, the paper explains how, due to the small number of modes in the low-frequency band, the calculation results of the SEA method in the low-frequency band were not accurate enough. The FRF of the SEA model in the low-frequency band was modified by an FRF test of the structure. Finally, the shock response spectrum (SRS) was obtained based on the VMSS and the modified FRF. A shock experiment on the spacecraft structure was conducted by using the shock experiment system, which is based on a light-gas gun. The accurate shock force function and acceleration response results were obtained. The numerical results based on the improved method are in line with those in the experiment. This verifies that the novel method can better grasp the response characteristics of the structure in the broadband domain. The novel method effectively improves the response prediction accuracy of the SEA model in the relatively low-frequency band. While ensuring the computational efficiency, more accurate shock response results in a wide frequency domain were obtained. The novel method presented in this paper provides support of numerical analysis for pyroshock response prediction of spacecraft structure in a wide frequency domain.
1. Introduction
A pyrotechnic separation device is commonly used in the launch, on-orbit and return of spacecrafts. This device is used to realize the separation function of spacecrafts and rockets, return cabins and propulsion cabins. The pyrotechnic separation device can effectively ensure the stiffness of the connection structure before separation and has many advantages such as high efficiency and high reliability. The separation initiating process will cause a certain mechanical shock environment [1,2,3]. The shock environment has three characteristics. First, the shock signal generally lasts for a short time and attenuates to zero within 20 ms; second, the acceleration response magnitude of the structure exceeds 10,000 g; and third, the response frequency is high, and the energy is distributed in a wide frequency range [4,5]. The shock environment may cause damage to or the failure of spacecraft systems (especially electronic equipment and precision components), and the normal working state of the spacecraft may be damaged. It is necessary to solve the problems caused by pyrotechnic shock through analyzing the response characteristics of structures under the shock environment. In addition, it is very important to predict the shock response of spacecraft structures in wide frequency domain to increase the reliability of space missions.
At present, the prediction methods of pyrotechnic explosive shock response mainly include experimental methods such as the empirical model method and data extrapolation method and numerical methods such as explicit dynamics, transient statistical energy analysis (TSEA) and VMSS.
Most of the test methods rely on a large number of test data accumulated by space missions. According to the analysis on the test data, the magnitude of the shock load and the characteristics of the response of the structure are calculated. The empirical model method [6] can quickly and roughly estimate the SRS of a spacecraft structure according to the type of initiating explosive shock source, the distance of shock transmission and the number of connecting interfaces. The relationship among SRS, shock attenuation and distance of similar shock sources can be found from the existing database. The shock response of a new spacecraft structure can be extrapolated from the measured response of a reference spacecraft. Some scholars use this method for spacecraft design and shock environment prediction [7,8]. The structural path extrapolation method [9] decomposes and classifies the overall satellite structure according to specific rules and determines the transmission path. For any point on the satellite structure, there is a definite transmission path. The substructure path extrapolation method was jointly proposed by the aerospace industries and research institutes in France and other countries and implemented on the SPOT5 satellite platform. Due to the high dependence on test data, the application of the test method has great limitations. As a relatively mature numerical method, the dynamic finite element method is an effective tool to solve low-frequency vibration. Perez et al. [10] used four dynamic finite element methods to carry out modeling, analysis and calculation of suprathermal electrons and protons within the equipment of a spacecraft. Compared with the shock experiment results, the advantages and disadvantages of the four dynamic finite element methods were summarized. CNES of France organized a study on the numerical simulation method of shock wave transmission characteristics of the whole satellite [11]. Ullio et al. [12] used the sinusoidal transfer method of the finite element method to model and analyze the integral system. Limited by the finite element model, they only calculated the response in the frequency band of 100–2000 Hz and compared it with the experimental results. When the finite element method was used to calculate the high-frequency response, the mesh of the model was required to be fine enough, which greatly increased the computational burden and time cost. These shortcomings of the dynamic finite element method limit its application in the field of satellite shock environment prediction. Sun [13] and Fahy [14] used the modified SEA method to predict the vibration varying with time, marking the application of SEA in the transient field. Pinnington and Lednik [15] used the TSEA method to numerically solve the two-degrees-of-freedom dual-oscillator system. They compared the response of the internal energy transfer rate, response peak time, response peak and final attenuation rate with the exact solution. It was found that the calculation results of the two methods were basically consistent, which verifies the effectiveness of the TSEA method. Robinson and Hopkins [16,17] studied the theoretical prediction method of the response of the structure under transient excitation based on the TSEA method and verified it by experiments. Dalton et al. [18] first proposed the VMSS method and clarified the principle and basic formula of VMSS. This method introduced the principle of the high-frequency SEA method into the classical modal analysis format. More detailed contents can be found in references [19,20,21,22]. The VMSS method can not only predict the time-domain response of the structure but also obtain the shock response spectrum of the structure. Cao et al. [23] predicted the shock responses of space optic remote sensors by using VMSS and SEA method. Lee et al. [24] used VMSS method to predict the shock response during the separation of a Leo earth observation satellite from the launch vehicle. The predictions of different analysis models were compared with the experimental data, and prediction by simple model was more accurate. In addition, there are numerical analysis methods such as the hydrocodes method [25], phase information reconstruction method [26] and hybrid method [27,28].
In summary, the traditional methods have limitations in predicting the response of structures under shock loads. For instance, the VMSS ignores the low-mode structure, and the TSEA and phase information reconstruction methods cannot deal with complex structures. The calculation accuracy is also difficult to guarantee. There is an upper frequency limit in the dynamic analysis method, beyond which the accuracy of the calculation results in the high-frequency band is difficult to guarantee. The SEA method is not accurate enough in the low-frequency band. The effectiveness of the traditional empirical model method and data extrapolation method is affected by empirical database, model structure and experimental means. In engineering practice, the effective pyroshock response prediction method of spacecraft structures in a wide frequency domain is lacking. The accuracy of an SEA model that describes structural characteristics is determined by the modal density and frequency response characteristics of each system of this structure. The prediction of structural frequency response based on the SEA model is generally applicable in the high-frequency band, and the accuracy decreases in the low-frequency band. The key point of the shock response prediction method based on the VMSS and SEA models is the accurate FRF of its structure. Considering this background, this paper studies the pyroshock response prediction method of spacecraft structures in a wide frequency domain through experimental and theoretical methods.
In this paper, an improved method based on acceleration FRF and VMSS is proposed, from which the theory of the SEA method and VMSS method is derived. The calculation process of the new method is introduced. Firstly, the SEA model of a spacecraft structure is established, and the FRF and modal density of the model were obtained. Then, the paper describes how, due to the small number of modes in the low-frequency band, the calculation results of the SEA method in the low-frequency band were not accurate enough. The FRF of SEA model in the low-frequency band is modified by the FRF test of the structure. Finally, the SRS was obtained based on the VMSS and the modified FRF. A shock experiment of the spacecraft structure was conducted, and numerical example analysis were carried out. The novel method presented in this paper can better grasp the response characteristics of the structure in the broadband domain and effectively improves the response prediction accuracy of the SEA model in the relatively low-frequency band. It provides the support of numerical analysis for pyroshock response prediction of the spacecraft structure in a wide frequency domain.
2. Derivation of the Basic Theory
This section introduces the research ideas of pyroshock response prediction of a spacecraft structure. The statistical energy analysis method and virtual mode synthesis theory are derived to solve this problem. The calculation flow of the prediction method proposed in this chapter is shown in Figure 1.
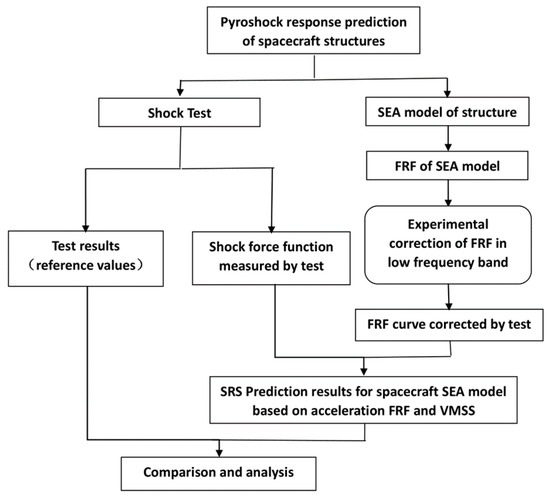
Figure 1.
The frame diagram of pyroshock response prediction of spacecraft structures.
Firstly, the SEA model of a spacecraft structure was established based on the statistical energy analysis theory, and the FRF and modal density of the model were obtained. Then, the paper discusses how, due to the small number of modes in the low-frequency band, the calculation results of the SEA method in the low-frequency band are not accurate enough. The FRF of the SEA model in low-frequency band was modified by the FRF test of the structure. Finally, combined with the shock force function measured in the test, the SRS was obtained based on the VMSS and the modified FRF. The experimental verification and result analysis were carried out.
According to the idea of the SEA, the complex structural coupling dynamic system is decomposed into several coupled subsystems. The SEA model and the power flow balance equation between subsystems were established. Power flows out of a subsystem through dissipation or by transmission to another subsystem, and power flows into a subsystem either by transmission from another subsystem or from an external source of excitation.
According to the concentrated force load, the input power can be calculated. Taking point source input as an example, input power can be expressed as:
where is the force load in the frequency band, and symbolizes the input impedance of an excited system.
When it is a steady state excitation, the power flow balance equation of the subsystem i is:
where is the external power of a subsystem i, is the power loss of the subsystem i, is the power of subsystem i flow to subsystem j. When the subsystem is consistent with the basic assumption of statistical energy that the excitation is unrelated and the weak coupling is conservative, the power flow equilibrium equation of the spacecraft structure composed of N subsystems is expressed as:
where is the central frequency of the frequency band; is the modal density of the subsystem i; is the vibrational energy of the subsystem i; and is the input power of the external subsystem to the subsystem i. The [A] is the damping matrix.
where is the damping loss factor; is the coupling loss factor from subsystem i to subsystem j. The average energy of each system in the frequency band can be obtained by solving the above equations.
The control equation of discrete multi-degree-of-freedom system under external load can be written as:
where M is the mass matrix, C is the damping matrix, and K is the stiffness matrix. is the displacement vector, and is the external force vector.
The decoupled expression of the above equation can be obtained as:
where is the generalized mass matrix, is the generalized damping matrix, and is the generalized stiffness matrix, are the modal vectors, is the truncation number, and is the mode shape coefficient matrix.
The dynamic equation of the system at each degree of freedom can be expressed as:
where , , and are the diagonal terms of the generalized mass, damping, and stiffness matrices of Equation (6); is the vector dimension of ;
Taking the Fourier transform on the two sides of the equation above and the zero initial conditions () are assumed, the expression can be written as:
The displacement FRF can be written as:
where is the FRF of the xth-degree-of-freedom displacement response caused by the external yth load force . is the displacement response for xth degree of freedom. is the exciting force at yth degree of freedom in the frequency domain. is the circular frequency of xth mode. is the critical damping ratio of mth mode.
With the steady-state condition, the relationship between the acceleration response and the displacement response of the system is expressed as:
On this basis, the acceleration FRF can be approximately expressed as:
The above formula can be expressed as two vector multiplications,
where
where is the virtual modal vector, that is, the synthetic FRF.
A column vector can now be formed by evaluating Equation (12) at selected discrete frequencies Ωx, resulting in the following equation
where .
By selecting the evaluation frequencies to be the same as the virtual mode frequencies considered over the frequency range, the following equation was obtained.
According to Equation (6), the acceleration FRF envelop can be obtained. The FRF of the SEA model was modified by the FRF test.
Finally, the acceleration response is expressed as:
Acceleration response results were obtained according to Equation (15). After obtaining the acceleration response in frequency domain, the result of the time domain can be easily computed by applying inverse Fourier transform to the frequency result. Additionally, the SRS of acceleration can also be obtained with the corresponding codes.
3. Shock Experiment and Simulation Study of Spacecraft Structure
In this section, a shock experiment on a typical structure is carried out. The shock force load and the structure’s acceleration shock response were obtained through experiment. The SEA model of a coupled-plate structure was established. The FRF of the SEA model was modified by the FRF test results of the coupled-plate structure. The structure’s acceleration SRS was obtained based on VMSS method. Combined with the experimental results, the numerical results are analyzed and discussed.
3.1. Shock Experiment
This paper designed a high-efficiency shock experiment system based on a light-gas gun device. The shock experiment on typical structures was carried out using this experiment system. The purpose of the shock experiment mainly includes three aspects. First, the shock force signal of the loading system acting on the structure could be obtained. It was the input signal of numerical analysis. Second, according to the characteristics of the tested structure, the SEA model was established. Third, the acceleration response results of the structure was obtained. It was used to verify the results of numerical analysis
A typical coupling plate structure of a spacecraft is composed of two identical aluminum honeycomb sandwich plates. The size of the honeycomb sandwich panel is 100 cm × 120 cm, 3 cm thick. Figure 2 shows the shock experiment state of the coupling plate structure. The tested structure is hung up. The loading device generating shock force is a light air gun. The shock force sensor and vibrating rod were installed at the shock position of the structure. The bullet was fired from the air gun and shocked the resonance rod. The shock load can be adjusted by changing the pressure value of the air gun. Various types of bullets and vibrating rods were designed. The waveform of the shock signal can be adjusted by selecting the bullet and the vibrating rod. As shown in Figure 3, the shock force signal was measured by the shock force sensor. The measuring range of the force sensor is 80,000 N. This signal was the input force function of numerical calculations.
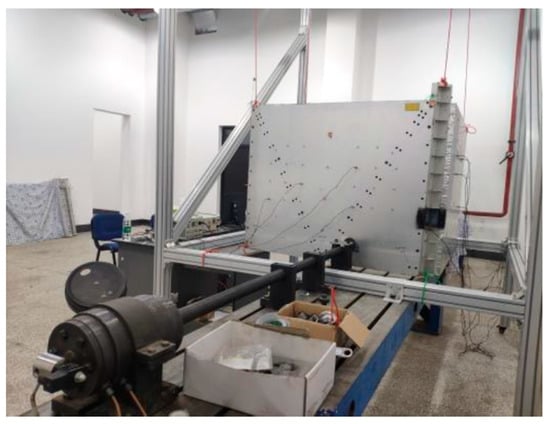
Figure 2.
Shock test state of coupling plate structure.
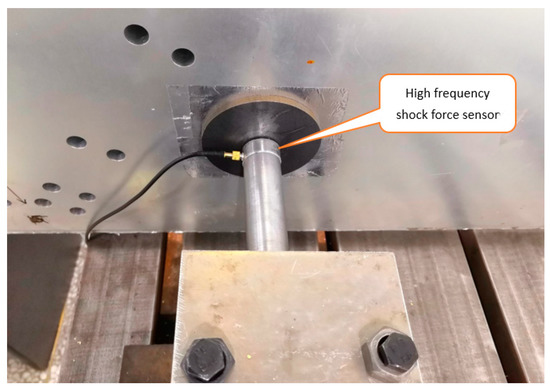
Figure 3.
Shock loading device and measurement method of force signal.
According to the principle of random distribution, acceleration sensors were arranged on the loading board and response board, and five acceleration sensors were arranged on each board. The acceleration response of each part of the structure was obtained by using the data acquisition system. The measuring range of the acceleration sensor is 20,000 Hz and 50,000 g. Through the signal acquisition system, the acceleration response of each position of the structure was collected. The test data acquisition and analysis system and test control system are shown in Figure 4. The device was used to analyze and process the measurement results. Based on the measurement and control system, the results were collected, analyzed and processed. The sampling frequency of the acquisition and analysis system was 106 Hz. The charge amplifier was used to amplify and convert the shock force signal. The time domain signal was obtained from the test, and the acceleration SRS of the structure was obtained according to the shock response spectrum theory. There were several groups of test results on the loading plate and the response plate. The spatial average acceleration SRS of the structure was obtained by averaging the experimental results. The shock experiment results can be used as a reference value for numerical analysis.
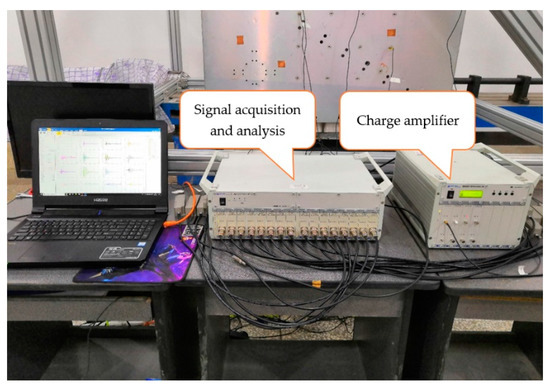
Figure 4.
The measurement and control system of the experiment.
The shock force function measured by the force sensor is shown in Figure 5. It can be seen that the signal has the characteristics of high frequency and high order, and the maximum value reached 32,000 N. In order to further analyze the characteristics of the signal, the time–frequency analysis of a typical shock load signal was carried out based on the discrete short-time Fourier transform method. The time–frequency analysis results are shown in Figure 6. The signal energy was mainly concentrated between 1 ms and 3 ms, and the energy was distributed in the whole broadband. The explosion shock signal has the characteristics of a short duration and rapid mutation. The shock signal had an obvious peak value and high frequency. The characteristics of the shock signal obtained from the test are consistent with those of the explosion shock signal. Further, the amplitude frequency value of the signal was obtained by Fourier transform.
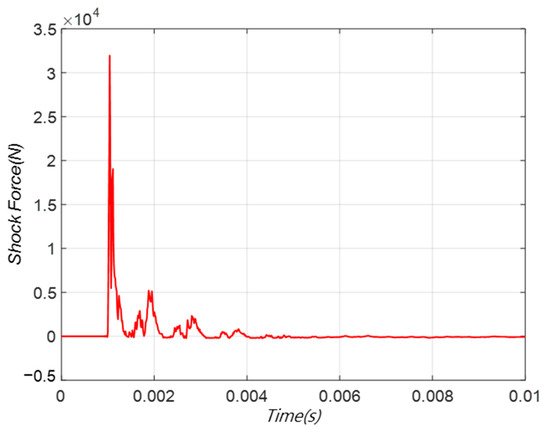
Figure 5.
The high-frequency shock load signal obtained from experiment.
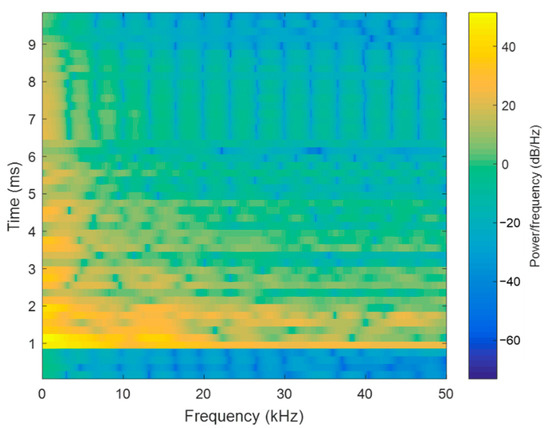
Figure 6.
Time–frequency analysis results of the shock load.
3.2. SEA Model and FRF
According to the structural form in Figure 2, the SEA model of the typical coupling plate structure was established, as shown in Figure 7. In the process of modeling, the structural form of the coupling plate was simplified and equivalent. The connection structure of the two plates was characterized by SEA parameters. After the SEA model was established, the modal density of the subsystem in each frequency band was detected based on VA One intermediate-frequency band modal number analysis. The parameters of the SEA model were modified through the parameter test results. When the structure of spacecraft is complex, subsystems can be divided according to the principle of SEA and the characteristics of modal array. Generally, the plate and shell subsystem and beam subsystem of SEA model are established. If a complex instrument is arranged on the structure, the instrument and its plate and shell can be established as a substructure system. The instrument is characterized in the SEA model in the form of counterweight. The FRF of the whole substructure in a low-frequency band was measured by experiment. By establishing its SEA subsystem, the FRF of medium- and high-frequency bands was obtained.
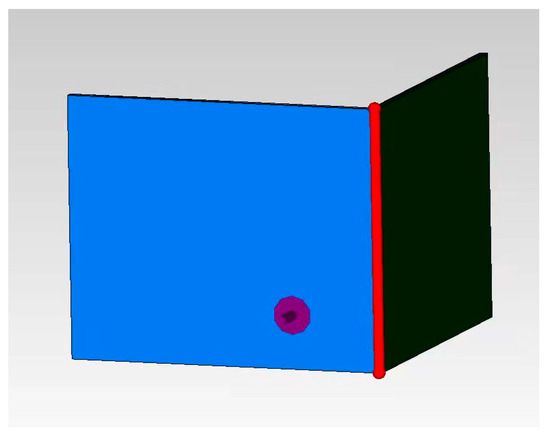
Figure 7.
SEA model of coupled-plate structure.
The unit force load was loaded on the SEA model, and the acceleration frequency response was obtained based on the statistical energy analysis theory. The accelerated FRF calculated based on the SEA model is shown in Figure 8. The response result of the loading plate was significantly greater than that of the response plate. This is because the energy is reduced when the shock energy is transferred from the loading plate to the response plate through the connecting beam. This phenomenon is consistent with empirical analysis. In addition, it can be seen that under the unit steady-state load, the response value of the loading plate increased gradually with the increase in frequency. Compared with the loading plate, the frequency response of the response plate increases less with the increase in frequency. This phenomenon is related to the variation of the statistical energy parameters of the structure with frequency. According to the bandwidth averaging algorithm and Equation (14), the virtual mode synthesis of the structure was carried out. The synthesized FRF is shown in Figure 9.
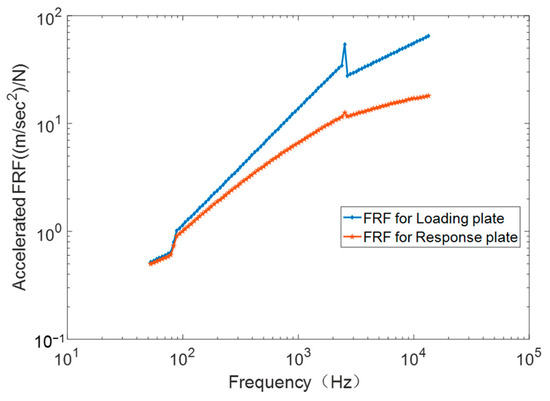
Figure 8.
The FRF based on SEA model.
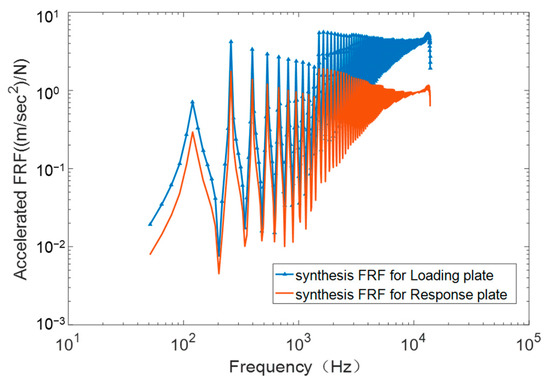
Figure 9.
Synthetic FRF based on VMSS.
3.3. FRF Test and FRF Correction
We designed an FRF experiment of the typical structure. The test process and test platform are shown in Figure 10. The structure was suspended in a free state with elastic rope. The vibration signal was generated by DH-1301 frequency sweep signal generator. The signal was sent to the vibration exciter. The vibration exciter was used to generate force load, and it caused the vibration of the test piece. Force sensors were installed between the vibration exciter and the structure, and acceleration sensors were randomly arranged on the structure. The sensor signal was measured by the dynamic data acquisition system. The force sensor measured the force signal acting on the structure. The acceleration sensor measured the acceleration response of the structure. Several groups of test results were obtained by changing the position and frequency of the exciter. The structural FRF was obtained according to the test principle of FRF. The FRF of the structure is expressed as:
where is the cross-spectral of the input load and response, and is the self-spectral of the input load signal. Taking the statistical average of multiple groups of test results, the FRF of the coupling plate structure was obtained, as shown in Figure 11.
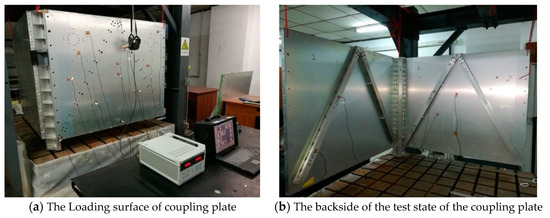
Figure 10.
The FRF test state of the coupling plate.
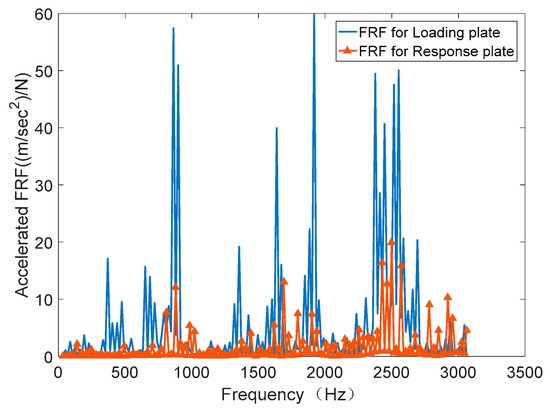
Figure 11.
The FRF test results of the coupling plate.
By analyzing SEA model, the modal number of the SEA model in each analysis frequency band was obtained, as shown in Figure 12. The modal calculation process used the analysis frequency band of 1/12 octave. It was found that below 500 Hz, the number of modes in the analysis bandwidth was less than 5. At about 1000 Hz, the number of modes in the analysis bandwidth reached 10. Considering the principle of modal number in the SEA method, the FRF results of 50 Hz to 1000 Hz obtained from the test replace the FRF values in the low-frequency band based on the SEA model. The purpose of modifying the low-frequency FRF of the model was achieved, and an FRF curve more in line with the actual state was obtained. According to the bandwidth averaging algorithm and Equation (14), the modified FRF was used to synthesize the virtual mode of the structure. The synthesized FRF before and after correction is shown in Figure 13.
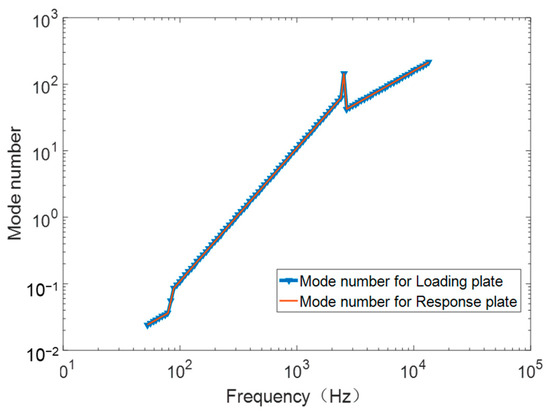
Figure 12.
The modal number curve of the SEA model.
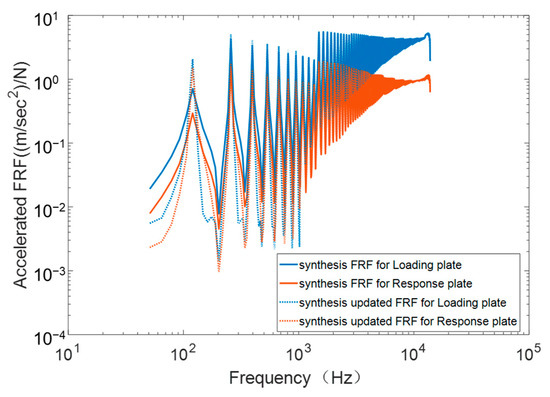
Figure 13.
Synthesis FRF curve before and after correction.
3.4. Acceleration Shock Response Results
Combined with the synthesized FRF curve and the amplitude frequency value of the shock signal, the time-domain response results before and after FRF correction were calculated based on the theoretical VMSS Equation (15). The SRS of typical spacecraft structure before and after FRF correction was calculated according to the shock response spectrum theory, and the results are shown in Figure 14. From the SRS curve before correction, the two SRS curves of loading plate and response plate have similar trends regarding the change of frequency. The acceleration value shows an upward trend from 100 Hz to 2500 Hz, reaching the inflection point and maximum at about 2500 Hz; it decreases from 2500 Hz and gradually reaches a stable value. For the same frequency bandwidth, the acceleration response of the loading plate is larger than that of the response plate. This result is consistent with the physical law of shock force transmission in the structure. The SRS of the loading plate and response plate after correction is higher than it was before correction. Especially in the low-frequency band, the results show obvious changes. However, in the high-frequency band, it is basically the same as it was before correction.
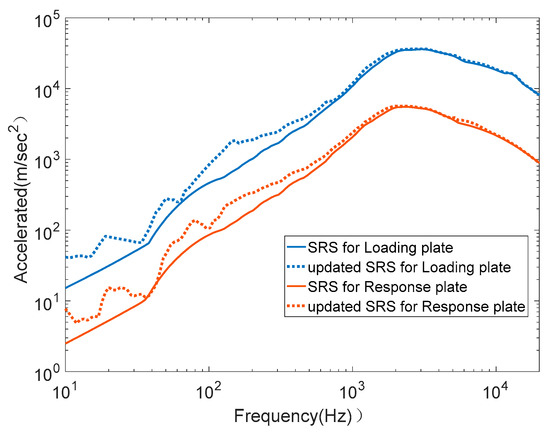
Figure 14.
Shock response spectrum results of typical spacecraft structures based on the FRF correction and VMSS.
3.5. Results and Discussion
Based on the FRF correction and VMSS, the SRS of the coupled-plate structure loading plate and response plate was obtained in this paper. The SRS results of the loaded plate obtained by numerical analysis and test are shown in Figure 15. The SRS results of the response plate obtained by numerical analysis and test are shown in Figure 16. With the change of frequency, the SRS curves of the loading plate and response plate have a similar trend. The overall trend is upward, reaching the inflection point and maximum at about 2500 Hz. Under the same frequency band width, the value from the loading board to the response board shows a downward trend. The test results accord with the physical law of shock load transmission in the structure.
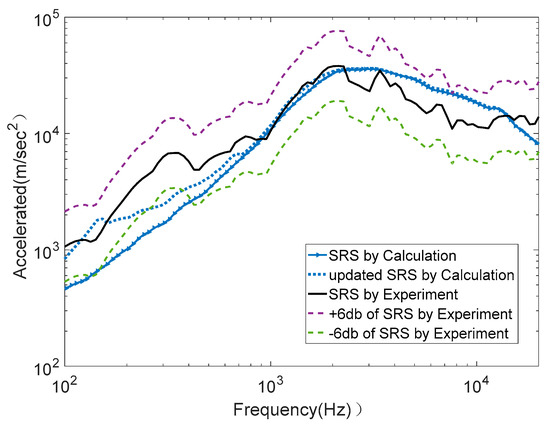
Figure 15.
Shock responses of experiment and calculation for loading plate.
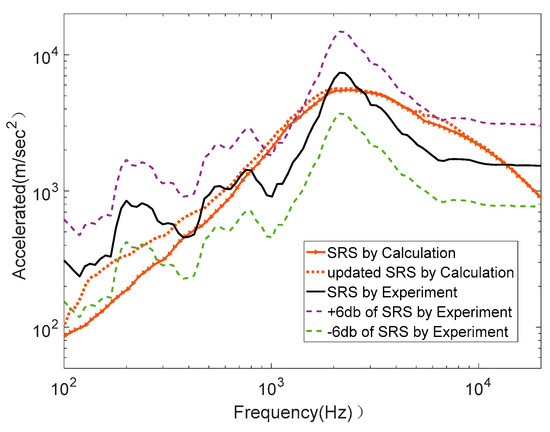
Figure 16.
Shock responses of experiment and calculation for response plate.
The rationality and accuracy of the new method were analyzed by comparing the SRS curves of numerical analysis and experiment. It can be seen from Figure 15 and Figure 16 that the numerical analysis results before FRF correction are in good agreement with the test results in the high-frequency band. The maximum and inflection point of the two results are very close. With the increase in frequency, the evolution trends of the two curves are the same. In most frequency bands, the deviation between the calculated results and the test results is within 6 dB. However, at some frequencies, especially in the lower frequency band, the error of calculation results is large. The calculated results of the loaded plate are closer to the test results than those of the response plate. This is because the shock load is transmitted from the loading plate to the response plate through the connecting mechanism, and the load passes through a more complex path. When the stress wave passes through the connecting structure, the error increases. When the energy is transmitted from the shock source to the response board, more subsystems pass through, leading to a greater prediction error of the response plate. Compared with the numerical analysis results before correction, the corrected numerical analysis results obviously correspond better to the test values in the low-frequency band. The error between numerical analysis and experimental results comes from the parameter error and measurement error of the SEA model.
In order to clearly illustrate the comparison between the numerical analysis results and the experimental results, parameter was introduced to characterize the error, which is defined as follows:
where and are the calculated SRS and the experimental SRS, respectively. Obviously, the coefficient is positive. The larger the coefficient , the greater the error. Based on Equation (17), the error values of the curves in Figure 15 and Figure 16 were calculated. In the frequency band of 100 Hz to 12,000 Hz, the parameter of the loading plate and response plate before correction was 0.3981 and 0.4428, respectively, and the parameter of the loading plate and response plate after correction was 0.3022 and 0.4190, respectively. In the frequency band of 100 Hz to 1000 Hz, the parameter of loading plate and response plate before repair are 0.4906 and 0.4670, respectively, and the parameter of loading plate and response plate after correction was 0.2914 and 0.3267, respectively. The corrected numerical analysis results obviously correspond better to the test values in the low-frequency band.
Using our method, the above calculation results can be obtained in only 3 min. The traditional finite element method was used to analyze the response of the coupled-plate structure. In order to ensure the calculation accuracy, the structure needs to be divided into at least 90,000 units. It takes more than 24 h for a single computer to calculate 1000 time steps. The new method greatly improves the calculation efficiency. At the same time, the calculation accuracy of the whole frequency band is guaranteed.
The above analysis shows that the accuracy of the response prediction method of structures based on VMSS was effectively improved by modifying the FRF. The structure used in this example were the plate and shell structure of a real typical satellite. In the process of deriving the theoretical calculation method, the input value was the pyroshock signal. There were no special assumptions and restrictions on the structural form. Through the comparison of numerical analysis and test results in this example, the applicability and accuracy of the new method in predicting pyroshock response prediction of typical plate and shell structures was verified and explained. Based on this method, the pyroshock response characteristics of the structure in a wider frequency domain can be better reflected, and a more accurate prediction result of shock response in a wider frequency domain can be obtained. Compared with the traditional dynamic analysis method, this method also greatly improves the calculation efficiency.
4. Conclusions
This study presents an improved method of predicting the pyroshock response of a spacecraft structure in a wide frequency domain based on acceleration FRF and the VMSS method. The SEA model of the spacecraft structure was established, and the FRF of the SEA model in a low-frequency band was modified by an FRF test of the structure. The SRS was obtained based on the VMSS and the modified FRF. Through experimental verification, the following conclusions were drawn: the numerical results based on the new method are in good agreement with the experimental results in full frequency domain. The novel method presented in this paper can better grasp the response characteristics of the structure in the broadband domain and effectively improves the response prediction accuracy of the SEA model in the relatively low-frequency band. Our new method can predict the full-frequency shock response more effectively and reasonably, and the computational efficiency is greatly improved, compared with the traditional finite element method. It provides the support of numerical analysis for the pyroshock response prediction of spacecraft structure in a wide frequency domain.
Author Contributions
Conceptualization, Y.S.; Data curation, X.W.; Investigation, W.L. and J.D.; Methodology, X.W.; Software, X.W. and Y.D.; Validation, X.W. and Y.S.; Writing—original draft, X.W.; Writing—review and editing, W.L., Y.D. and J.D. All authors have read and agreed to the published version of the manuscript.
Funding
This research was funded by the National Defense Science and Technology Enhancement Program of China.
Conflicts of Interest
The authors declare that there is no conflict of interests regarding the publication of this paper.
References
- Li, B.; Li, Q. Damage boundary of structural components under shock environment. Int. J. Impact Eng. 2018, 118, 67–77. [Google Scholar] [CrossRef]
- Ding, J.; Zhao, J.; Han, Z. Research development of spacecraft pyroshock technique. J. Astronaut. 2014, 35, 1339–1349. [Google Scholar]
- Gong, Q.; Zhang, J.; Tan, C.; Wang, C. Neural Networks Combined with Importance Sampling Techniques for Reliability Evaluation of Explosive Initiating Device. Chin. J. Aeronaut. 2012, 25, 208–215. [Google Scholar] [CrossRef] [Green Version]
- Himelblau, H.; Kern, D.L.; Manning, J.E.; Piersol, A.G.; Rubin, S. Dynamic Environmental Criteria, NASA Technical Standard, NASA-HDBK-7005; National Aeronautics and Space Administration: Washington, DC, USA, 2001. [Google Scholar]
- Lee, J.; Hwang, D.-H.; Han, J.-H. Study on Pyroshock Propagation through Plates with Joints and Washers. Aerosp. Sci. Technol. 2018, 79, 441–458. [Google Scholar] [CrossRef]
- Daniel, R. Pyroshock Test Criterial, NASA Technical Standard, NASA-STD-7003A.; National Aeronautics and Space Administration: Washington, DC, USA, 2011. [Google Scholar]
- Shi, Q.; Ando, S.; Seko, H.; Nagahama, K.; Saegusa, H. The Summarization of Pyro-Shock Testing Data and SRS Level Prediction Methodology. In Proceedings of the International Symposium on Environmental Testing for Space Programmes, Noordwijk, The Netherlands, 15–17 June 2004; Volume 558, pp. 549–554. [Google Scholar]
- Ullio, R.; Marucchi-Chierro, P.C.; Spazio, A. Utilization of Prediction Methods in the Shock Environment Evaluation. Spacecraft Structures. Mater. Mech. Test. 2001, 468, 239. [Google Scholar]
- Girard, A.; Pont, C.; Courau, E. Very first results from pyroshock database for satellites. In Proceedings of the European conference Spacecraft Structures, Materials and Mechanical Testing 2005, Noordwijk, The Netherlands, 10–12 May 2005. [Google Scholar]
- García-Pérez, A.; Sorribes-Palmer, F.; Alonso, G.; Ravanbakhsh, A. Overview and application of FEM methods for shock analysis in space instruments. Aerosp. Sci. Technol. 2018, 80, 572–586. [Google Scholar] [CrossRef]
- Mary, S.; Cipolla, V.; Courau, E.; Bricout, J.N. Shock propagation simulation using FEM software. In Proceedings of the European Conference on Spacecraft Structures, Materials & Mechanical Testing, Noordwijk, The Netherlands, 10–12 May 2005; pp. 1–6. [Google Scholar]
- Ullio, R.; Marucchi-Chierro, P.C.; Spazio, A. Utilization of prediction mehods in the shock environment evaluation. In Proceedings of the European Conference on Spacecraft Structures, Materials and Mechanical Testing, Noordwijk, The Netherlands, 29 November–1 December 2000; pp. 239–245. [Google Scholar]
- Fahy, F.J.; Yao, D.Y. Power flow between non-conservatively coupled oscillators. J. Sound Vib. 1987, 114, 1–11. [Google Scholar] [CrossRef]
- Lai, M.L.; Soom, A. Prediction of transient vibration envelopes using statistical energy techniques. ASME J. Vib. Acoust. Stress Reliab. Des. 1989, 112, 125–136. [Google Scholar] [CrossRef]
- Pinnington, R.; Lednik, D. Transient statistical energy analysis of an impulsively excited two oscillator system. J. Sound Vib. 1996, 189, 249–264. [Google Scholar] [CrossRef]
- Robinson, M.; Hopkins, C. Prediction of maximum time-weighted sound and vibration levels using transient statistical energy analysis. Part 1: Theory and numerical implementation. Acta Acust. United Acust. 2014, 100, 46–56. [Google Scholar] [CrossRef]
- Robinson, M.; Hopkins, C. Prediction of maximum time-weighted sound and vibration levels using transient statistical energy analysis. Part 2: Experimental Validation. Acta Acust. United Acust. 2014, 100, 57–66. [Google Scholar] [CrossRef]
- Dalton, E.C.; Chambers, S.B., III. Analysis and validation testing of impulsive load response in complex, multi-compartmented structures. In Proceedings of the Structures, Structural Dynamics and Materials Conference, New Orleans, LA, USA, 10–13 April 1995; pp. 759–767. [Google Scholar]
- Dalton, E.C.; Frydman, A.; Li, A.; Berman, M. High frequency shock predictions in armored vehicles: AGS case study. In Proceedings of the 16th International Symposium on Ballistics, San Francisco, CA, USA, 23–28 September 1996; pp. 1198–1210. [Google Scholar]
- Dalton, E.C.; Loper, R.B.; Frydman, A.; Li, D.; Berman, M. Simulation of ballistic shock in composite armored vehicles. In Proceedings of the 68th Shock and Vibration Symposium, Hunt Valley, MD, USA, 3–6 November 1997; pp. 992–1016. [Google Scholar]
- Dalton, E.C.; White, M.D.; Frydman, A. Parameter sensitivity for statistical energy analysis methods of ballistic shock simulation. In Proceedings of the 69th Shock and Vibration Symposium, Minneapolis, MN, USA, 12–16 October 1998; pp. 688–702. [Google Scholar]
- Dalton, E.C. High Frequency Shock Prediction, Short Course Notes; Sponsored by Military Technology Inc.: New York, NY, USA, 1999. [Google Scholar]
- Cao, N.; Xin, H.; Li, Z.; Guan, Y. Application of statistical energy analysis method in predication of pyroshock response. J. Vib. Shock 2015, 34, 83–87. [Google Scholar]
- Lee, D.O.; Han, J.H.; Jang, H.W.; Woo, S.H.; Kim, K.W. Shock Response Prediction of a Low Altitude Earth Observation Satellite During Launch Vehicle Separation. Int. J. Aeronaut. Space Sci. 2010, 11, 49–57. [Google Scholar] [CrossRef]
- Lee, J.R.; Chia, C.C.; Kong, C.W. Review of pyroshock wave measurement and simulation for space systems. Measurement 2012, 45, 631–642. [Google Scholar] [CrossRef]
- Borello, G.; Courjal, A. Modelling Payloads Using SEA for Vibroacoustic and Shock Prediction; Inter AC-L Union: Milan, France, 2005. [Google Scholar]
- Luo, W.; Cheng, L.; Tong, L.; Yu, W.; Mechefske, C. Prediction and Analysis of Structural Noise from a U-beam Using the FE-SEA Hybrid Method. Promet Traffic Transp. 2018, 30, 333–342. [Google Scholar] [CrossRef]
- Yan, Y.; Li, P.; Lin, H. Analysis and experimental validation of the middle-frequency vibro-acoustic coupling property for aircraft structural model based on the wave coupling hybrid FE-SEA method. J. Sound Vib. 2016, 371, 227–236. [Google Scholar] [CrossRef]
Publisher’s Note: MDPI stays neutral with regard to jurisdictional claims in published maps and institutional affiliations. |
© 2022 by the authors. Licensee MDPI, Basel, Switzerland. This article is an open access article distributed under the terms and conditions of the Creative Commons Attribution (CC BY) license (https://creativecommons.org/licenses/by/4.0/).