Article

Aerodynamic and Structural Aspects of a Distributed Propulsion System for Commuter Airplane

Department of Aerospace Engineering, Faculty of Mechanical Engineering, Czech Technical University, 166 36 Prague, Czech Republic
*
Author to whom correspondence should be addressed.
Aerospace 2022, 9(11), 712; https://doi.org/10.3390/aerospace9110712
Submission received: 4 October 2022 / Revised: 7 November 2022 / Accepted: 9 November 2022 / Published: 12 November 2022
(This article belongs to the Special Issue Turboprop Aircraft Design and Optimization)

Abstract

:
In this paper, an aerodynamic and structural computation framework was produced to develop a more efficient aircraft configuration considering a wing with a distributed electric propulsion and its use in different flight missions. For that reason, a model of a regional airplane was used as a case study. The considered model was a nine-seat light airplane with a cruise speed of 500 km/h at an altitude 9000 m. The design of the distributed system is introduced, then the aerodynamic and structural aspects of the new wing with distributed electric propulsion system are calculated, and finally flight performances are calculated for the purpose of analysis of the DEP effect. The design of the DEP system aimed at meeting the required landing conditions and the masses of its components, such as the electric motors, the control units and the power source of the DEP system were estimated. Aerodynamic calculations included computations of different wing aspect ratios. These calculations take into account the drag of the existing airplane parts such as fuselage and tail surfaces. A modified lifting-line theory was used as a computational tool for the preliminary study. It was used to calculate the wing drag in cruise regime and to determine the distribution of aerodynamic forces and moments. Next, based on aerodynamic calculations and flight envelope, the basic skeletal parts of the wing were designed and the weight of the wing was calculated. Finally, fuel consumption calculations for different wing sizes were made and compared with the original design. The results show that a wing with a 35% reduction in area can reduce fuel consumption by more than 6% while keeping the same overall weight of the aircraft.

1. Introduction

Distributed electric propulsion systems (DEP) represent a promising branch of aircraft development. Nowadays, much attention is given to the DEP, which is represented by electrical engines used to power the propellers or fans. Electrical motors are very convenient for this application because of the relatively small dimensions and ease of installation in various positions.
The first knowledge regarding aerodynamic causalities dates back to the roots of aviation, i.e., to the end of the 19th century [1]. Otto Lilienthal was probably the first to discover a relation between the value of airspeed squared and aerodynamic forces. It can be deduced that a required lift force can be produced either by movement of an airplane creating sufficient relative freestream velocity, or the airplane can be stationary while the freestream is generated by the propellers. The combination of both ways is a principle that seeks to be beneficial in distributed propeller systems.
The basic idea of DEP divides the aircraft design into two separate modes: take-off/landing and cruise regime. Take-off and landing require high lift, while the cruise regime is typically optimized for low aerodynamic drag (in terms of maximum lift to drag ratio). The classical approach to aircraft design usually means that the wing area is deter-mined by a take-off or landing condition. High lift devices, such as slats and flaps, are used for the increase in the lift coefficient during the take-off and landing, and the size of the wing surface is determined by speed requirements in these regimes (e.g., regulation requirements or runway length). This results in a wing that is not preferably optimized for a cruise regime in which the airplane is travelling for most of the flight time. Distributed propulsion systems, discussed here as DEP, bring a completely different design approach. The shape of the wing is designed directly for the cruise regime. Lift force required for take-off and landing is assured by increased dynamic pressure generated by propellers positioned along the wing leading edge. High lift devices can be used for a further increase in the lift force. It is assumed that propellers used to increase dynamic pressure are folded during the cruise regime and do not create additional drag. This approach allows the use of wings with a high aspect ratio and low drag, in other terms a high lift to drag ratio. Optimization tools should be used in the design process in order to fully exploit the DEP potential.
The main motivation of this study was to use fast computational methods to determine the impact of the DEP system on fuel consumption, which has an effect on direct operational costs. In addition, by reducing fuel consumption it reduces greenhouse gas emissions which is an essential requirement in many aviation projects. At present, efforts are being made to create a new type of aircraft using DEP. One of the main motivations in the EU for these efforts is to meet the requirements of the European Green Deal and the FlightPath 2050 specifications [2]. These challenges determine the necessary changes to be achieved in the EU in the aviation sector. The key objectives include reducing fuel consumption and emissions of the greenhouse gases CO2 and NOx. Another objective is to allow travel within 4 h door–door within the EU. This directly predetermines the use of the commuter category on shorter distances of transport, allowing the use of airports with shorter runways, currently rarely or not used at all. Reducing fuel consumption and CO2 emissions can contribute to a greater expansion of the commuter category for regular traffic.
High accuracy methods such as CFD are used for computations and optimization during the detailed design phase. However, there is still a need for a simple and fast computation procedure for the preliminary study. This paper presents such a method which can be used for the fast computation of the wing with DEP. It can be used for a basic aircraft and wing optimization. It should provide input data for the first iteration with more precise methods.
Recently, an electrical airplane was supposed to be a new addition to the traffic system [3]. Use of electrical engines provides large benefits and offers a different kind of airplane design [4]. The DEP concept has been developed over a long period of time by various countries and organizations. Among the more advanced projects is undoubtedly the Maxwell X-57, a follow-up to the previous NASA-led LEAP project. The main goal of the Maxwell X-57 project was to create a demonstrator based on the Tecnam P2006T to validate the DEP system technology of a fully electric two-seat aircraft with a range of 160 km at a design cruising speed of 280 km/h. The increase in cruise mode efficiency is expected to be 3.5–5 times due to the DEP. There are several EU projects that aim to solve the DEP system implementation. The ELICA project focuses on the MDO design of 19 passenger airplanes [5], the project FutPrint50 solves individual systems of 50 passenger hybrid-electric aircraft such as thermal management, energy storage and aeroacoustics [6], and the project IMOTHEP is aimed at the development of a hybrid–electric engine. Another effort to meet Flightpath 2050 requirements through the DEP system is the design of a 70-passenger regional airliner [7], where the main focus is on optimizing the DEP electrical system for different flight configurations. The DEP system can also be used for the super STOL aircraft solution, where propellers located on the leading edge are used to maximize the dynamic pressure on the wing. Studies have indicated that the runway length for an initially twin-engine aircraft can be reduced using the DEP system by up to 80% [8], by reaching the extreme values of the lift coefficient [9].
The presented work is divided into three parts. The first part contains an analytical description of the use of the DEP system, the calculation of the induced velocity from the propellers, a description of the sizing of the DEP system, and an estimation of the masses of its individual parts. The second part contains both aerodynamic and strength calculations. Aerodynamic calculations were used to determine the total drag of the aircraft and fuel consumption, and strength calculations allow the weight of the calculated wing to be estimated. A flight envelope, composite for gust and maneuver envelopes, was used to determine aerodynamic loads and velocities for structural design under CS-23 regulation. After that a geometry of spars, ribs, and skin was designed with consideration of the buckling effect of the full aluminum material. The last part of work focuses on flight performance and a cost efficiency analysis of the calculated geometries.
This paper presents a study that analyses the potential benefits of introducing a DEP system into an existing aircraft. Replacement of the wing of the existing aircraft with a wing with the DEP system is considered and flight performance is compared, with fuselage and tail surfaces unchanged. Although this is a study, or rather a preliminary proposal, the impact of the DEP system is assessed in a complex way through flight performance. The calculations of aerodynamic characteristics are solved using a modified lifting line theory, the effect of the wing configuration on the sizing of the DEP system is assessed, and the weight of the wing structural elements is estimated. The aircraft selected for this study was a Pilatus PC-12 for nine passengers with an MTOW of 4740 kg and a cruise speed of 528 km/h.

2. Design of the Distributed Propulsion System

In this paper, the effect of wing size on the overall flight performance of the aircraft is investigated. Compared to the original wing, the modified wings are smaller and that is why they are supplemented with the DEP system, which provides the required characteristics for the landing and take-off regime. The key role of DEP is to provide required propeller-induced velocity to the wing. Thus, dynamic pressure and lift force are increased. The smaller wing area will provide a better aerodynamic performance in cruise mode compared to the original wing, thus reducing fuel consumption which was the main objective of this study. In order to minimize aerodynamic drag in cruise mode, distributed propellers are considered to be foldable [10]. In this part, an overview of the design method is described.

2.1. DEP—Analytical Approach

Both airplanes, the original and the airplane with the modified wing, had the same landing requirements and thus the total lift force had to be comparable:
L 0 = L D E P
The required value that had to be reached was the total lift at landing speed. The equation that relates lift for the original and the DEP cases is described as follows:
1 2 ρ v 0 2 c L S r e f = 1 2 ρ ( v 0 + v w ) 2 c L S D E P
where S r e f is the area of the original wing, v 0 is the freestream velocity, and v w is the additional wing velocity induced by the DEP propellers, ρ is the air density and S D E P is the wing area of the airplane with DEP system. After simplification, we can obtain the value of the required induced velocity on the wings:
v w = v 0 ( S 0 S D E P 1 )
The overall scheme of the velocity evolution in the propeller stream and the definition of the distance between the propeller and the wing is shown in Figure 1.
The additional velocity on the wing is a function of propeller-induced velocity v i and multiplied by the development factor:
v w = v i k d
where the increase in velocity with distance from the propeller is described by the development factor k d and depends on the distance of the propeller from the wing s and the propeller radius r [11]:
k d = 1 + s r 2 + s 2

2.2. Propeller-Induced Velocity

The second step was to determine the relationship between the propeller thrust and the induced velocity, which is defined by the previous term. For that purpose, we used Momentum theory to describe the flow field behind the propeller. The calculation of the induced propeller velocity can be derived from the Actuator Disk Theory, where the propeller thrust is:
T = m ˙ ( v 2 v 0 )
where T is the propeller thrust, v 0 is the freestream velocity, and v 2 is the velocity behind the propeller. The mass flow m ˙ corresponds to:
m ˙ = A ρ v 1
where A is the area of the propeller disk and v 1 is the velocity at the propeller location. The propellers studied here were designed to increase the dynamic pressure in landing and take-off configurations, i.e., at low flight speeds, so we could consider the flow without the effect of compressibility. Thus, the speed v 1 can be thought of as the average of the input and output velocity and as the sum of freestream and induced velocity:
v 1 = v 2 + v 0 2 = v 0 + v i
After inserting the Equations (7) and (8) into the Equation (6) we can obtain the equation of thrust depending on the speed of flight and the value of the induced velocity.
T = A . ρ . ( v 0 + v i ) . ( 2 v i )
Solving the previous quadratic thrust equation, we can obtain the induced velocity equations:
v i = v 0 2 + v 0 2 4 + T 2 . ρ . A

2.3. Thrust and Drag Force Balance

The equilibrium of the forces in the vertical axis is ensured by fulfilling Equation (4). In the longitudinal axis, it is necessary to provide equality between the thrust of all propulsion units and the total drag for a steady flight regime. The thrust of the selected configuration can be divided between the DEP propeller and the main propeller used in cruise mode. Similarly, the total drag can be divided between the wing, which is blown at an increased velocity v w , and the rest of the aircraft, where the dynamic pressure depends only on the velocity v 0   in the landing regime:
T C R + T D E P = D f u s + D w i n g
where T C R is thrust of cruise propeller, T D E P is the sum of the thrust of all DEP propellers, D w i n g is aerodynamic drag of the wing, and D f u s is the aerodynamic drag of the rest of the aircraft such as the fuselage and tail surfaces. A similar procedure has been considered in various wing analyses [12]. If we consider the possibility of filling in the missing thrust in the left part of the previous equation using the thrust from the cruise propeller, then we can modify it into the following inequality:
T D E P 1 2 ρ v 0 2 c D f u s S r e f + 1 2 ρ ( v 0 + v w ) 2 c D w i n g S D E P
where c D f u s is the aerodynamic drag coefficient of the fuselage and tail surfaces and c D w i n g is the aerodynamic drag coefficient of the wing in landing regime with flaps considered. The fuselage and tail surfaces drag was calculated using openVSP and drag of the wing was estimated from wind tunnel measurements of a similar aircraft.

2.4. Validation of Design Algorithm

In this section, the validation of the DEP design process is performed as described in the previous sections. The main objective was to verify that the defined induced velocity will increase the lift of the wing in the prescribed manner. The propeller wing interaction was simulated within an OpenFOAM CFD solver with an implemented actuator disk model. Both simulations were performed with an uncompressible solver simpleFoam, k- ω SST turbulence model and with wall functions applied on wall boundaries.
As a case study, a wing with flaps was considered and the aim was to achieve a doubling of lift using the propeller. The selected wing geometry was made with a 13% thick profile medium speed airfoil, with 30% flap deflected to 30°. The position of the flap which gives maximum lift coefficient was obtained from wind tunnel measurements [13]. The mentioned propeller was designed with respect to minimum induced loss, according to Larrabee’s method. This designed propeller was powered by a 16kW electrical engine located in a nacelle. It had three blades with 580 mm diameter. The propeller was considered to be foldable into the nacelle and for this reason it was located 300 mm in front of the leading edge. The propeller disk plane was perpendicular to the flight direction in cruise regime. The presence of the propeller nacelle was neglected in the CFD simulations. Both cases, with and without DEP, were tested on a wing section with 785 mm chord and width of 600 mm.
Computational mesh around the flapped wing segment was realized and performed with open-source mesh algorithms (snappyHexMesh). The computational mesh had about 366,000 cells, refined in the wake and in the location of propeller disk. For discretization, a trimmed cells scheme with prism layers on the wall boundaries was used. Maximum cell size around the airfoil was about 3 mm. The computational mesh was always aligned with freestream and for each angle of attack a new mesh was generated. In this study, the increase in lift was analyzed. Mesh study was not performed.
Both simulations used the turbulent model which can obtain drag characteristics more accurately. For this reason, a mesh with a high Y+ was used. A typical value of Y+ close to 35 was applied on surfaces with wall boundary conditions. The disadvantage of the used turbulent model is the production of some large turbulence levels in regions with large normal strain, such as regions with strong acceleration and stagnation regions. These regions were in this case present only at a very limited number of locations, so the chosen model could be used for normal regimes. At higher angles of attack, in combination with the used type of mesh, the drag prediction can be poor. To increase simulation stability, the velocity limiter set to 270 m/s was applied. The CFD results with velocity streamlines for both configurations are shown in Figure 2. In Figure 3, it can be seen that the increase in the lift coefficient in the CFD simulations was approximately double.

2.5. Propeller Wing Fitting

Equations (3), (10), and (12) could be satisfied in several ways, depending on the number of propellers chosen. This is a geometric problem, the scheme of which is shown in Figure 4.
The vertical distance between the nacelle and the wing was determined by the h 2 c ratio, which for this study was set to 0.14 as the optimum value in terms of minimum drag increase [14]. Figure 4 shows that if it is desired that the entire leading edge of the wing is covered by the propellers, the propellers overlap. This affects the efficiency of the covered propeller and reduces the thrust and thus the induced speed. Increasing the thrust of a partially or fully covered propeller can be achieved by increasing its speed. However, this will increase the power demand for the required thrust, specifically for a fully covered propeller for which the power for the required thrust is 30% higher [15].
The objective of this procedure was to find the propeller radius such that for a given number of propellers, the entire leading edge of the wing was behind the propellers. This condition is ensured by satisfying Equation (13):
r 2 = ( p y 2 ) 2 + ( h 2 c . c + k r . r ) 2 b f 2 = 2 . r + ( n 1 ) . p y
where r is the propeller radius, c is the chord of the wing, f is the fuselage width, b is the wingspan, p y is the lateral distance between two propellers, n is the number of propellers on half of the wing, and k r is the percentage of the inner radius of the propeller, which uses the propeller radius to define the diameter of the engine nacelle. In this study the value of k r was 0.2.

2.6. DEP Mass Estimation

In general, the electrical system design for distributed propellers can be divided into two basic approaches. Either it is a completely new design of the aircraft where it is possible to freely place the different parts of the system [5,16], or it is the incorporation of the DEP into an existing aircraft concept where the original layout has to be preserved as much as possible, as in the projects of Daher-Airbus ECOPULSE™ and the nine-engine An-2 with DEP.
In our case, it was a modification of the existing PC-12 aircraft, where the main power unit is a turbine located in the front of the aircraft and it is used to generate power for the DEP system and also to drive the cruise propeller. The DEP system arrangement is shown in Figure 5 and is a series-parallel arrangement where the propeller used for cruise mode remains connected to the turbine output, particularly its gearbox. The generator is connected to the gearbox in parallel and provides power to the high-lift propeller motors in landing and take-off mode.
Estimation of the weight of the whole DEP system depends both on the area of the newly designed wing and on the number of distributed propellers that will increase the flow velocity on the wing. In this report, several wing areas were considered for comparison against the original wing. For each wing with a reduced area, the desired induced velocity on the wing was calculated to provide the required lift in landing mode (3). In the next step, an analysis of the effect of the number of propellers on the total thrust of the DEP system was performed (12), where the force equation must hold while each propeller induces the required velocity (10). A larger number of propellers n implies their smaller diameter r ; therefore, a smaller area of the propeller disk A and thus for a given value of the induced velocity v i reduces their thrust (9). Ultimately, this means that the larger the number of DEP propellers, the lower the power and the lower the total weight of the DEP system will be. On the other hand, a large number of propellers or their small radius means a smaller Reynolds number, which reduces the efficiency of the propeller [17]. In addition, with a smaller propeller radius there is also an increase in swirl in the propeller stream. The swirl angle of the propeller varies depending on the radial and axial location. The twisting of the flow behind the propeller results in the local angle of attack being increased on one part of the wing and decreased on the other [18]. Partially overlapping propellers slightly reduce this effect.
Another important aspect is the design of the geometry of the propeller itself. For classical propeller design the minimum induced loss method [19] is most often used which is not suitable for high pressure propellers. A promising way is to design the propeller so that the axial component of the induced velocity has a homogeneous distribution behind the propeller. This can achieve a reduction in the power required for the desired value of induced velocity [20]. The number and geometry of the propellers will play a key role in the detailed design of the system. In this comparative study, a variant with 20 propellers of the DEP system, or 10 propellers per half wing, was selected for all geometries of the studied wings.
Table 1 shows the basic parameters of the individual components of the DEP system used to calculate the performance and subsequently the masses. Estimating the propeller weight can be quite complicated. The classical propeller design is derived from the maximum stresses that occur at high speeds or power, where centrifugal forces and blade axial loading are the dominant effects [21]. The propellers of the DEP systems are relatively small for the selected number and are also used for low values of velocity. Therefore, the weight of the propeller is calculated based on the knowledge of the weights of current propellers in a given size [22] and their weight is multiplied by a safety coefficient of 2.5 because the proposed propellers must be foldable and at the same time the propeller blades will be relatively heavily loaded.
One of the key influencing parameters for the calculation of the DEP system mass is the voltage between the generator, or general power source, and the high-lift propeller motors. A low voltage value directly results in a significant increase in cable weight. Several options are currently being considered to reduce the weight of the cables. The first is to directly design the high-voltage motors and thus reduce the required current [23]. However, such a solution has a slightly lower power to weight ratio and at the same time there is not a wide enough range of motors for different power ratings. Another option is to convert the voltage behind the generator/power-source to a higher voltage using an AC/DC converter and reduce the voltage to the required value at the driven motor using a DC/DC converter. Power converters are currently fairly heavy, and their weight increases significantly with power. By optimizing the design of converters for use in hybrid or all-electric aircraft, their weight and volume can be reduced [24]. In this study we considered a currently available motor powered by a 20 cell LiPo battery. This meant that the maximum voltage was equal to 84 V.
Electric motors are an important element of the DEP system. Currently, there is a rather extensive development of these elements in aviation, where the aim is to achieve the maximum power to weight ratio with high efficiency and reliability. One of the goals of the HASTECS project is to achieve 10 kW/kg for electric motors and 25 kW/kg for power electronics. These assumptions incorporate cooling systems and are part of the MDO optimizations [25]. In our case, we considered power density more realistically at 5.8 kW/h and efficiency at the currently realistic value of 95%.
The input parameters for calculating the mass of the DEP system components were the original S 0 = 25.81 m2 and reduced wing area S D E P , fuselage and tail drag coefficient c D f u s = 0.0093 , aerodynamic drag coefficient of the wing with flap in landing position c D w i n g = 0.25 , landing speed v 0 = 124 km/h and wing span b = 16.28   m. As mentioned above, the number of lift propellers n was chosen to be 10 per half wingspan. Figure 6 shows the weight distribution of the DEP system parts for the considered area ratios in relation to the original wing.
Figure 6a shows the increase in weight for wings with smaller area. This is due to the required higher thrust or higher induced velocity value to achieve the required lift. Moreover, fewer propellers on the leading edge of the wing will increase the weight of the overall DEP system, as shown in Figure 6b. This is due to the fact that a smaller number of propellers means a larger propeller area and therefore a higher thrust or power for the required induced speed. The resulting values corresponding to a wing configuration with 20 propellers are shown in Table 2 and Table 3.

3. Aerodynamic and Structural Aspects of the Wing

This chapter presents the computational procedures for determining the aerodynamic characteristics and mass of the wing. Considering that the work concerned a conceptual study, fast computational methods were used which provided results with adequate accuracy in a relatively short time.

3.1. Aerodynamic Characteristics—Lifting Line Theory

To calculate the aerodynamic characteristics of the wings, the lifting line theory was chosen. Its modified form allows the use of nonlinear profile characteristics to estimate relatively accurately the total resistance of the wing, which is composed of induced, frictional, and pressure parts [26]. The basic idea of the equation describing the flow around a wing with a finite span is based on the Biot–Savart law. Ludwig Prandtl described the vortex scheme around the wing by means of horseshoe-shaped vortices [27] and then defined the calculation of the induced velocity by these vortices by the following relation:
w ( y 0 ) = 1 4 π b / 2 b / 2 d Γ y y 0
where d Γ is the local increment in circulation, w is the local downwash velocity, and y 0 is the spanwise position. For the purpose of determining the downwash velocity, the equation calculating the local lift force based on the local total angle of attack was used. Then the Kutta–Joukowski law was applied to calculate the local circulation:
Γ = 1 2 V · c l ( α ) · c
The point is that the local lift coefficient in this form can be interpolated from the profile characteristics and thus the downwash velocity or lift distribution can be accurately calculated. In addition, once the lift distribution calculation is converged, it is possible to calculate both the induced wing drag, which is a function of lift and downwash velocity, and to interpolate the profile drag, which contains both friction and pressure components. Thus, the wing aerodynamic polar can be calculated relatively accurately [26].
In this work, the software ANSYS Fluent was used and the drag polar and pitching moment coefficient curves were obtained for GA(W)-1 and GA(W)-2 airfoils. Two-dimensional airfoil bodies were imported into an Ansys DesignModeller and were used for a 2D CFD analysis. The domain used was rectangular with an overall height of 30c and width of 35c, where c is the airfoil chord. Mesh was refined in the vicinity of the profile and also in the wake behind the airfoil. Prismatic elements (inflation layer) were used to cover the boundary layer, with first cell thickness 𝑡 = 2.5 × 10⁻⁴ determined by the target 𝑦+ ≈ 30–40. All state variables used a 2nd order discretization, and the SST k-ω model of turbulence was chosen. Mesh size was globally refined to about 66% of the original calculation for the base AOA and it was shown that the result was mesh-independent. Angle of attack was varied as a parameter and the coefficients of the lift, drag, and pitching moment were gathered up to stall angle. These were then used as profile characteristic inputs to the lifting-line theory method.
The profile characteristics were calculated for the Reynolds number corresponding to the cruise regime of the original geometry. The GA(W)-1 and GA(W)-2 profiles were used to maintain the relative thickness of the original wing profiles. As the wing area decreased at a constant span, the root and tip chords changed, and hence, the Reynolds number. A change in the Reynolds number in this regime does not imply a significant change in drag or lift coefficient; therefore, a profile polar corresponding to the cruise regime of the original geometry was used in this study. The effect of the change in Reynolds number on the aerodynamic characteristics was validated using the lifting line theory and CFD calculations for significantly tapered wings, for example with an elliptical planform [26]. Figure 7 shows the velocity field solution for 5° angle of attack for the two profiles investigated.
The results of the wing aerodynamic performance calculations using the lifting line theory are shown in Figure 8. The investigated wing geometries had the same span as the original wing; they differed from each other by having reduced chords in defined proportions. This reduced the total area of the wing. Figure 8a shows that the aerodynamic drag coefficient decreased with decreasing the wing area. The lift and drag coefficients are shown here relative to the area of the original wing. The dash dotted line shows the amount of lift required for cruise mode. The values of aerodynamic drag interpolated for the required lift as a function of wing area are shown in Figure 8b. From the results it can be deduced that the drag of a wing with 65% of the area of the original wing had approximately 20% less drag.
Figure 9 shows the distribution of the lift coefficient and drag force both for the desired lift in cruise mode. Compared to the previous figure, where the coefficients were relative to the original area, it can be seen here that the wing needed higher values of lift coefficients as the area decreased to achieve the required force. The distribution of the drag force shows that this was achieved with a higher aerodynamic efficiency, i.e., a lower drag.

3.2. Wing Structural Design

Based on the calculation of the aerodynamic characteristics of the wings, the design of the wing structure according to the requirements of CS-23 was performed [28]. The result of the wing design was its weight, which is the last piece for comparing flight performance.
The wing design according to the requirements can be divided into two parts. In the first part, the envelope in which the wing must transfer aerodynamic and mass loads is determined. In the second part, the dimensions of the individual control parts are calculated to meet the required loads [29].
The flight envelope was created in accordance with CS 23 regulations, specifically CS 23.333. The design flight envelope was created from the limits of the maneuvering and gust envelope. For the purpose of strength calculations, the values of velocities and loads at each point of the envelope (A–F) were determined. These were mainly design cruising speed, design dive speed, design maneuvering speed, design speed for maximum gust intensity, maneuvering load factors, and gust load factors. The determination of the flight envelope parameters was made from the lifting line method results. Figure 10a shows the wing lift curve from which the lift curve pitch (dashed line) and stall speeds based on the maximum and minimum lift coefficients were determined. The final shape of the design envelope is shown in Figure 10b.
In the second part of the wing weight calculation, the structural design was performed to cover the entire design envelope. The first step was to determine the loads from the forces and moments on the wing for the specified envelope points. From the distribution of aerodynamic forces and moments calculated using the lifting line theory, the shear forces, the bending, and the torque moment were calculated at selected points of the envelope. The effect of inertial loads was considered. From the calculated operational loads, those with the highest value were selected and multiplied by a safety factor of 1.5 to determine the numerical load (CS 23.303 criteria).
The last step is the dimensioning of the individual structural elements of the wing. In this case, the identical structural arrangement was used for all the wings, a double spar wing with two cells where the general geometry and equation for shear flow calculation was considered [26]. The thickness of the structural elements was not designed to the strength limit of the chosen material, but its stability according to the direction of stress was considered. Specifically, the flanges were checked for compressive stability [30] and the spars with plates were checked for shear stability of the plates [31,32].
The structural design of the wing procedure can be divided into three basic points:
  • The distribution of ribs along the span;
  • Design of the flanges transmitting the bending moment and calculation of the elastic axis;
  • The design of the spar and cover that transmit the combination of the torque and the shear force, where the torque is equal to the sum of the fluxes of the individual cells multiplied by their area and the shear force of the individual spar is divided according to the ratios of the bending stiffnesses.
The total weight was calculated by summing the volumes of all designed parts and multiplying this by the density of the selected material. This was aluminium alloy AW-2024 with a density of 2770 [kg.m−3].
Figure 11 shows the shear force distribution for the two calculated wings, (a) is the original wing and (b) is the wing reduced to 65% of the original area. It can be seen that when the area of the wing, or its construction height, was reduced, there was an increase in the shear force that the spar must carry.
Figure 12 then shows a comparison of the weights of the wing parts for the calculated wing area ratios. There was a noticeable decrease in the weight of the entire wing cover while the spars and flanges had an almost constant weight. It follows that the change in weight is directly related to the wing area.
This completes the preliminary calculation of the mass of the basic structural parts of the wing. It did not take into account the high-lift devices, fuel tank, or landing gear. The calculation also did not consider the effect of the weight of the DEP system such as engines, propellers, controllers, and cables. However, this was on the safe side of the calculation because the wing was aerodynamically stressed for lift and the weight of the wing reduced this load. In addition, the sum of the masses of the calculated parts, the fuel mass, the wing mass, and the DEP system, was almost equal to the original solution.

4. Flight Performance

The main objective of this work was to investigate how an aircraft with a distributed propulsion wing can reduce fuel consumption compared to an aircraft with a conventionally designed wing. For this purpose, the flight performance of the aircraft was calculated for all wings under investigation.
A simulated typical flight mission consists of three parts: climb, cruise mode, and descent. The climb was calculated for a defined climb rate v c l i m b   and cruise speed v c r u i s e . In the cruise regime, the fuel consumption was determined by calculating the required lift for a given mass and dynamic pressure, and then interpolating the wing drag to calculate the required power for the entire aircraft. Here, the parasitic drag coefficient c D f u s of the fuselage and tail surfaces was considered as discussed in the previous section. In addition, for distributed propeller wings, the drag of the pylons and nacelles c D D E P for distributed engine was considered, which, similar to the fuselage drag, was calculated in the openVSP program. The descent mode was considered such that the aircraft was gliding at a maximum glide ratio and the engine was at an idle mode, i.e., zero fuel consumption. The whole calculation was iterative and took into account the fuel loss on the total weight of the aircraft [26]. The required thrust of the aircraft in climb and cruise regime was further increased by the propeller efficiency and then the required power was calculated. For a steady flight, fuel consumption was determined from the specific fuel consumption of the turbine engine m ˙ t u r b . The flight performance variables are listed in Table 4.
Moreover, a study was carried out on the effect of range of the flight on the change of fuel consumption and its possible percentage savings. Simulations of flight over shorter distances were carried out. The cruise speed, flight altitude, and climb rate were considered the same for all missions. The only parameter that varied for different ranges was the initial weight. For the maximum range, i.e., 3417 km, a fuel consumption of approximately 1000 kg was calculated. If we consider a range of 2000 km, the consumption will be approximately half of the consumption at original range and the initial weight of the aircraft is reduced by this difference, thus simulating the real case of a flight mission. Alternate fuel was not considered in this study.
The results of the aircraft mission simulation for the above declared conditions, including the calculated key parameters of all wing variants, are presented in Table 5. The items listed are the wing area ratio relative to the original wing k, the wing area S, the wing root croot and tip ctip chord, the aerodynamic drag of the aircraft D, the wing weight mWing, the weight of the DEP system mDEP, and the weight of fuel consumed mFuel.
The results of such simulations are shown in Figure 13. On the horizontal axis are plotted the values of the sum of the weights that are calculated in the simulation, i.e., the weight of the DEP system, the weight of the wing, and the weight of the fuel consumed. This sum of weights was relative to the original solution, to the aircraft with the original wing size without the DEP system. The vertical axis shows the percentage difference in fuel consumption between the aircraft with DEP and the original aircraft. The individual-colored curves correspond to a specific flight range, the black cross with the value 100/100 corresponds to the reference aircraft without DEP, and the dashed curves connect the solutions for the selected wing area. From the chart the fuel economy can be read directly together with total weight for a given wing size and range.
Note that all solutions with no less than 85% wing area achieved no fuel savings compared to the reference aircraft. This is due to the fact that in these wings the benefit of lower wing drag is not outweighed by the increase in drag due to the DEP system’s nacelles c D D E P . On the other hand, the wing with the smallest area had the lowest fuel consumption, but at shorter ranges the weight of the calculated parts increased compared to the reference aircraft. This is due to the fact that the small wing has a large weight of the DEP system and at short ranges the fuel economy is not as great which implies that the weight of the DEP system becomes the more dominant part. Therefore, the percentage increase in weight relative to the reference aircraft is the fastest with shorter range for the smallest wing.
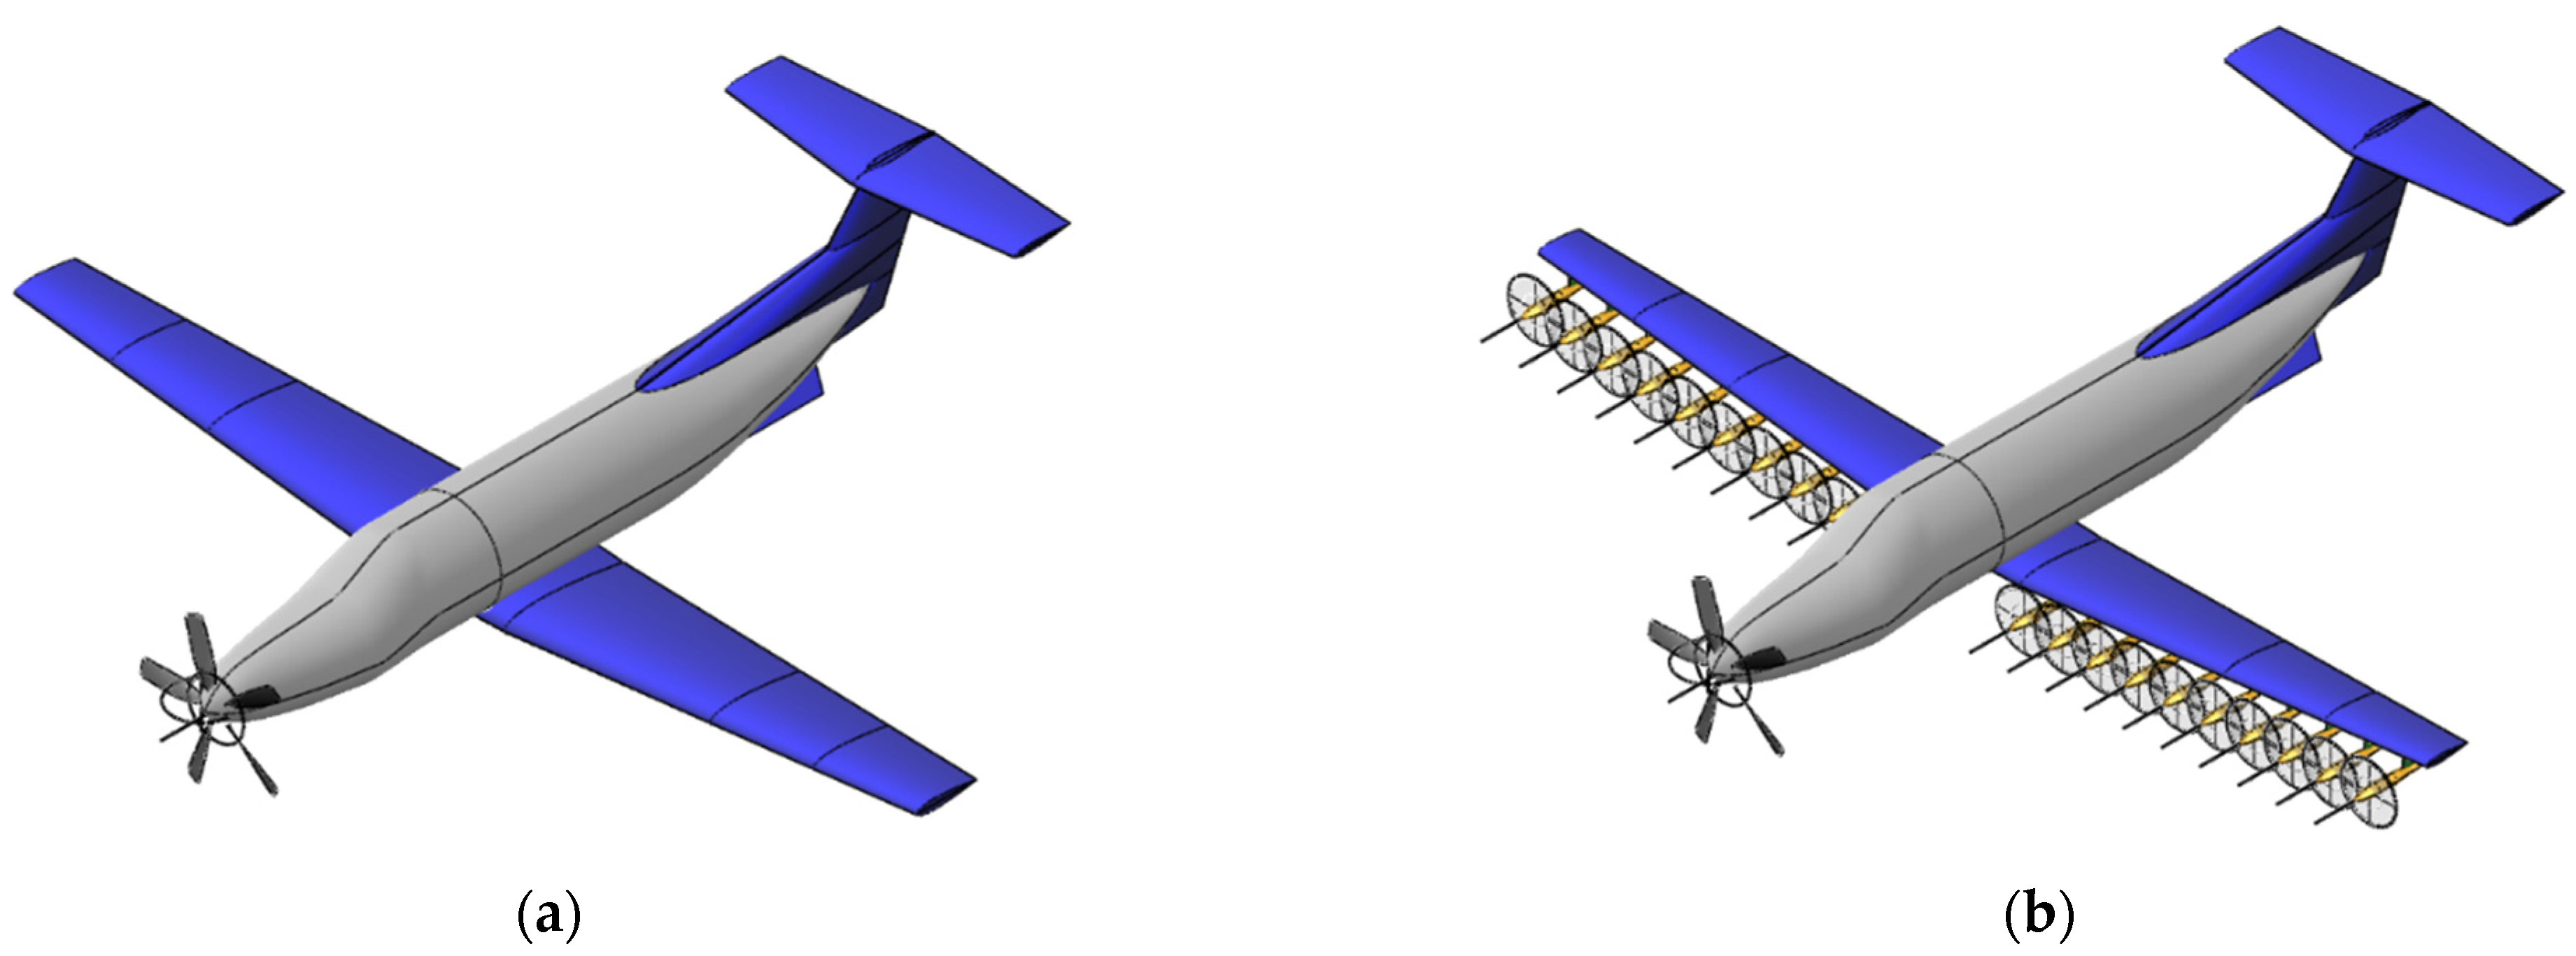
Figure 14 shows the geometry of the reference airplane with the existing wing area and the airplane with the wing area reduced to 65% of the original area. Distributed propellers with overlap were placed so that the leading edge of the wing was completely covered.

5. Conclusions

Current trends in aerospace research and development are primarily motivated by reducing fuel consumption and thus greenhouse gas emissions. This study demonstrated how distributed propulsion can help these efforts. This is a preliminary design that took into account the effect of wing size on the aerodynamic characteristics and structural design of the wing, and also considered the weight calculation of the electrical parts of the DEP system. From the flight performance calculation, it can be observed that an aircraft with DEP and a wing area reduced to 65% relative to the reference wing can reduce fuel consumption by about 6%. Note that this is a relatively quick design method with low fidelity and for further steps it would be necessary to perform calculations using more accurate methods.
One other option to increase aerodynamic efficiency and thus reduce fuel consumption is to use a wing-tip propeller to reduce the effect of induced drag. The calculation of total fuel consumption is also significantly affected by the drag of the engine nacelles. These are calculated using an empirical method and it would be advisable to perform at least a more accurate CFD calculation, ideally optimizing the shape and position of the nacelles. Further improvements in flight performance could be achieved by using high-lift propellers for the DEP system, thus reducing the required power while maintaining the required propeller induced velocity. The voltage value of the electrical system is another factor that significantly affects the overall weight of the DEP system. Appropriate selection of motors or inclusion of DC/DC converters could lead to a noticeable reduction in cable weight. On the other hand, the DEP system does not include the cooling of power losses dissipated as heat. This is because the use of DEP is assumed to be on the order of units of minutes. A detailed study of the electrical parts could identify the need for a thermal management system and thus increase the predicted mass. In spite of all these problems, it can be concluded that DEP is a promising direction of development in aeronautics that will make it possible, using available technologies, to reduce fuel consumption.

Author Contributions

P.H. defined the DEP design process, performed the LTT calculation and analyses, wing structural computation, mass estimation and flight performance. D.D. calculated airfoil characteristics and implemented several supporting calculations. N.Ž. solved CFD calculation of wing segment to verify a design process. J.K. supervised all of actions performed. All authors have read and agreed to the published version of the manuscript.

Funding

These research activities were carried out from the EU Operational Programme Research, Development and Education, and from the Center of Advanced Aerospace Technology (CZ.02.1.01/0.0/0.0/16_019/0000826), Faculty of Mechanical Engineering, Czech Technical University in Prague.

Conflicts of Interest

The authors declare no conflict of interest.

References

  1. Lukasch, B. Zur wissenschaftsgeschichtlichen Einordnung des Buches. In Otto Lilienthal. Klassische Texte der Wissenschaf; Lukasch, B., Ed.; Springer Spektrum: Berlin/Heidelberg, German. [CrossRef]
  2. European Commission. Flightpath 2050. Europe’s Vision for Aviation, Maintaining Global Leadership and Serving Society’s Needs. In Report of the High-Level Group on Aviation Research; Publications Office of the European Union: Luxembourg, Germany, 2011; ISBN 978-92-79-19724-6. [Google Scholar]
  3. Hoelzen, J.; Liu, Y.; Bensmann, B.; Winnefeld, C.; Elham, A.; Friedrichs, J.; Rauschenbach, R.H. Conceptual Design of Operation Strategies for Hybrid Electric Aircraft. Energies 2018, 11, 217. [Google Scholar] [CrossRef] [Green Version]
  4. Hyun, D.K.; Perry, T.A.; Ansell, J.P. A Review of Distributed Electric Propulsion Concepts for Air Vehicle Technology. In Proceedings of the 2018 AIAA/IEEE Electric Aircraft Technologies Symposium, AIAA Propulsion and Energy Forum, (AIAA 2018-4998), Cincinnati, OH, USA, 9–11 July 2018. [Google Scholar] [CrossRef] [Green Version]
  5. Orefice, F.; Nicolosi, F.; Della Vecchia, P.; Ciliberti, D. Aircraft Conceptual Design of Commuter Aircraft including Distributed Electric Propulsion. In Proceedings of the AIAA AVIATION 2020 FORUM, Virtual, 15–19 June 2020. [Google Scholar] [CrossRef]
  6. Eisenhut, D.; Moebs, N.; Windels, E.; Bergmann, D.; Geiß, I.; Reis, R.; Strohmayer, A. Aircraft Requirements for Sustainable Regional Aviation. Aerospace 2021, 8, 61. [Google Scholar] [CrossRef]
  7. Biser, S.; Atanasov, G.; Hepperle, M.; Filipenko, M.; Keller, D.; Vechtel, D.; Boll, M.; Kastner, N.; Noe, M. Design Space Exploration Study and Optimization of a Distributed Turbo-Electric Propulsion System for a Regional Passenger Aircraft. In Proceedings of the AIAA Propulsion and Energy 2020 Forum, Virtual, 24–28 August 2020. [Google Scholar] [CrossRef]
  8. Moore, K.R.; Ning, A. Distributed Electric Propulsion Effects on Existing Aircraft Through Multidisciplinary Optimization. In Proceedings of the 2018 AIAA/ASCE/AHS/ASC Structures, Structural Dynamics, and Materials Conference, Kissimmee, Florida, 8–12 January 2018. [Google Scholar] [CrossRef] [Green Version]
  9. Courtin, C.; Hansman, R.J.; Drela, M. Flight Test Results of a Subscale STOL Aircraft. In Proceedings of the AIAA Scitech 2020 Forum, Orlando, FL, USA, 6–10 January 2020. [Google Scholar] [CrossRef]
  10. Litherland, B.L.; Patterson, M.D.; Derlaga, J.M.; Borer, N.K. A Method for Designing Conforming Folding Propellers. In Proceedings of the 17th AIAA Aviation Technology, Integration, and Operations Conference, Denver, CO, USA, 5–9 June 2017. [Google Scholar] [CrossRef] [Green Version]
  11. McCormick, B.W. Aerodynamics of V/STOL Flight, 1st ed.; Academic Press: New York, NY, USA, 1967; ISBN 10 0124823505. [Google Scholar]
  12. Serrano, J.R.; García-Cuevas, L.M.; Bares, P.; Varela, P. Propeller Position Effects over the Pressure and Friction Coefficients over the Wing of an UAV with Distributed Electric Propulsion: A Proper Orthogonal Decomposition Analysis. Drones 2022, 6, 38. [Google Scholar] [CrossRef]
  13. McGhee, R.J.; Beasley, W.D. Low-Speed Aerodynamic Characteristics of a 13 Percent Thick Medium Speed Airfoil Designed for General Aviation Applications; NTRS - NASA Technical Reports Server, NASA-TN 1498; 1979. Available online: https://ntrs.nasa.gov/api/citations/19810003507/downloads/19810003507.pdf (accessed on 2 October 2022).
  14. Lange, F.; Rudnik, R. Numerical position optimization of an over-the-wing mounted engine installation. CEAS Aeronaut. J. 2021, 12, 135–146. [Google Scholar] [CrossRef]
  15. Stokkermans, T.C.A.; Usai, D.; Sinnige, T.; Veldhuis, L.L.M. Aerodynamic Interaction Effects Between Propellers in Typical eVTOL Vehicle Configurations. J. Aircr. 2021, 58, 1–19. [Google Scholar] [CrossRef]
  16. Moebs, N.; Eisenhut, D.; Windels, E.; van der Pols, J.; Strohmayer, A. Adaptive Initial Sizing Method and Safety Assessment for Hybrid-Electric Regional Aircraft. Aerospace 2022, 9, 150. [Google Scholar] [CrossRef]
  17. Deters, R.W.; Ananda Krishnan, G.K.; Selig, M.S. Reynolds Number Effects on the Performance of Small-Scale Propellers. In Proceedings of the 32nd AIAA Applied Aerodynamics Conference, Atlanta, GA, USA, 16–20 June 2014. [Google Scholar] [CrossRef] [Green Version]
  18. Patterson, M.D.; Derlaga, J.M.; Borer, N.K. High-Lift Propeller System Configuration Selection for NASA’s SCEPTOR Distributed Electric Propulsion Flight Demonstrator. In Proceedings of the 16th AIAA Aviation Technology, Integration, and Operations Conference, Washington, DC, USA, 13–17 June 2016. [Google Scholar] [CrossRef]
  19. Larrabee, E.E. Practical Design of Minimum Induced Loss Propellers, Paper 790595; Business Aircraft Meeting and Exposition, Society of Automotive Engineers: Warrendale, PA, USA, 1979. [Google Scholar]
  20. Patterson, M.D.; Borer, N.K.; German, B. A Simple Method for High-Lift Propeller Conceptual Design. In Proceedings of the 54th AIAA Aerospace Sciences Meeting, San Diego, CA, USA, 4–8 January 2016. [Google Scholar] [CrossRef] [Green Version]
  21. Plencher, R.M.; Senty, P.; Wickenheiser, T. Propeller Performance and Weight Predictions Appended to the Navy/NASA Engine Program; NTRS-NASA Technical Reports Server, NASA TR TM-83458; 1983. Available online: https://ntrs.nasa.gov/api/citations/19830024539/downloads/19830024539.pdf (accessed on 30 September 2022).
  22. Available online: https://www.mejzlik.eu/technical-data/propeller_data (accessed on 30 September 2022).
  23. E-811 Electric Engine. Available online: https://www.pipistrel-aircraft.com/products/other-products/e-811/#tab-id-2 (accessed on 30 September 2022).
  24. Buticchi, G.; Costa, L.F.; Barater, D.; Liserre, M.; Amarillo, E.D. A Quadruple Active Bridge Converter for the Storage Integration on the More Electric Aircraft. IEEE Trans. Power Electron. 2018, 33, 8174–8186. [Google Scholar] [CrossRef] [Green Version]
  25. Pettes-Duler, M.; Roboam, X.; Sareni, B. Integrated Optimal Design for Hybrid Electric Powertrain of Future Aircrafts. Energies 2022, 15, 6719. [Google Scholar] [CrossRef]
  26. Hospodář, P.; Drábek, A.; Prachař, A. Aerodynamic Design and Strength Analysis of the Wing for the Purpose of Assessing the Influence of the Bell-Shaped Lift Distribution. Aerospace 2022, 9, 13. [Google Scholar] [CrossRef]
  27. Prandtl, L.; Tragflügeltheorie, I. Mitteilung. Nachrichten von der Gesellschaft der Wissenschaften zu Göttingen, Mathematisch-Physikalische Klasse. 1918, pp. 451–477. Available online: https://gdz.sub.uni-goettingen.de/id/PPN252457811_1918 (accessed on 30 September 2022).
  28. EASA. Certification Specifications for Normal, Utility, Aerobatic, and Commuter Category Aeroplanes CS-23: Amendment 3; European Aviation Safety Agency: Cologne, Germany, 2012. [Google Scholar]
  29. Alonso Castilla, R.; Lutz, F.; Jézégou, J.; Bénard, E. Wing Structural Model for Overall Aircraft Design of Distributed Electric Propulsion General Aviation and Regional Aircraft. Aerospace 2022, 9, 5. [Google Scholar] [CrossRef]
  30. Niu, M.C.Y. Airframe Stress Analysis & Sizing, 1st ed.; Technical Book Co: Hong Kong, China; Los Angeles, CA, USA, 1997; ISBN 978-962-7128-07-6. [Google Scholar]
  31. Schildcrout, M.; Stein, M. Critical Combinations of Shear and Direct Axial Stress for Curved Rectangular Panels; NACA Report No. 1928; National Advisory Committee for Aeronautics, Langley Aeronautical Lab.: Langley Field, VA, USA, 1949. [Google Scholar]
  32. Budiansky, B.; Connor, R.W. Buckling Stresses of Clamped Rectangular Flat Plates in Shear; NACA Report No. 1559; National Advisory Committee for Aeronautics, Langley Aeronautical Lab.: Langley Field, VA, USA, 1948. [Google Scholar]
Figure 1. Description of the flow field around the propeller and wing with a description of the freestream airspeed v 0 and propeller-induced velocity on the wing v w .
Aerospace 09 00712 g001
Figure 2. Streamlines on the segment of the flapped wing without (a) and with (b) propeller-induced velocity.
Aerospace 09 00712 g002
Figure 3. Lift coefficient as a function of the angle of attack for both the flap and blown flap configurations; the ratio between the pure flap and the blown flap.
Aerospace 09 00712 g003
Figure 4. Front view of the geometric layout of the half section of the aircraft with distributed propellers in front of the wing and the main characteristic dimensions.
Aerospace 09 00712 g004
Figure 5. Schematic of the series-parallel DEP system arrangement.
Aerospace 09 00712 g005
Figure 6. DEP weight distribution for different wing ratios. Part weight distribution for 10 high-lift propellers per half wingspan (a); total weight of DEP system for various numbers of high lift propellers (b).
Aerospace 09 00712 g006
Figure 7. CFD flowfield of two airfoils with velocity field; GA(W)-1 (a); GA(W)-2 (b).
Aerospace 09 00712 g007
Figure 8. Aerodynamic characteristics of different wing areas; (a) aerodynamic polar, lift, and drag coefficients relative to the original wing area (dashed line) and required lift in the cruise regime (dash dotted line); aerodynamic drag relative to the drag of the original wing as a function of the wing area ratio (b).
Aerospace 09 00712 g008
Figure 9. Lift and drag distribution over semispan wing for cruise regime.
Aerospace 09 00712 g009
Figure 10. The lift curve of the wing (a); flight design envelope (b).
Aerospace 09 00712 g010
Figure 11. Shear force distribution for the original wing (a) and the wing with 65% of original area (b).
Aerospace 09 00712 g011
Figure 12. Weight distribution of wing components for different wing area ratios.
Aerospace 09 00712 g012
Figure 13. Relative fuel consumption for different wing configurations.
Aerospace 09 00712 g013
Figure 14. Geometrical drawing of the original aircraft configuration (a) and aircraft with wing with 65% area and DEP system in landing configuration (b).
Aerospace 09 00712 g014
Table 1. List of DEP components with efficiency and power to weight ratio.
Name of ComponentEfficiency [%]Weight Ratio
Generator 955.8 [kW/kg]
Cable99463 [A.m/kg]
Electronic speed controller9830 [kW/kg]
Electric motor955.8 [kW/kg]
DEP propeller80variant
Table 2. Results of DEP sizing for twenty propellers, geometrical and power variables.
k [–] S [m2]cMAC [m]vw [m/s]TDEP [N]Tcruise [N]PDEP [kW]Pcruise [kW]
0.9525.911.590.90551.44312.524.3212.8
0.924.541.511.861128.43735.448.2180.5
0.8523.181.422.921741.03122.973.9147.4
0.821.821.344.072395.02468.9101.2113.4
0.7520.451.265.333108.01755.9132.078.1
0.719.091.176.733888.4975.4167.441.8
0.6517.721.098.284753.2110.8205.84.5
Table 3. Results of DEP sizing for twenty propellers, mass quantities.
k [–] Generator [kg]Propeller [kg]Electric Motor [kg]ESC [kg]Cable [kg]DEP Total Weight [kg]
0.954.9910.884.410.918.5729.76
0.99.9010.288.761.8017.0047.73
0.8515.179.7513.412.7626.0367.11
0.820.779.2418.373.7835.6587.80
0.7527.118.7823.964.9346.52111.30
0.734.378.3530.386.2558.98138.33
0.6542.267.9437.367.6872.52167.76
Table 4. Flight performance variable.
Cruise propeller efficiency [%]85
Climb   rate   v c l i m b [m.s−1]9.79
Cruise   velocity   v c r u i s e [km.h−1]528
Turbine - PT 6 A - 67   m ˙ t u r b [kg/kWh]0.332
Fuselage   and   tail   drag   c D f u s [–]0.00933
Pylons   and   nacelles   drag   c D D E P [–]0.00131
Maximum take-off weight [kg]4 500
Range [km]3 144
Service ceiling [m]9 144
Table 5. Flight performance of DEP aircraft-fuel consumption.
k [–]S [m2]croot [m]ctip [m]D [kN] 1mWing [kg]mDEP [kg]mFuel [kg]
125.812.251.102.6704407.801012.06
0.9524.522.141.052.7802394.729.761050.32
0.923.232.030.992.7271333.847.731032.5
0.8521.941.910.942.6725320.167.111014.66
0.820.651.800.882.6216308.787.80997.11
0.7519.361.690.832.5702293.7111.30979.58
0.718.071.580.772.5181280.5138.33962.46
0.6516.781.460.722.4675267.0167.76945.65
1 drag force interpolated for required lift in cruise regime.
Publisher’s Note: MDPI stays neutral with regard to jurisdictional claims in published maps and institutional affiliations.

