Article

Effects of Asymmetric Vane Pitch on Reducing Low-Engine-Order Forced Response of a Turbine Stage

1
School of Energy and Power Engineering, Beihang University, Beijing 100191, China
2
Jiangxi Research Institute, Beihang University, Nanchang 330096, China
*
Author to whom correspondence should be addressed.
Aerospace 2022, 9(11), 694; https://doi.org/10.3390/aerospace9110694
Submission received: 5 September 2022 / Revised: 28 October 2022 / Accepted: 2 November 2022 / Published: 7 November 2022
(This article belongs to the Section Aeronautics)

Abstract

:
Asymmetric vane pitch is a key technique to suppress the forced response of downstream rotor blades. To address the problem of low-engine-order (LEO) excitation with high amplitude under an asymmetric configuration (half-and-half layout) widely recognized in the previous literature, we first apply the in-house computational fluid dynamics code Hybrid Grid Aeroelasticity Environment to perform full-annulus unsteady aeroelasticity simulations of the turbine stage, comparing the resonance response of rotor blades on different asymmetric configurations and analyzing the flow field at the vane exit, as well as the excitation force, modal force, and maximum vibrational amplitude on the rotor blades. Second, we reveal that the potential field of the vane row is the main source of the LEO excitation caused by asymmetric configuration on rotor blades, the vane wake and potential field jointly determine the LEO excitation strength of rotor blades, and the vane pitch difference Δ S can be used to regulate the strength of the LEO excitation. Finally, based on an in-depth understanding of flow physics under an asymmetric configuration, a more preferable and effective asymmetric configuration (non-half two-segment layout) is proposed. Our findings demonstrate that, with the proposed asymmetric configuration, the amplitude of the vane passing frequency was reduced by 48.32% compared to the uniform configuration; furthermore, the maximum vibrational amplitude of the three-nodal-diameter response of the rotor blade at the three-engine-order crossing decreased by 45.49% compared to the half-and-half layout. The non-half two-segment layout also significantly improves upon the half-and-half layout in terms of aerodynamic performance. The results presented in this paper provide a good theoretical basis for reducing blade vibration by applying asymmetric vane pitch in engineering practice.

1. Introduction

The safe operation of aero engines may be compromised by the forced response of blades in the turbomachinery, where the blade is driven by a periodic external force. The rotor blade is mainly forced by aerodynamic disturbances such as the potential fields of the upstream and downstream vane rows and the upstream wake. More specifically, the wake from the upstream vane contains both entropy and vorticity disturbances and the potential field corresponds to the pressure disturbance in the flow field [1,2]. These aerodynamic disturbances principally affect the rotor blades at a frequency equal to the rotor rotational speed multiplied by the number of vanes, which is generally referred to as the vane passage frequency (VPF). When the frequency of the aerodynamic disturbances coincides with the natural vibrational modes of the blade, resonance may occur, leading to high-cycle fatigue (HCF) failure.
An essential objective in turbomachinery design is to minimize the resonance response of the components [3,4,5,6,7]. Various vibration control techniques were developed to achieve resonance avoidance or risk suppression [8,9,10], mainly including changing blade vibration characteristics [10,11,12], increasing damping [13,14,15], and adjusting the aerodynamic excitation source [16,17,18], among others. The first two are achieved by modifying the structural properties of the blades themselves, which can lead to an increase in weight and redesign costs. Therefore, it is considered better to adjust aerodynamic excitation sources to mitigate the unsteady interactions occurring in the turbine, thus reducing the severity of any resonance that may occur, for which a more preferable method is asymmetric vane pitch, achieved by varying the vane pitches. It can spread energy from the VPF to neighboring frequencies, in order to reduce the resonant response of the VPF excitation.
Asymmetric vane pitch is usually obtained in the following ways, where full-annulus vanes are divided into N segments: (1) The pitch counts in the N segments are equal but the pitches between the N segments are changed by moving the segment along the circumference. This method was earlier applied to military turbojets. Kemp [19] experimentally found that this configuration reduced the amplitude of VPF by 22–46%. However, to achieve a better vibration reduction effect, a large amount of movement is required. Kaneko [20] considered that this was impractical, taking into account the effects on the low-engine-order (LEO) excitation of rotor blades and the surge stability in the compressor. (2) The circumferential angle occupied by each segment is not equal but the pitch counts in each segment are equal. Kemp [19] concluded that the reduction effect of this configuration on VPF amplitude (53–68%) was better than other configurations through theoretical analysis but it was not verified experimentally, due to manufacturing technology-associated limitations. Sun [21] demonstrated that the downstream rotor blade is affected by LEO excitation by monitoring the pressure fluctuation near the leading edge of the rotor blade. However, no further research was carried out on LEO excitation as his study mainly focused on high-engine-order excitation by VPF. (3) The vane pitches are distributed according to a sinusoidal function in the circumferential direction, which is mainly used to solve the flutter problem in the rotor rows [22,23]. Niu [24] attempted to apply this configuration to the vane row in turbines, and found that the amplitude of LEO excitation on the rotor blades was extremely high; however, the generation mechanism of the LEO excitation was not investigated. (4) The circumferential angle occupied by each segment is equal and the pitch counts in N segments are different, which is a widely recognized and used asymmetric vane configuration [25,26,27,28]. Kaneko [20] showed that such a configuration performed best for reducing the vibration stress of the compressor rotor blade when the full-annulus vanes were equally divided into four segments; however, considering the cost of manufacturing and the introduction of additional frequencies, the asymmetric configuration with two equal segments was recommended. Meng [29] concluded that the smaller the segment number N and the smaller the difference of vane counts of different segments, the better the effect of reducing vibration amplitude, as proven through theoretical analysis. Niu [24] further verified that the asymmetric configuration with two equal segments was optimal by investigating the effect of the full-annulus vanes being equally divided into two, four, and six segments on the blade stresses of a single-stage turbine. In addition to studies mostly focused on the optimal asymmetric vane pitch for the vibration amplitude of rotor blades, Niu [24] argued that the wake strength decreases when the vane pitch increases under an asymmetric vane configuration. Monk [30] investigated the flow mechanism of asymmetric vane pitch, and preliminarily analyzed the influence of the asymmetric configuration with two equal segments on the stator wake and the maximum vibrational amplitude of the rotor blades. It was concluded that asymmetric vane pitch greatly reduced the strength of the vortex disturbance for the upstream wake but the study was still limited to reducing the resonant response of the VPF and other high-engine-order excitations. In addition, these studies on flow physics have only considered the vane wake and ignored the effect of the potential field of the vane row.
Overall, the published studies on the effect of asymmetric vane pitch have mainly focused on the resonant response of the VPF and other high-engine-order excitations; although some studies have shown that LEO excitation may be introduced into the rotor blades, no in-depth study of the flow physics has been conducted. In fact, the LEO excitation cannot be neglected in the forced response of rotor blades, as it may excite fundamental blade modes with low nodal diameters (ND), exhibiting higher vibration levels compared to higher-order excitation and increasing the risk of blade failure [31,32,33,34]. Therefore, it is necessary to investigate the generation mechanism of LEO excitation in order to control the negative effects of asymmetric vane pitch. Although a few studies in the literature have carried out preliminary analyses of the flow field, they all focused on the upstream vane wake and ignored the influence of the potential field. As such, the flow physics of the asymmetric vane pitch remains unclear.
Considering the above, we performed full-annulus unsteady aeroelasticity simulations using the in-house computational fluid dynamics (CFD) code Hybrid Grid Aeroelasticity Environment (HGAE) and in-depth studies of the generation mechanism of LEO excitation related to the asymmetric vane pitch were carried out. The main aerodynamic excitation source of the LEO excitation was determined, for the first time, by calculating and analyzing the wake and potential field of the asymmetric vane assembly. Meanwhile, based on an in-depth understanding of flow physics, a more preferable and effective asymmetric vane configuration—called the non-half two-segment layout—is proposed. This configuration regulates the vane pitch difference Δ S between two segments by changing the angle of the two segments, which can effectively reduce the LEO excitation on the rotor blades, achieving the best vibration reduction effect.

2. Model and Methods

2.1. Geometric Model

A numerical study was carried out in a single-stage turbine, which consisted of 16 vanes and 47 blades. The design rotation speed was 15,400 rpm and the main geometric characteristics of the turbine stage are summarized in Table 1.

2.2. Numerical Methodology

The in-house CFD code HGAE was used to simulate the unsteady flow field of the turbine stage. HGAE is a three-dimensional, unsteady, time-accurate, Reynolds-Averaged Navier–Stokes (RANS) solver, adapted for turbomachinery applications in aerodynamic and aeroelastic cases and was validated in various typical cases [35,36,37]. More details can be found in Zheng [38,39].

2.2.1. Aerodynamic Models

The unsteady compressible Navier–Stokes equation is represented in its integral form as:
t Ω U d Ω + Ω ( F c F v ) d A = Ω H d Ω ,
where Ω is the control volume; Ω is its boundary; and d A represents the surface area of an element. For the vector of conservative variables U :
U = [ ρ ρ u ρ v ρ w ρ E ] .
F c and F v are the convective and viscous flux vectors and H is the source term vector:
F c = [ ρ V ρ u V + n x p ρ v V + n y p ρ w V + n z p ρ H V ] + V t [ ρ ρ u ρ v ρ w ρ E ] ,
F v = [ 0 n x τ x x + n y τ x y + n z τ x z n x τ y x + n y τ y y + n z τ y z n x τ z x + n y τ z y + n z τ z z n x Θ x + n y Θ y + n z Θ z ] ,   H = [ 0 ρ f e , x ρ f e , y ρ f e , z ρ f e v + q ˙ h ] .
The governing equations were discretized with a Finite Volume Method for multiblock grids. Convective terms and central differences for the diffusion fluxes were calculated using Roe’s upwind scheme and the Monotone Upwind Scheme for Conservation Law extrapolation [40,41]. The unsteady flow computations were performed using Jameson’s dual time-stepping method for an implicit scheme with 15 sub-iterations [42]. A two-equation Shear Stress Transport model was chosen for the calculation [43]. The turbulent intensity at the inlet was 5%.

2.2.2. Structural Model

A linear aeroelastic model was used for the structural model. The global aeroelasticity equations for the structural motion are expressed as:
M x ¨ + C x ˙ + K x = p ( t ) A n
where M , C , and K are the mass matrix, damping matrix, and stiffness matrix, respectively, and x represents the displacement vector. p ( t ) A n is the result of multiplying the surface area and unit normal vector by the instantaneous blade surface pressure.
Forced response analysis can be performed in different ways [44,45], such as the fully coupled and uncoupled aeroelastic methods. The uncoupled aeroelastic method, considering the unsteady flow and the blade motion independently, simplifies forced response analyses [46,47] and, therefore, was used for the conducted aeroelastic computations.

3. Computational Mesh and Code Verification

To achieve mesh-independent numerical solutions, five different levels of mesh configuration (140 k, 440 k, 1000 k, 3000 k, and 10,000 k)were conducted on a single passage model based on steady-state simulations. The computational domain of the turbine extended one axial chord upstream of the vane and two axial chords downstream of the rotor. A mixing plane was used to transfer data between the rotating and non-rotating blocks. Total pressure (510,000 Pa) and total temperature (1480 K) were defined as the boundary conditions at the vane inlet. The static pressure at the hub of the rotor exit was specified as 237,000 Pa with radial pressure equilibrium. By comparing the mass flow rate (blue line), expansion ratio (black line), and aerodynamic efficiency (red line) for different mesh levels (shown in Figure 1), it was found that the aerodynamic performance of the turbine significantly changed from level 1 to level 3 while, from level 3 to level 5, it essentially remained constant. As a result, in comprehensive consideration of both the accuracy and the computational cost, level 3 was chosen as the computing mesh for the following numerical simulations. There were 1.08 million grid points in a single passage (Figure 2a) and nearly 32 million in the full annulus (Figure 2b). The thickness of the first near-wall cell was 0.001 mm and y + was about 1. A single-stage turbine with an equally spaced vane assembly is used as the baseline configuration, identified as Case0_Baseline.
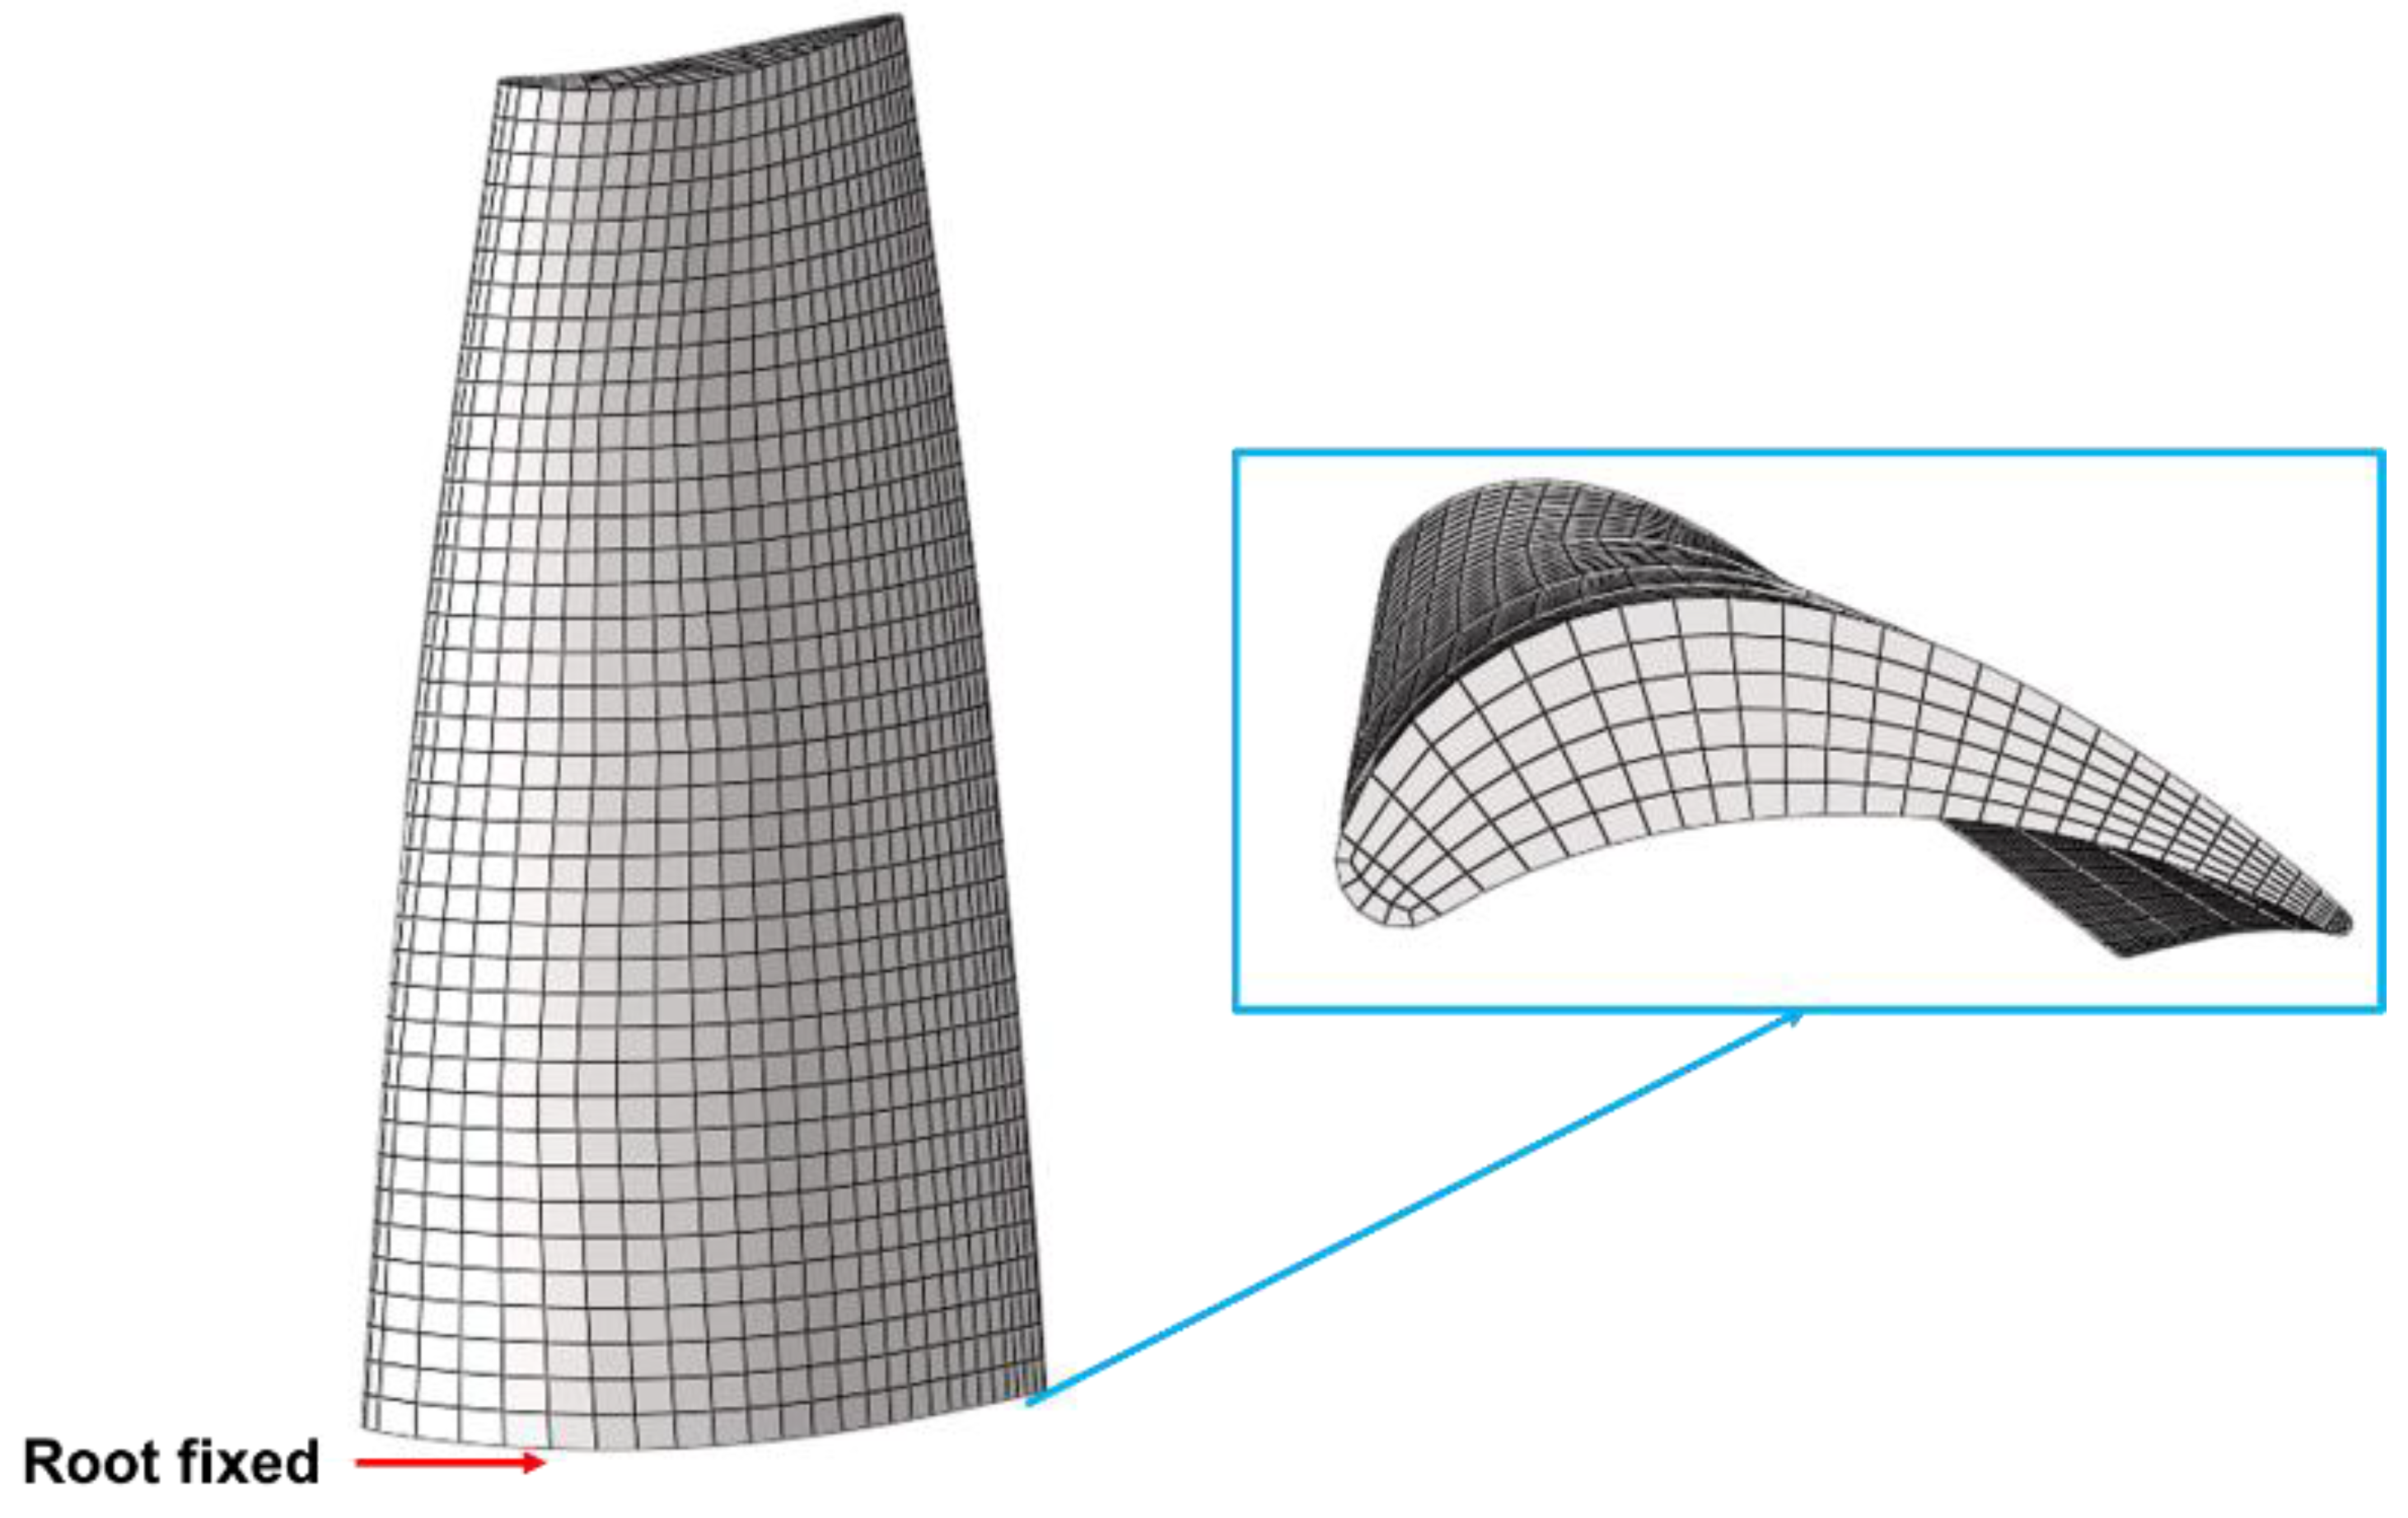
To obtain a finite element (FE) model of the rotor blade, it was discretized by hexahedral cells (Figure 3) with fixed constraints at the blade root. There were 6, 32, and 40 elements in the directions of thickness, chord, and span, respectively. The material properties are detailed in Table 2.
The aerodynamic efficiency and expansion ratio obtained from HGAE were compared to the results from the commercial software (NUMECA), as shown in Table 3. The errors of the aerodynamic efficiency and expansion ratio were 0.378% and 0.165%, respectively, which were within 0.4%. Therefore, the aerodynamic performance obtained by HGAE was in good agreement with the results of NUMECA.
The aerodynamic efficiency is defined as:
η = h t   i n h t   o u t h t   i n h t   i s   o u t ,
where in h t   i n is the total inlet enthalpy; h t   o u t represents total outlet enthalpy; and h t   i s   o u t is the isentropic total enthalpy in the outlet.

4. Asymmetric Vane Configuration (Half-and-Half Layout)

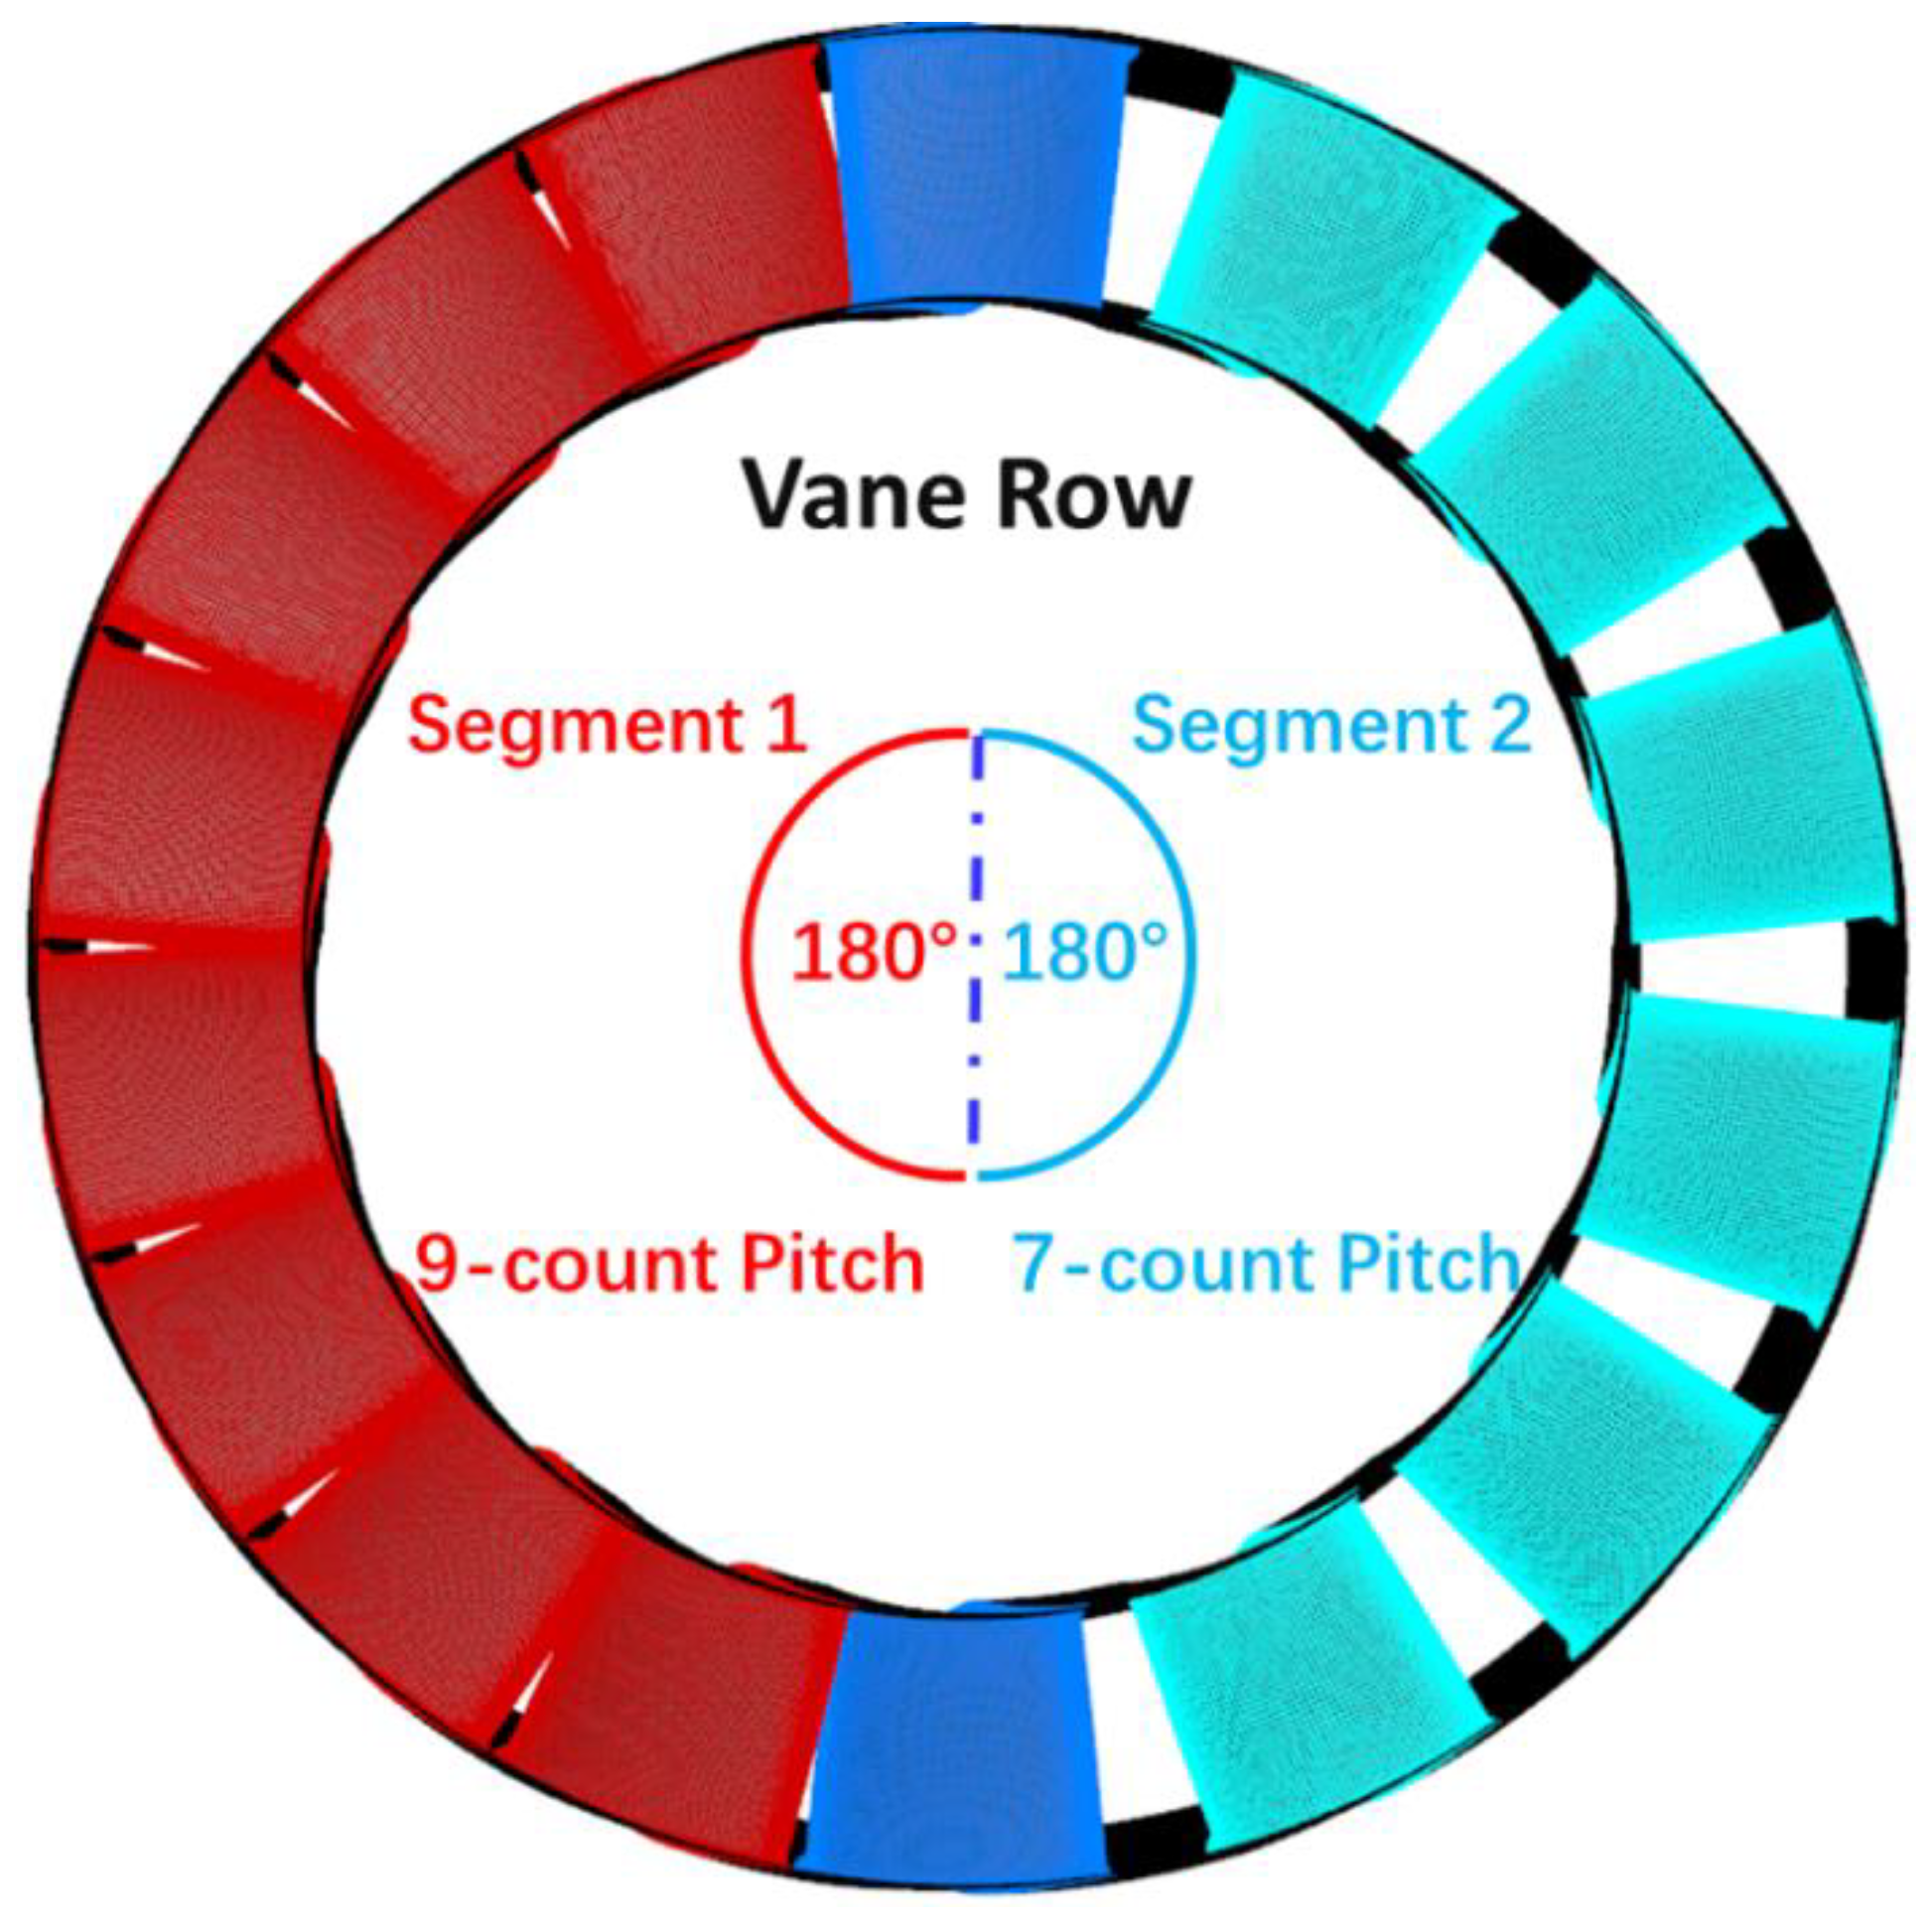
The most widely recognized asymmetric vane configuration in the current literature for reducing the response amplitude at the resonance point of VPF (belonging to high engine orders) is the half-and-half layout. In this configuration, the vane row is divided equally into two segments where the angle of each segment is 180°, as shown in Figure 4. The blue vanes serve as the dividing line, with a nine-count pitch evenly distributed in segment 1 and a seven-count pitch evenly distributed in segment 2. This half-and-half layout was identified as Case1_Asy97.
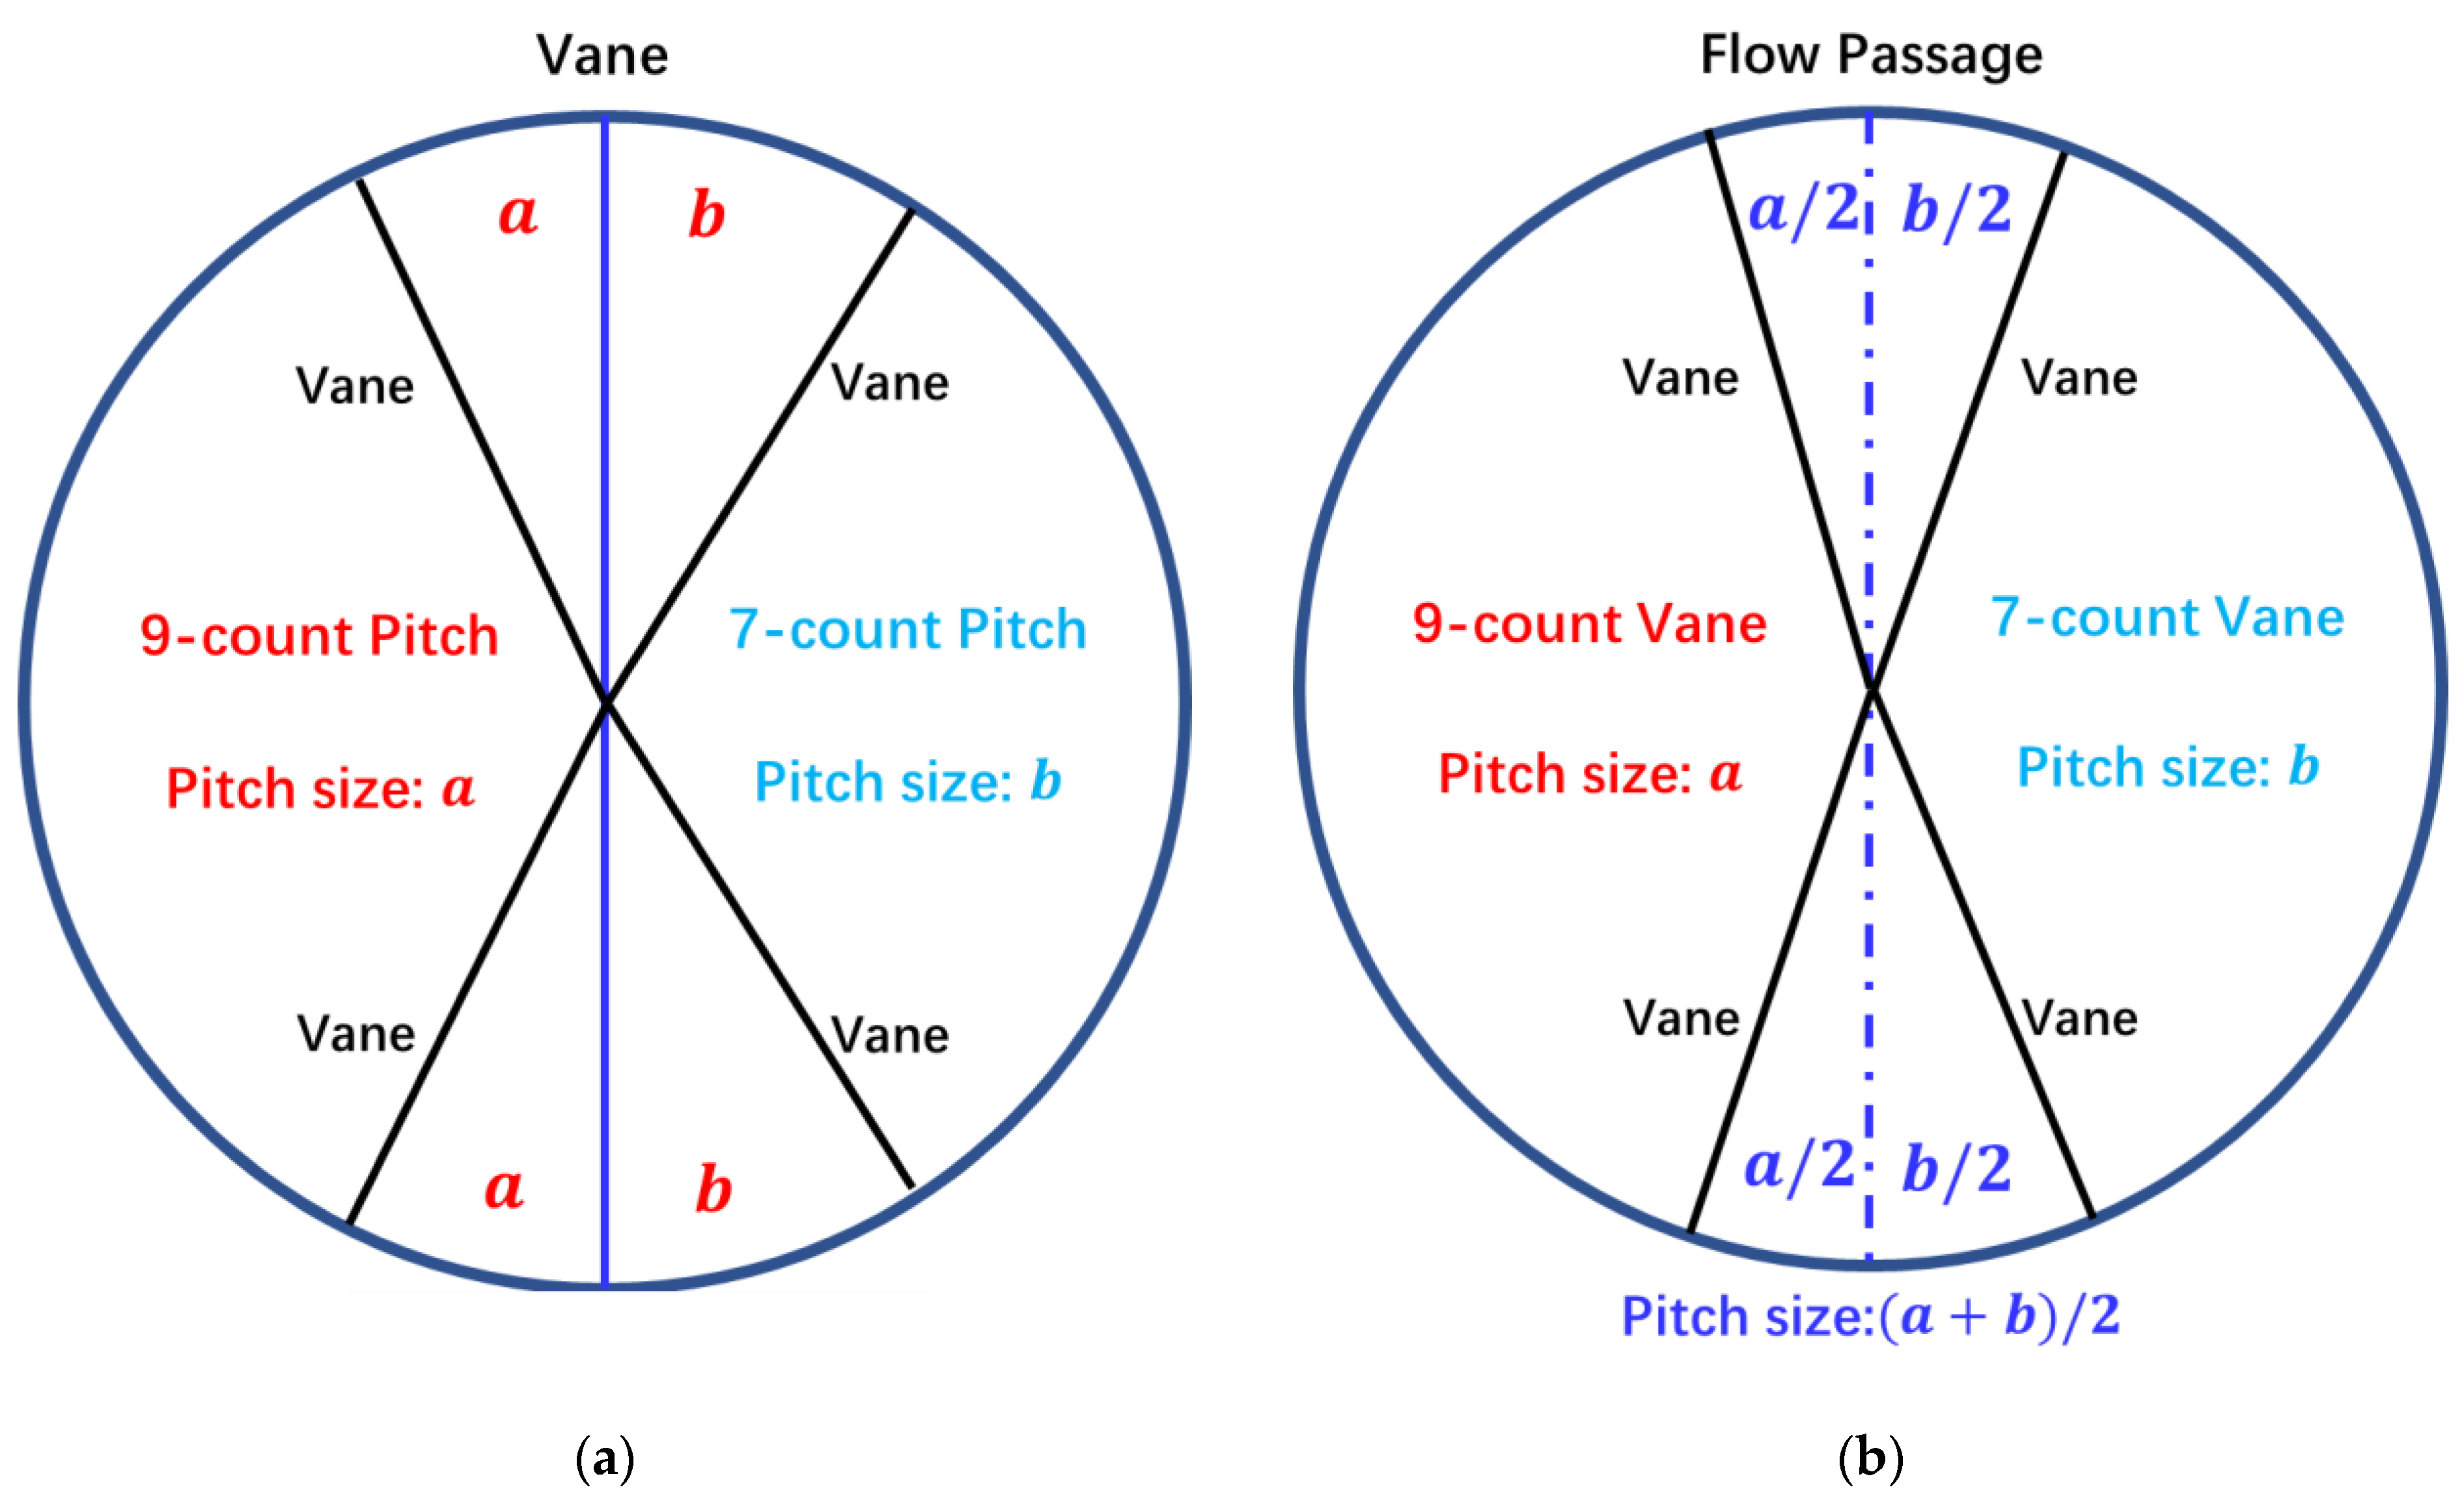
It should be noted that the segmentation method of the asymmetric vane configuration in this paper is based on a pitch count, generating two sizes of pitch ( a and b ), as shown in Figure 5a. However, the segmentation method in some studies [26,30] was based on a vane count, with a dividing line between two segments as the flow passage, which results in three sizes of pitch ( a , b and ( a + b ) / 2 )) being generated (Figure 5b). This does not accurately conform to the intended design with only two sizes of pitch and the effect of the segmentation method on the flow mechanistic analysis induced by asymmetric vane pitch is demonstrated later.

5. Results and Discussion

5.1. Campbell Diagram

A common way to identify the resonance risk of rotor blades is through the use of a Campbell diagram. Such a diagram shows the natural frequencies of the rotor blade as a function of its rotational speed, while the excitation frequency lines are plotted with a constant slope against the rotational speed for various numbers of excitations per revolution (i.e., excitation order; EO). Resonance occurs at the crossings between the natural frequency lines and the excitation frequency lines. Although Campbell diagrams are useful in identifying the operating conditions where the resonance occurs, they do not provide information on the vibration intensity at the resonance point. Furthermore, it is difficult to avoid all crossings on the Campbell diagram in engineering practice; therefore, it is important to study and accurately predict the response amplitudes of the rotor blades at the resonance point. The Campbell diagram for the turbine stage is shown in Figure 6. The natural frequencies and mode shapes of rotor blades were obtained by finite element analysis (FEA). The natural frequency and the excitation frequency are represented by the black dashed and solid lines, respectively. The crossings of interest that are thoroughly studied in this paper are highlighted by red pentagrams, carried out progressively as the content advances. For the baseline configuration, 16 vane wakes and the potential field lead to 16EO excitation on the rotor blade, which excited the 16ND response of the rotor blade. Therefore, the 16EO excitation line is shown in the Campbell diagram in Figure 6. The 16EO excitation line crosses the second-order modal (M2) of the rotor blade at point A, which is the resonance point of the VPF in Case0_Baseline. The other crossings on the Campbell diagram are the operating conditions for later analysis of the effect of different vane configurations on the resonance response of rotor blades at other resonance points.
To study the interference effects of the vane and rotor rows on the resonance response of rotor blades, full-annulus unsteady aeroelasticity simulations were first carried out at resonance point A. The converged solution of the full-annulus steady computation was used as the initial flow field. The mixing plane was replaced by a sliding plane between the vane and rotor rows. The speed of the resonance point A was 10,535 rpm, the time step for the unsteady computation was about 3.787 × 10 6 s, and 1504 physical time-steps per revolution provided sufficient temporal resolution for the flow field. For forced response analysis, the M2 mode shape of the rotor blade was interpolated onto the aerodynamic mesh, such that blade displacements could be calculated during post-processing.

5.2. Aerodynamic Excitation on Rotor Blades

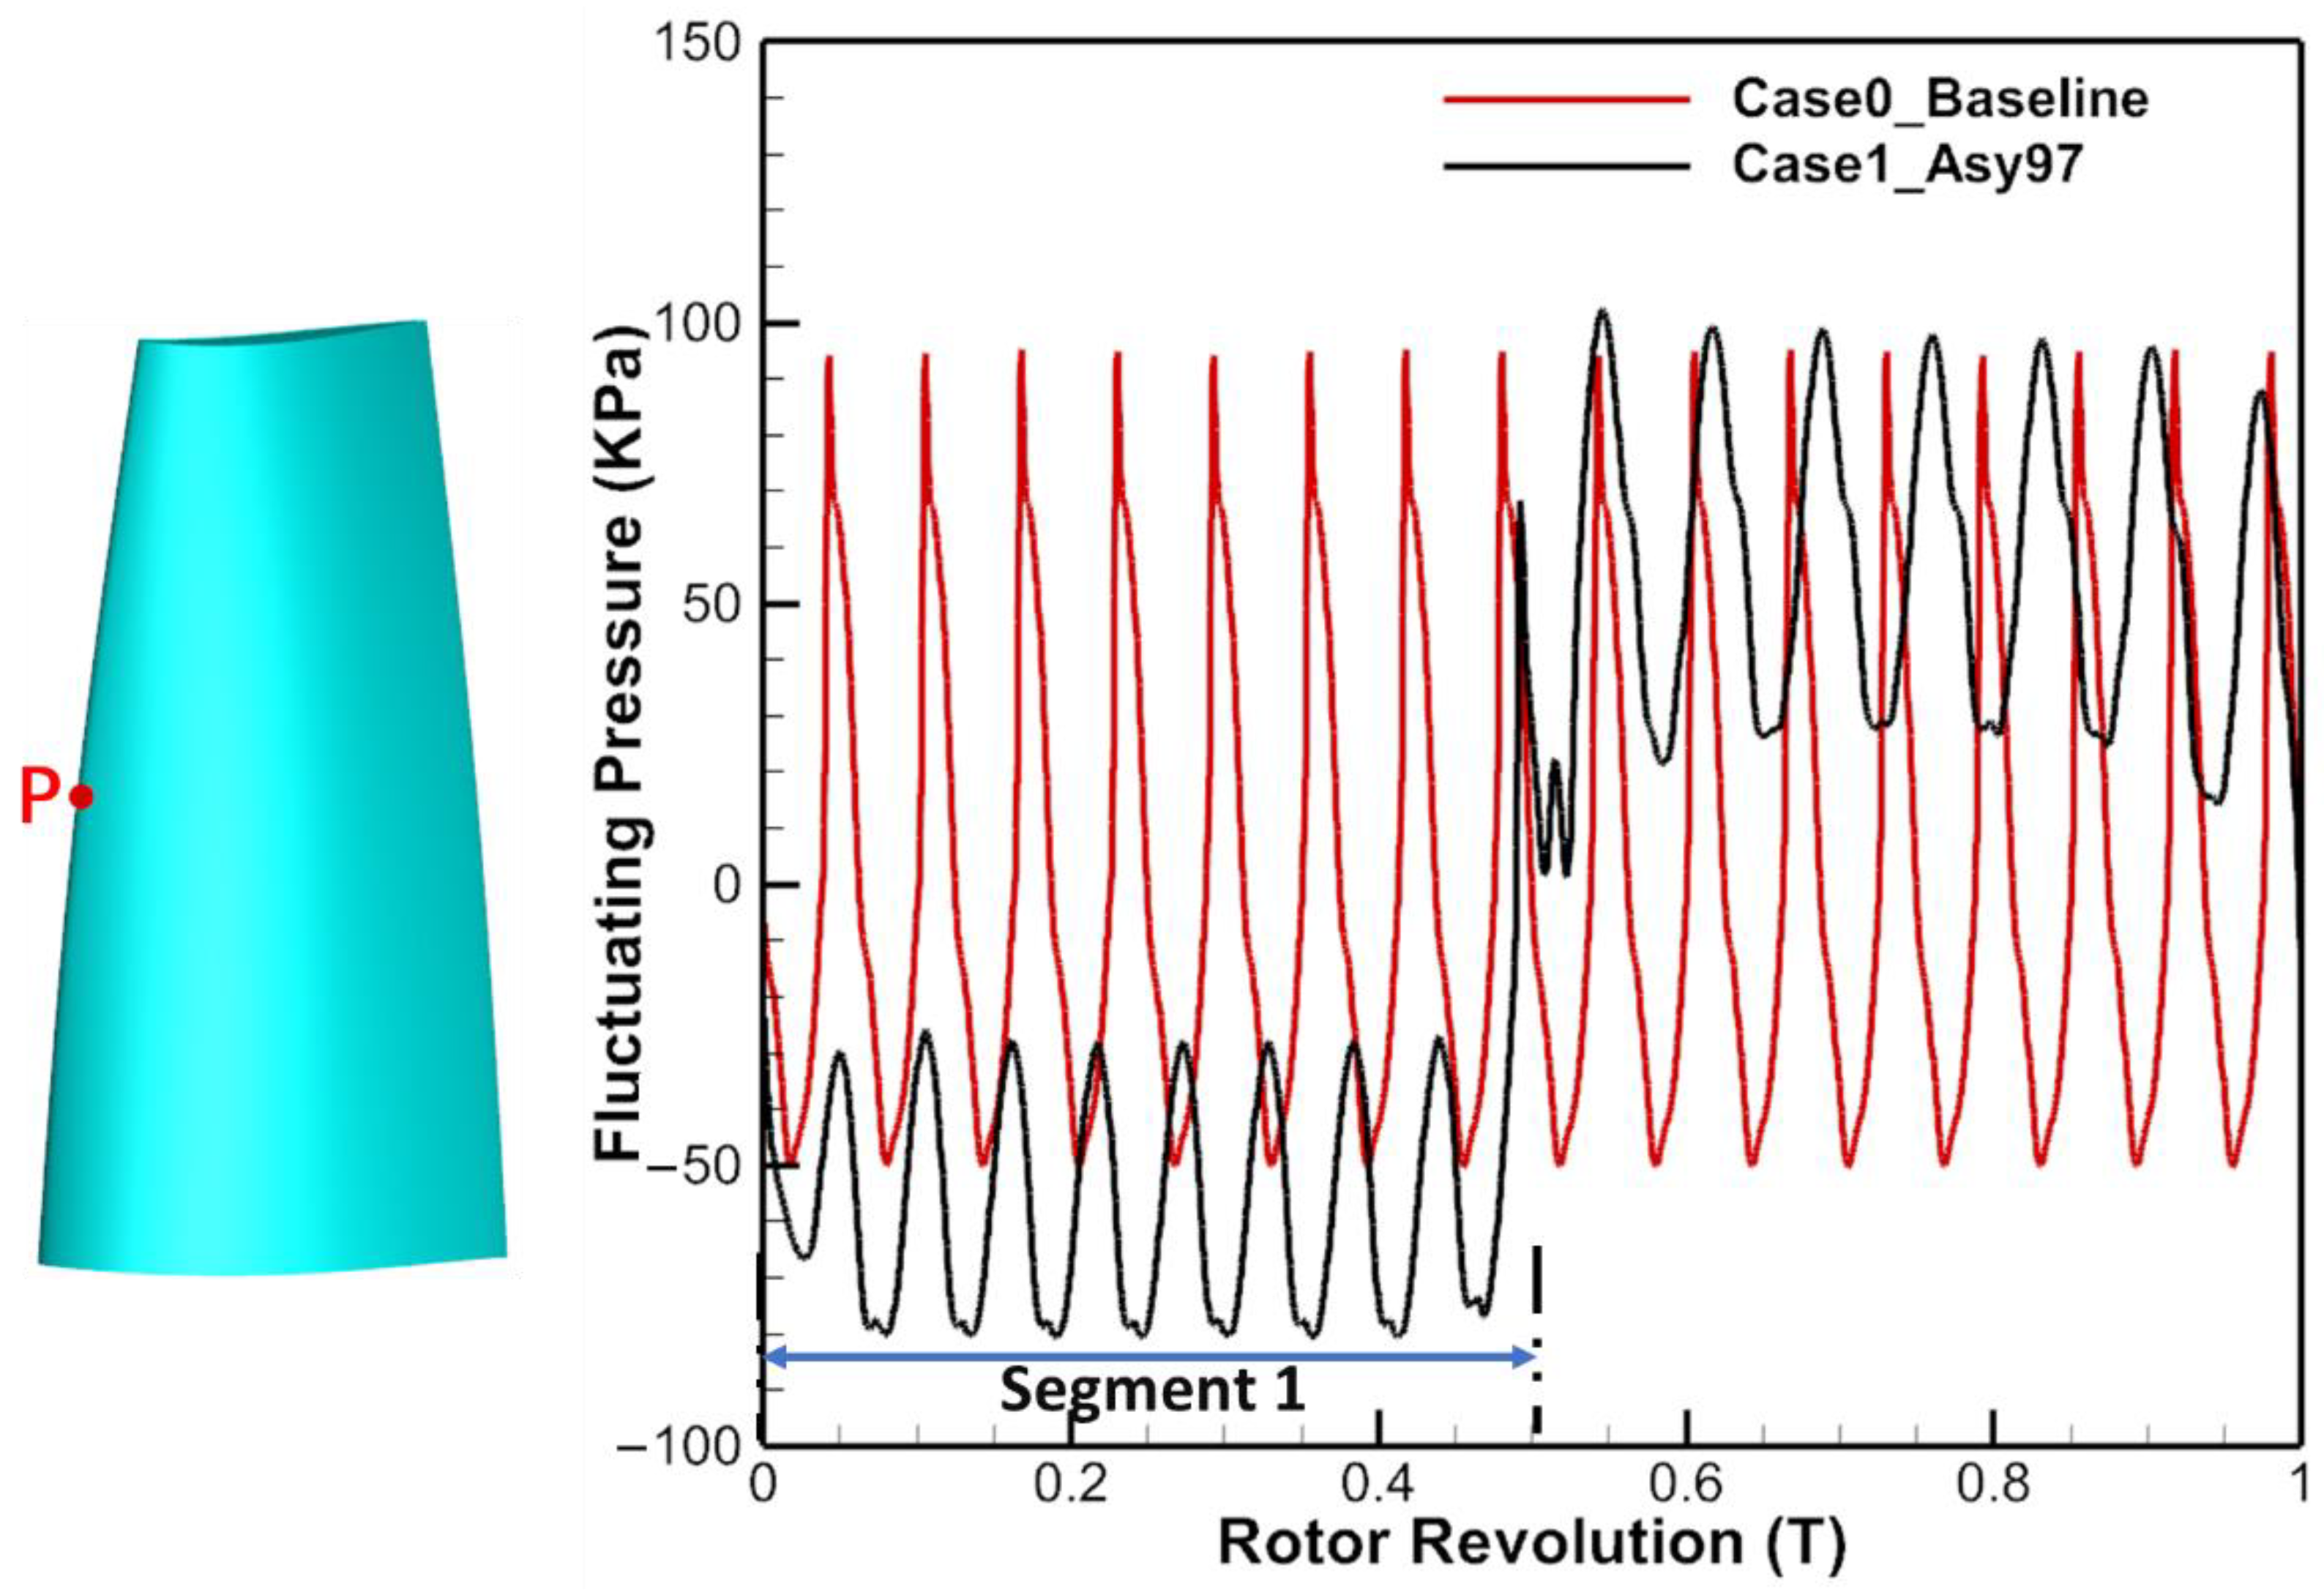
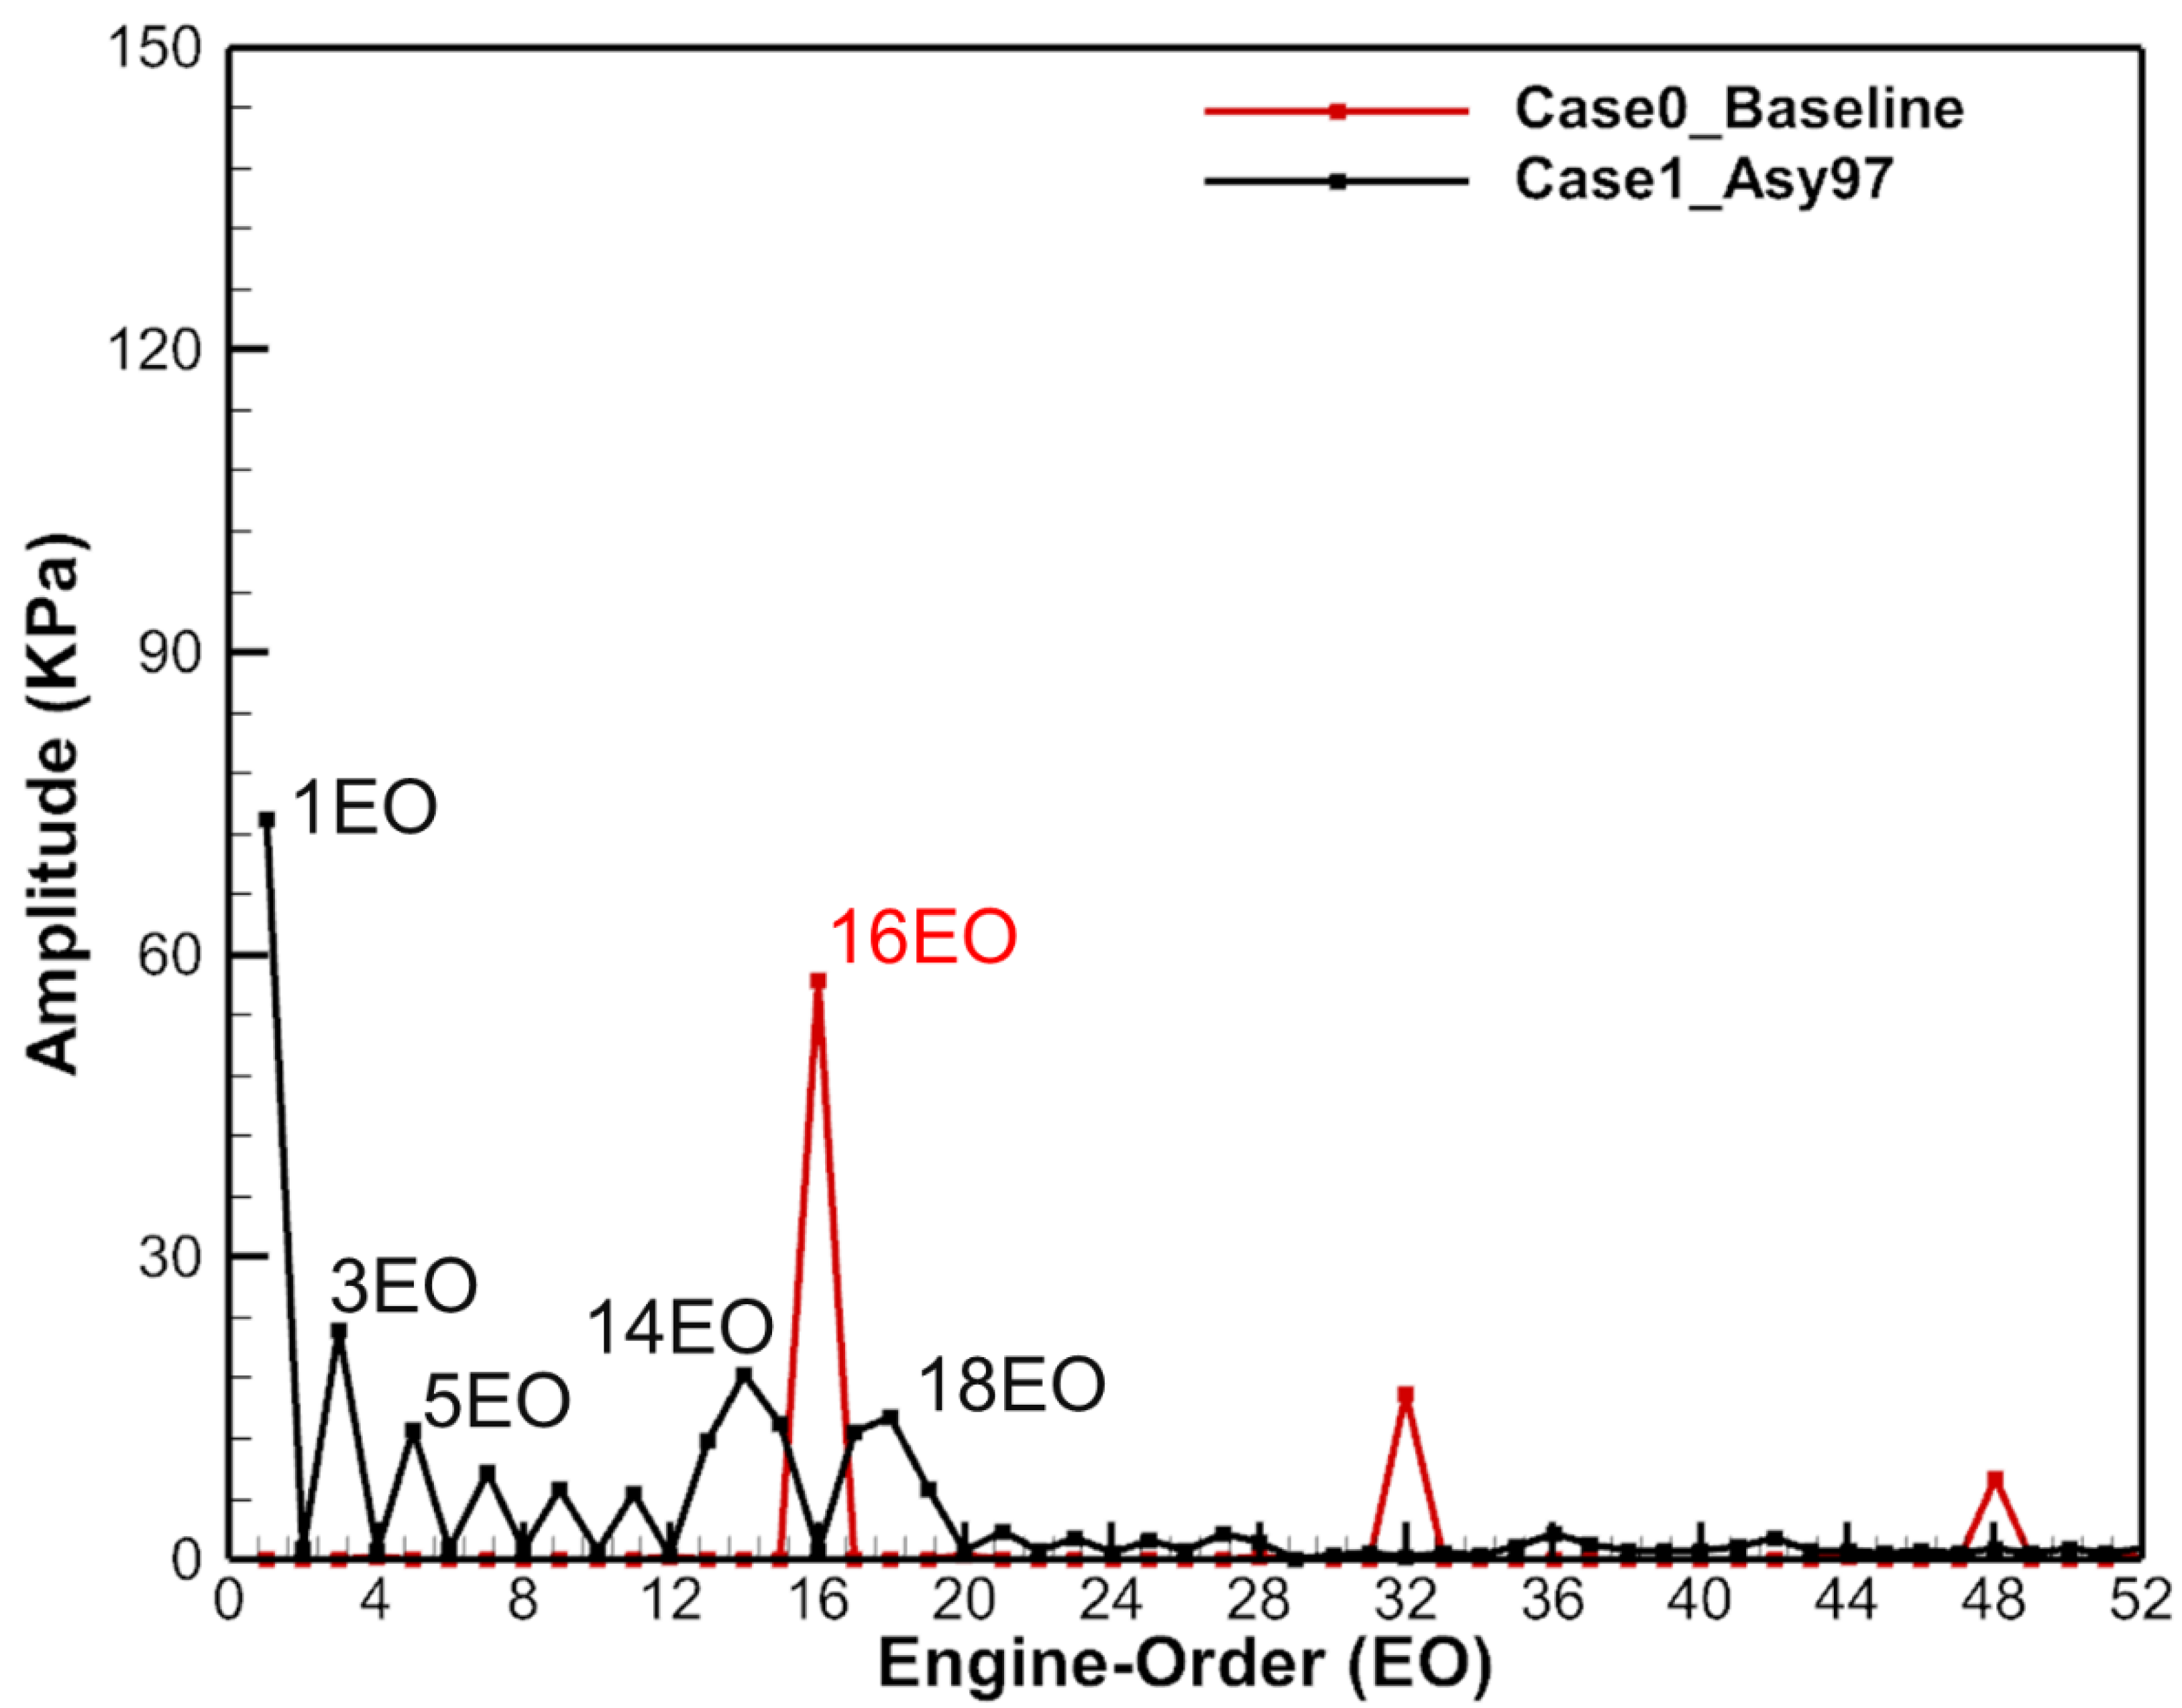
To investigate the effect of the half-and-half layout on the aerodynamic excitation of the rotor blade, point P on the leading edge of the blade suction surface was monitored and the time history of the fluctuating pressure was obtained. The fluctuating pressure reflects the unsteady aerodynamic forces caused by the vane wake and potential field, obtained by the transient pressure by subtracting the time-averaged pressure of the last rotor revolution (T = 0–1). Figure 7 and Figure 8 show the fluctuating pressure in the time and frequency domains, respectively, for one rotation cycle of Case0_Baseline and Case1_Asy97.
As shown in Figure 7, the fluctuating pressure of Case0_Baseline (red line) presented a single form of periodic change with 16 time periods (corresponding to 16 vanes). The fluctuating pressure in Case1_Asy97 (black line) indicated that there were two parts in one rotor revolution, with 9 and 7 periods, respectively. Compared to Case0_Baseline, the average and peak-to-peak amplitudes of the fluctuating pressure were reduced in segment 1 with a small pitch (nine-count pitch). For segment 2 with a large pitch (seven-count pitch), the average amplitude increased and the peak-to-peak amplitude decreased. Therefore, the average amplitude and the peak-to-peak amplitude of the fluctuating pressure on the rotor blade are influenced by the size of the vane pitch.
The 16EO and its multiplicative frequencies in Case0_Baseline (red line) are shown in Figure 8, among which 16EO is the principal harmonic, corresponding to VPF from the vane count. Compared to Case0_Baseline, the amplitude of VPF in Case1_Asy97 (black line) was reduced by more than 98%, as the energy was shifted into neighboring frequencies ((e.g., 14EO, 18EO). However, even at these new frequency components, the excitation amplitudes from the vane wake and potential field were reduced, compared to Case0_Baseline. Therefore, the half-and-half layout is effective in reducing the amplitude of VPF by shifting energy from the VPF of the uniformly spaced vane configuration to neighboring frequencies, as well as reducing the amplitudes at each frequency component. This is the reason why this asymmetric vane configuration was widely recognized in a large number of studies [24,25,26,27].
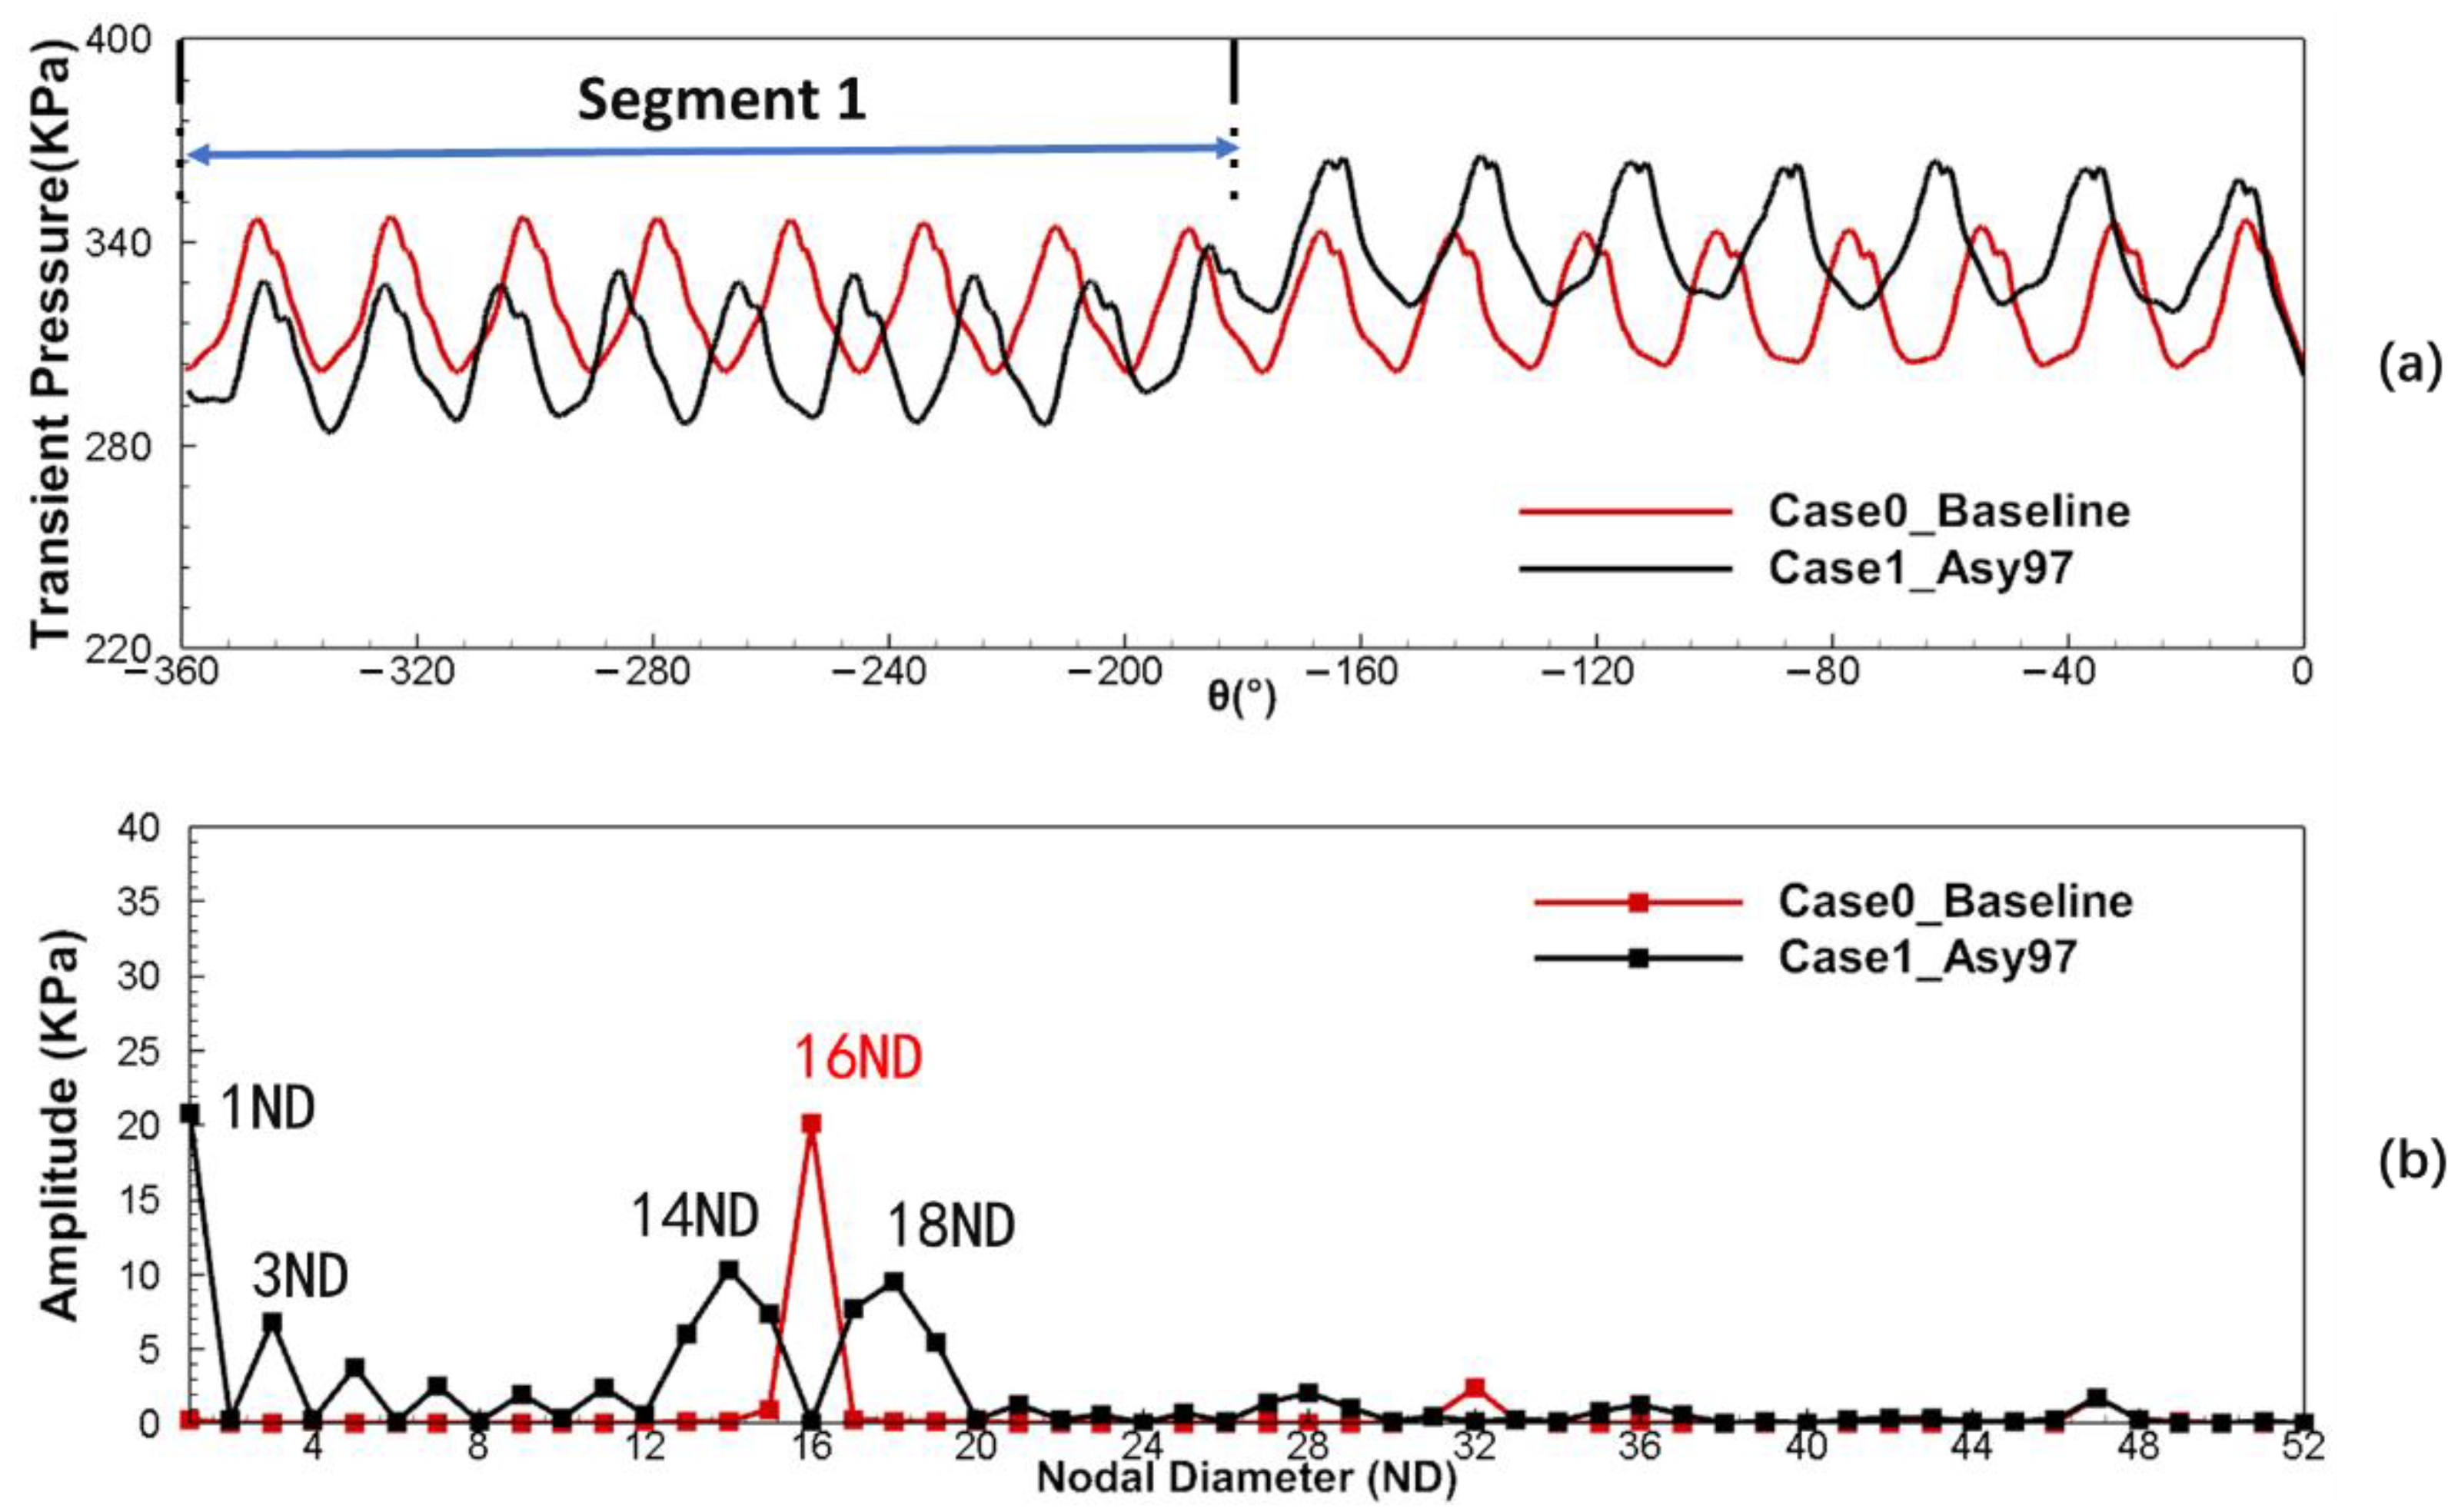
In addition to the adjacent frequencies of VPF (belonging to high engine orders) in Case1_Asy97, there were also some LEO excitations with extremely high amplitude, such as 1EO and 3EO, whose amplitudes reached 129% and 45% of the amplitude of the 16EO excitation in Case0_Baseline, respectively. LEO excitations with such high amplitude cannot be neglected, as they excite the fundamental blade modals with a low nodal diameter (ND), exhibiting higher vibration strengths [31]. The half-and-half layout (Case1_Asy97) could effectively reduce the amplitude of VPF excitation, as demonstrated above, but it also generated the LEO excitations with high amplitude, as highlighted in Figure 8. These LEO excitations arising from asymmetric vane pitch have not been studied in depth in the previous literature. The sources of these LEO excitations are one of the primary concerns of this paper.
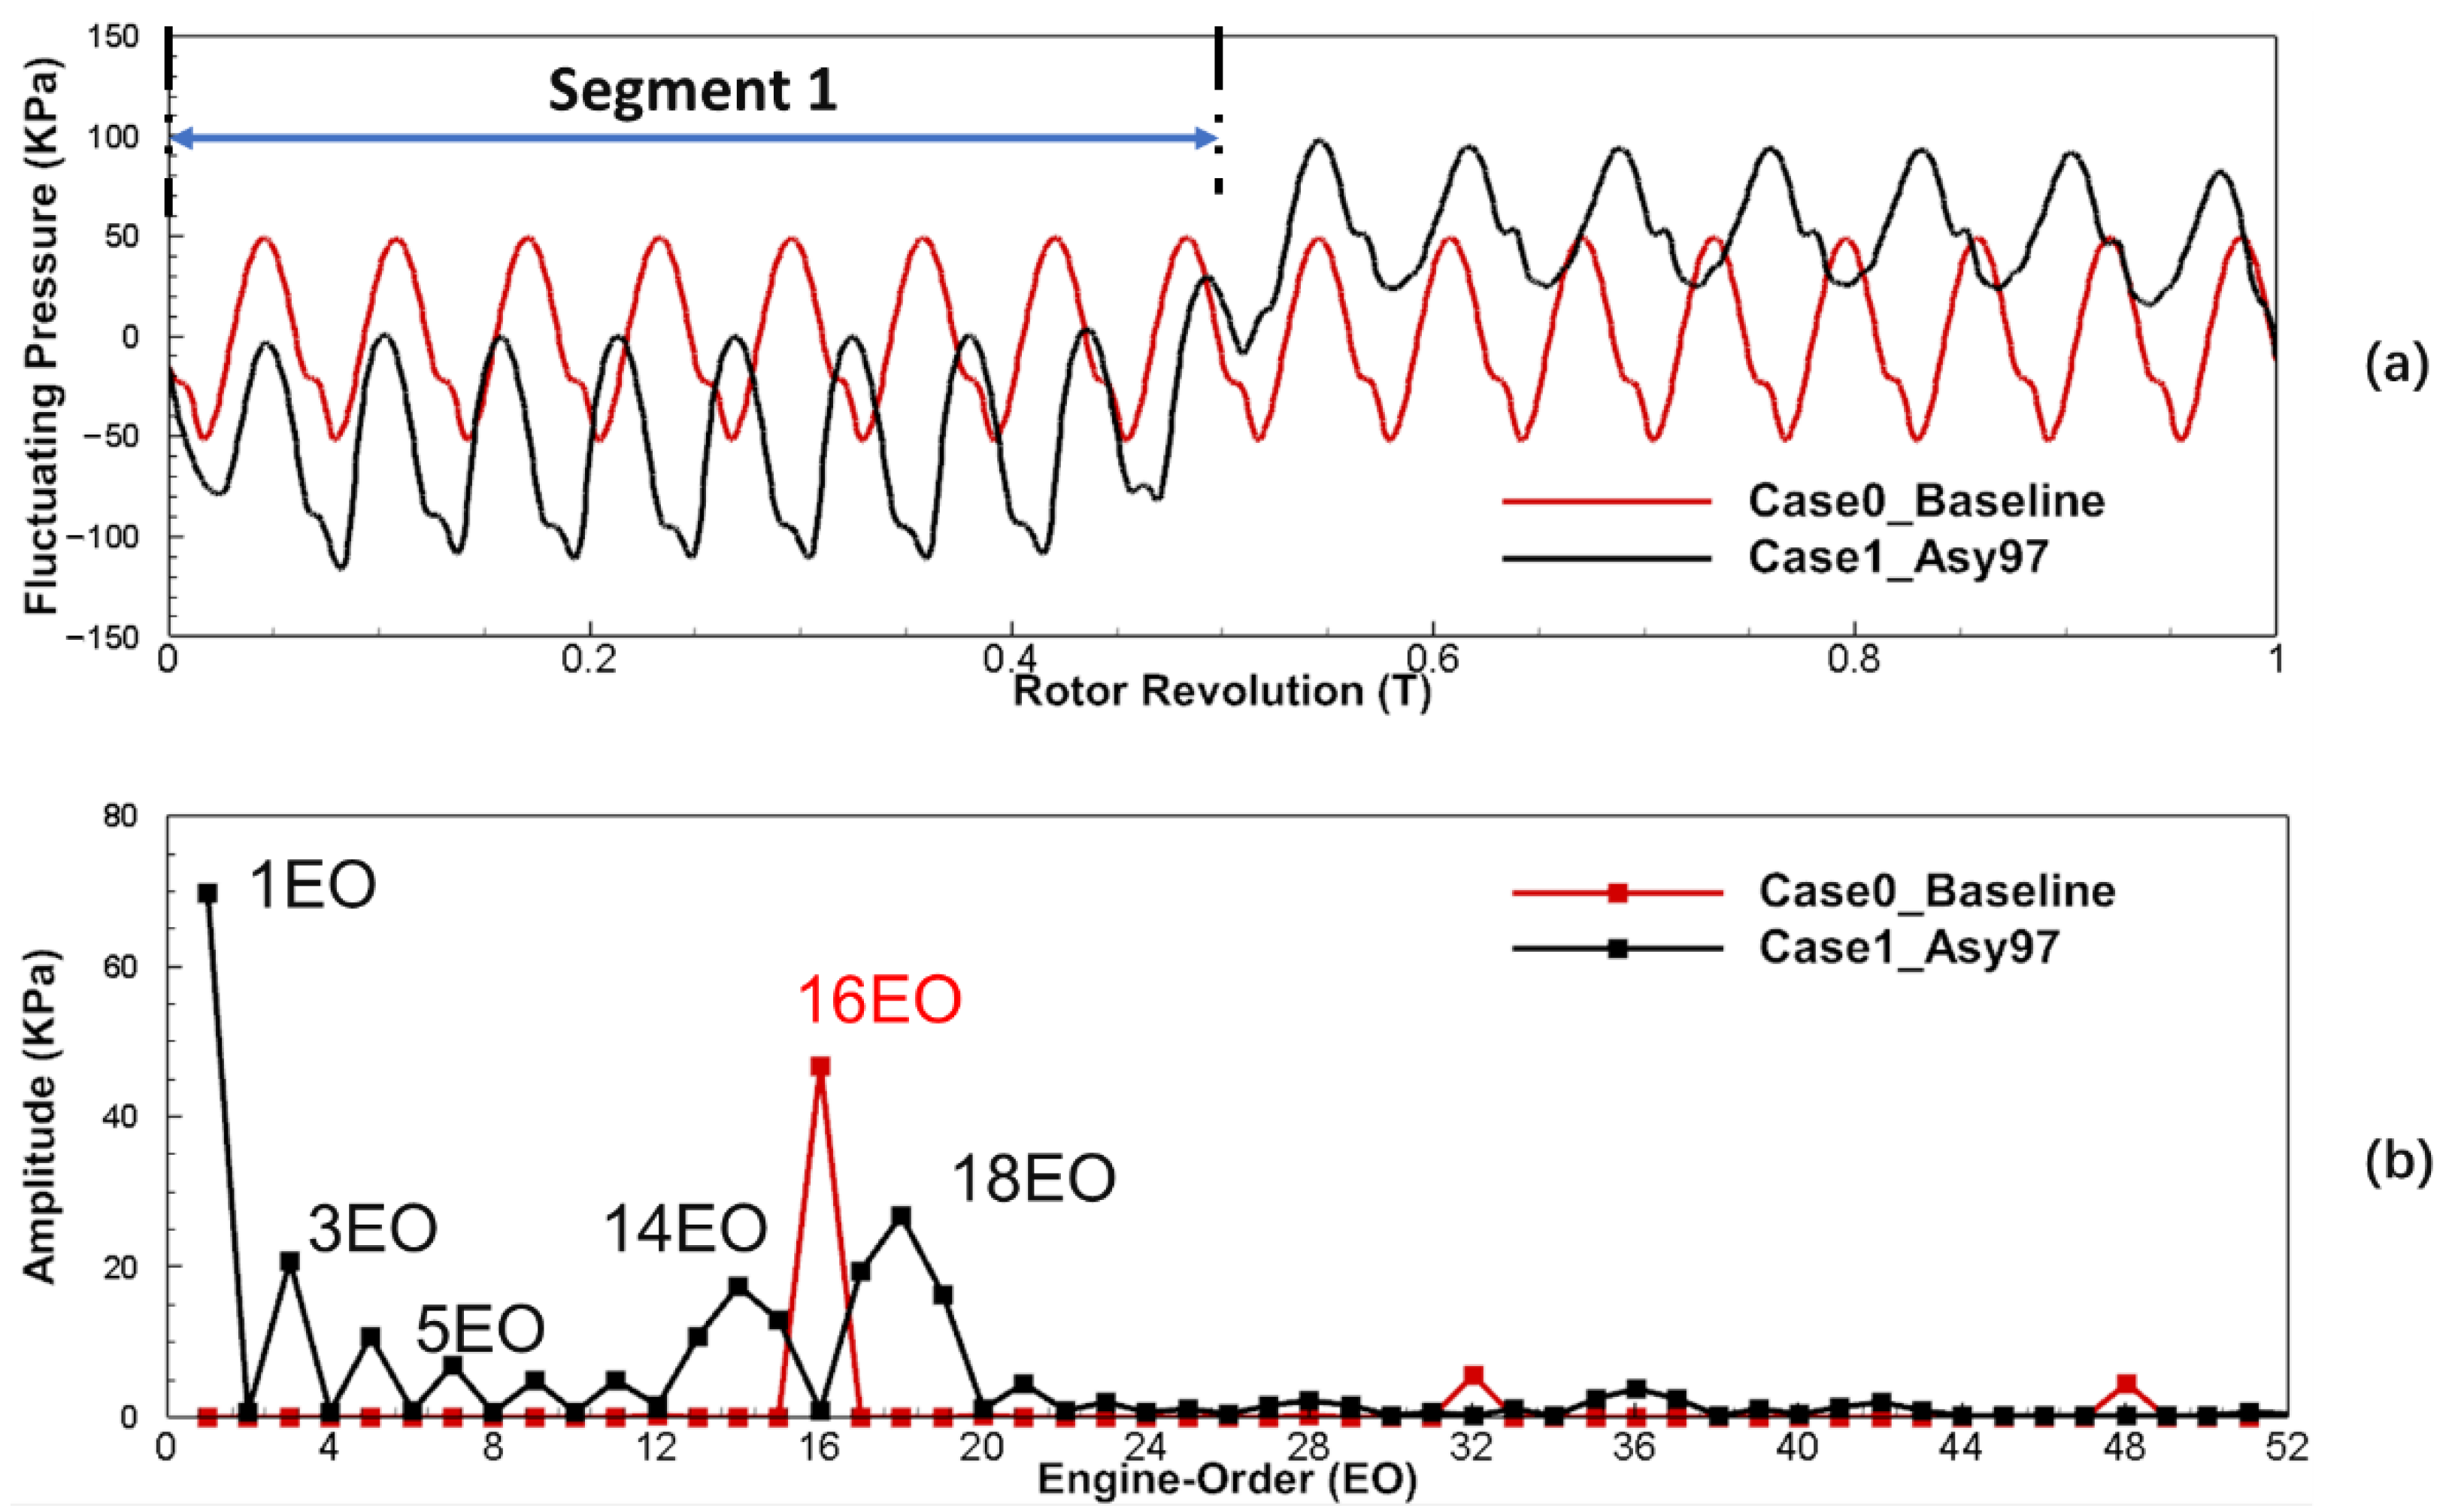
Thus, the excitation lines of 1EO and 3EO are shown in the Campbell diagram in Figure 6, where the 3EO excitation line crosses the first-order modal (M1) of the rotor blades at point D (96% rotating speed of 14,928 rpm). To investigate the resonance response to the LEO excitation in depth, full-annulus unsteady aeroelasticity simulations were carried out at resonance point D and the time histories of the fluctuating pressure at the monitoring point P of the last rotor revolution (Figure 9a) and frequency spectra (Figure 9b) were also analyzed.
As can be seen from Figure 9a, compared to Case0_Baseline (red line), the average amplitude of the fluctuating pressure decreased with a decrease in the vane pitch (for segment 1 with nine-count pitches) in Case1_Asy97 (black line), and the peak-to-peak amplitude increased with decreased vane pitch. The variation pattern of the amplitude with the vane pitch differed from the results of fluctuating pressure obtained at resonance point A; the reason for this is elaborated in a later section considering the asymmetric vane pitch flow mechanism.
The frequency components were more complex in Case1_Asy97 (black line), compared to Case0_Baseline (red line), as can be seen in Figure 9b. According to the harmonic analysis theory of the excitation force of the forced response, the frequency components with high amplitude include: (1) (2 j 1 ± 1) f r , 2 j 1 f r , where f r is the rotational frequency (corresponding to 1EO); j1 is the number of vane pitches in segment 1 (which is 9); and 17EO, 18EO, and 19EO are obtained by the formula: (2) (2 j 2 ± 1) f r , 2 j 2 f r , where j 2 is the number of vane pitches in segment 2 (which is 7) and 13EO, 14EO, and 15EO were calculated. The amplitudes of 14EO and 18EO were 37% and 57% of that of 16EO in Case0_Baseline, respectively. Higher-order harmonics, such as 21EO, 27EO, 28EO, 29EO, 35EO, 36EO, and 37EO are the results of the EO superposition mentioned above and have much lower amplitudes. In the region where the EO number is less than 10, the amplitude of even EOs is 0 and only odd EOs exist; that is, (2n − 1) f r , where n is an integer. This is consistent with the findings in the literature [29] when the number of vanes is even. In addition, the amplitudes of 1EO and 3EO reached 149.3% and 45% for that of 16EO in Case0_Baseline, respectively. The results again indicate that the half-and-half layout introduces LEO excitations with high amplitude. To further analyze the resonance response of the rotor blades of the half-and-half layout more intuitively, the maximum vibrational amplitudes of the rotor blades were evaluated based on the results of the aerodynamic excitation analysis.

5.3. Maximum Vibrational Amplitude of rotor blades

The strength of the unsteady force in a specific vibration mode is represented by the modal force. The pressure disturbance and the correlation between the pressure disturbance and the structural mode shape determine the strength of the modal force for a given mode. At each time step, HGAE converts unsteady surface pressures into modal force. Then, to determine the maximum vibrational amplitude, the generalized blade deflection equation is employed [47]:
X m a x = Θ Q Φ m a x ω r 2
where Θ is the amplitude of the modal force in a period at the frequency of concern; Φ m a x represents the value of the largest value of mode shape, which was obtained from FEA; and Q is the Q factor, including aerodynamic damping and structural damping (structural damping was ignored in this paper). The Q factor was calculated using the following equation:
Q = 1 2 ζ
where ζ is the aerodynamic damping ratio, which is determined by separate flutter analysis of the rows.
As mentioned above, the VPF of the baseline configuration decomposed into adjacent frequencies, and the 16EO excitation on the rotor was shifted to the excitation line of 14EO and 18EO on the Campbell diagram (Figure 6). Thus, the operating speed excited the Second-order mode (M2) of the rotor blade shifts from 10,535 rpm (point A) for the 16EO crossing to 9460 rpm (point B) for the 18EO crossing and 11,742.5 rpm (point C) for the 14EO crossing. For the turbine with 16 vanes and 47 blades, the EOs of the excitation determined the ND responses of the rotor blade. In Case0_Baseline, the response of the rotor blade was M2-16ND, while the response of Case1_Asy97 was transferred to two independent NDs (14ND and 18ND). Moreover, even if the 16ND response was not the resonance condition at crossing points B and C, the 16ND response was still calculated at the 18EO and 14EO excitation crossings in order to demonstrate the benefits of the asymmetric vane configuration. According to Equation (7), the maximum vibrational amplitudes (Table 4) of different cases at resonance points A–C (16EO, 18EO, and 14EO crossings, respectively) and resonance point D (3EO crossing) were calculated in order to evaluate the resonance response caused by the half-and-half layout.
The 16ND response of Case0_Baseline at the 16EO crossing (resonance point A) was considered as the baseline response amplitude and the ND response of Case1_Asy97 was calculated against the baseline response amplitude. The maximum vibrational amplitude in Case1_Asy97 at the 18EO crossing was reduced by about 69.91% at the 18ND response of the rotor blade; however, even at the increased rotational speed of the 14EO crossing, the 14ND response experienced a 51.20% reduction in maximum vibrational amplitudes. Furthermore, compared to the 16ND response of Case0_Baseline, Case1_Asy97 yielded 98.15% and 98.64% reductions in the 16ND response at the 14EO and 18EO crossings, respectively.
These results demonstrate the benefits of the asymmetric vane pitch for the high-engine-order resonance response in terms of maximum vibrational amplitude. Unfortunately, the maximum amplitude of the 3ND response at the 3EO crossing (resonance points D) was 10.55 times (2.01 mm) greater than the 16ND response in Case0_Baseline, which is much larger than the response amplitude of the other resonant crossings. Thus, although Case1_Asy97 can significantly reduce the amplitude of VPF, the LEO excitation introduced by asymmetric vane configuration may cause LEO resonance, and the generation mechanism of such LEO excitation has not been studied in the previous literature. Thus, a detailed analysis of the flow physics is necessary in order to reduce the strength of the LEO resonance as much as possible.

5.4. Flow Mechanism of Asymmetric Vane Pitch

In the present study, the unsteady disturbances of the rotor row mainly come from the wake and potential field of the upstream vane row, such that studies of the wake and potential field separately may help to reveal the flow mechanism of asymmetric vane pitch regarding LEO excitations on the rotor blade. These aerodynamic disturbances appear as “frozen gusts” in the stationary frame before interacting with the rotor row [48]. Therefore, the characteristics of the forcing function on the rotor blades were identified by analyzing the flow field at the vane exit.
The viscous vane wake normally has velocity defects and little static pressure defects, characterized by entropy variation. The entropy value is defined as:
E n t r o p y = P ρ γ
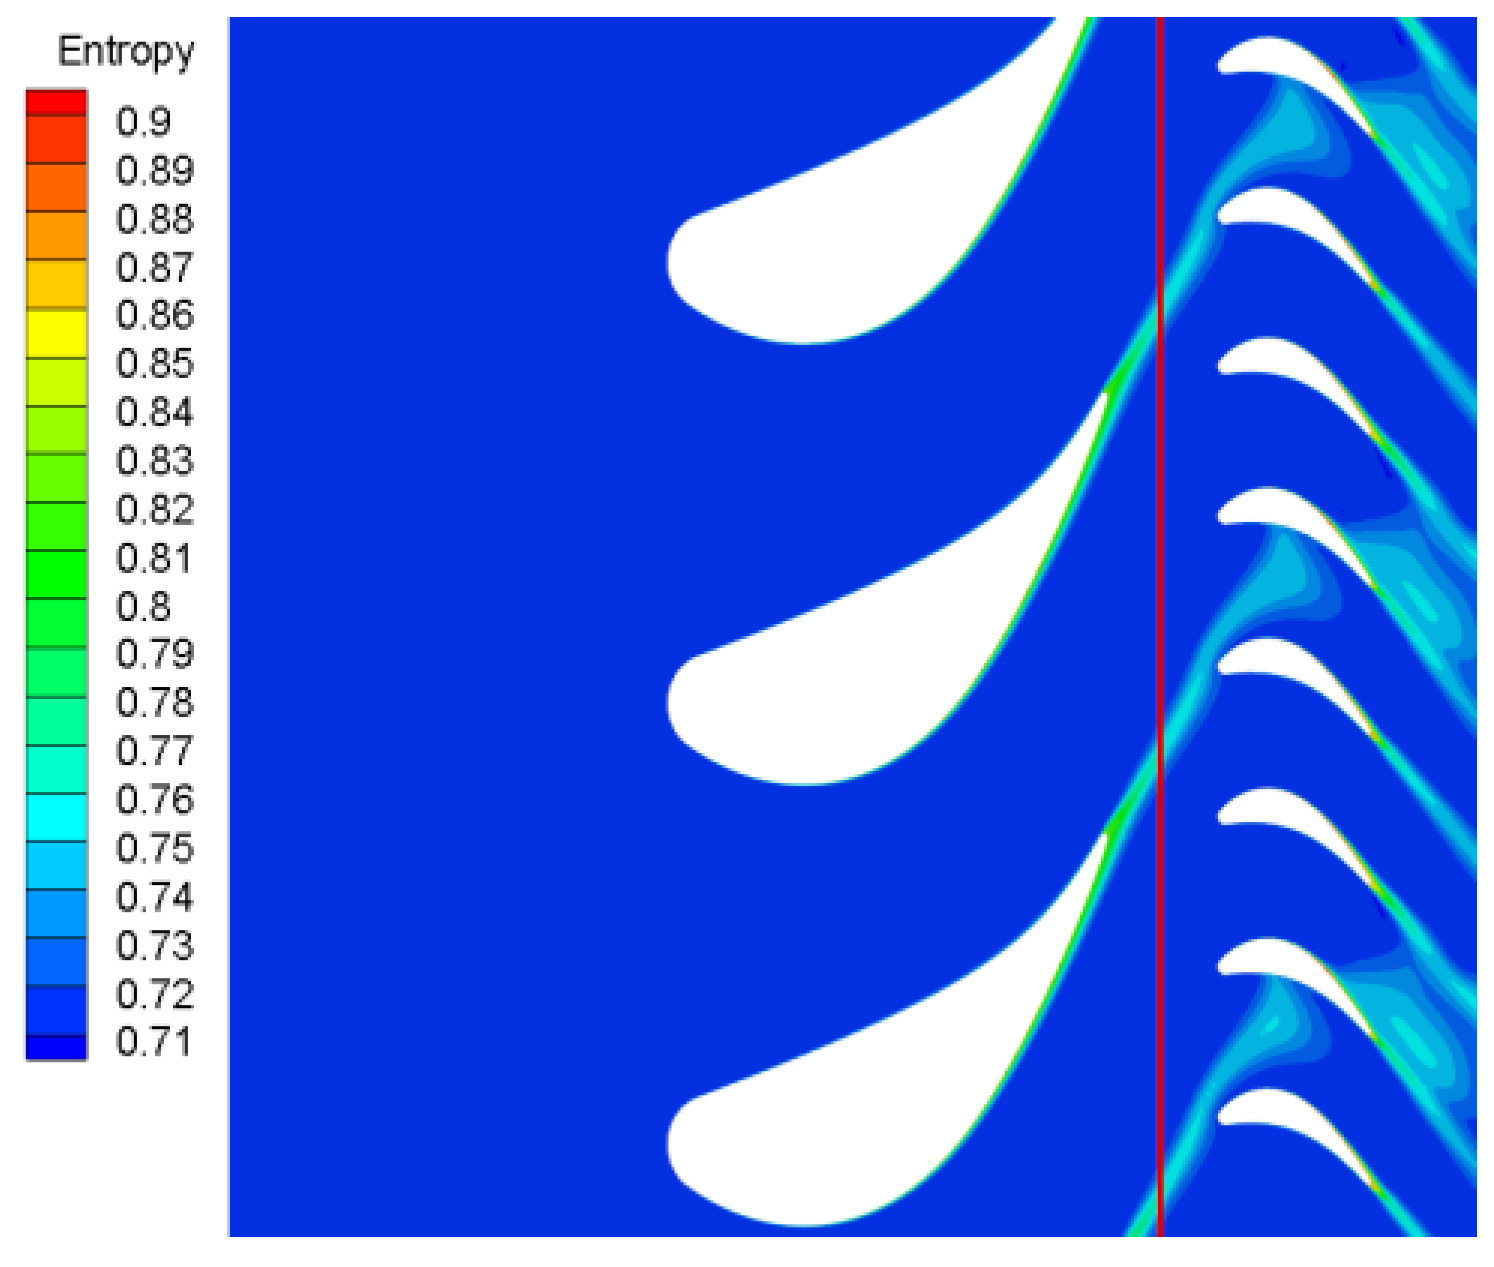
where P is the pressure; ρ is the density; and γ is the heat capacity ratio. Figure 10 shows the entropy contour of Case0_Baseline at midspan under the operating condition of resonance point D. The vane wake can be clearly identified in the region with high entropy.
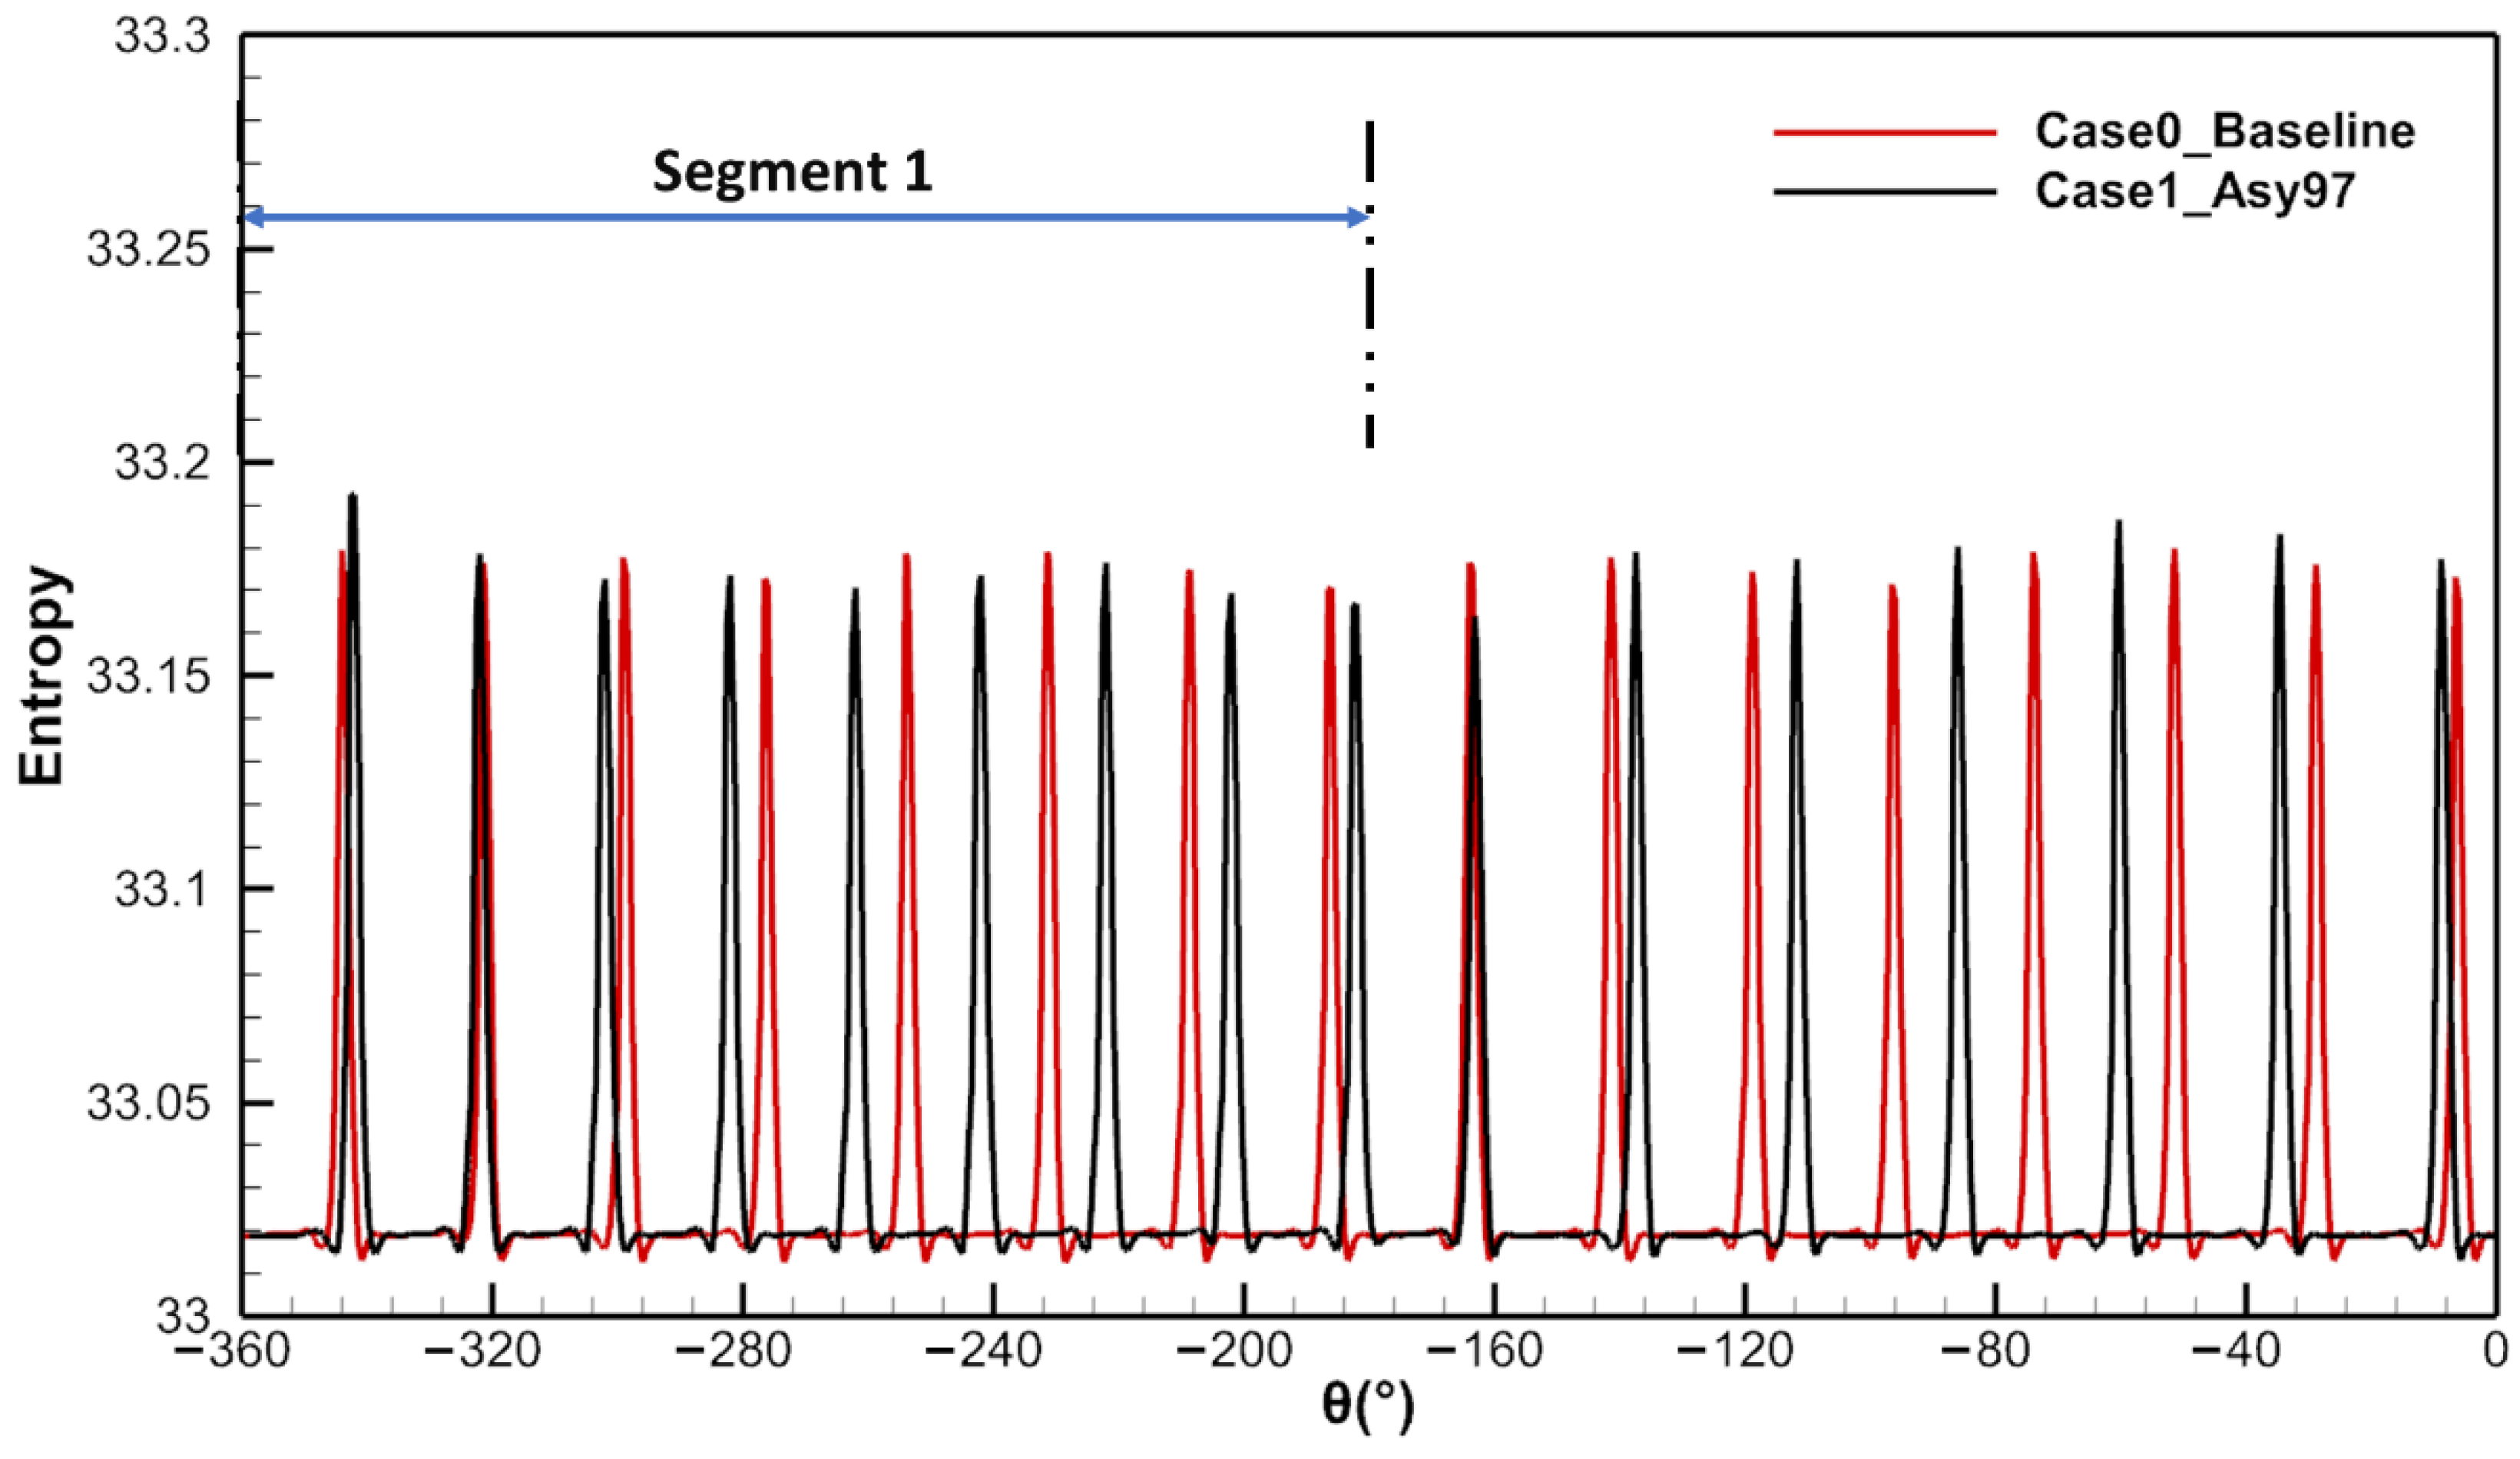
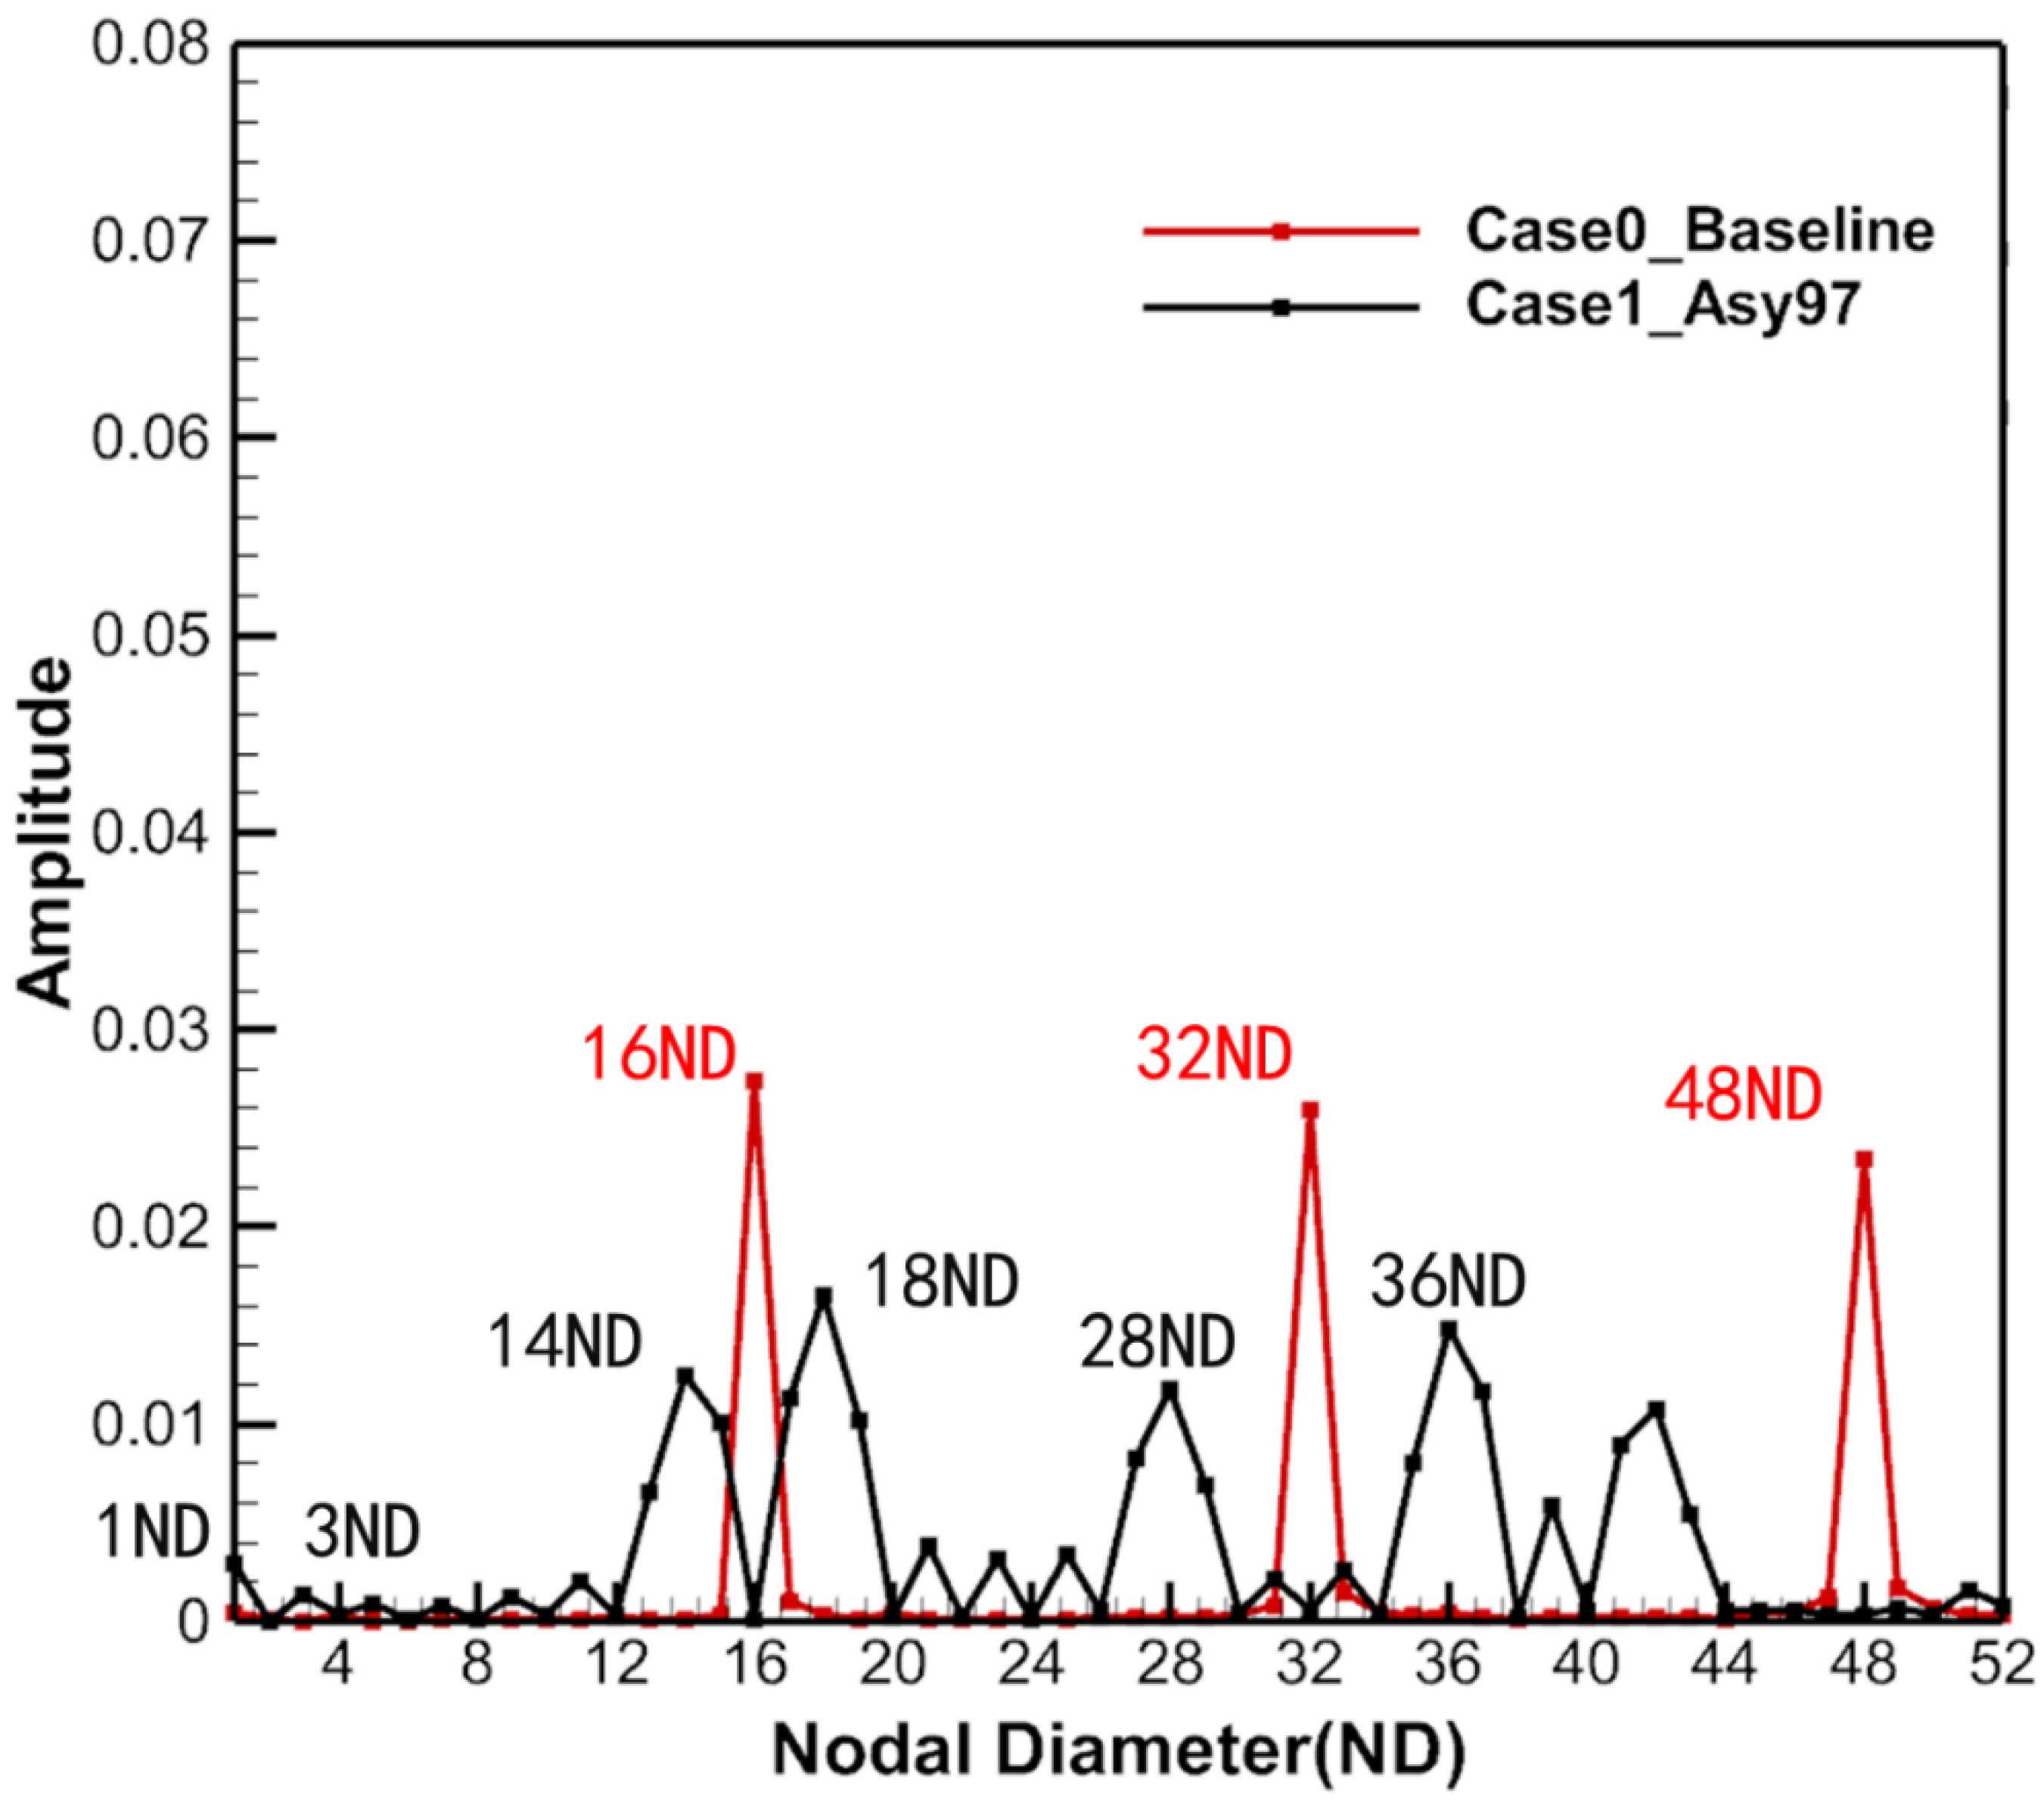
Extracting the wake profiles at the vane exit (red line in Figure 10) can help to shed light on the forcing aspect of the wakes. A comparison of the midspan wakes between Case0_Baseline and Case1_Asy97 running at the 3EO crossing (resonance point D) is shown in Figure 11. The horizontal coordinate represents the angle θ of the circumferential position, while the vertical coordinates are the entropy values. The entropy curve in Case0_Baseline (red line) shows periodic fluctuations in the circumferential direction and the entropy peaks represent viscous wakes with high losses. The 16 entropy peaks correspond to the 16 vane wakes, which are one of the sources of the 16EO excitation on the rotor blades. The offset in the circumferential position of the vane wakes in Case1_Asy97 (black line) indicates the effect of asymmetry relative to Case0_Baseline. The spatial spectrum provides a clearer view of the variation in the wake profile under the asymmetric vane configuration. Figure 12 shows the entropy spatial spectra of Case0_Baseline and Case1_Asy97 running at resonance point D.
The nodal diameter (ND) component again indicates that the 16ND component of vane wakes in Case1_Asy97 (black line) was deconstructed and the energy was shifted to 14ND and 18ND with different entropy peaks. The 16ND component of vane wakes still had some spectral energy but its amplitude was reduced to an almost negligible value. This result presents similarities to the high-engine-order frequency component of the fluctuating pressure on the rotor blade described in Figure 9. Thus, the vane wake is one of the sources of the high-engine-order excitation of the rotor blade. An important finding is that, in the entropy spatial spectra of Case1_Asy97, in addition to high-order NDs, there were no lower-order NDs with high amplitude (where low-order ND refers to the region where the ND is less than 10). Among them, the amplitudes of 1ND–5ND were only 10.9–3.2% of that of 16ND in Case0_Baseline. In other words, in Case1_Asy97, the strength of the low-order NDs contained in the vane wake is far below the strength of the LEO excitation observed on rotor blades. These results suggest that the contribution of the vane wake is mainly to high-engine-order excitations, contributing little to the LEO excitation of the rotor blades.
As the vane wake in the asymmetric configuration contributes less to the LEO excitation on rotor blades, it is more important to pay attention to the influence of the potential field, which is another excitation source in the current flow field. The potential field corresponds to the pressure disturbance in the flow field and the transient pressure was directly used to characterize the potential disturbance in some literature [48]. To clarify the disturbance mechanism of the potential field, the transient pressure profile at the vane exit (red line in Figure 10) was extracted. The circumferential distribution (Figure 13a) and spatial spectra (Figure 13b) of the transient pressure of Case0_Baseline and Case1_Asy97 running at the resonance point D are shown.
In Figure 13a, the transient pressure curve of Case0_Baseline (red line) presents approximately sinusoidal periodic fluctuations in the circumferential direction, with transient pressure peaks corresponding to the trailing edge of vanes. Here, the 16 transient pressure peaks correspond to 16 vanes, suggesting the potential field is one of the sources of the 16EO excitation on rotor blades besides the vane wake. The transient pressure profile in Case1_Asy97 is obviously split into two curves with different average amplitudes, which indicates the effect of the asymmetric configuration relative to Case0_Baseline.
Analysis of the spatial spectrum of the transient pressure (Figure 13b) can help to determine the energy components of the potential field more clearly. In Case1_Asy97 (black line), the high-order component of the potential field was similar to that of the vane wake (Figure 12), where the energy of the potential field was also shifted to 14ND and 18ND with different transient pressure peaks. Interestingly, low-order NDs with high amplitude were observed. For example, the amplitudes of 1ND and 3ND reached 103.28% and 33.73% that of 16ND in Case0_Baseline (red line), respectively. These results share similarities with the LEO components of the fluctuating pressure on the rotor blade described in Figure 9. Together, these results provide important insights; namely, that the pressure disturbance of potential fields of the vane row contributed to both high- and low-engine-order excitations on the rotor blade in asymmetric vane configuration, and that the LEO excitation on the rotor blade may be dominated by the contribution of the potential field of the vane row.
The spatial spectra of the entropy and transient pressure at the vane exit initially revealed the contributions of upstream vane wakes and potential fields to different excitation orders on the rotor blade. The reason for the different contributions of the wake and potential fields to LEO excitation was revealed by their respective circumferential profiles. In the half-and-half layout, the average amplitude of the transient pressure curves of segment 1 and segment 2 differs significantly (Figure 13a), and the average transient pressure of the full-annulus potential field profile can be approximated as a square wave (Equation (10)), which is not observed in the wake profile (Figure 11). After Fourier series decomposition, the amplitude of the even term is zero (Equation (11)).
f ( t ) = { E 2 ,   R 2 t < 0 E 2 ,     0 t R 2
f ( t ) = 2 E π [ s i n 2 π f t + 1 3 s i n 6 π f t + 1 5 s i n 10 π f t + + 1 n s i n 2 n π f t ] n = 1 , 3 , 5 ,
Here, E is the difference between the average amplitude of the transient pressure in two segments; R is a rotation period; and the coefficient n is the excitation order. As can be seen from Equation (11), the amplitudes of the odd low-order terms are related to E, which are multiples of 2 E / π , and the amplitudes of the even low-order terms are zero. According to square wave theory, the source of high amplitudes of the low odd-order excitations in the spatial spectrum of the potential field could be deduced: it is the difference between the average amplitudes of the transient pressure curve of the two segments. In other words, the strength of the potential field differs in different segments.
To further investigate the factors influencing the potential field in different segments, the time-averaged pressure distribution of the vane surface was calculated (Figure 14), as the area enclosed by the pressure curve represents the aerodynamic loading of the vane, which is closely related to the strength of potential fields of the vane row [49]. According to Case0_Baseline (red line), the peak velocity occurs at 67% of the axial chord from the leading edge on the suction surface (SS), followed by an adverse pressure gradient region that relaxes as it approached the trailing edge. The vane presents an aft-loaded pressure distribution, such that the downstream rotor blades are more affected by the potential field of the upstream vane row, due to high loading and flow speed in the rear part of the vane. In Case1_Asy97 (blue line), the loading of B1 (cyan blade in Figure 14) increased significantly and the downstream rotor blade was more strongly affected by the potential field of the upstream vane row when passing through the upstream potential field. It is clear that the variation of the vane pitch has a significant impact on the strength of the potential field of the vane row.
Therefore, for the half-and-half layout, the strength of the potential field between the two segments differs due to the unequal vane pitch. This results in different average amplitudes of fluctuating pressure on the rotor blades caused by different segments of the vane row, producing the average fluctuating pressure curve, which is similar to a square wave. The larger the difference in average amplitudes between two segments, the higher the amplitude of the LEO excitation of the rotor blade. This explains why LEO excitations with high amplitude are introduced in the asymmetric vane configuration (Figure 13b), from the perspective of flow physics. At present, low solidity and high loading of the vane row are the development trend of the gas turbine, leading to lower vane counts. If the vane count is even, using the half-and-half layout, even if the difference in vane count between two segments is two, the vane pitch difference would be relatively large, which is enough to result in LEO excitations with high amplitude on the rotor blades.
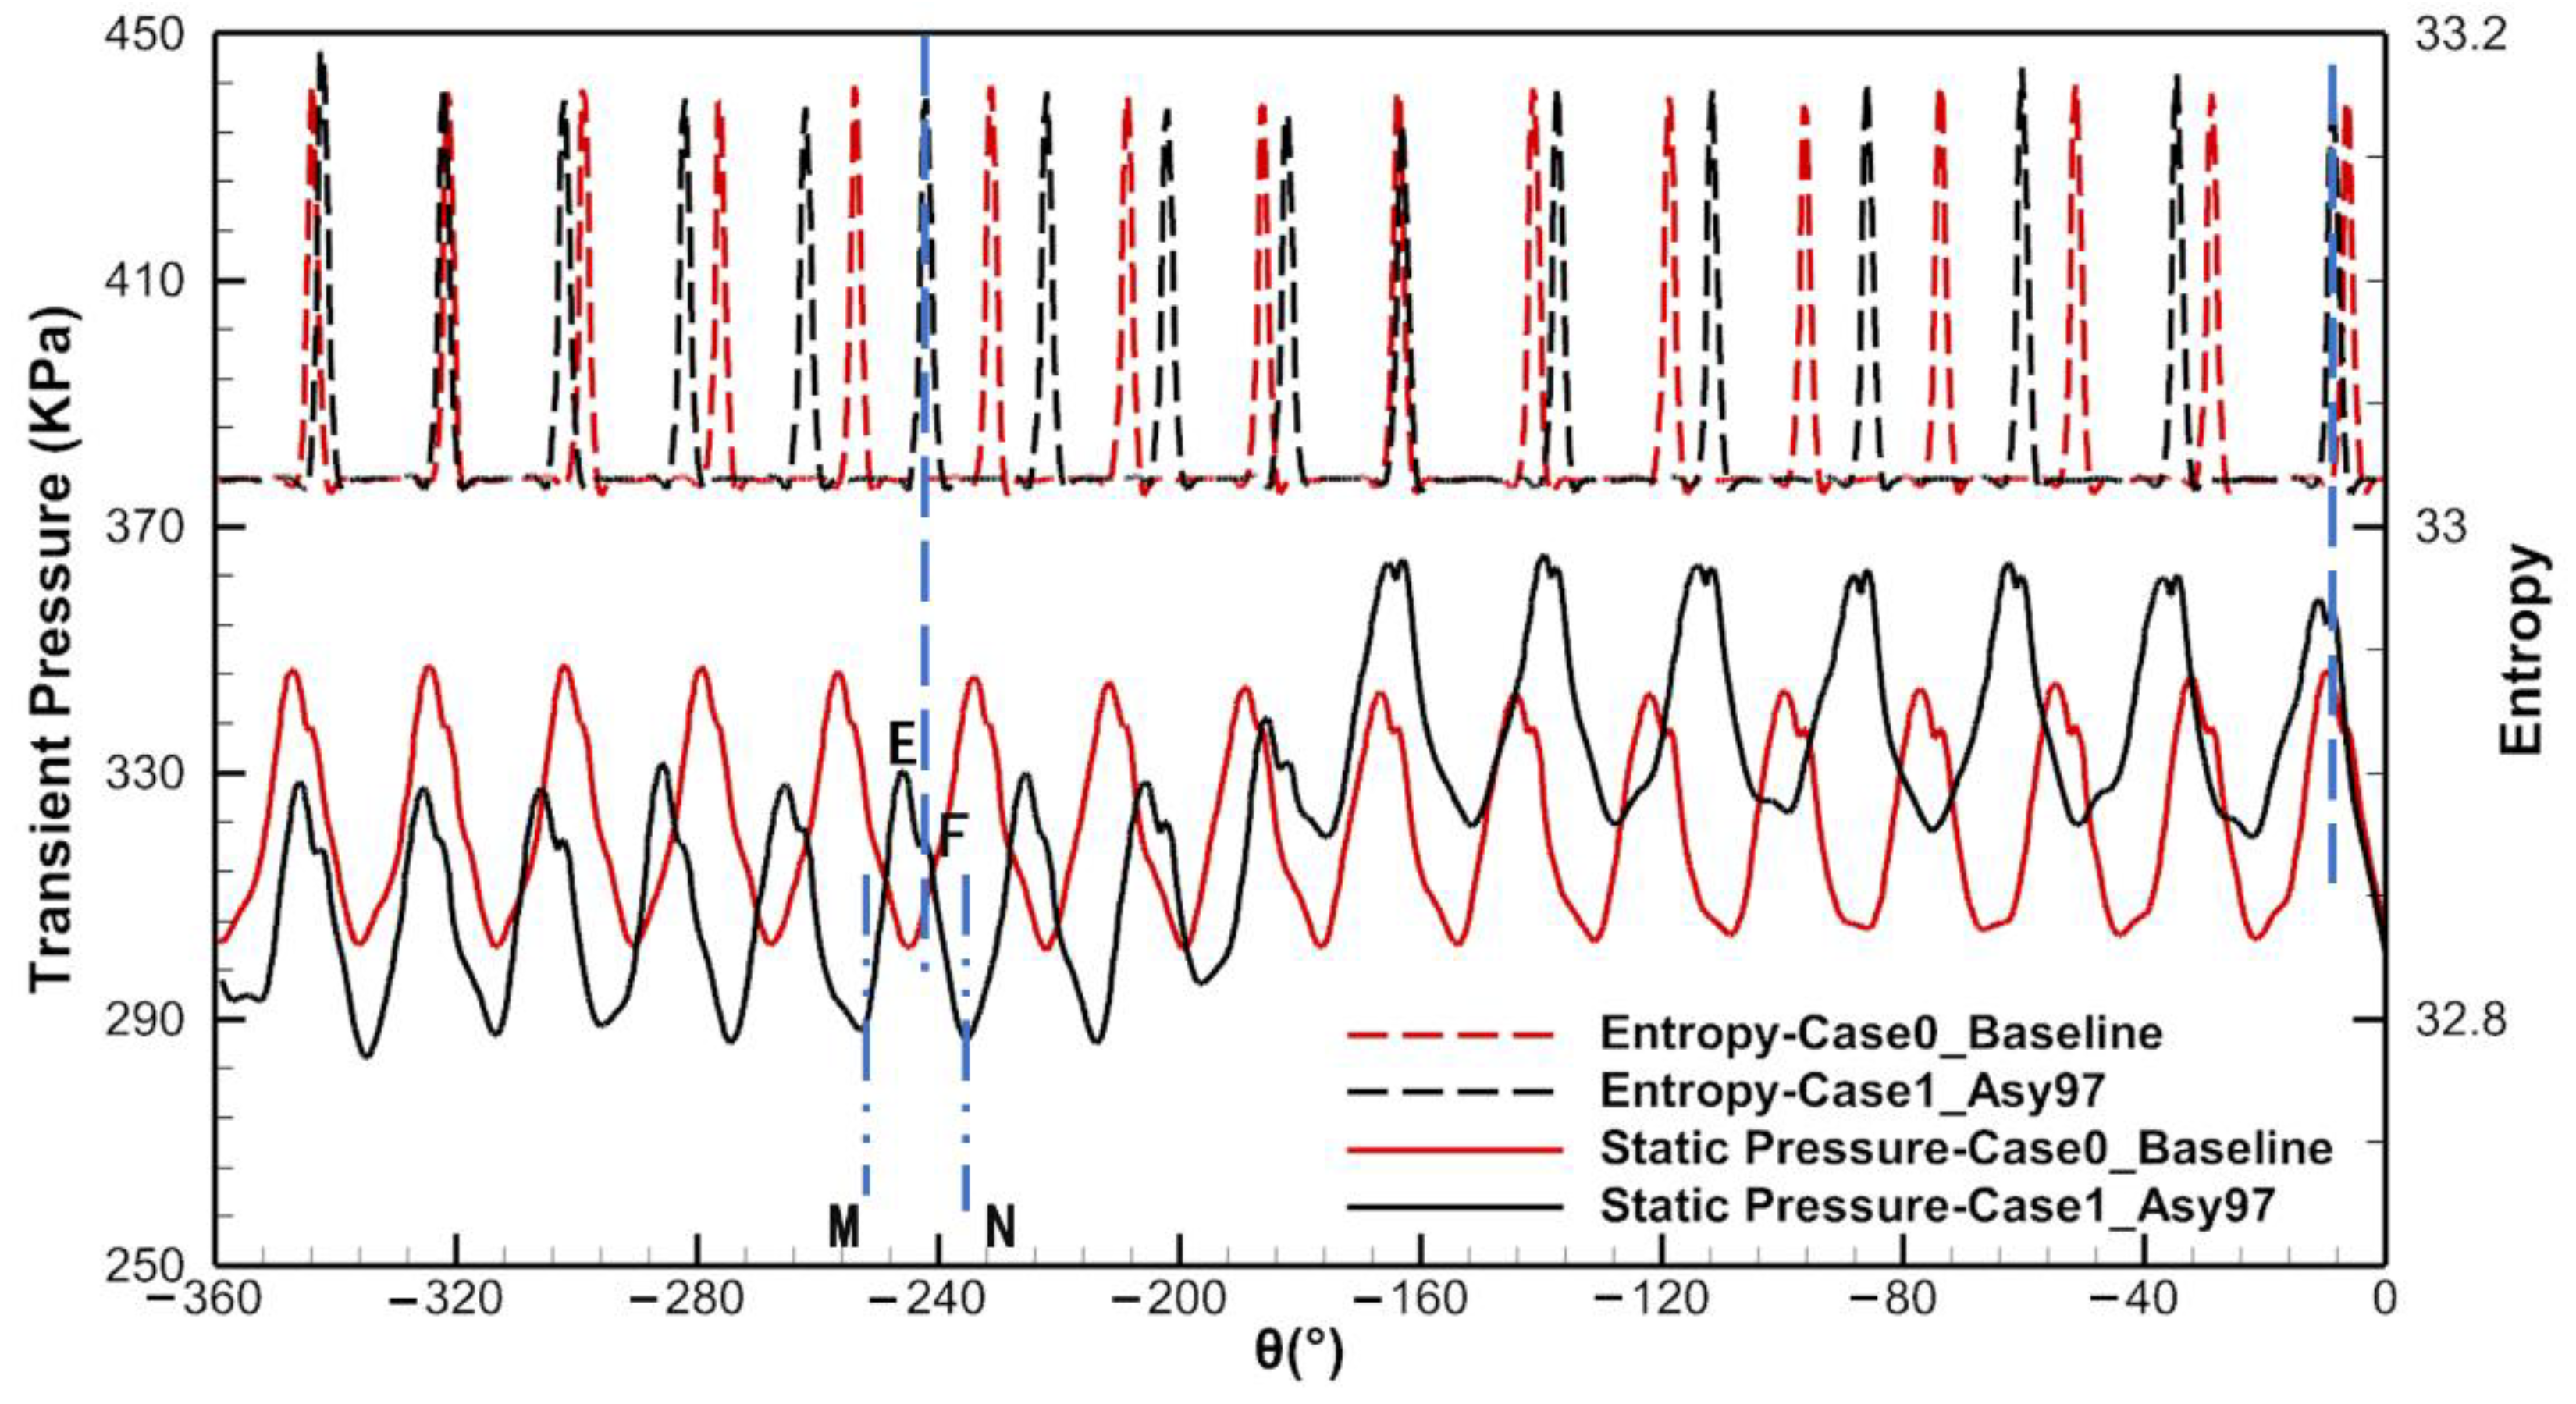
Furthermore, the circumferential distribution of the transient pressure at the vane exit (Figure 13a) is not as described by most of the literature [50,51], where the pressure disturbance of the potential field exhibits a relatively perfect sinusoidal waveform, and there are multiple pressure peaks (or pressure bumps) in each minimal positive period, such that the potential field of the vane row may not be the only excitation source for LEO, although it is the main excitation source (as was demonstrated). To better reveal the flow physics of multiple pressure peaks, the circumferential distributions of transient pressure and entropy at midspan at the vane exit were compared (Figure 15). The horizontal coordinate represents the angle θ of the circumferential position, and the left and right vertical coordinates are the transient pressure and entropy, respectively. The solid line represents the circumferential distribution of transient pressure and the dashed line represents the circumferential distribution of entropy.
Whether in a large or small pitch segment, there exists a second pressure peak (point F) near the first pressure peak (point E) in each minimal positive period (e.g., between M-N) of the transient pressure curve. The distance between the second pressure peak and the first pressure peak also differed in the two segments (i.e., segments 1 and 2) with different vane pitches. Moreover, the second pressure peak corresponded to the high-entropy region. As mentioned above, the viscous wake is characterized by entropy, which indicates that the vane wake leads to a change in the transient pressure profile due to the small pressure deficit contained within the wake. Thus, the average and peak-to-peak amplitude of the transient pressure profile at the vane exit is influenced by the vane wake beside the potential field of the vane row, where the first and the second pressure peaks correspond to the potential field and the vane wake, respectively. To verify this deduction, it is necessary to separate the potential fields and vane wakes in flow fields. This was achieved by inviscid calculations of the vane row, where such a simplification can be justified by remembering that the vane wakes are generated by viscous effects. Therefore, two-dimensional calculations (the mesh at midspan) of the turbine stage with viscous and inviscid vane domains were performed, in which the calculation with viscous vane row included the vane wake–potential field interaction, and the calculation with inviscid vane row included only the potential field.
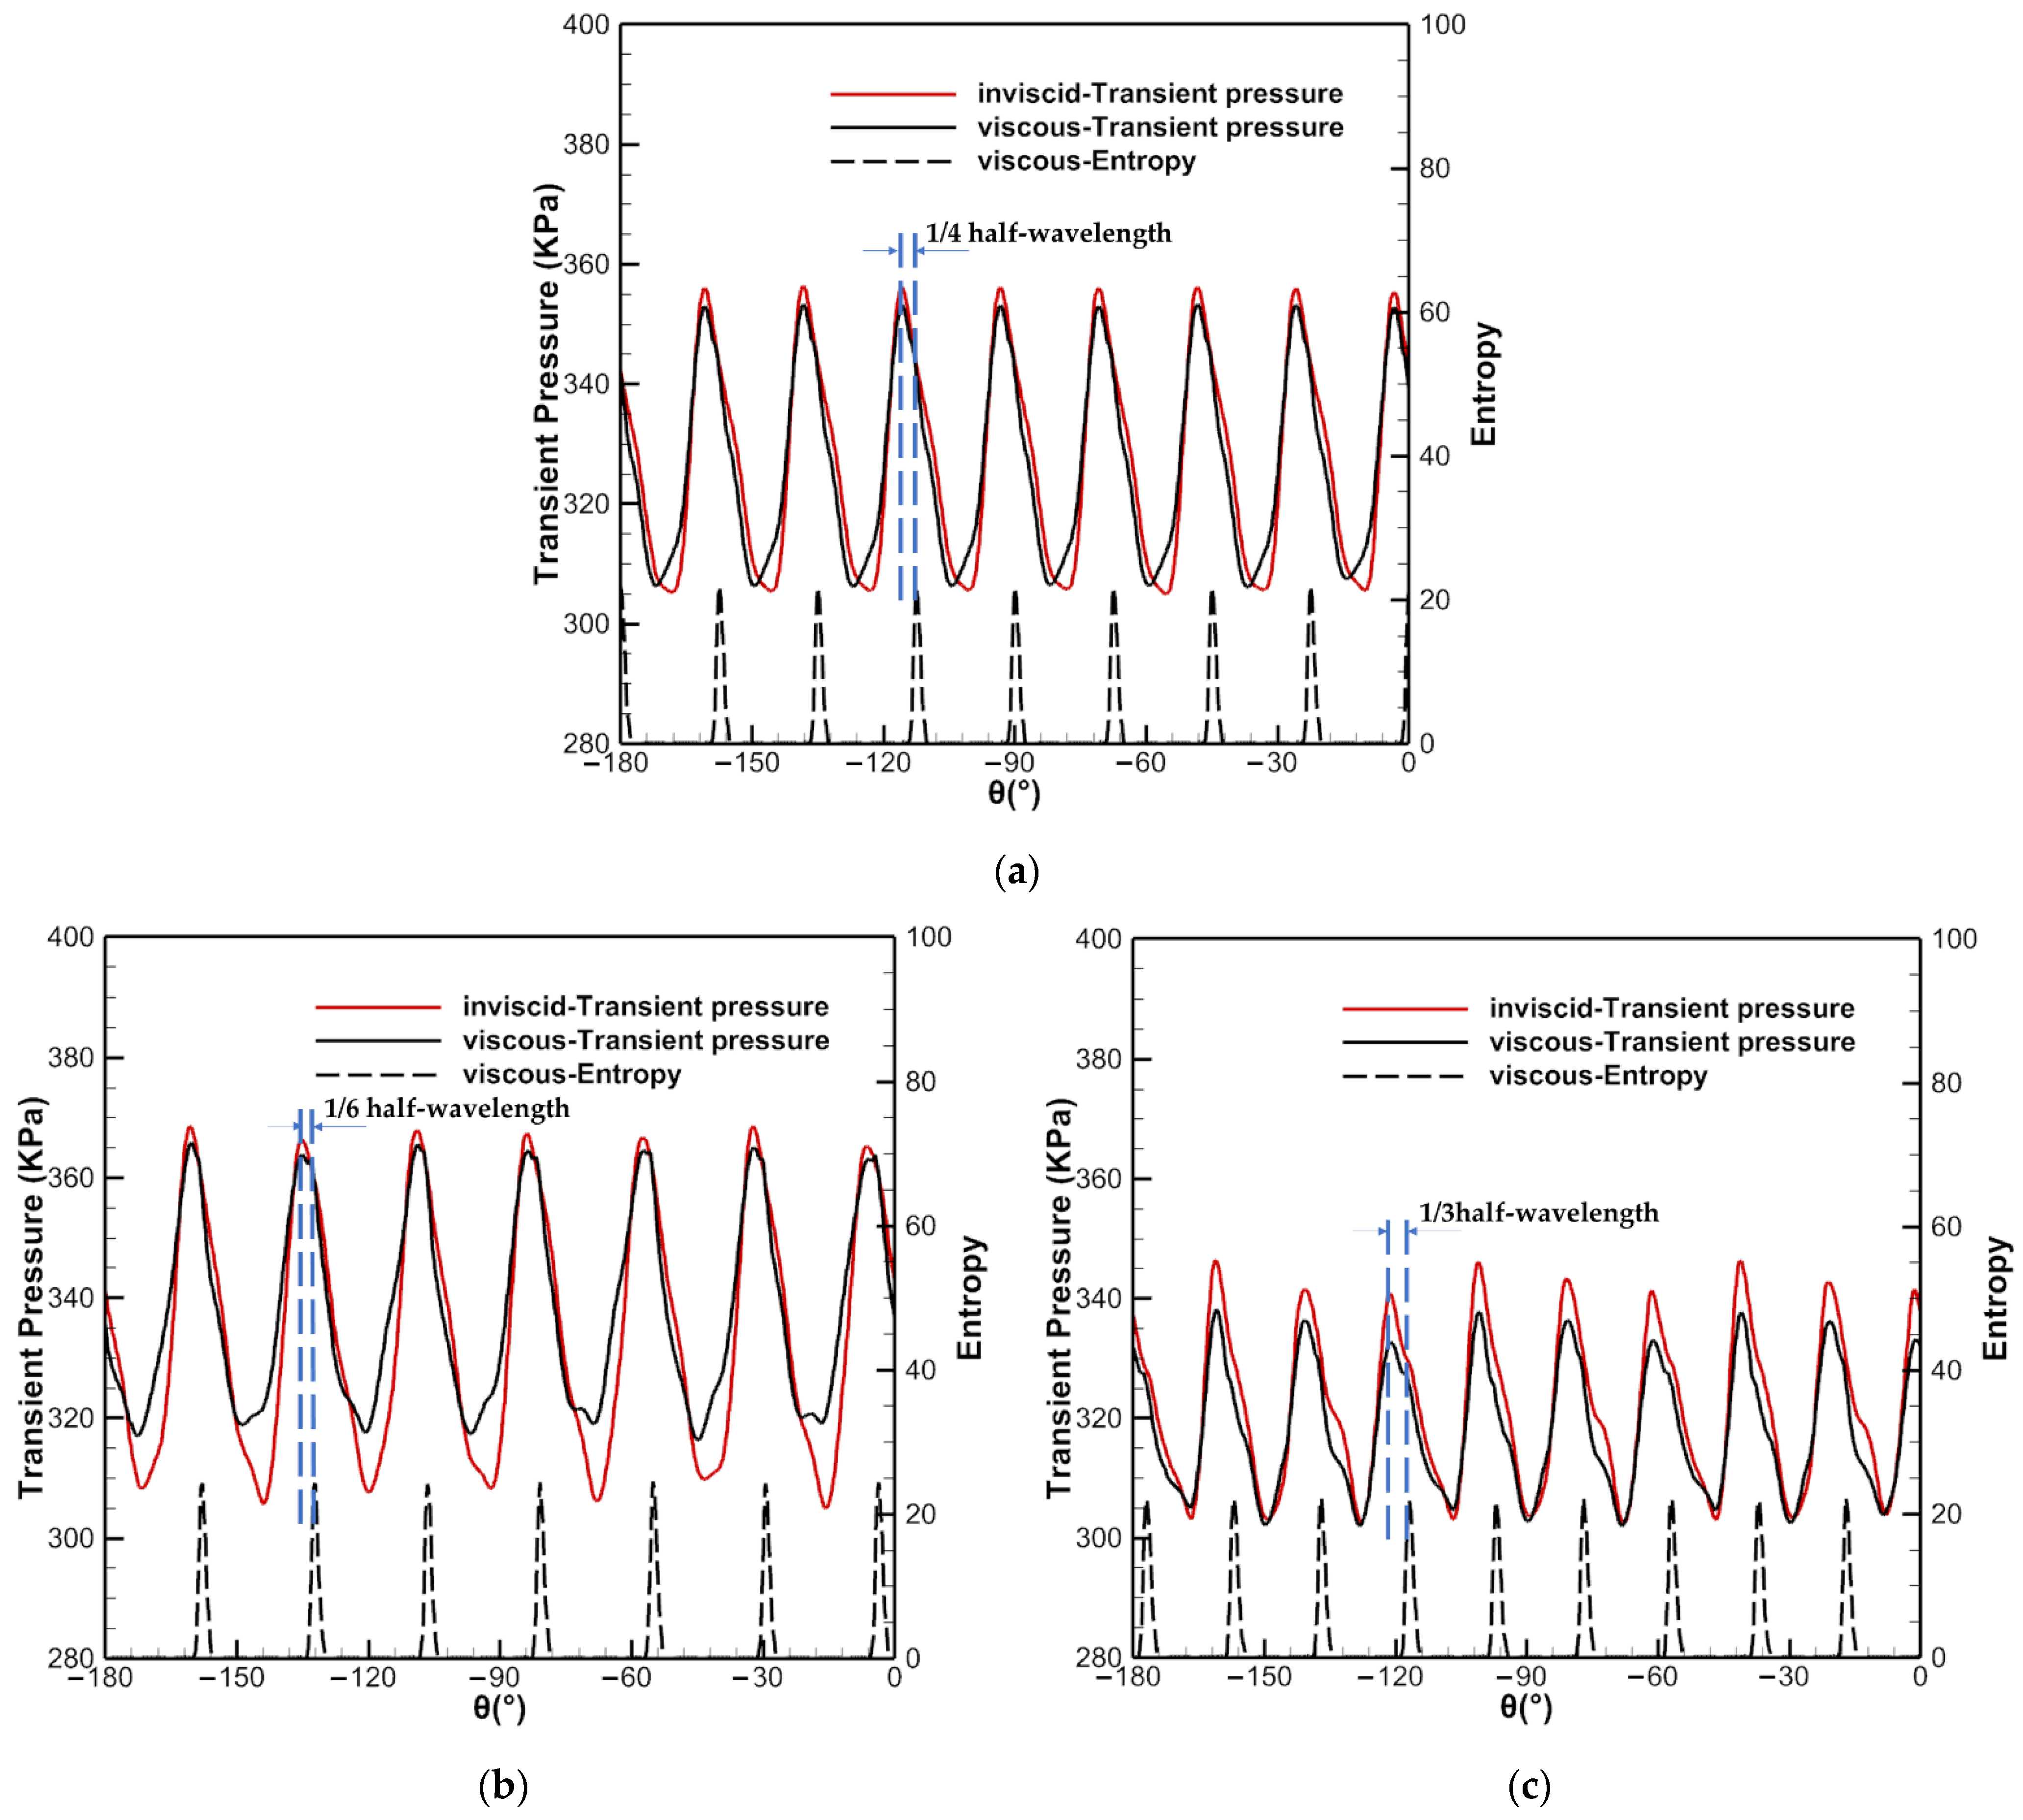
To investigate the effect of different vane pitches in the baseline configuration and half-and-half layout, two-dimensional calculations were assessed with three ratios of the number of vanes and rotor blades: 14:48, 16:48, and 18:48. The vane pitch size with a ratio of 16:48 corresponded to Case0_Baseline, while the pitch sizes with a ratio of 14:48 and 18:48 corresponded to segments 2 and 1 in Case1_Asy97, respectively. By comparing the results of the calculations with the inviscid vane row in each case (red lines in Figure 16a–c), the circumferential distribution of transient pressure with only potential field presented a more perfect sinusoidal waveform. In addition, the average and peak-to-peak amplitudes of the transient pressure increased with an increase in the vane pitch, indicating that the strength of the potential field is proportional to the vane pitch. This verified the conclusion that the strength of the potential field is affected by the variation of the vane pitch, as mentioned in the previous section.
In the calculations with the viscous vane row, there was a second pressure peak (corresponding to the wake; explained in Figure 15 for the transient pressure curve) in all cases. As shown in Figure 16a, when the ratio of the number of vanes and rotor blades was 16:48, with a pitch size corresponding to Case0_Baseline, the second pressure peak (black solid line) corresponding to the vane wake (high entropy region in black dashed line) was located about a 1/4 half-wavelength to the right of the first pressure peak corresponding to the potential field (red line). The average amplitude of the transient pressure increased slightly, while the peak-to-peak amplitude decreased, compared to the results of the calculations with the inviscid vane row. When the vane pitch increased (pitch size corresponding to segment 2 of Case1_Asy97), as shown in Figure 16b, the distance between the second pressure peak and the first decreased, located about a 1/6 half-wavelength to the right of the first pressure peak. The average amplitude of the transient pressure increased significantly, while the peak-to-peak amplitude decreased. However, when the vane pitch decreased (pitch size corresponding to segment 1 of Case1_Asy97), as shown in Figure 16c, the distance between the second pressure peak and the first increased, located about a 1/3 half-wavelength to the right of the first pressure peak. The average and peak-to-peak amplitude of the transient pressure decreased. This distance is the relative circumferential position of the vane wake and the potential field at an axial position, which means that the average and peak-to-peak amplitudes of the transient pressure at the vane exit were affected by the joint effect of the vane wake and the potential field.
In conclusion, the numerical results described in this section indicate that the potential field of the vane row is the main source of LEO excitation for the rotor blade and that the vane wake and potential field jointly affect the difference in the average pressure amplitude between the two segments under the asymmetric vane configuration. The larger the difference in the average pressure amplitude, the higher the strength of LEO excitations on the rotor blade. Moreover, the strength of the potential field and distance between the first and second pressure peaks (as the joint effect of the vane wake and potential field) are affected by the vane pitch. Therefore, the vane pitch difference between the two segments can be used to regulate the strength of the LEO excitations under the asymmetric vane configuration.

5.5. Analysis of Non-Half Two-Segment Layout

5.5.1. Non-Half Two-Segment Layout

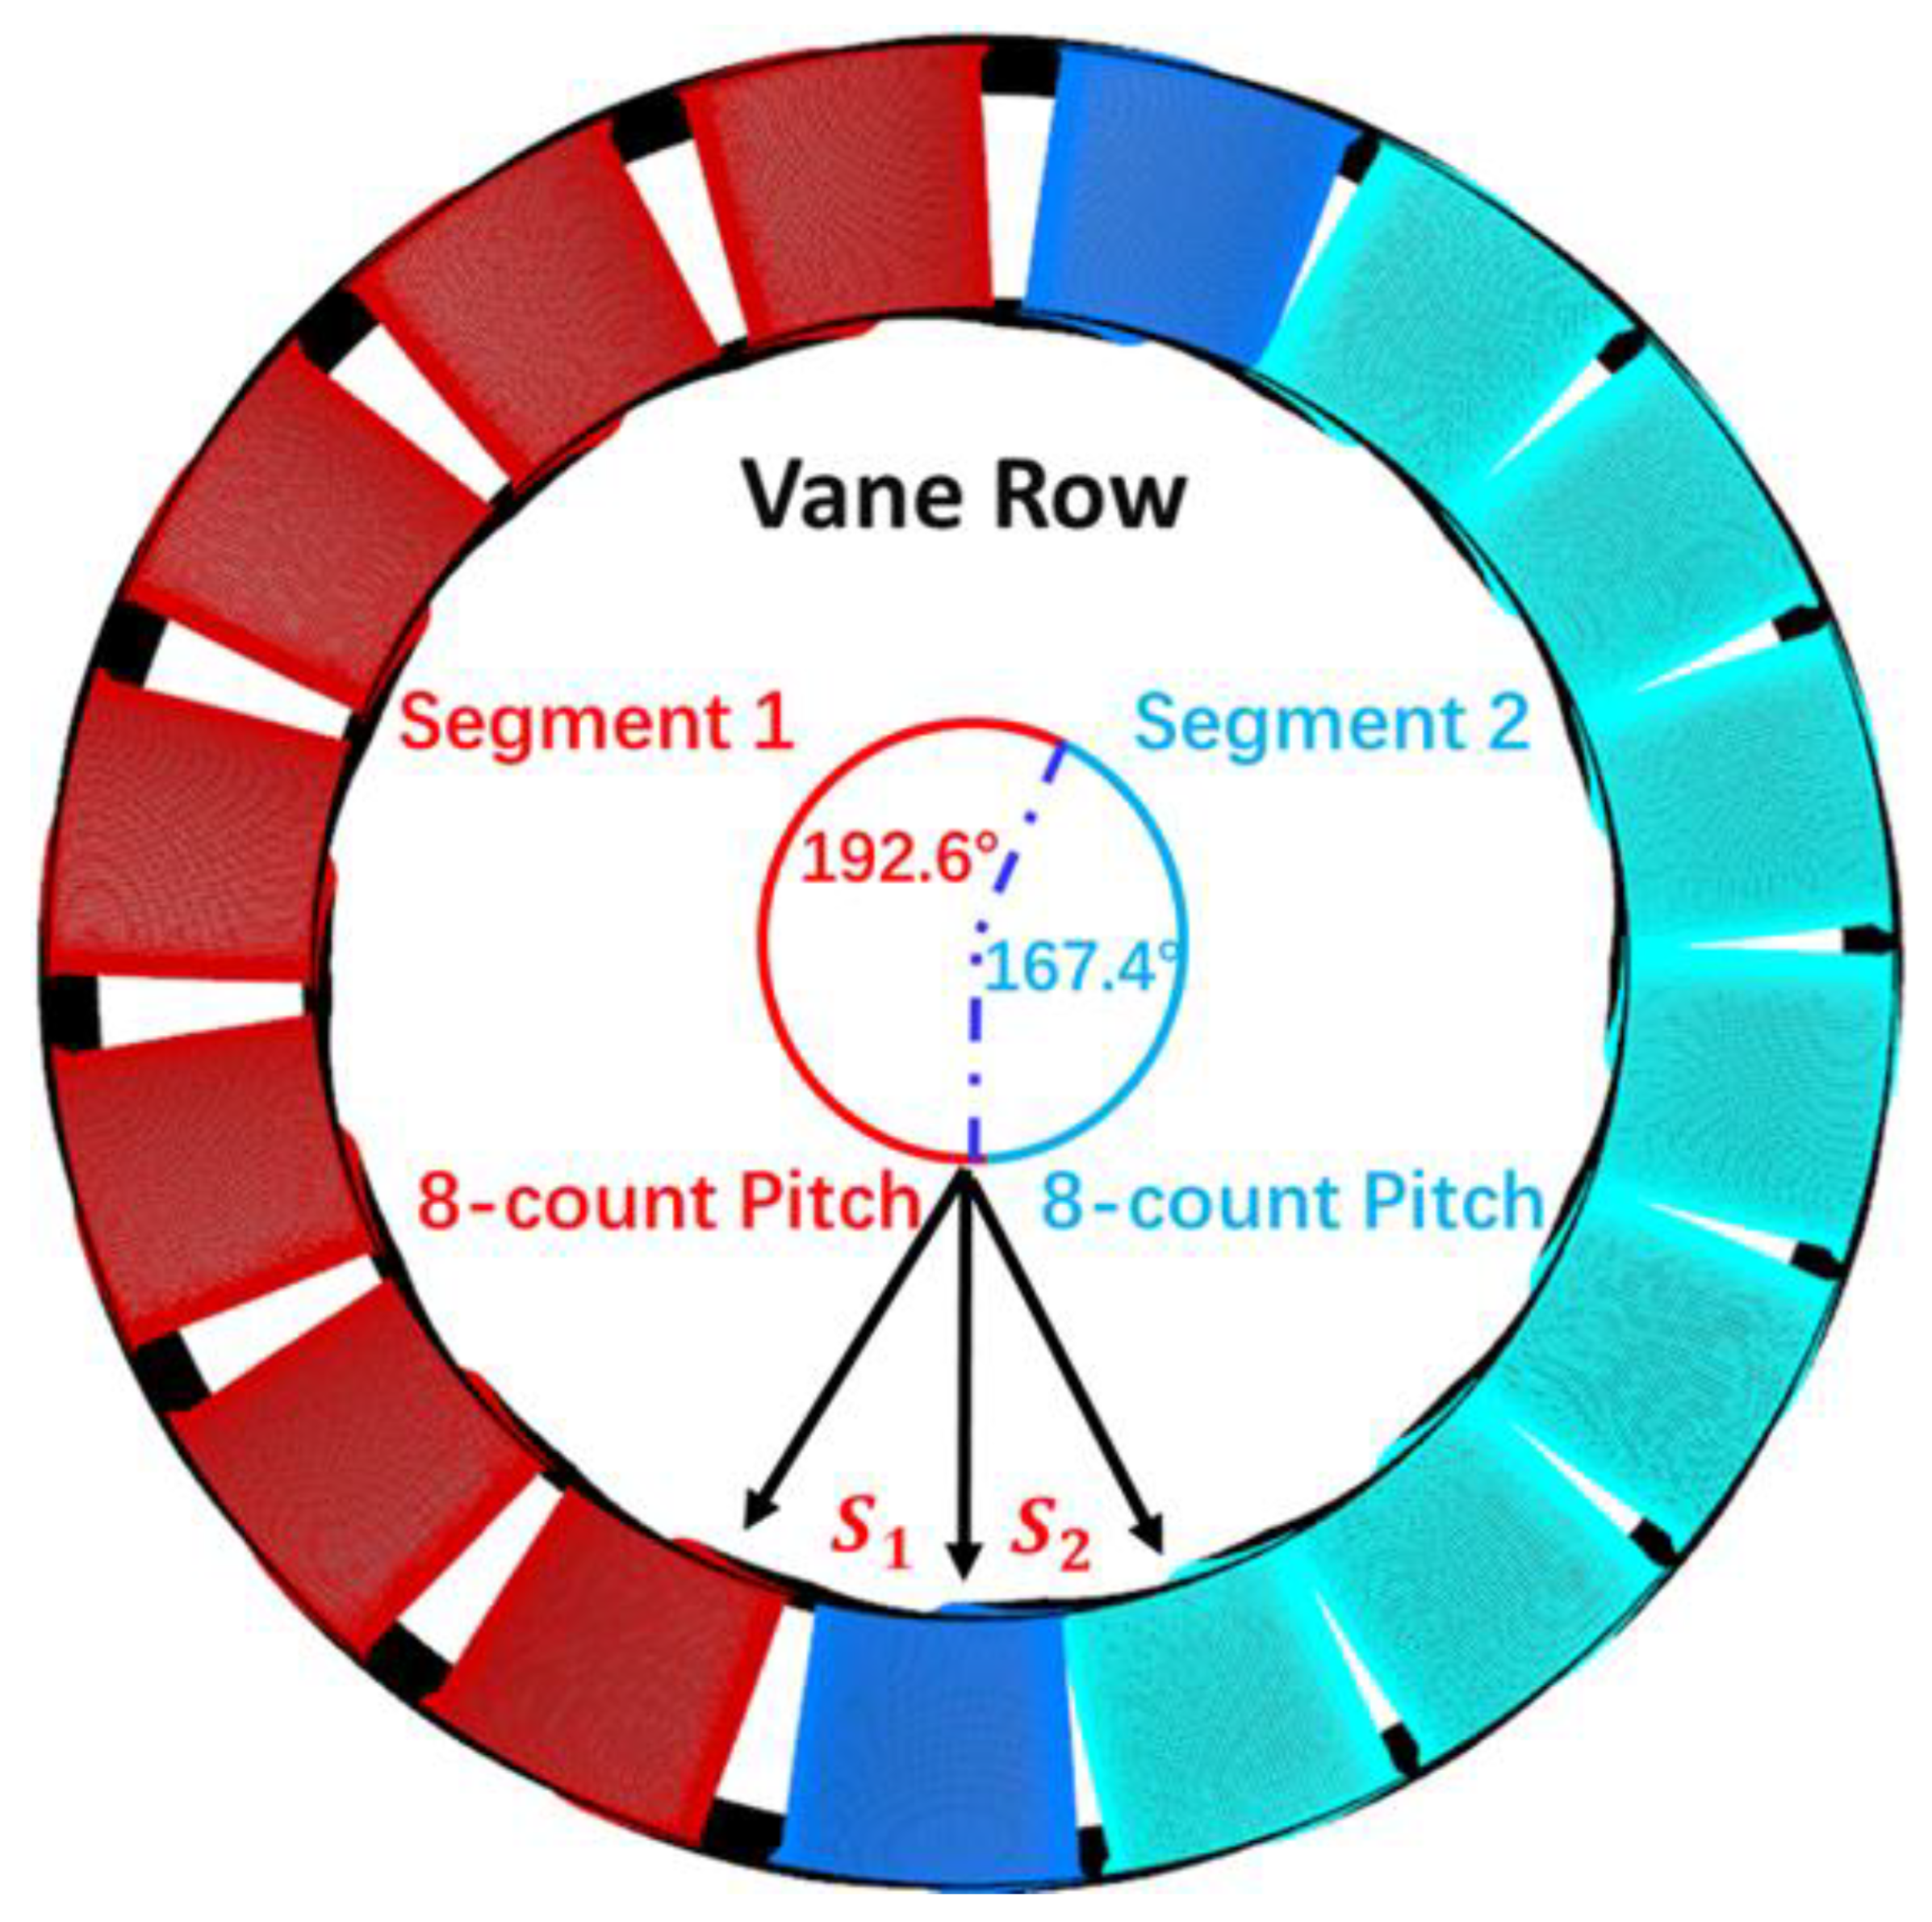
According to the above-detailed analyses regarding the flow mechanism of asymmetric vane pitch, regulating the vane pitch difference between two segments can effectively reduce the strength of the LEO excitations. Considering this, we propose the non-half two-segment layout, which can reduce both the amplitudes of the high-engine-order and LEO excitations. In the layout, the full-annulus vanes are divided into two segments with unequal angles, and the pitch counts of the two segments are equal. This configuration adjusts the vane pitch difference between two segments by changing the angle of each segment in order to achieve the purpose of suppressing the high amplitudes of LEO excitations caused by the asymmetric vane pitch. For the turbine stage in this paper (as shown in Figure 17), the blue blade is used as the dividing line, the angles of segment 1 and segment 2 are 192.6° and 167.4°, respectively, and eight-count pitches are evenly distributed in the two segments. The asymmetric vane configuration was identified as Case2_Asy88. Although similar configurations were studied in the literature [15,17], only the impacts of the configuration on high-engine-order excitations were considered.
Table 5 shows the magnitude of the vane pitches (called S) within the segments in the different cases, where subscripts 1 and 2 represent the two segments, respectively, and Δ S denotes the vane pitch difference between the two segments. The Δ S in Case2_Asy88 was reduced by 44.9% compared to Case1_Asy97.

5.5.2. Aerodynamic Excitation and Maximum Vibrational Amplitude

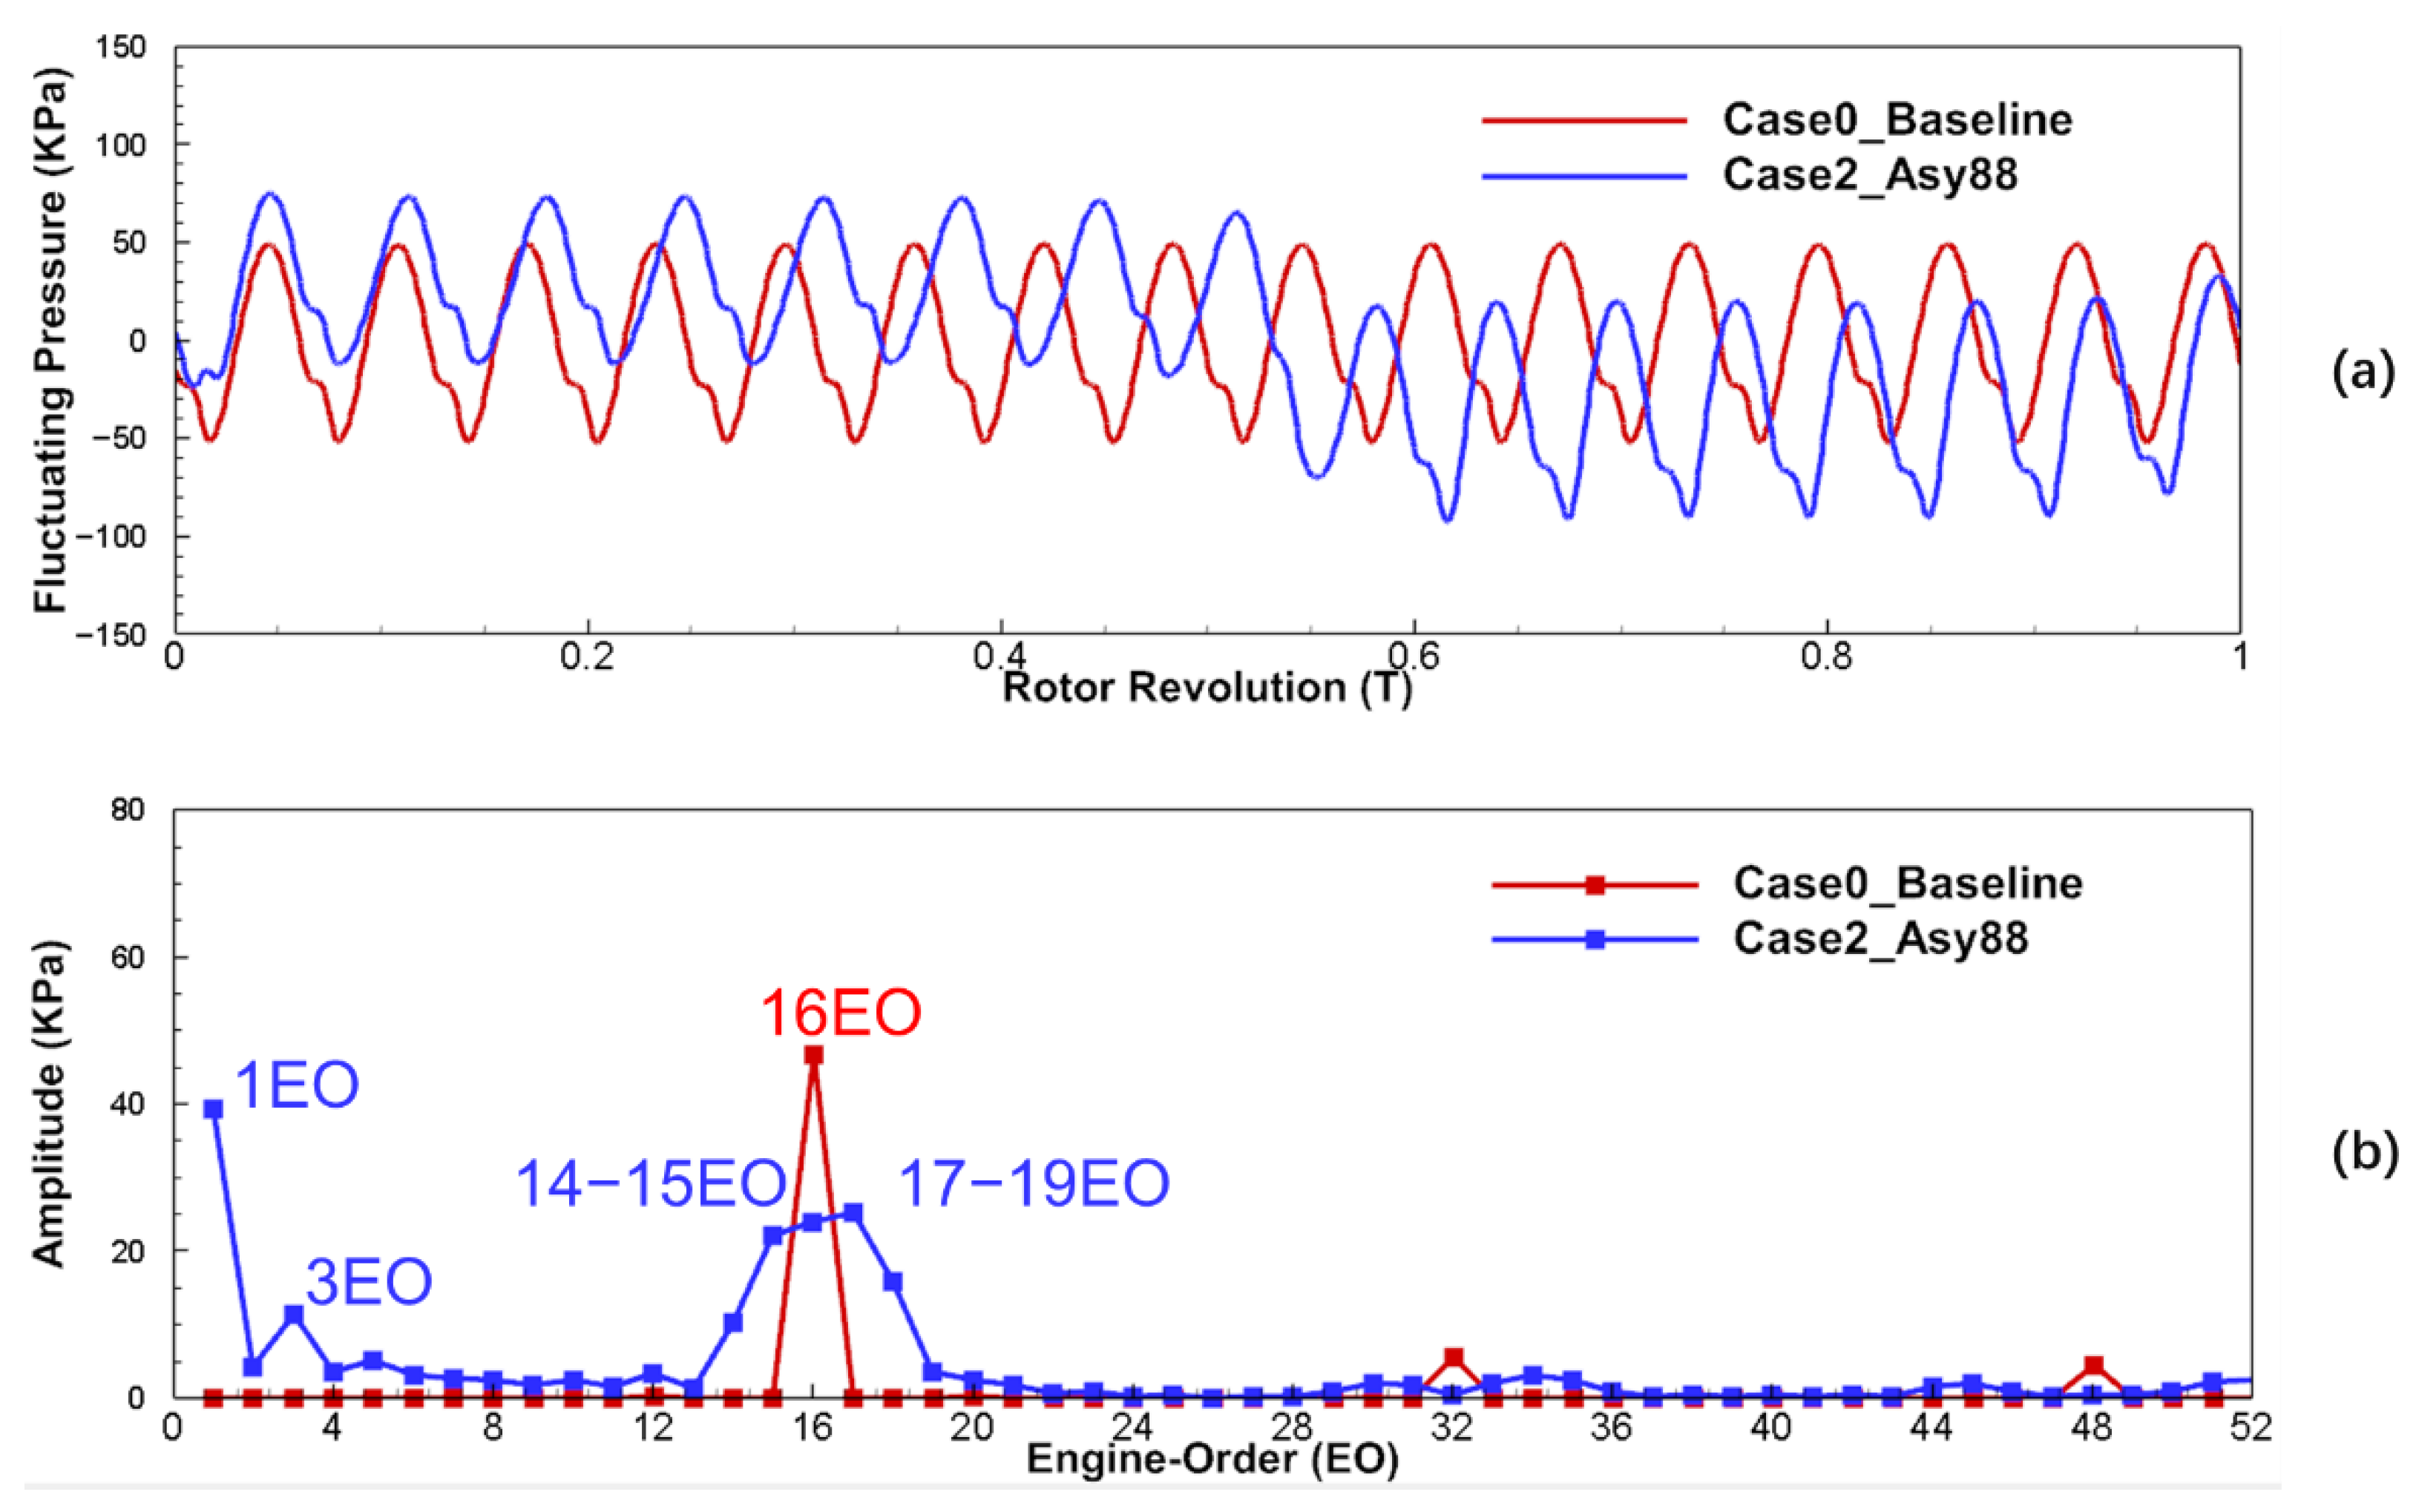
To study the reduction effect on the LEO resonance response of the rotor blade in Case2_Asy88, the resonance point D (intersection of 3EO excitation line and M1 modal of the rotor blades) in the Campbell diagram (Figure 6) was chosen, and the monitoring point P on the rotor blade (Figure 7) was selected. In Case2_Asy88 (blue line), the average and peak-to-peak amplitude variation law for the fluctuating pressure within segments 1 and 2 (Figure 18a) were basically the same as that for Case1_Asy97 but the difference in average amplitude between segments 1 and 2 was significantly reduced, resulting in lower amplitude LEO excitations, according to the flow mechanism elaborated in the previous section.
Frequency spectra of the fluctuating pressure (Figure 18b) demonstrate the excitation component of Case2_Asy88 more intuitively. Compared to Case1_Asy97, the frequency components of Case2_Asy88 were much more diverse and, according to the harmonic analysis theory of the excitation force of the forced response, the frequencies deconstructed by VPF can be calculated as (N1 ± 1) f r or (N2 ± 1) f r , where N1 and N2 are the vane pitch counts after being extended to the full-annulus, based on the angle of segments 1 and 2 (if the expanded pitch count is not an integer, round to an integer). The angle of segment 1 with an eight-count pitch was 192.6° and the pitch count extended to the full annulus was 15. The angle of segment 2 with an eight-count pitch was 167.4° and the pitch count extended to the full annulus was 17. Therefore, the high-order components in the frequency spectrum included 14EO, 15EO, 16EO, 17EO, and 18EO. In addition, although the amplitude of 16EO (VPF) was not reduced by more than 98% in Case2_Asy88 (blue line), as in Case1_Asy97, it was reduced by 48.32%. The most striking result to emerge from the frequency spectrum is that, compared to Case1_Asy97, the amplitudes of 1EO and 3EO were reduced by 43.55% and 45.80%, respectively, and Case2_Asy88 effectively reduced the strength of the LEO excitations, compared to Case1_Asy97. Furthermore, analysis of the frequency components, as detailed in this paragraph, can explain why the segmentation method considered in Section 4 affected the flow mechanistic analysis. The segmentation method shown in Figure 5b produced three different pitches and its frequency component will contain excitation orders extended from three pitches to the full-annulus, which leads to a completely different result from the intended design, with only two different pitches, thus bringing more complex spectral content.
The maximum vibrational amplitude was again used to evaluate the strength of the resonance response of the rotor blades. By comparing the 3ND response of the rotor blade at the 3-EO crossing in different cases (Table 6), the maximum vibrational amplitude of Case2_Asy88 was decreased by 45.49% compared to Case1_Asy97, indicating a significant reduction of the resonance response of LEO excitation. It is worth noting that the strength of the resonance response decreases with Δ S and both decrease in similar proportions (44.9% decrease in Δ S vs. 45.49% decrease in response strength). This indicates that Δ S is the key parameter used to initially predict the resonance response of LEO excitation on rotor blades in the asymmetric vane configuration.

5.5.3. Aerodynamic Performance

The non-half two-segment layout (Case2_Asy88) can reduce the resonance response of the LEO excitation, compared to the half-and-half layout (Case1_Asy97); however, it is worth also considering whether the aerodynamic performance will be negatively affected under Case2_Asy88.
In Table 7, the expansion ratio and aerodynamic efficiency in Case1_Asy97 were both reduced by more than 0.2%, compared to Case0_Baseline. In Case2_Asy88 proposed in this paper, the change in aerodynamic performance was less than 0.1% when compared with Case0_Baseline. As a result, the non-half two-segment layout presented significantly improved aerodynamic performance compared to the half-and-half layout.

6. Conclusions

Full-annulus unsteady aeroelasticity simulations were conducted using the in-house CFD code HGAE and the effect of an asymmetric vane configuration (half-and-half layout) recognized in the previous literature on reducing the forced response of rotor blades was investigated. This configuration was found to introduce non-negligible LEO excitations with high amplitude; moreover, the generation mechanism of LEO excitation was clarified, for the first time, from the perspective of flow physics. Thus, a more preferable and effective asymmetric vane pitch—non-half two-segment layout—was proposed in this paper, which achieves a better vibration control effect. Our conclusions are summarized as follows:
  • The asymmetric vane configuration (half-and-half layout) can effectively reduce the amplitude of the VPF excitation by shifting energy from VPF to neighboring frequencies but introduces high amplitude LEO excitations, such as 1EO and 3EO, which reached 129% and 45% of the amplitude of the 16EO excitation in the uniformly spaced vane configuration, respectively, thus increasing the risk of blade failure;
  • The potential field is the main source of LEO excitations for the rotor blade, which was determined for the first time, and the vane wake and potential field jointly affect the difference in the average pressure amplitude between the two segments. The larger the difference, the higher the strength of LEO excitations on the rotor blade. Furthermore, the strength of the potential field and the joint effect of the vane wake and potential field are affected by the vane pitch. Therefore, the vane pitch difference Δ S can be used to reduce the strength of the LEO excitation in asymmetric vane configurations;
  • The non-half two-segment layout was proposed and the results under this configuration showed that the amplitude of VPF was reduced by 48.32% compared to the uniformly spaced vane configuration. Furthermore, the maximum vibrational amplitude of the 3ND response of the rotor blade at the 3EO crossing operating condition was decreased by 45.49% compared to the half-and-half layout, thus effectively reducing the LEO excitation resonance response. In addition, compared to the uniformly spaced vane configuration, the aerodynamic performance was reduced by more than 0.2% under the half-and-half layout, while the change in aerodynamic performance with the non-half two-segment layout was less than 0.1%. The negative effect of the half-and-half layout on aerodynamic performance was, therefore, significantly alleviated by using the non-half two-segment layout.
The non-half two-segment layout can effectively reduce the amplitude of high-engine-order excitation and the strength of LEO excitation with a minimal negative impact on aerodynamic performance. As such, the results of this study provide a good theoretical basis for reducing blade vibration through the application of asymmetric vane pitch in engineering practice. Although the non-half two-segment layout works better than the half-and-half layout in this study, it is worth considering that the non-half two-segment layout introduces more spectral content (although with low amplitude). Whether new resonance risks will be generated as a result needs to be evaluated, based on Campbell diagrams and engineering applications. In addition, compared to the half-and-half layout, the non-half two-segment layout is relatively difficult to manufacture and assemble but this will be improved in the future, considering the continuous development of the level of mechanical processing.

Author Contributions

Conceptualization, X.J. and H.Y.; methodology, X.J. and H.Y.; software, Y.Z.; validation, Y.Z. and X.J.; formal analysis, X.J. and H.Y.; investigation, H.Y. and X.J.; resources, H.Y. and Y.Z.; data curation, Y.Z.; writing—original draft preparation, X.J.; writing—review and editing, X.J.; visualization, X.J.; supervision, H.Y.; project administration, Y.Z.; funding acquisition, Y.Z. All authors have read and agreed to the published version of the manuscript.

Funding

This research received no external funding.

Institutional Review Board Statement

Not applicable.

Informed Consent Statement

Not applicable.

Data Availability Statement

Not applicable.

Acknowledgments

This research was co-supported by the National Science and Technology Major Project, China (No. 2017-II-0009-0023).

Conflicts of Interest

The authors declare no conflict of interest.

References

  1. Fransson, T. Aeroelasticity in Axial Flow Turbomachines; Von Karman Institute for Fluid Dynamics: Sint-Genesius-Rode, Belgium, 1999. [Google Scholar]
  2. Lindenburg, C. Investigation into Rotor Blade Aerodynamics; ECN Wind Energy: Peten, Guatemala, 2003. [Google Scholar]
  3. Danforth, C.E. Designing to avoid fatigue in long life engines. SAE Trans. 1967, 75, 248–262. [Google Scholar]
  4. Greitzer, E.M.; Tan, C.S.; Wisler, D.C.; Adamczyk, J.J. Unsteady flow in turbomachines: Where’s the beef? In Proceedings of the ASME Winter Annual Meeting, Chicago, IL, USA, 6–11 November 1994. [Google Scholar]
  5. Wisler, D.C.; Shin, H.W. Blade row interaction and unsteady effects in axial-flow compressors and fans. Lec. Ser. Van Kareman Inst. Flu. Dyn. 1998, 2, G1–G54. [Google Scholar]
  6. Snyder, L.E.; Burns, D.W. Forced Vibration and Flutter Design Methodology; AGARD-AG-298-VOL-2; Detroit Diesel Allison: Indianapolis, IN, USA, 1988. [Google Scholar]
  7. Srinivasan, A.V. Flutter and resonant vibration characteristics of engine blades. J. Eng. Gas Turbines Power 1997, 119, 742–775. [Google Scholar] [CrossRef]
  8. Kielb, R.; Chiang, H.W. Recent Advancements in Turbomachinery Forced Response Analyses. In Proceedings of the 30th Aerospace Sciences Meeting and Exhibit, Reno, NV, USA, 12 January 1992. [Google Scholar]
  9. Chiang, H.W.D.; Kielb, R.E. An analysis system for blade forced response. J. Turbomach. 1993, 115, 762–770. [Google Scholar] [CrossRef]
  10. Sayma, A.I.; Vahdati, M.; Imregun, M. Turbine forced response prediction using an integrated non-linear analysis. Proc. Inst. Mech. Eng., Part K 2000, 214, 45–60. [Google Scholar] [CrossRef]
  11. Waite, J.J.; Kielb, R.E. The impact of blade loading and unsteady pressure bifurcations on low-pressure turbine flutter boundaries. J. Turbomach 2016, 138, 041002. [Google Scholar] [CrossRef]
  12. Corral, R.; Greco, M.; Vega, A. Effective clearance and differential gapping impact on seal flutter modeling and validation. J. Turbomach 2022, 144, 071010. [Google Scholar] [CrossRef]
  13. Jareland, M.H.; Csaba, G. Friction Damper Mistuning of a Bladed Disk and Optimization with Respect to Wear. In Proceedings of the Turbo Expo: Power for Land, Sea, and Air, Munich, Germany, 8–11 May 2000. [Google Scholar]
  14. Petrov, E.P. Stability analysis of multiharmonic nonlinear vibrations for large models of gas turbine engine structures with friction and gaps. J. Eng. Gas Turbines Power 2017, 139, 022508. [Google Scholar] [CrossRef] [Green Version]
  15. Hüls, M.; Panning-von Scheidt, L.; Wallaschek, J. Influence of geometric design parameters onto vibratory response and high-cycle fatigue safety for turbine blades with friction damper. J. Eng. Gas Turbines Power 2019, 141, 041022. [Google Scholar] [CrossRef]
  16. Hancock, B.J.; Clark, J.P. Reducing shock interactions in a transonic turbine via three-dimensional aerodynamic shaping. J. Propul. Power 2014, 30, 1248–1256. [Google Scholar] [CrossRef] [Green Version]
  17. Niu, X.; Wang, L.; Li, D.; Du, Q. Reduction of Turbine Blade Unsteady Forces by Shape Modification of Vanes for Industrial Gas Turbines. In Proceedings of the Turbo Expo: Power for Land, Sea, and Air, Seoul, Korea, 13–17 June 2016. [Google Scholar]
  18. Giel, P.W.; Shyam, V.; Juangphanich, P.; Clark, J.P. Effects of Trailing Edge Thickness and Blade Loading Distribution on the Aerodynamic Performance of Simulated CMC Turbine Blades. In Proceedings of the Turbo Expo: Power for Land, Sea, and Air, Online, 21–25 September 2020. [Google Scholar]
  19. Kemp, R.H.; Hirschberg, M.H.; Morgan, W.C. Theoretical and Experimental Analysis of The Reduction of Rotor Blade Vibration in Turbomachinery through the Use of Modified Stator Vane Spacing; NACA: Washington, DC, USA, 1958. [Google Scholar]
  20. Kaneko, Y.; Mori, K.; Okui, H. Study on the Effect of Asymmetric Vane Spacing on Vibratory Stress of Blade. In Proceedings of the Turbo Expo: Power for Land, Sea, and Air, Vienna, Austria, 14–17 June 2004. [Google Scholar]
  21. Sun, T.; Hou, A.; Zhang, M.; Niu, Y.; Gao, J.; Guo, H. Analysis on the Reduction of Rotor Blade Vibration Using Asymmetric Vane Spacing. In Proceedings of the Turbo Expo: Power for Land, Sea, and Air, Montreal, QC, Canada, 15–19 June 2015. [Google Scholar]
  22. Crall, D.W.; Manwaring, S.R. Periodic stator airfoils. U.S. Patent 6,439,838, 27 August 2002. [Google Scholar]
  23. Leng, Y.; Key, N.L. Effects of nonuniform blade spacing on compressor rotor flutter stability. J. Propul. Power 2021, 37, 682–692. [Google Scholar] [CrossRef]
  24. Niu, Y.; Hou, A.; Zhang, M.; Sun, T.; Wang, R.; Guo, H. Investigation on the Effect of Asymmetric Vane Spacing on the Reduction of Rotor Blade Vibration. In Proceedings of the Turbo Expo: Power for Land, Sea, and Air, Düsseldorf, Germany, 16–20 June 2014. [Google Scholar]
  25. Senn, S.M. Nozzle ring with non-uniformly distributed airfoils and uniform throat area. U.S. Patent 14/190,814, 25 September 2014. [Google Scholar]
  26. Simpson, A.J. Gas turbine engine stator vane asymmetry. U.S. Patent 10,443,391, 15 October 2019. [Google Scholar]
  27. Clark, J.P.; Aggarwala, A.S.; Velonis, M.A.; Gacek, R.E.; Magge, S.S.; Price, F.R. Using CFD to Reduce Resonant Stresses on a Single-Stage, High-Pressure Turbine Blade. In Proceedings of the Turbo Expo: Power for Land, Sea, and Air, Amsterdam, The Netherlands, 3–6 June 2002. [Google Scholar]
  28. Clark, J.P.; Anthony, R.J.; Ooten, M.K.; Finnegan, J.M.; Dean Johnson, P.; Ni, R.H. Effects of downstream vane bowing and asymmetry on unsteadiness in a transonic turbine. J. Turbomach 2018, 140, 101006. [Google Scholar] [CrossRef]
  29. Meng, Y.; Li, L.; Li, Q. Asymmetry stator mistuned blade design and research. J. Aerosp. Power 2007, 22, 2083–2088. [Google Scholar]
  30. Monk, D.J.; Key, N.L.; Fulayter, R.D. Reduction of aerodynamic forcing through introduction of stator asymmetry in axial compressors. J. Propul. Power 2016, 32, 134–141. [Google Scholar] [CrossRef]
  31. Bréard, C.; Green, J.S.; Imregun, M. Low-engine-order excitation mechanisms in axial-flow turbomachinery. J. Propul. Power 2003, 19, 704–712. [Google Scholar] [CrossRef]
  32. Trafford, T.; Stapelfeldt, S.; Puente-Rico, R.; Kulkarni, D. A Computational Study of Burner Failure Related Low Engine Order Forced Response Mechanisms in A High Pressure Turbine. In Proceedings of the 16th International Symposium on Unsteady Aerodynamics, Toledo, Spain, 19–23 September 2022. [Google Scholar]
  33. Schoenenborn, H.; Wohlfahrt, C.; Grosgurin, T.; Widera, T.; Jeschke, P. Forced-Response Measurements and CFD-Analysis of Higher Vibration Modes in a 2.5-stage Axial Compressor Rig. In Proceedings of the 16th International Symposium on Unsteady Aerodynamics, Toledo, Spain, 19–23 September 2022. [Google Scholar]
  34. Gambitta, M.; Beirow, B. Modeling method for aeroelastic low engine order excitation originating from upstream vanes geometrical variability. In Proceedings of the 16th International Symposium on Unsteady Aerodynamics, Toledo, Spain, 19–23 September 2022. [Google Scholar]
  35. Zheng, Y. Computational aeroelasticity with an unstructured grid method. J. Aerosp. Power 2009, 24, 2069–2077. [Google Scholar]
  36. Zheng, Y.; Yang, H. Full assembly fluid/structured flutter analysis of a transonic fan. J. Beijing Univ. Aeronaut. Astronaut 2013, 39, 626. [Google Scholar]
  37. Zheng, Y.; Jin, X.; Yang, H.; Gao, Q.; Xu, K. Effects of Circumferential Nonuniform Tip Clearance on Flow Field and Performance of a Transonic Turbine. In Proceedings of the Turbo Expo: Power for Land, Sea, and Air, Virtual, 21–25 September 2020. [Google Scholar]
  38. Zheng, Y. Computational Aerodynamics on Unstructed Meshes. Ph.D. Thesis, Durham University, Durham, UK, 2004. [Google Scholar]
  39. Zheng, Y.; Hui, Y. Coupled fluid-structure flutter analysis of a transonic fan. Chin. J. Aeronaut 2011, 24, 258–264. [Google Scholar] [CrossRef] [Green Version]
  40. Roe, P.L. Approximate Riemann solvers, parameter vectors, and difference schemes. J. Comput. Phys. 1981, 43, 357–372. [Google Scholar] [CrossRef]
  41. Van Leer, B. Towards the ultimate conservative difference scheme. J. Comput. Phys. 1997, 135, 229–248. [Google Scholar] [CrossRef]
  42. Jameson, A. Time Dependent Calculations Using Multigrid, with Applications to Unsteady Flows Past Airfoils and Wings. In Proceedings of the 10th Computational Fluid Dynamics Conference, Honolulu, HI, USA, 24–26 June 1991. [Google Scholar]
  43. Menter, F.R. Two-equation eddy-viscosity turbulence models for engineering applications. AIAA J. 1994, 32, 1598–1605. [Google Scholar] [CrossRef] [Green Version]
  44. Marshall, J.G.; Imregun, M. A review of aeroelasticity methods with emphasis on turbomachinery applications. J. Fluids Struct. 1996, 10, 237–267. [Google Scholar] [CrossRef]
  45. Elahi, H.; Eugeni, M.; Gaudenzi, P. Piezoelectric Aeroelastic Energy Harvesting; Elsevier: Amsterdam, The Netherlands, 2021. [Google Scholar]
  46. Bréard, C.; Vahdati, M.; Sayma, A.I.; Imregun, M. An integrated time-domain aeroelasticity model for the prediction of fan forced response due to inlet distortion. J. Eng. Gas Turbines Power 2002, 124, 196–208. [Google Scholar] [CrossRef]
  47. Vahdati, M.; Sayma, A.I.; Imregun, M.; Simpson, G. Multibladerow forced response modeling in axial-flow core compressors. J. Turbomach 2007, 129, 412–420. [Google Scholar] [CrossRef]
  48. Li, J.; Aye-Addo, N.; Kormanik, N., III; Matthews, D.; Key, N.; Kielb, R. Mistuned Higher-Order Mode Forced Response of an Embedded Compressor Rotor: Part I—Steady and Unsteady Aerodynamics. In Proceedings of the Turbo Expo: Power for Land, Sea, and Air, Charlotte, NC, USA, 26–30 June 2017. [Google Scholar]
  49. He, L. Unsteady Flow and Aeroelasticity; CRC Press: Boca Raton, FL, USA, 2003; pp. 257–308. [Google Scholar]
  50. Korakianitis, T. On the prediction of unsteady forces on gas turbine blades: Part 2–Analysis of the results. J. Turbomach 1992, 114, 123–131. [Google Scholar] [CrossRef]
  51. Korakianitis, T. Influence of stator-rotor gap on axial-turbine unsteady forcing functions. AIAA J. 1993, 31, 1256–1264. [Google Scholar] [CrossRef]
Figure 1. Comparison of aerodynamic performance at different mesh levels.
Aerospace 09 00694 g001
Figure 2. Computational mesh of the turbine stage: (a) Single-passage; (b) Full annulus.
Aerospace 09 00694 g002
Figure 3. FE model of the rotor blade.
Aerospace 09 00694 g003
Figure 4. Schematic of Half-and-Half Layout.
Aerospace 09 00694 g004
Figure 5. Schematic of different asymmetric configurations with segmentation method based on (a) Pitch count; (b) Vane count.
Aerospace 09 00694 g005
Figure 6. Campbell diagram.
Aerospace 09 00694 g006
Figure 7. Schematic diagram of monitoring point P and the time histories of the fluctuating pressure.
Aerospace 09 00694 g007
Figure 8. Frequency spectra of fluctuating pressure at monitoring point P.
Aerospace 09 00694 g008
Figure 9. (a) Time histories of the fluctuating pressure at monitoring point P; (b) Frequency spectra of fluctuating pressure at monitoring point P.
Aerospace 09 00694 g009
Figure 10. The entropy contour at midspan for Case0_Baseline.
Aerospace 09 00694 g010
Figure 11. Circumferential distribution of the midspan entropy wakes at the vane exit.
Aerospace 09 00694 g011
Figure 12. Spatial spectra of the midspan entropy wake at the vane exit.
Aerospace 09 00694 g012
Figure 13. (a) Circumferential distributions of transient pressure at the vane exit; (b) Spatial spectra of the transient pressure at the vane exit.
Aerospace 09 00694 g013
Figure 14. Time-averaged pressure distribution on the vane surface (midspan).
Aerospace 09 00694 g014
Figure 15. Circumferential distribution of the transient pressure and entropy (midspan).
Aerospace 09 00694 g015
Figure 16. Circumferential distribution of the transient pressure and entropy for different cases, where the ratio of vane counts to rotor blade counts was: (a) 16:48; (b) 14:48; (c) 18:48.
Aerospace 09 00694 g016
Figure 17. Schematic of Non-half Two-segment Layout.
Aerospace 09 00694 g017
Figure 18. (a) Time histories of the fluctuating pressure at monitoring point P; (b) Frequency spectra of fluctuating pressure at monitoring point P.
Aerospace 09 00694 g018
Table 1. Geometrical parameters.
ParameterVane RowRotor Row
Airfoil count1647
Axial chord (midspan) (mm)9733
Airfoil height (mm)7574
Aspect ratio (exit height/chord)0.772.24
Rotor tip clearance (mm)/1
Table 2. Material properties.
Elasticity Modulus
(GPa)
Poisson’s RatioDensity
(g/cm3)
1550.318.44
Table 3. Comparison of CFD Results.
ParameterAerodynamic EfficiencyExpansion Ratio
HGAE0.89541.7616
NUMECA0.89881.7587
Error0.378%0.165%
Table 4. Maximum vibrational amplitude of different cases.
Case
(NDs)
EO ExcitationResonant Speed
(rpm)
Maximum Vibrational Amplitude
(mm)
Change Rate
Case0_Baseline
(16 NDs)
16EOs10,535.10.174——
Case1_Asy97
(18 NDs)
18EOs9460.220.053−69.91%
Case1_Asy97
(14 NDs)
14EOs11,742.50.085−51.20%
Case1_Asy97
(16 NDs)
14EOs11,742.50.003−98.15%
Case1_Asy97
(16 NDs)
18EOs9460.220.002−98.64%
Case1_Asy97
(3 NDs)
3EOs14,928.42.01810.55
Table 5. Comparison of vane pitch for each case.
Case S 1 (mm) S 2 (mm) Δ S (mm)
Case0_Baseline88.30988.3090
Case1_Asy9778.497100.9322.43
Case2_Asy8882.12894.49112.36
Table 6. Maximum vibrational amplitude in different asymmetric cases.
Case
(NDs)
EO ExcitationResonant Speed
(rpm)
Maximum Vibrational Amplitude
(mm)
Change Rate
Case1_Asy97
(3 NDs)
3 EOs14,928.42.018——
Case2_Asy88
(3 NDs)
3 EOs14,928.41.100−45.49%
Table 7. Aerodynamic performance of different asymmetric cases.
CaseAerodynamic EfficiencyExpansion Ratio
Case0_Baseline0.894981.755
Case1_Asy970.893051.750
Case2_Asy880.894531.754
Publisher’s Note: MDPI stays neutral with regard to jurisdictional claims in published maps and institutional affiliations.