Article

Analysis of NO Formation and Entropy Generation in a Reactive Flow

by
Milad Mohammadi
1 and
Mohammad Sadegh Abedinejad
2,*
1
School of Mechanical Engineering, Iran University of Science and Technology, Tehran 16846-13114, Iran
2
Department of Mechanical Engineering, Faculty of Engineering, Alzahra University, Tehran 19938-93973, Iran
*
Author to whom correspondence should be addressed.
Aerospace 2022, 9(11), 666; https://doi.org/10.3390/aerospace9110666
Submission received: 26 September 2022 / Revised: 10 October 2022 / Accepted: 12 October 2022 / Published: 28 October 2022
(This article belongs to the Section Aeronautics)

Abstract

:
A comprehensive investigation of turbulent combustion is accomplished to study the relationship between nitrogen oxide (NO) formation and entropy generation distribution in a non-premixed propane combustion. The radiation heat transfer and combustion are simulated, employing the discrete ordinates model and laminar flamelet model, respectively. A post processing model is employed to estimate the NO formation rate. The present results of NO species formation, mean temperature and velocity are compared with the existing experimental data, and good agreements are obtained. It is shown that the main region of total entropy generation rate and NO formation rate is at the same axial position. The entropy generation distribution may be defined as an index by which the combustion region and main region of NO formation are predicted. However, total entropy generation rate is more sensitive to high temperature (1500–1930 K) than that of NO formation rate. With an increase of 28.7% in temperature, the entropy generation and NO formation rates rise by 900% and 127%, respectively. The occurrence of chemical reactions plays the major role in the generation of entropy.

1. Introduction

The presence of nitrogen oxide (NO) has destructive effects on the atmosphere, such as ozone depletion, acid rain and photochemical smog. Many factors including inlet air temperature, residence time, pressure and fuel atomization have a direct impact on NO formation in combustion flows. Numerous methods have been proposed to decrease the formation of NO in gas turbine combustors, comprising water injection, selective catalytic reduction, and exhaust gas recirculation (EGR).
In recent years, several studies have been carried out, aiming to recognize the reasons for NO formation and its reduction. Jiang and Campbell [1] examined the formation of NO species in a propane/air diffusion flame. They simulated the turbulent flow and combustion phenomenon, using the RNG k ε turbulence and the presumed density function (PDF) models, respectively. Their study indicated that through reasonable predictions of the temperature and velocity fields, NO formation was also predicted acceptably, employing the post-processing and semi-empirical models of NO. Meunier et al. [2] studied NOx formation in propane combustion. They employed the k ε standard turbulence model and stretched laminar flamelet model for the simulation of turbulent flow and combustion, respectively. Their results showed that the residence time of reaction products in the high temperature reaction region is a substantial effective factor in NOx scaling. However, non-equilibrium effects are not significant for NOx scaling in propane flames.
Bazdidi-Tehrani et al. [3] investigated the effect of the inlet air mass fraction from the swirler, primary and secondary holes of a model gas turbine combustor on combustion characteristics, employing the flamelet combustion and realizable k−ε turbulence model. Their results showed that the primary air inlet had a major role in NO concentration and other combustion characteristics. Watanabe et al. [4] simulated the spray combustion to study the formation of soot and NO . The post-processing model was applied to model the formations of prompt and thermal NO . They showed that by applying a baffle plate to the combustor, the mole fraction of NO decreased by 40%. In addition, the radiation of soot had a considerable influence on the distribution of temperature. Guo and Smallwood [5] investigated the interaction between NO and soot formations in an ethylene-air combustion. They stated that the effect of NO formation on soot formation was negligible.
Saqr et al. [6] studied the impact of free-flow turbulence on the pollutant formations in CH 4 /air flames. They employed the eddy dissipation model (EDM) and the k ε turbulence model for the simulation of combustion and turbulent flow, respectively. The outcomes displayed a rise in turbulence intensity, leading to a significant reduction in pollutant formations. Gascoin et al. [7] demonstrated that the thermal effect of carbon dioxide (CO2) was a more influential factor on NOx formation, as compared with the other chemical and radiative factors in methane diffusion flames. Parkash et al. [8] reported the influence of an outlet gas recirculation on the CO and NOx formations within a gas turbine combustion chamber. The results demonstrated that by employing outlet gas recirculation, a reduction occurred in NOx formation, as compared with the air oxidizer emission levels at elevated pressures.
Peng et al. [9] simulated NO formation and turbulent combustion in propane/air flames. They indicated that NO was formed in the upstream zone of the combustion chamber. The rate of prompt NO was high near the inlet, while the thermal NO concentration was high in a large region of the upstream. In addition, with flue gas recirculation, a significant reduction occurred in the emission of nitrogen oxides (NOX). Xu et al. [10,11] stated the cylindrical length section and nozzle axis distance of a self-reflux burner can influence oxygen and NOx concentrations.
The sensitivity analysis of Xu et al. [12] displayed how CH, CH2 and C play a significant role in the destruction of NOx and that NO generation in the primary zone may be seriously diminished by staged combustion. They noticed that the types of re-burning fuel, the ratio of fuel–air in the primary zone, the mass factor of the re-burning fuel in the overall fuel, and the combustion temperature in the re-burning zone, were the major factors which affected NO reduction. Yuan and Naruse [13] studied diffusion combustion within a gas furnace with diluted and greatly pre-heated air. They reported that reducing the concentration of oxygen in the pre-heated air can improve the temperature distribution uniformity and decrease the NOx emission in the furnace.
The formation of NO can be a result of the irreversible sources in the gas turbine combustor. Irreversibility can be expressed as entropy generation. The main origins of irreversibility in the combustive flow are the body force, viscous dissipation, heat conduction, chemical reaction and diffusion of mass [14]. If gravity is the only existing volumetric body force in the flow, the generation of entropy due to this force can be neglected.
Wang et al. [15] reported the generation of entropy in an oxy combustion of single particles of coal. They displayed the biggest source of entropy generation to be the irreversible combustion reactions. Gholamalizadeh et al. [16] studied the generation rate of entropy and heat transfer characteristics in the non-premixed combustion of methane-air within a tube. The results revealed that with an equivalence ratio growth, the generation rate of entropy rose linearly for 1 and increased smoothly for > 1 .
Wang et al. [17] analyzed the generation of entropy in methane-air combustion inside a narrow channel. They used entropy generation to identify the different factors causing instability. Their results depicted how, during the course of the propagation phase of flame, the generation of entropy as a result of the combustion reactions prevailed, while thermal conductivity had a significant role in the flame extinction phase. Chen [18] studied the interaction between the equivalence ratio, generation of entropy and inlet Reynolds number in the combustion of hydrogen-air. It was revealed that the generation rate of total entropy was significantly sensitive to the inlet Reynolds number. However, it was independent of the equivalence ratio.
Jejurkar and Mishra [19] carried out a study on entropy generation in air-hydrogen combustion. Their numerical results demonstrated that transport processes and chemical reactions influences entropy generation. Furthermore, chemical reactions had a key role for most of the generated entropy. Moreover, since mass and heat transfer had a considerable effect on balancing combustion irreversibility and decreasing entropy generation for the rich flame, the overall combustion entropy generation rates showed a different trend concerning the temperature of the flame on the rich side.
Wenming et al. [20] calculated the generation of entropy inside a micro-combustor with an inserted block. A detailed reaction mechanism comprising 19 reactions and nine species was used to model the reactive flow. They reported that an inserted block caused less entropy generation. Hunt et al. [21] investigated heat transfer and generation of entropy within micro-reactors. Their results indicated that the lack of thermal symmetry of the reactors was an important source of irreversibility and that by changing it, the total entropy generation can be minimized. Among all the irreversibility sources in a reactive flow, the most important parameter in the generation of entropy is the combustion reaction. Mohammadi and Ajam [22] studied the generation of entropy in methane combustion with a porous burner. Their results showed that chemical reactions and heat transfer provided the main contributions to entropy generation.
As mentioned above, many investigations have been accomplished into NO formation and entropy separately. Nevertheless, none has been dedicated to the analysis of the relationship between NO formation and the rate of entropy generation. The present paper discusses ways to control NO formation. It suggests which type of entropy generation has the major role in a reactive flow. It also introduces a pointer by which the combustion region and the main region of NO formation are predicted in a combustor. To carry out this goal, the NO formation mechanisms comprising prompt and thermal are assessed. In addition, the main origins of entropy generation in a reactive flow encompassing chemical reactions, viscous dissipation, diffusion of mass and heat conduction are discussed. The laminar flamelet combustion and realizable k ε turbulence models are employed for simulating the combustion and turbulent flow in a model combustor, respectively. In addition, NO formation and e radiation heat transfer are modeled, using a post-processing model and the discrete ordinates model (DOM), respectively. The available experimental data of Jiang and Campbell [1] is employed for validating the present results by direct comparisons concerning the NO concentration, velocity and temperature distributions.

2. Numerical Details

2.1. Governing Equations

In order to simulate the reactive turbulent gas flow, the conservation equations of mass, chemical species mass, momentum and energy are employed. These equations are expressed in a general form, as follows [23]:
t ( ρ Ψ k ) + x j ( ρ u j Ψ k ) = x j ( Γ Ψ Ψ k x j ) + S Ψ k
where S Ψ and Γ Ψ represent the source term and coefficient of effective diffusion, respectively. Ψ is a dependent variable comprising mass, species mass fraction, temperature and components of velocity.
Some extra terms such as the “Reynolds stresses tensors” are generated as a result of the Favre-averaging of the conservation equations. According to several studies [24,25,26,27,28], the realizable k ε model [29] is presently utilized for modeling the viscous “Reynolds stresses” in a model combustor.
In line with the previous works [3,30,31,32,33] regarding the modeling of NOx and combustion, the chemical reactions in the present model combustor are modeled employing the laminar flamelet combustion model [34]. The interaction between combustion and turbulent flow is described via the β P D F [35]. In this study, propane ( C 3 H 8 ) is considered as the fuel. A combustion mechanism [36] that comprises 2141 chemical reactions and 115 species of propane is used to feed the flamelet database. For more information about the flamelet model, the references [34,37,38] are available.

2.2. Radiation Modeling

In a reactive flow, the radiation heat transfer must be modeled, owing to the existence of a great temperature zone [39,40,41,42]. DOM [43] is applied to model the thermal radiation, which is expressed as follows:
d ( I s ) d x i + ( α + α p + σ p ) I ( r · s ) = α n 2 σ T 4 π + E p + σ p 4 π 0 4 π I ( r · s ´ ) η ( s · s ´ ) d Ω ´
E p = l i m V 0 n = 1 N ε p n A p n σ T p n 4 π V
α p = l i m V 0 n = 1 N ε p n A p n V
A p n = π D p n 2 4
σ p = l i m V 0 n = 1 N ( 1 σ p n ) ( 1 ε p n ) A p n V
where   I denotes the radiation intensity. α , α p and σ p are the absorption coefficient, equivalent absorption coefficient, and equivalent particle scattering factor, respectively.   r and s represent the position vector and direction vector, respectively.   n   and   E p are the refractive index and equivalent emission, respectively. A p n , D p n and T p n are the surface area of particle, particle diameter and particle temperature, respectively.
Since the characteristics of combustion (i.e., species concentration and temperature) through the reaction process [44] change continuously, the weighted sum of grey gases model (WSGGM) [45] is applied for utilizing the non-constant absorption coefficient of the combustion species. Readers may refer to the references [3,46,47] for further information on DOM and WSGGM.

2.3. Calculation of Entropy Generation

Five irreversible processes that play an important role in the generation rate of entropy (i.e., chemical reactions, heat conduction, diffusion of mass, body force, and viscous dissipation) can be expressed by the following equations [14,48,49,50,51]:
S t o t a l = S v i s c o u s   d i s s i p a t i o n + S h e a t   c o n d u c t i o n + S m a s s   d i f f u s i o n + S c h e m i c a l   r e a c t i o n + S b o d y   f o r c e
Equation (3) is derived from the following transport equation of entropy [14]:
S t = [ τ : V T q c · T T 2 1 T i j i ( s i · T + γ i ) + i f i · j i T i ω i · γ i T   ] + [ i · ( j i s i ) · ( q c T ) ]
According to Fick’s Law and Fourier’s law:
j i = ρ D i m i x y i             &             q c = k e f f T
( s i . T + γ i ) = ( R T x i ) x i   ( Assuming   an   ideal   gas )
Eventually, Equation (4) can be expressed by:
S t o t a l = τ : V T k e f f T · T T 2 + R i ρ D i m i x x i y i · x i + i f i · j i T i ω i · γ i T
where   D i m i x denotes the diffusion mass coefficient of species i in the mixture and τ is viscous stress. γ i and ω ˙ i are chemical potential and reaction rate of species i , respectively.   X i and Y i signify mole and mass fractions of species i in the mixture, respectively.   f i   and   j i are body force and mass flux of species i , respectively. The fourth term on the right hand side of Equation (6) can be neglected (i.e., the only body force factor ( f i ) is gravity, and its effect is negligible). Finally, Equation (6) (i.e., 6a to 6d) is achieved for the computation of the generation rate of entropy:
S v i s c o u s   d i s s i p a t i o n = τ : V T = μ e f f . Φ T Φ = 2 [ ( u x ) 2 + ( v y ) 2 + ( w z ) 2 ] + [ ( v x + u y ) 2 + ( v z + w y ) 2 + ( u z + w x ) 2 ] 2 3 ( u x + v y + w z ) 2
S h e a t   c o n d u c t i o n = k e f f T · T T 2 = k e f f T 2 ( ( T x ) 2 + ( T y ) 2 + ( T z ) 2 )
S m a s s   d i f f u s i o n = R i ρ D i m i x x i y i · x i = R i ρ D i m i x y i [ ( y i x ) 2 + ( y i y ) 2 + ( y i z ) 2 ]
S c h e m i c a l   r e a c t i o n = i ω i · γ i T γ i = e i ( T ) T · S i ° ( T ) + R T l n ( x i · P P r e f )   ( for an ideal gas )

2.4. NO Modeling

Since NO is produced in trace quantities and its concentration has an insignificant influence on the flow field computations, the prompt and thermal NO are presently post processed during the calculation. The formation rate of thermal NO is predicted according to the extended mechanism of Zeldovich [52,53]:
N 2 + O NO + N
O 2 + N NO + O
N + OH NO + H
The formation rate of thermal NO is computed through the following expression (with a quasi-steady state assumption for the nitrogen atoms concentrations) [54]:
R N O , t h = 2 k f , 7 a [ O ] [ N 2 ] 1 k b , 7 a k b , 7 b [ NO ] 2 k f , 7 b [ O 2 ] k f , 7 a [ N 2 ] 1 + k b , 7 a [ NO ] k f , 7 b [ O 2 ] + k b , 7 c [ OH ]
Parameter k signifies the reaction rate constant. The method of partial equilibrium is employed for calculating OH and O radicals concentrations [55]. The formation rate of prompt NO is obtained by the equation of De Soete [56], which is expressed by the following equation:
R N O , p r = f c [ O 2 ] a [ N 2 ] [ C 12 H 24 ] A T β e x p ( E R T )
where f c is a correction factor and a is the reaction order. E and A indicate the activation energy and pre-exponential factor, respectively.

2.5. Solution Procedures

The solution to the equations of continuity, momentum, energy and chemical species mass conservation is performed applying a finite volume method (FVM) [57] three-dimensionally alongside the DOM, laminar flamelet combustion and realizable k ε models. The discretization of diffusion and advection terms is carried out by applying the central difference and second-order upwind techniques, respectively. The equations are implicitly linearized. Furthermore, the equations are discretized employing the second-order scheme. For coupling the pressure and velocity terms, the SIMPLE C algorithm [58] is applied. By considering 5 divisions in both the polar and azimuthal directions of every octant surrounding the control volume, 200 angular directions for the solid space angle ( 4 π ) are counted for the computation of the thermal radiation, using DOM. The numerical simulations are performed considering the convergence criterions of 10 6 for energy, species, momentum, combustion and thermal radiation equations, and 10 5 for the continuity of mass. At the primary step of the solution procedure, the partial differential conservation equations are solved. The transport equation for attaining the NO distribution is then solved.

3. Model Combustor and Boundary Conditions

In this study, a model combustor geometry presented by Jiang and Campbell [1] is employed to perform further investigations concerning NO formation and entropy generation. As shown in Figure 1, the model combustor contains three main parts, namely, inlet nozzle, combustion chamber and outlet nozzle. At the end of the bluff body, a flame holder in the shape of a disk of 63.5   mm diameter is used. The combustor includes a tubular chamber of 101   mm inner diameter and 420   mm length, surrounded by a 25.4   mm dense fibered blanket of Al2O3. The mass flow rate and temperature of propane fixed at 0.0162   kg / s and 293   K , respectively, is introduced through a gas nozzle placed at the core of the bluff body. The 0.55   kg / s air flows through the inlet nozzle at 288   K temperature and then exits through the outlet nozzle at a pressure of 1.0 atm .
The model combustor is made of stainless steel, and all three parts (including inlet nozzle, combustion chamber and outlet nozzle) are considered as the computational domain. For entrance into the computational domain, the velocity inlet boundary condition, and for exit the pressure outlet boundary condition, are specified.
The adiabatic and no-slip conditions are presumed as wall thermal and velocity boundary conditions. Radiation heat transfer is considered by assuming a wall emissivity of 0.075. The boundary conditions and geometrical information are noted in Table 1.
An evaluation of the independence of present results from grid size is performed by comparing four different sizes of grids, from 250 , 000 to 1 , 500 , 000   cells. Further information on these grids is provided in Table 2.
Figure 2 demonstrates the grid independence for NO concentration and mean temperature profiles along the model combustor’s center-line. According to the profiles of mean temperature and NO concentration, the largest deviations of grid (C) from grid (D) are about 2.41% and 3.12%, respectively. Grid (C) with 1 , 000 , 000 cells provides enough accuracy and has a lower cost, as compared with grids (A), (B) and (D). Therefore, grid (C) is applied for further computations throughout the present numerical work. According to the profiles of NO concentration and mean temperature, the largest deviations of grid (A) from grid (D) are almost 31.53% and 28.10%, respectively.
As mentioned before, the computational domain comprises three main parts, namely, inlet nozzle, combustion chamber and outlet nozzle. For the discretization of the geometry the structured grids are employed, as shown in Figure 3. At the combustion region (as the main computational domain of the model combustion chamber) and near the walls (owing to the gradients of pressure) finer grids are generated. For keeping the Y + in the range 30−40 so as to model the turbulent flow [59], the standard wall functions are utilized.

4. Results and Discussion

For the discussion of the simulation results encompassing velocity profiles, temperature profiles and NO concentration distributions, comparisons are made with the available experimental data of Jiang and Campbell [1]. In addition, the mechanisms of the entropy generation and NO formation are addressed. The evaluation of the present simulations accuracy is performed by employing the mean deviation (MD) parameter, which is expressed by Equation (12):
MD = | E x p e r i m e n t a l   d a t a N u m e r i c a l   r e s u l t s | E x p e r i m e n t a l   d a t a × 100
Figure 4 demonstrates the present simulations of the mean time temperature and X-velocity (velocity component in X direction) profiles, along the center-line of the model combustion chamber. Reasonable agreement is observed by comparing the existing experimental data [1] and the current results with the mean deviations of less than 7.3% for the mean temperature and 9.3% for X-velocity. The mean temperature distribution is of almost the same trend as that of the experiment. Where the flow enters the combustion chamber ( X = 0.0   m ), due to the presence of the flame holder, a recirculation occurs, which can be seen in Figure 4 and Figure 5. This recirculation zone is slightly wider than the experimental data one. The recirculation zone starts from the beginning of the combustion chamber ( X = 0.0   m ) and continues until X = 0.11   m . After that, the velocity continuously rises along the combustion chamber. When the flow reaches the outlet nozzle, the velocity increases promptly.
Figure 5 represents the contours of the mean temperature and total velocity (resultant velocity vector) along the mid-plane of the model combustor. According to the mean temperature distributions in Figure 4 and Figure 5, the combustion zone is limited at X = 0.05   m toward approximately X = 0.35   m . In this region, because of combustion occurrence, the temperature rises. The flame holder causes a recirculation zone in the range of X = 0.0   m and X = 0.125   m of the combustor.
Comparisons of the present and available experimental data [1] of X-velocity profiles in the lateral ( R ) direction, at six different axial positions ( X   = 0.03 m to X   = 0.32 m), are shown in Figure 6. The highest mean deviation (MD) between the simulations and experiment is almost 9.1%, at X = 0.06   m (inside the recirculation zone). This could be due to the realizable k ε turbulence model which was chosen for the simulations. However, along the combustion chamber, the MD is reduced from 9.1% to 2.5%. In the first three longitudinal positions, because of the presence of a recirculation region, the negative X-velocity is close to its peak value ( u = 11   m / s ). In the farther axial positions, by distancing from the recirculation zone, the flow is developed, and the lateral velocity profiles look smoother.
The mean lateral temperature profiles at six longitudinal locations are depicted in Figure 7. The highest MD by comparing the current profiles and the experiment [1] is nearly 10.6% at X   = 0.082   m . According to Figure 6, maximum discrepancy between the numerical results and experimental data of axial velocity is also observed at X = 0.0 m to X = 0.08 m. These locations were placed at the beginning of the combustor, where the recirculated flow occurred. In the recirculation zone, the RANS approach has a small amount of error in calculating the flow turbulence. Due to the effects of the velocity and temperature fields on each other, the flow temperature is also affected by the numerical velocity error. By moving away from the recirculation zone and closer to the end of the combustion chamber, the MD decreases. The highest mean temperature of T   = 1931.35   K can be seen next to X   = 0.233   m and R 0.0   m , where the major reactions take place. At the beginning of the recirculation zone (almost X   = 0.0   m to X   = 0.08   m ), the combustion region is restricted radially by two low-temperature regions (between R   = 0.01   m and R   = 0.03   m ), which cause a jump in the temperature profile at X   = 0.082   m . In addition, at this axial position, the temperature is relatively low on the center-line ( R   = 0.0   m ). In addition, after reaching the peak value at R   = 0.018   m , the temperature decreases faster at a larger distance from the wall in comparison with the other axial positions.
Figure 8 displays the concentration of NO and the formation rates of thermal and prompt NO in the mid-plane of the model combustor. Thermal NO is produced when oxygen and nitrogen in the combustion air mix with one another at high temperatures. Thermal NO is generated approximately in the main area of the combustion zone ( X   = 0.125   m towards   X   = 0.35   m ), where the mean temperature is relatively high. The Prompt NO is formed in the very early stages of combustion, and is therefore designated “prompt”. Prompt NO is mostly produced before the combustion zone, where the air jets of high velocity enter and entropy starts to generate (see Figure 10). The highest value of NO concentration is detected nearly within X   = 0.125   m to X   = 0.375   m . It can also be observed that the formation of prompt NO is negligible.
The lateral profiles of NO concentration and available experiment [1] are compared at three longitudinal locations, as illustrated in Figure 9. Deviation between the experiment and simulations, ranging from 7.4% to 5.7%, is because of the over-prediction of temperature by the current work (see Figure 4 and Figure 5). The highest MD when comparing the predicted lateral profiles of NO concentration and the experimental data is 7.4%, at X   = 0.171   m . This may be owing to the high temperature dependence of NO generation. According to Figure 7, the maximum mean deviation of temperature is observed at this axial position, in comparison with X   = 0.231   m and X   = 0.291   m . By moving towards the walls, the concentration of NO decreases, due to a reduction in temperature, which is also evident from Figure 8. The peak value of NO concentration is at almost X   = 0.291   m , where the temperature is also the highest (Figure 7).
Figure 10 demonstrates the generation rate of entropy due to chemical reactions, diffusion of mass, heat conduction and viscous dissipation processes. According to Figure 10, in the present geometry, the process of chemical reactions is the largest entropy generation source. In the chemical reactions process, the behavior of each species (i.e., NO) has a role in the generation of entropy. Besides the chemical reactions, the influence of the other processes toward the generation of entropy can be arrayed, such as heat conduction, diffusion of mass, and viscous dissipation. From Figure 10, wherever the reactions occur the entropy generation has the highest value (i.e., X   = 0.05   m X   = 0.35   m ). In addition, the participation of heat conduction, viscous dissipation and mass diffusion in the generation of entropy is shown to be small, and they can thus be ignored.
Figure 11 displays the contours of the generation rate of total entropy, NO concentration and mean temperature along the mid-plane of the model combustion chamber. The core area of NO generation is within the range of 0.125   m < X < 0.375   m , in which the maximum generation rate of total entropy and temperature and are also reported. Since thermal NO strongly depends on temperature, by approaching the exit plane of the combustion chamber ( X position between 0.4   m and 0.6   m ), because of a temperature reduction, the NO formation decreases. In addition, owing to the lack of chemical reactions, the generation rate of total entropy is reduced (see Equation (6d)). Meanwhile, the generation of entropy by the process of chemical reactions depends on each species and therefore the NO formation directly affects the entropy generation rate. These results prove that, in a reactive flow, the distribution of temperature and the generation rate of total entropy are practically defined by a chemical reactions process. Thus, entropy generation distribution may be defined as a pointer by which the combustion region and the main region of NO formation are predicted.
Figure 12a depicts the normalized generation rate of total entropy and the formation rate of NO versus mean temperature along the mid-plane. Normalized variables (y-axis) are obtained by dividing the variables by their peak values. Along with the occurrence of the combustion process, the generation rate of total entropy and the formation rate of NO begin to rise until they reach the peak value of the flame temperature at T   = 1930   K . The profile of entropy generation at T   = 1500   K increases with a sharp slope, while the profile of the NO formation rises smoothly. It is observed that the total entropy generation rate is more sensitive to high temperature (1500–1930 K) than that of the NO formation rate. With a 28.7% increase in temperature, entropy generation and NO formation rates rise by 900% and 127%, respectively. Therefore, both profiles show that the generation rate of total entropy and the formation rate of NO are dependent on temperature.
Figure 12b displays the normalized generation rate of total entropy and the formation rate of NO along the center line. The profile of the total entropy generation rate almost covers the main region of NO formation. In addition, at X = 0.1   m , this profile starts to rise with an intense slope, while the profile of the NO formation has a normal trend. Entropy is generated more in a limited length range ( 0.1 X 0.3 ) of the model combustor, where most combustion reactions (fuel- air reactions) take place and produce high temperatures. Meanwhile, the NO reaction is a low-speed one and, due to the high oxygen concentration inside the combustor and the relatively suitable temperature conditions ( T > ~ 1200   K ), NO species can be produced from the beginning to the end of the combustion chamber. According to both profiles, the main region of the generation rate of total entropy and formation rate of NO is at the same axial position ( X = 0.2   m ) in the mid combustion zone.
On the basis of Figure 11 and Figure 12, by computing the generation rate of entropy directly, the core region of NO generation can be predicted within an acceptable deviation. This finding may be used to investigate the means by which the NO formation rate is reduced in a model combustor. Any activities that cause an increase in the mean temperature provide more potential to form thermal NO, which is strongly dependent on temperature. Thus, in order to reduce NO formation, the combustion temperature should be as low as possible, which means less entropy generation. For example, the chemical reaction and the mixing processes are mutual sources of entropy generation and NO formation. In the mixing process, by reaching a suitable mixture fraction there will be less oxygen available for nitrogen to react with. In the chemical reaction process, a suitable mixture fraction results in complete combustion. Thus, the mass fraction of species such as the hydroxyl radical (OH) which can react with nitrogen to form NO, will be minimal.

5. Conclusions

The present paper focuses on the prediction of the relationship between NO formation and the generation rate of entropy in a non-premixed propane combustion. In order to simulate the turbulent reactive flow, the laminar flamelet combustion and the discrete ordinates models are employed. Numerical simulations are compared with the available experimental data [1] to verify their validity. The mechanisms of NO formation (i.e., thermal and prompt) and the processes of entropy generation (i.e., chemical reactions, heat conduction, viscous dissipation, and diffusion of mass) are specifically evaluated and discussed.
I.
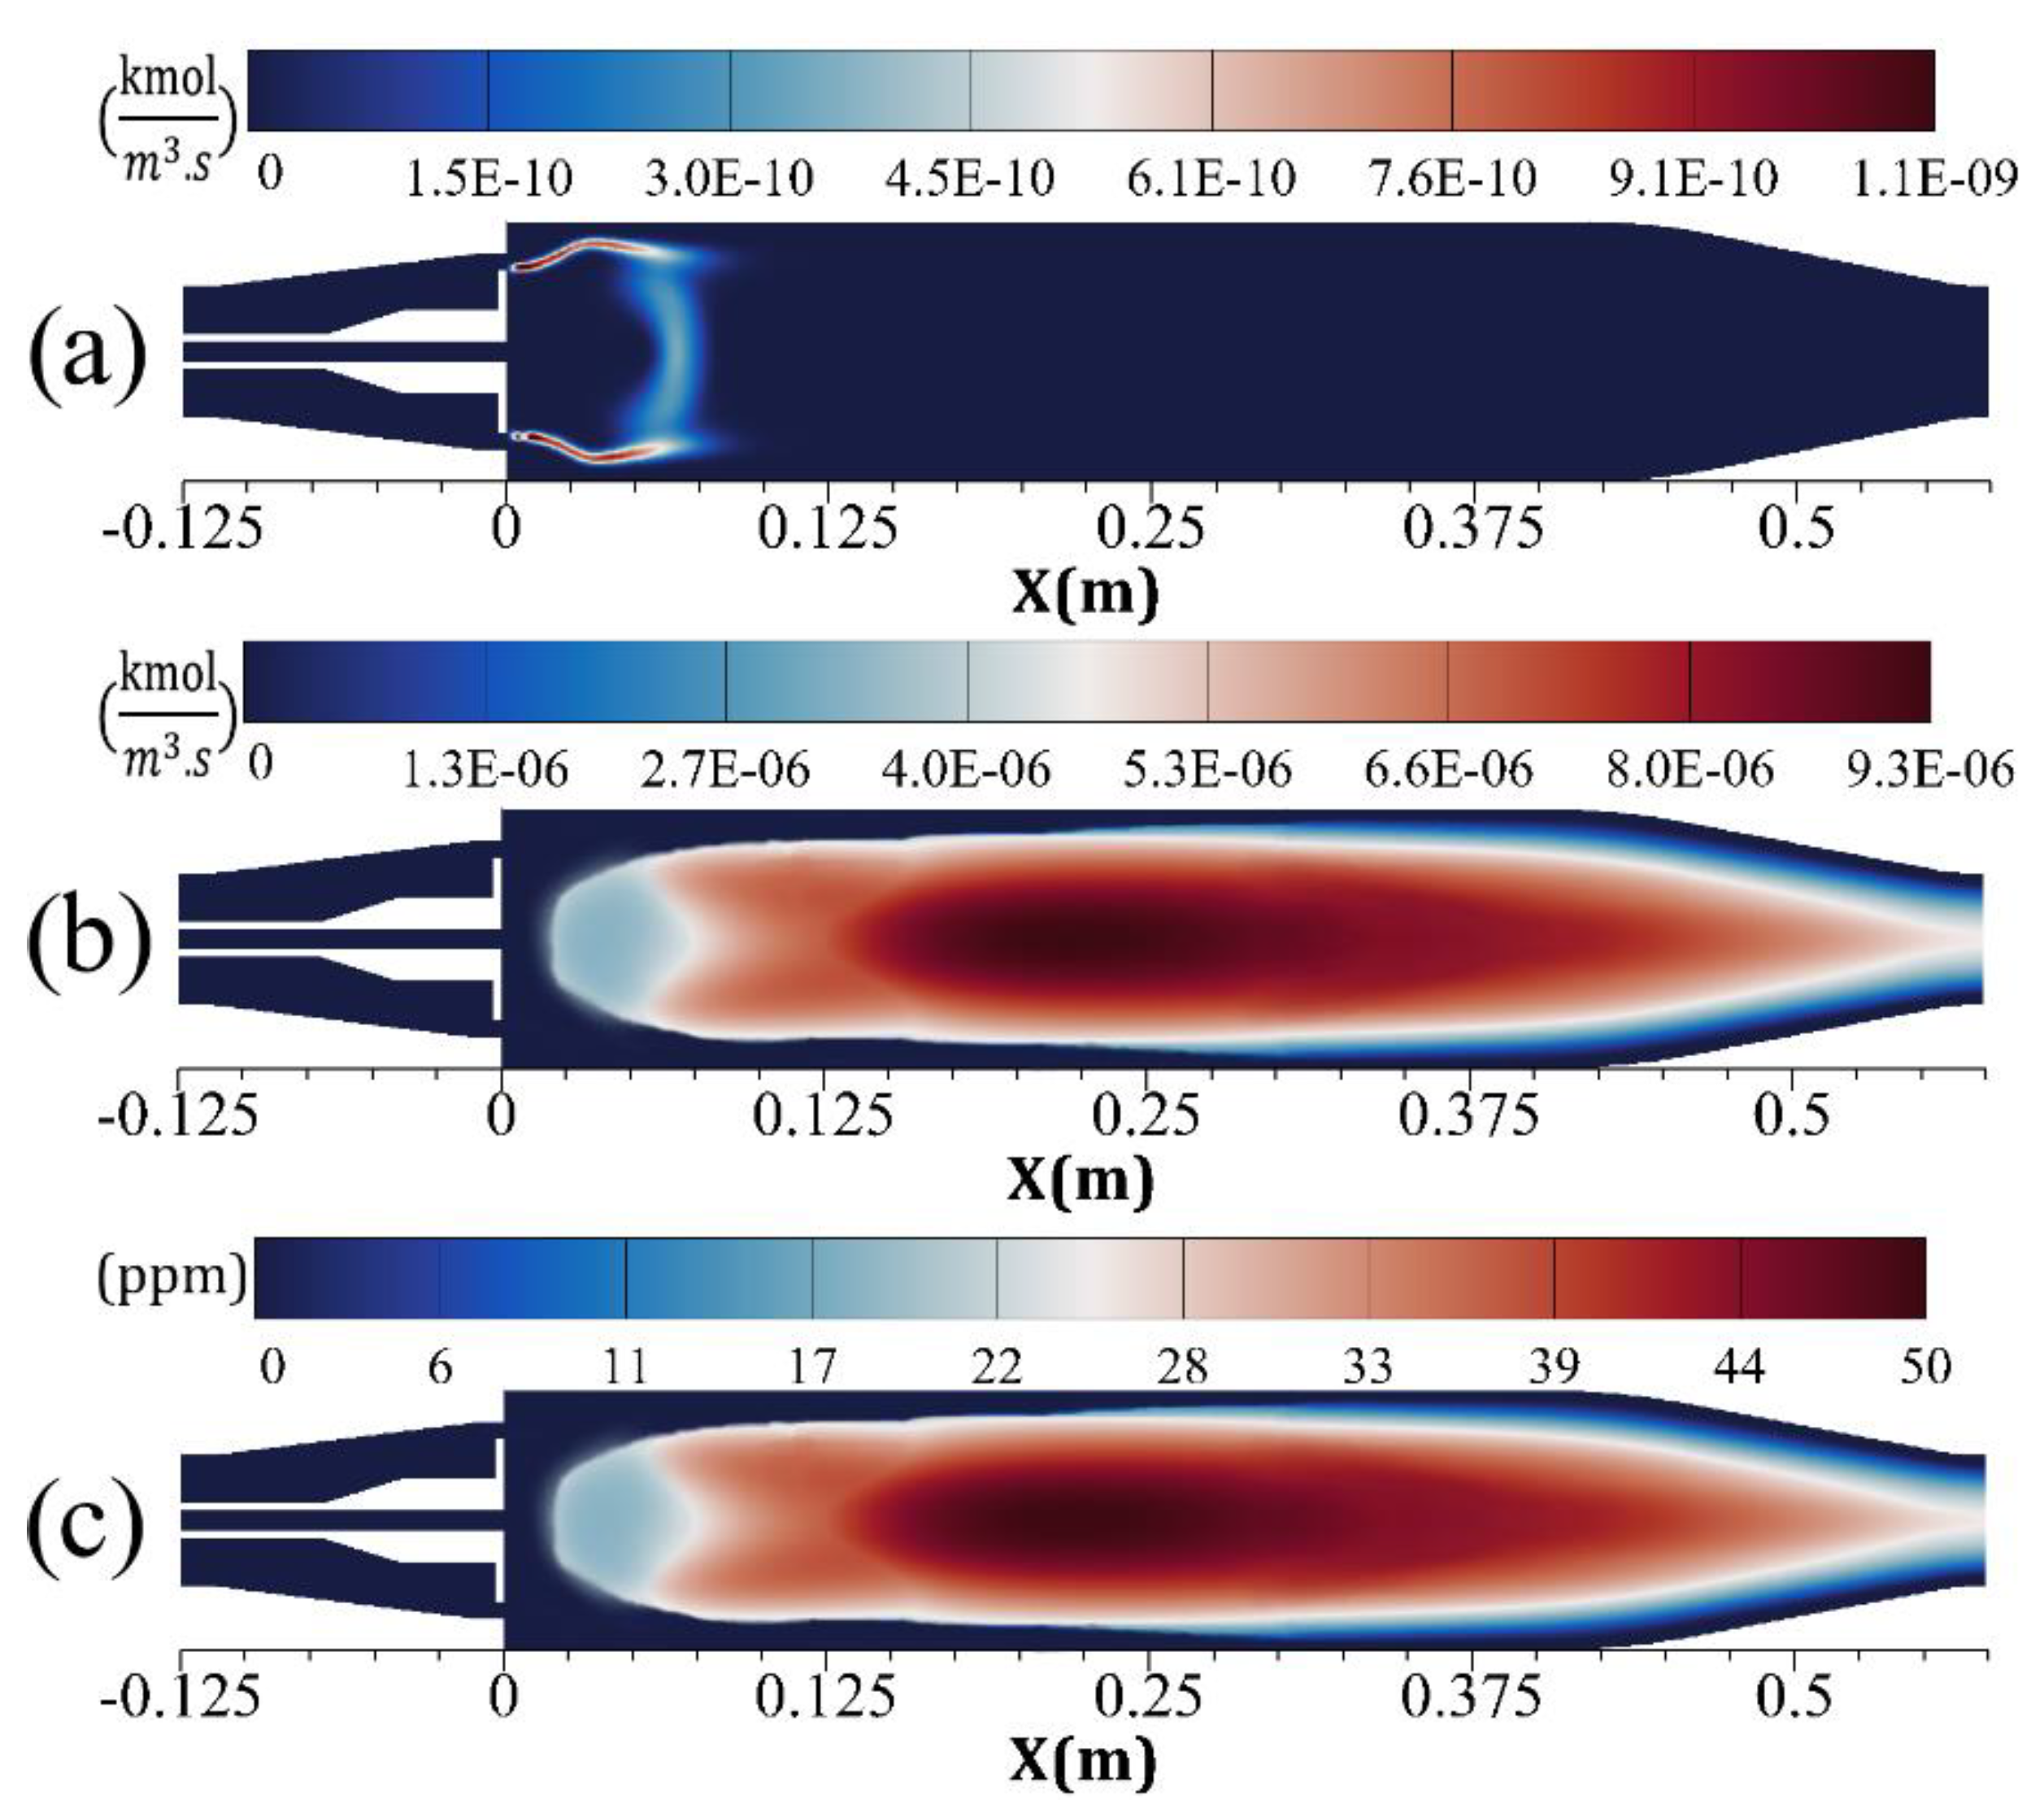
The prompt NO is mostly produced before the combustion zone, where the air jets of high velocity enter and entropy starts to generate.
II.
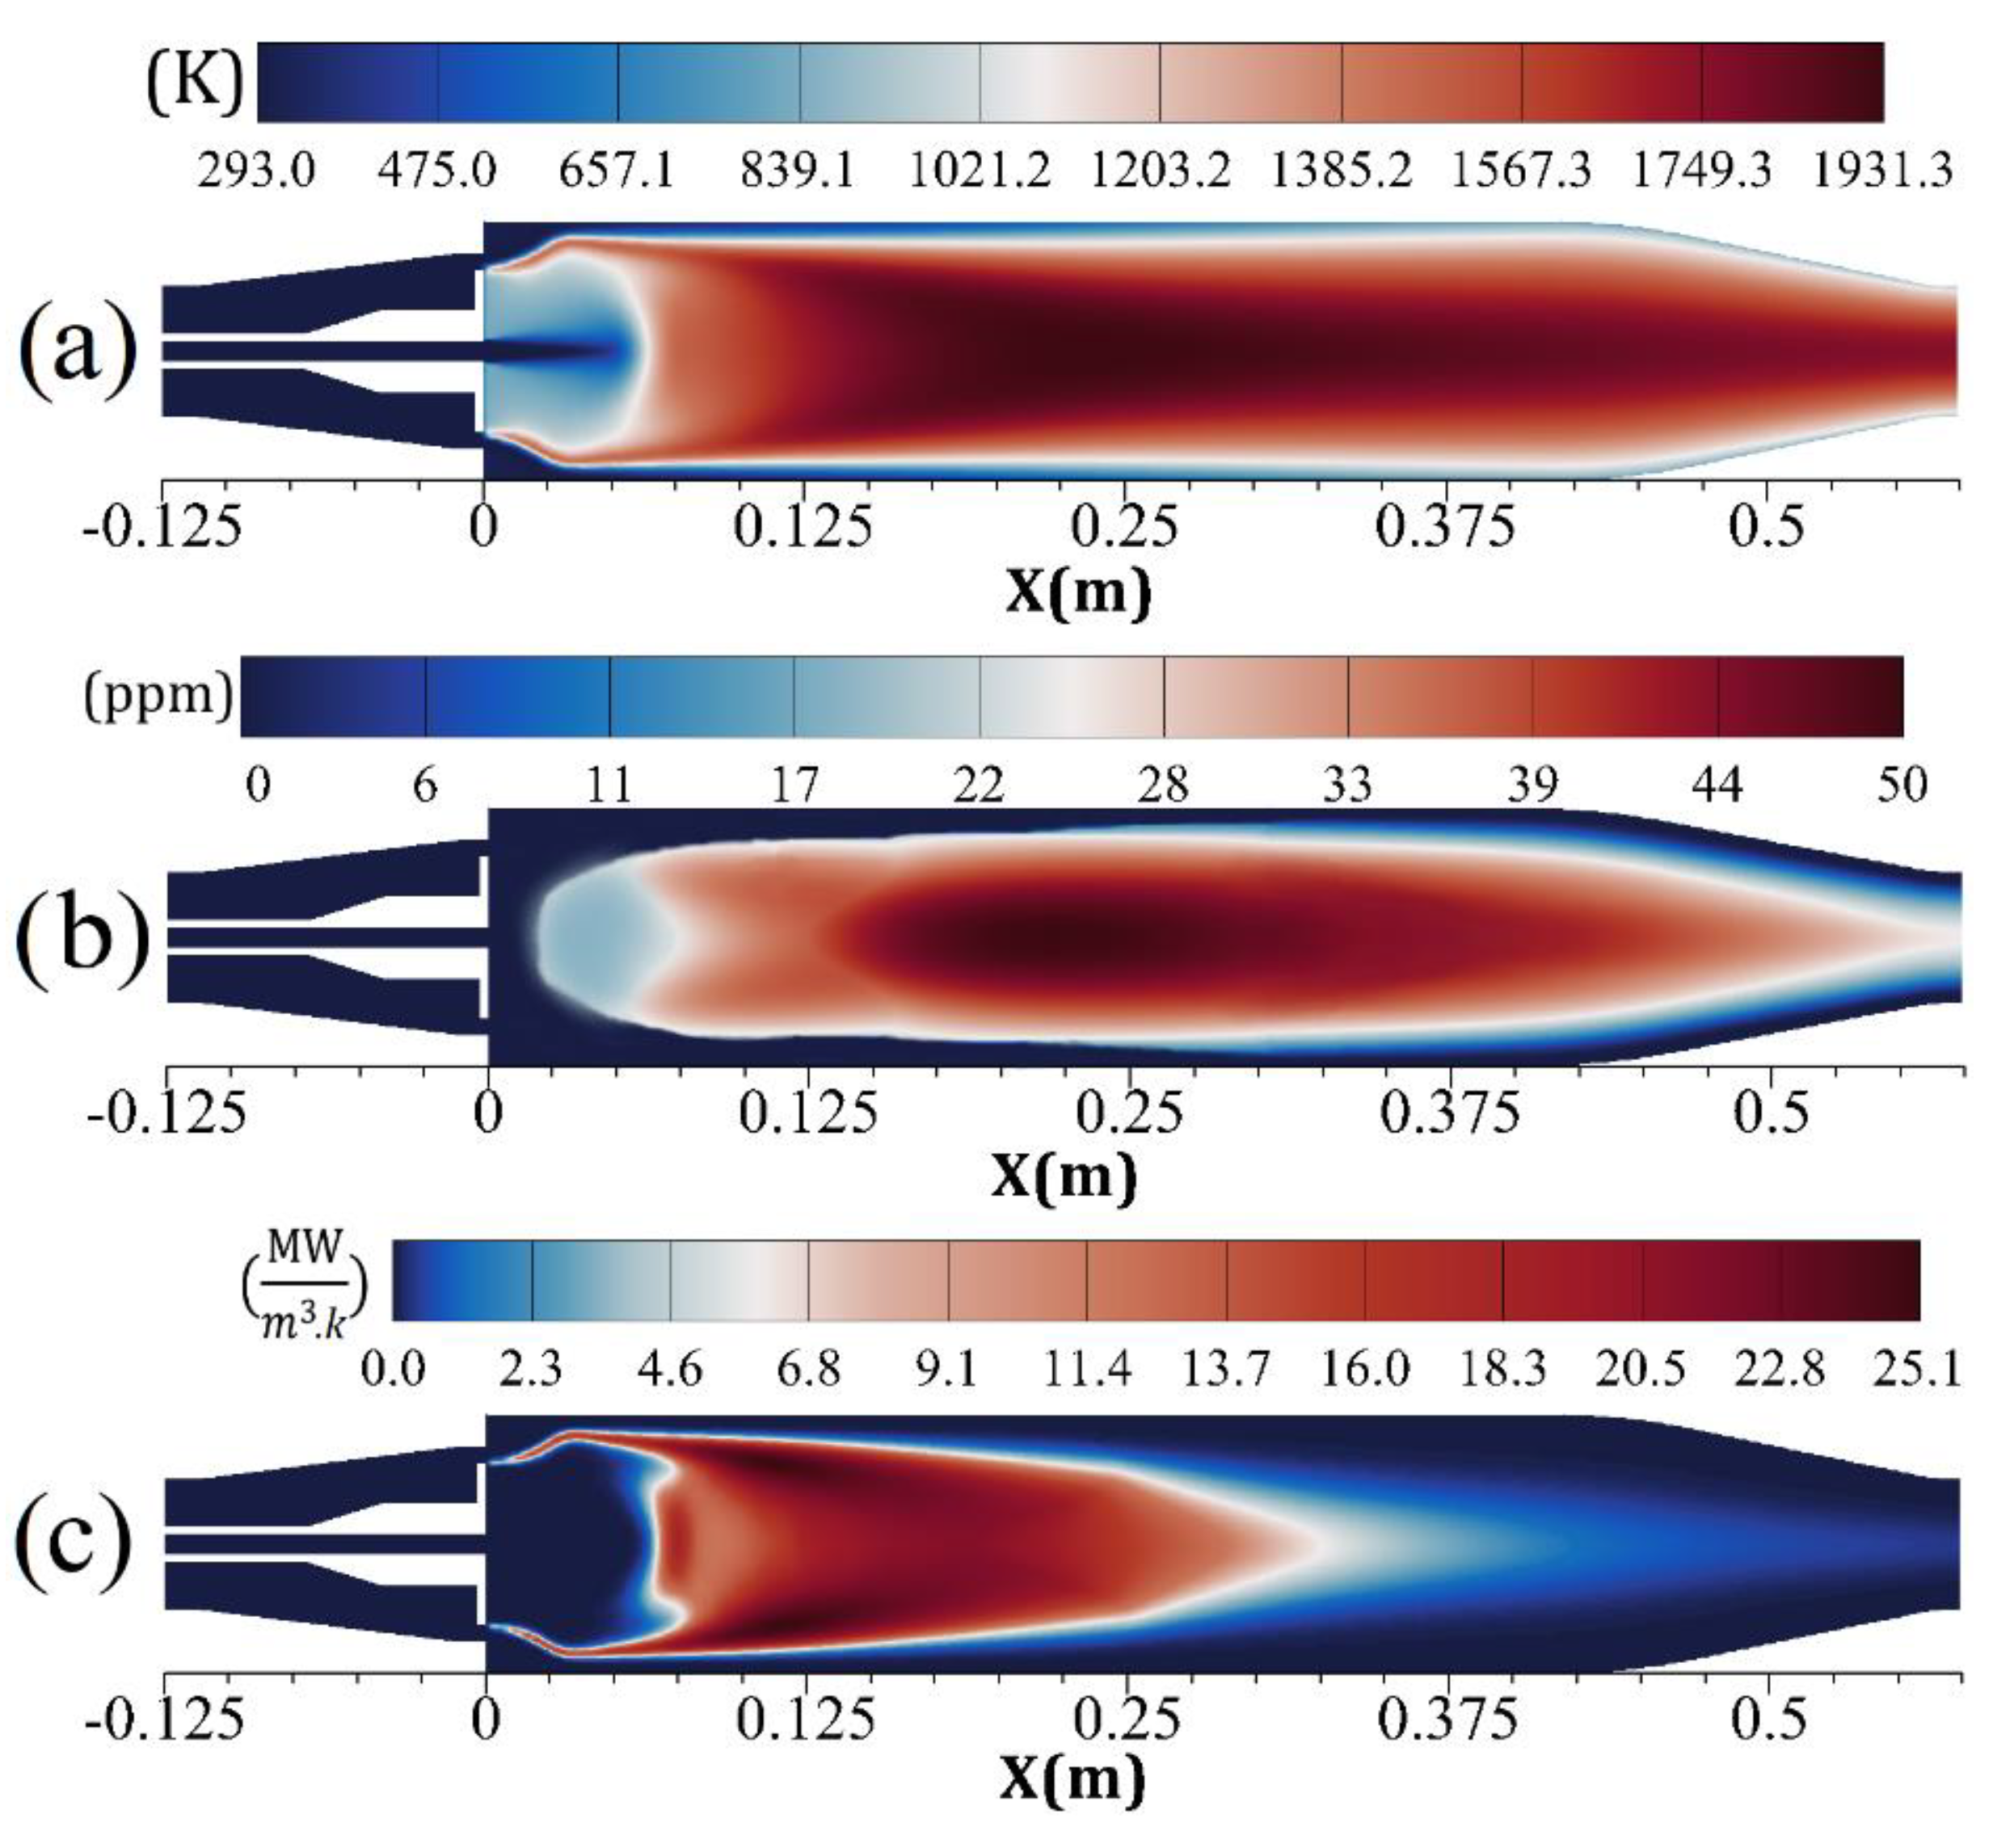
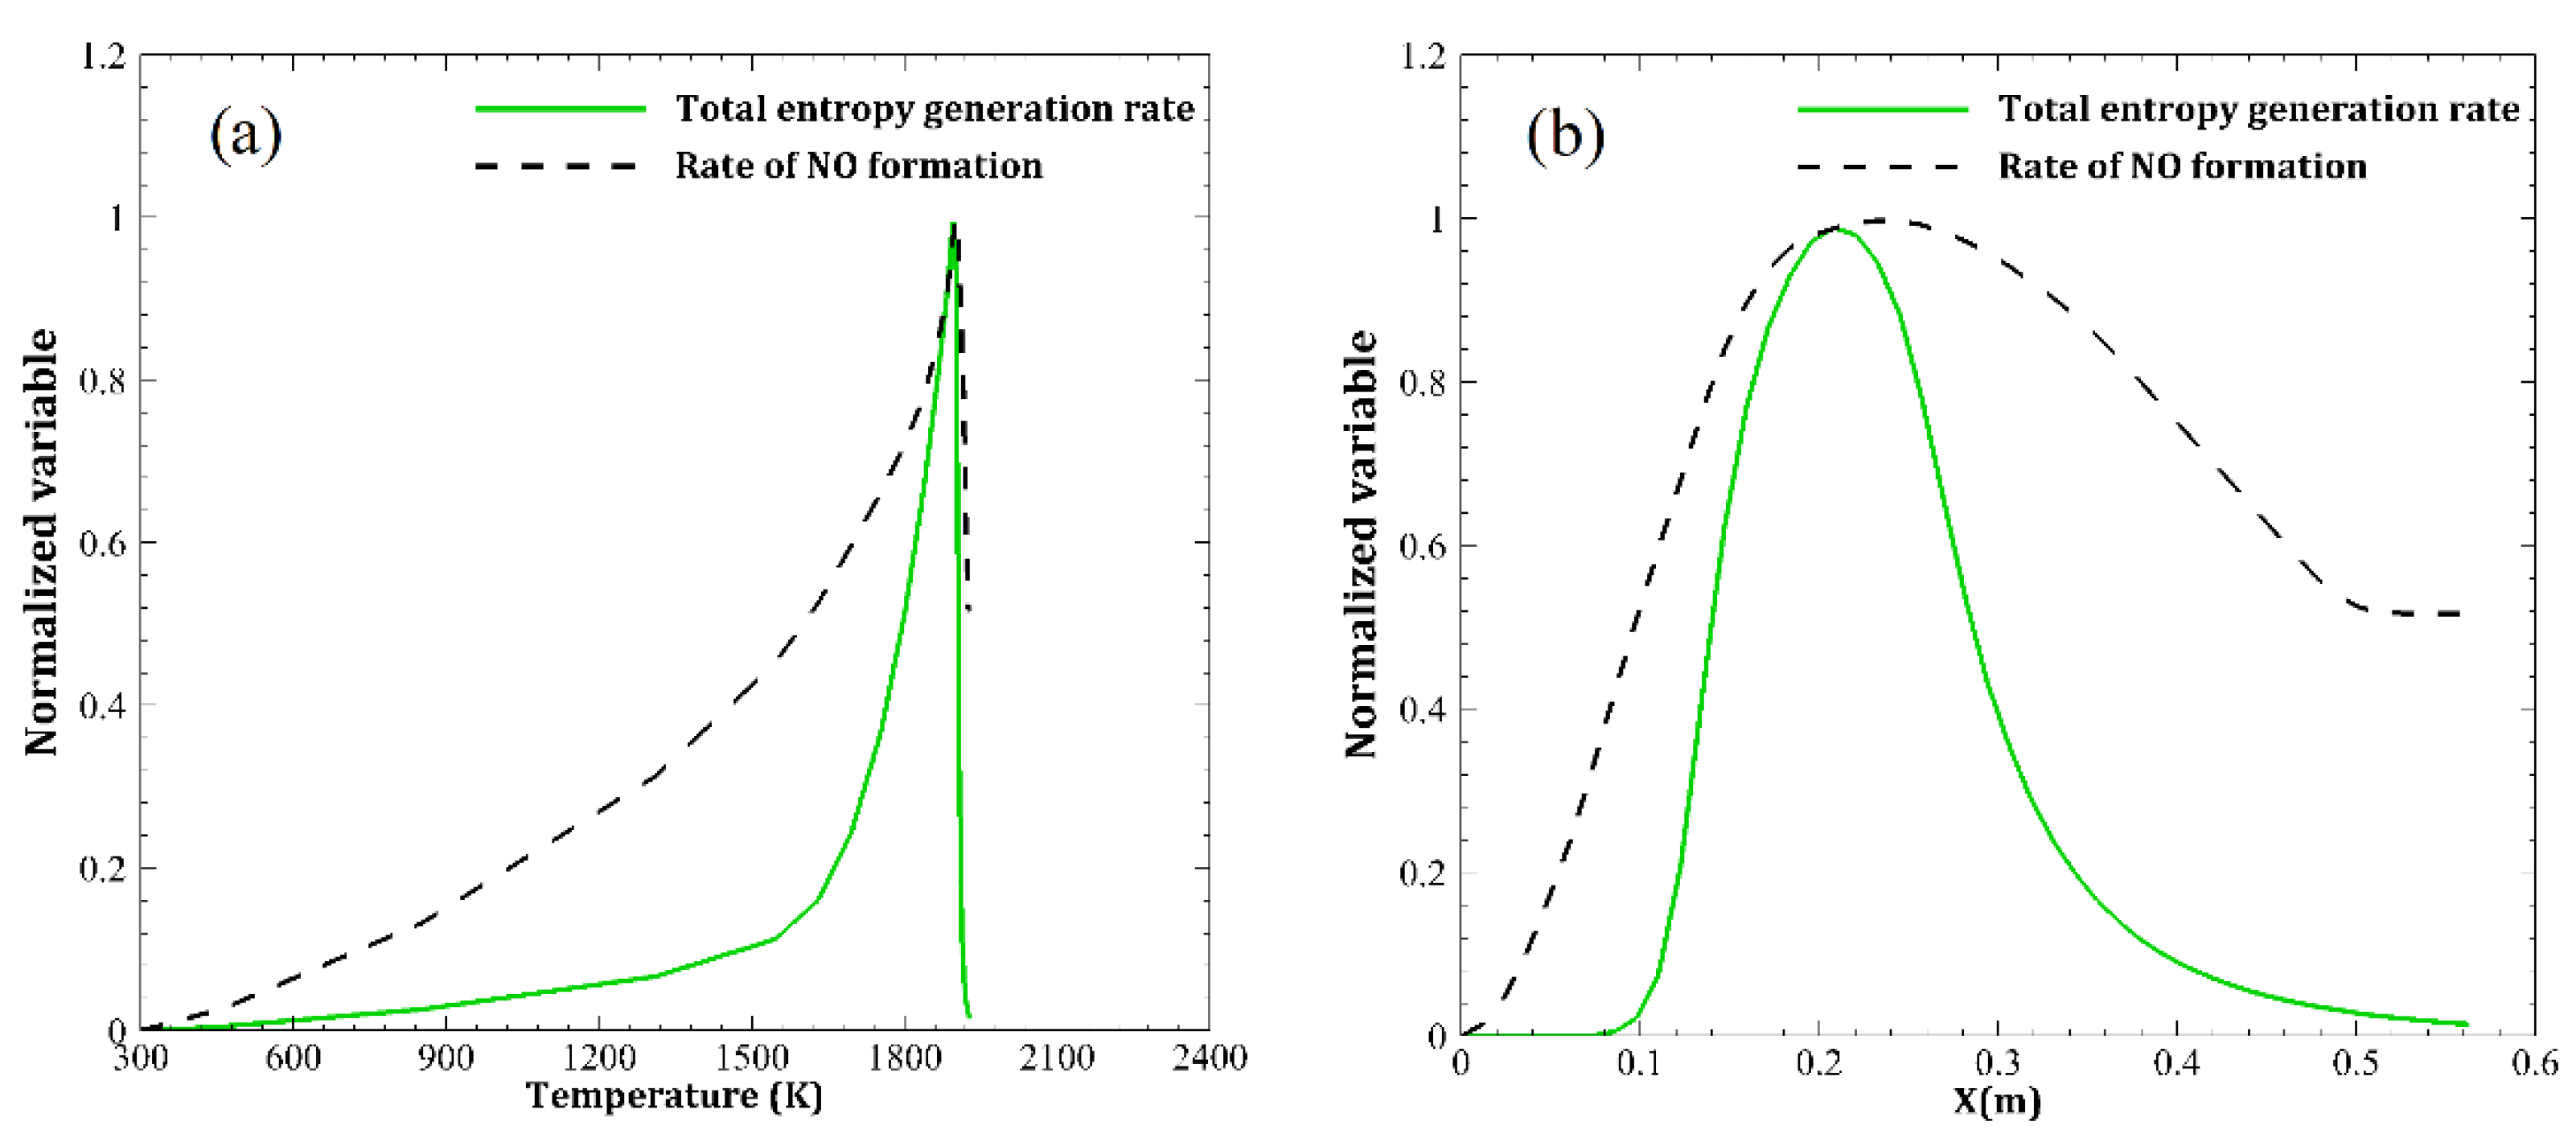
The main region of NO formation is within the range of 0.125   m < X < 0.375   m , in which the maximum total entropy rate of generation and the maximum temperature are also reported.
III.
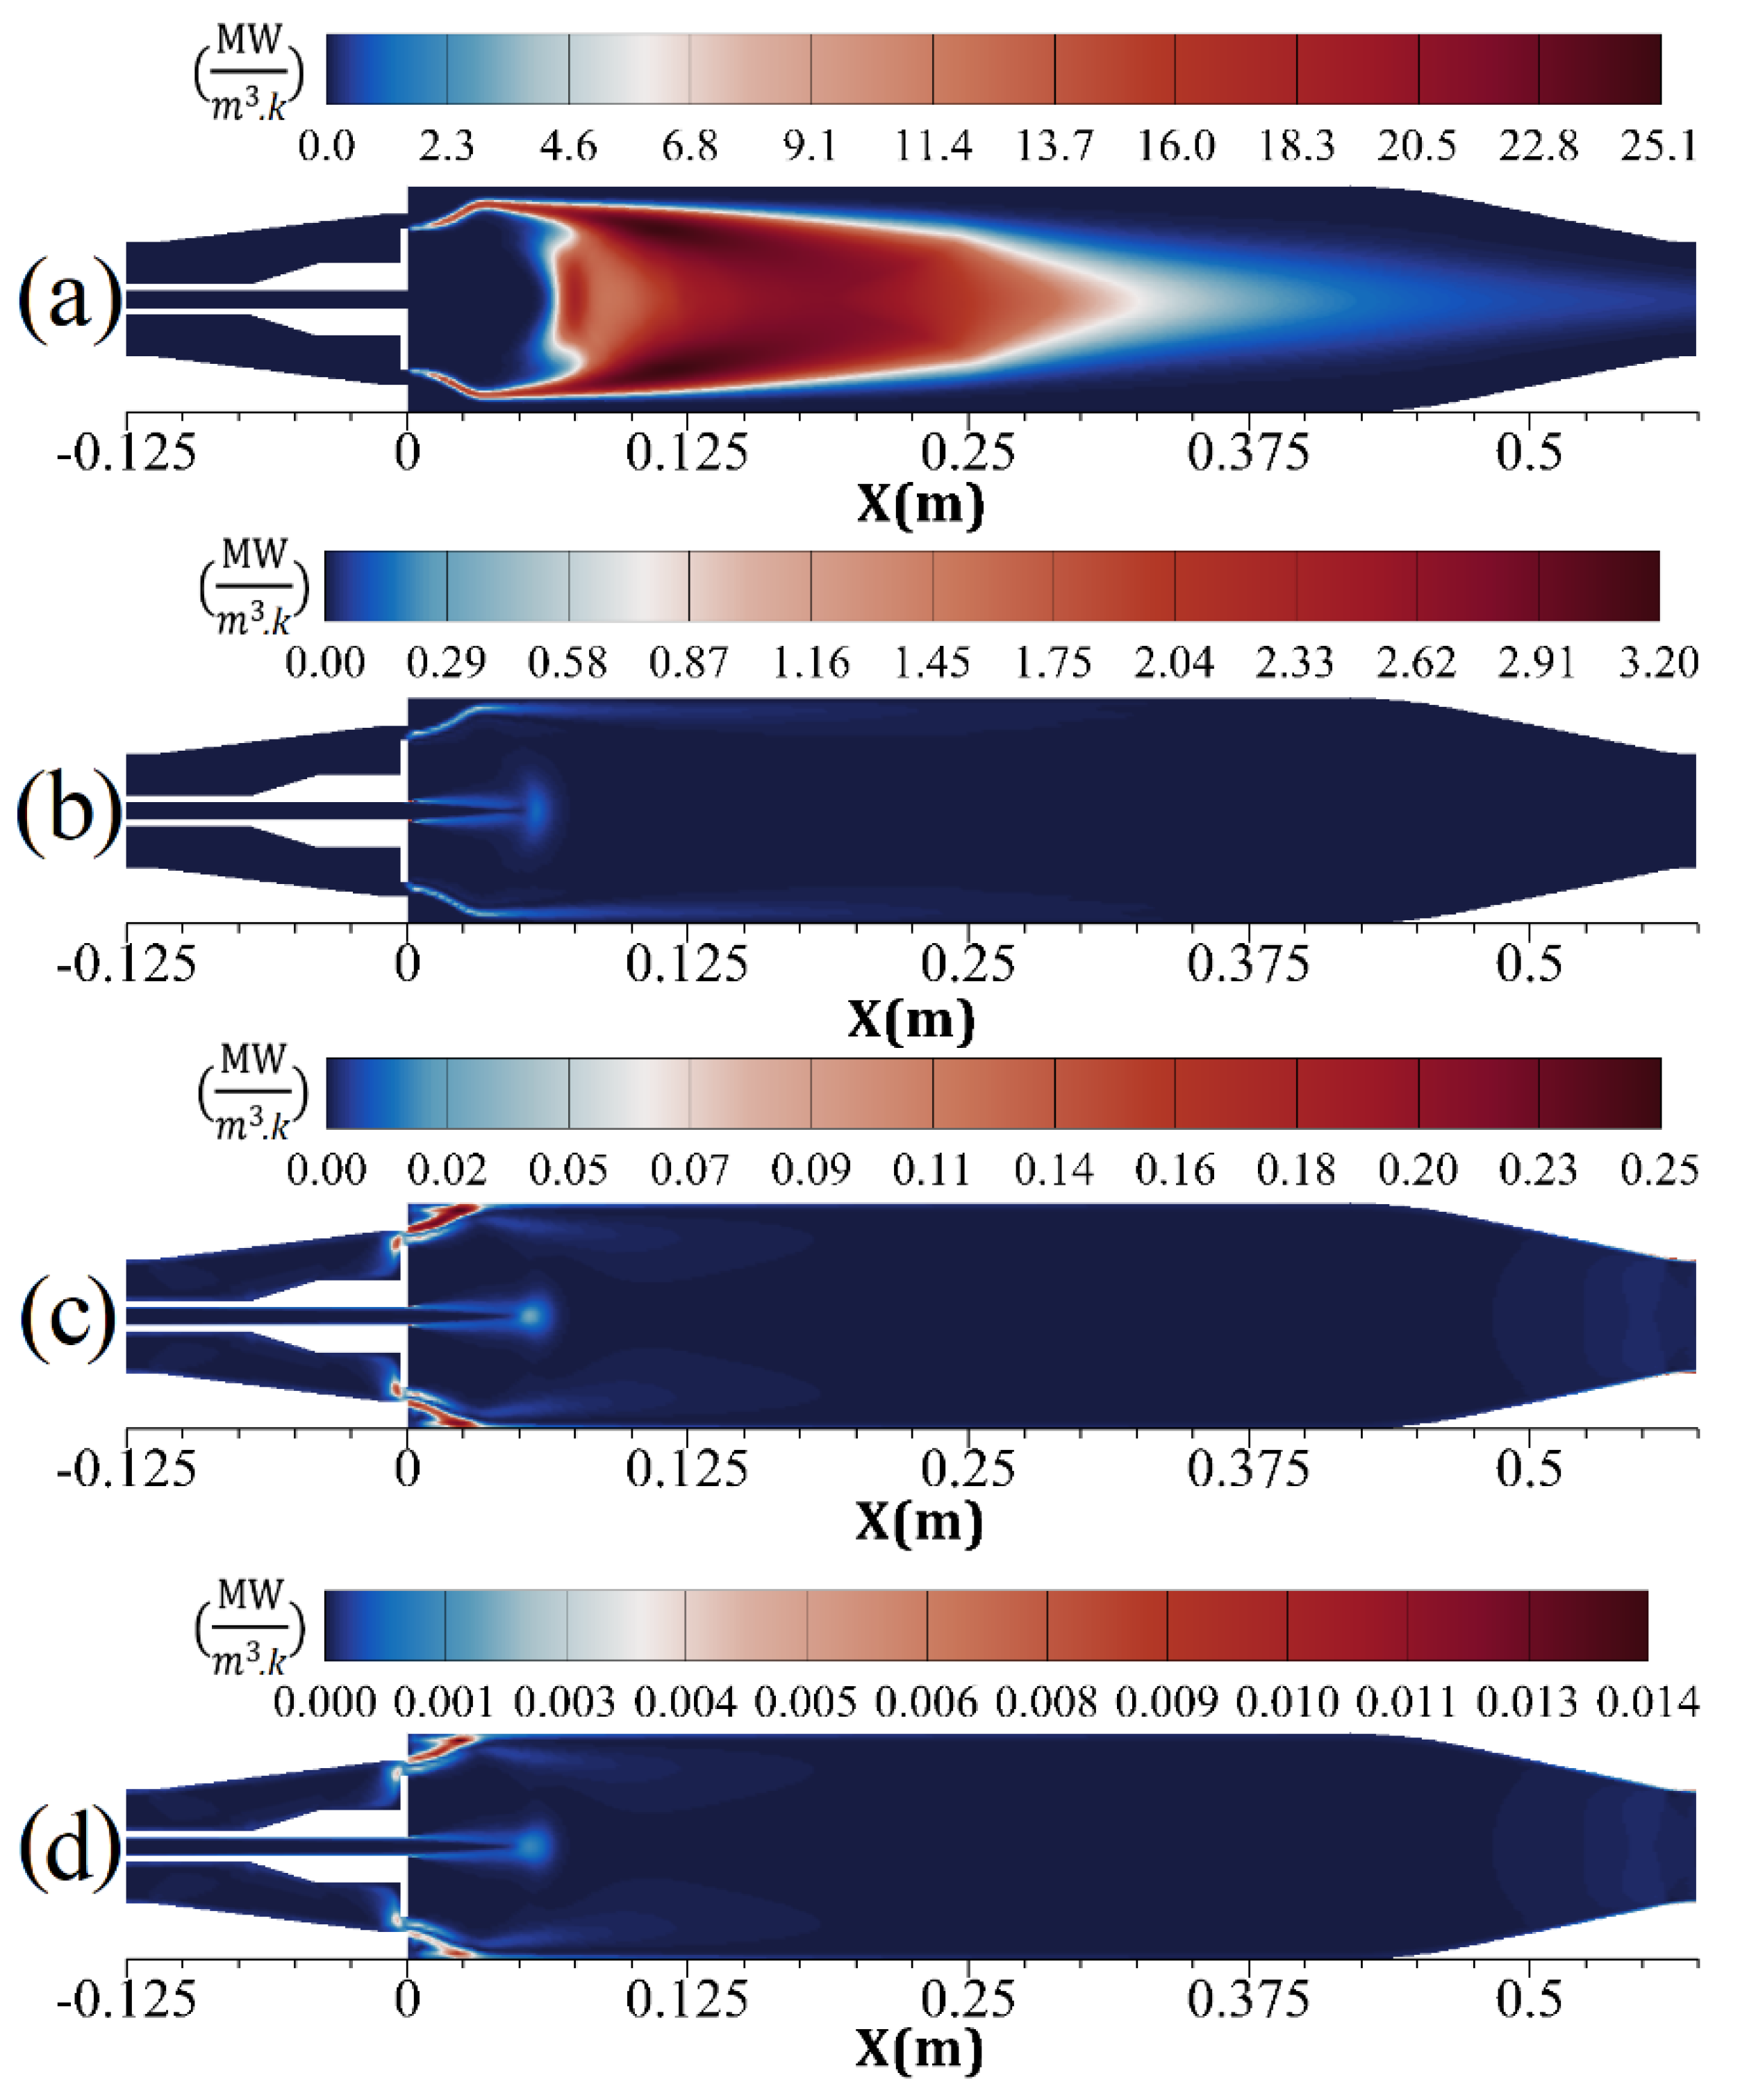
The total entropy generation rate is more sensitive to high temperature (1500–1930 K) than the NO formation rate. With an increase of 28.7% in temperature, entropy generation and NO formation rates augment by 900% and 127%, respectively.
IV.
The chemical reactions process is the major cause of the generation of entropy. Moreover, the contribution of other processes toward entropy generation can be arrayed, such as heat conduction, diffusion of mass, and viscous dissipation.
V.
The generation of entropy owing to chemical reactions depends on each species, and therefore, NO formation directly affects the entropy generation rate.
VI.
The results prove that, in a reactive flow, the distributions of the total entropy generation rate and temperature are defined in practice by the chemical reactions process. The NO formation rate and total entropy generation rate are dependent on temperature. Therefore, by realizing the distribution of each of these three parameters (i.e., entropy generation), the approximate distributions of the other two (i.e., NO concentration and temperature) along with the combustion formation zone, can be predicted.

Author Contributions

Conceptualization, M.S.A.; methodology, M.S.A.; software, M.M.; formal analysis, M.M.; investigation, M.M.; resources, M.M.; writing—original draft preparation, M.M.; writing—review and editing, M.S.A.; visualization, M.S.A.; supervision, M.S.A. All authors have read and agreed to the published version of the manuscript.

Funding

This research received no external funding.

Institutional Review Board Statement

Not applicable.

Informed Consent Statement

Not applicable.

Data Availability Statement

Not applicable.

Acknowledgments

The authors kindly acknowledge Bazdidi-Tehrani for his good advice and comments.

Conflicts of Interest

The authors declare no conflict of interest.

Nomenclature

List of symbols
A p n Surface area of particleGreek symbols
D i m i x Mass diffusion coefficient of species α Absorption coefficient
D p n Particle diameter α p Equivalent absorption coefficient
e i Internal energy γ i Species chemical potential(J/kg K)
E p Equivalent emission Γ Coefficient of diffusion
f i Body force per unit volume of species i ε Kinetic energy dissipation rate
I Radiation intensity ε p n Particle emissivity
j i Mass flux of species i Ω Solid angle
k b , k f Reaction rate constant ρ Density ( kg / m 3 )
k Kinetic energy of turbulence σ Stefan-Boltzmann constant
k e f f Coefficient of thermal conductivity (W/m K) σ p Equivalent particle scattering factor
nRefractive index σ p n Particle scattering factor
PPressure (Pa) τ Viscous stress (N/m2)
P r e f Reference pressure Ψ Dependent variable
q c Conduction heat flux ω i ˙ Production rate from chemical reaction
rPosition vector Equivalence ratio
R Gas constant (J/kg K) η Phase function
R , θ , Z Cylindrical coordinates system Φ Viscous dissipation function
s ´ Scattering direction vectorSubscripts
s Direction vector e f f Effective
s i Specific entropy of species i ·Dot product (Multiplication)
S Ψ Source term Vector differential operator
S Volumetric generation rate of entropy (W/m3 K)kVariable type in Equation (1)
t Time ( s )Abbreviations
T Mean temperature ( K )CO2Carbon dioxide
u j Velocity component ( m / s )DOMDiscrete ordinate model
VVolumeEDMEddy dissipation model
X i Species mole fraction EGRExhaust gas recirculation
x j Coordinates of Cartesian systemFGRFlue gas recirculation
X , Y , Z Coordinates of Cartesian systemFVMFinite volume method
Y + Non-dimensional distanceOHhydroxyl radical
Y i Species mass fractionMDMean deviation
u , v , w Velocity components ( m / s )NONitrogen oxide
T Mean temperature ( K )NOXNitrogen oxides
PDFPresumed density function
WGSSMWeighted sum of gray gases model

References

  1. Jiang, L.-Y.; Campbell, I. A Critical Evaluation of NOx Modeling in a Model Combustor. In ASME Turbo Expo 2004: Power for Land, Sea, and Air; American Society of Mechanical Engineers: New York, NY, USA, 2004; pp. 403–414. [Google Scholar]
  2. Meunier, P.; Costa, M.; Carvalho, M. On NOx emissions from turbulent propane diffusion flames. Combust. Flame 1998, 112, 221–230. [Google Scholar] [CrossRef]
  3. Bazdidi-Tehrani, F.; Abedinejad, M.S.; Yazdani-Ahmadabadi, H. Influence of Variable Air Distribution on Pollutants Emission in a Model Wall Jet Can Combustor. Heat Transf. Res. 2018, 49, 1667–1688. [Google Scholar] [CrossRef]
  4. Watanabe, H.; Suwa, Y.; Matsushita, Y.; Morozumi, Y.; Aoki, H.; Tanno, S.; Miura, T. Spray combustion simulation including soot and NO formation. Energy Convers. Manag. 2007, 48, 2077–2089. [Google Scholar] [CrossRef]
  5. Guo, H.; Smallwood, G.J. The interaction between soot and NO formation in a laminar axisymmetric coflow ethylene/air diffusion flame. Combust. Flame 2007, 149, 225–233. [Google Scholar] [CrossRef]
  6. Saqr, K.M.; Aly, H.S.; Sies, M.M.; Wahid, M.A. Effect of free stream turbulence on NOx and soot formation in turbulent diffusion CH4-air flames. Int. Commun. Heat Mass Transf. 2010, 37, 611–617. [Google Scholar] [CrossRef]
  7. Gascoin, N.; Yang, Q.; Chetehouna, K. Thermal effects of CO2 on the NOx formation behavior in the CH4 diffusion combustion system. Appl. Therm. Eng. 2017, 110, 144–149. [Google Scholar] [CrossRef]
  8. Prakash, V.; Steimes, J.; Roekaerts, D.; Klein, S. Modelling the Effect of External Flue Gas Recirculation on NOx and CO Emissions in a Premixed Gas Turbine Combustor with Chemical Reactor Networks. In ASME Turbo Expo 2018: Turbomachinery Technical Conference and Exposition; American Society of Mechanical Engineers: New York, NY, USA, 2018; p. V04BT04A027. [Google Scholar]
  9. Peng, L.; Zhang, J. Simulation of turbulent combustion and NO formation in a swirl combustor. Chem. Eng. Sci. 2009, 64, 2903–2914. [Google Scholar] [CrossRef]
  10. Xu, Q.; Shen, M.; Shi, K.; Liu, Z.; Akkurt, N.; Xiong, Y.; Liu, L.; Feng, J.; Wang, J. Effect of the Mixing Structure Parameters of a Self-reflux Burner on Combustion Characteristics and NOx Emission. J. Therm. Sci. 2021, 30, 1224–1236. [Google Scholar] [CrossRef]
  11. Xu, Q.; Akkurt, N.; Yang, G.; Zhu, L.; Shi, K.; Wang, K.; Zou, Z.; Liu, Z.; Wang, J.; Du, Z. Effects of optimized operating parameters on combustion characteristics and NOx emissions of a burner based on orthogonal analysis. J. Therm. Sci. 2021, 30, 1212–1223. [Google Scholar] [CrossRef]
  12. Xu, M.; Fan, Y.; Yuan, J.; Sheng, C.; Yao, H. Modelling NOx emissions during staged combustion. Int. J. Energy Res. 1999, 23, 683–693. [Google Scholar] [CrossRef]
  13. Yuan, J.; Naruse, I. Modeling of combustion characteristics and NOx emission in highly preheated and diluted air combustion. Int. J. Energy Res. 1998, 22, 1217–1234. [Google Scholar] [CrossRef]
  14. Briones, A.M.; Mukhopadhyay, A.; Aggarwal, S.K. Analysis of entropy generation in hydrogen-enriched methane–air propagating triple flames. Int. J. Hydrogen Energy 2009, 34, 1074–1083. [Google Scholar] [CrossRef]
  15. Wang, L.; Karimi, N.; Sutardi, T.; Paul, M.C. Numerical modelling of unsteady transport and entropy generation in oxy-combustion of single coal particles with varying flow velocities and oxygen concentrations. Appl. Therm. Eng. 2018, 144, 147–164. [Google Scholar] [CrossRef]
  16. Gholamalizadeh, E.; Alimoradi, A.; Saee, A.D.; Amiri, A.; Moghaddam, M.G. Study of the heat transfer characteristics and entropy generation rate for the reacting flows inside tubes. Appl. Therm. Eng. 2019, 149, 1435–1444. [Google Scholar] [CrossRef]
  17. Wang, W.; Liu, J.; Zuo, Z.; Yang, W. Entropy generation analysis of unsteady premixed methane/air flames in a narrow channel. Appl. Therm. Eng. 2017, 126, 929–938. [Google Scholar] [CrossRef]
  18. Chen, S. Analysis of entropy generation in counter-flow premixed hydrogen–air combustion. Int. J. Hydrogen Energy 2010, 35, 1401–1411. [Google Scholar] [CrossRef]
  19. Jejurkar, S.Y.; Mishra, D.P. Numerical analysis of entropy generation in an annular microcombustor using multistep kinetics. Appl. Therm. Eng. 2013, 52, 394–401. [Google Scholar] [CrossRef]
  20. Yang, W.; Jiang, D.; Chua, K.Y.K.; Zhao, D.; Pan, J. Combustion process and entropy generation in a novel microcombustor with a block insert. Chem. Eng. J. 2015, 274, 231–237. [Google Scholar] [CrossRef]
  21. Hunt, G.; Karimi, N.; Torabi, M. Analytical investigation of heat transfer and classical entropy generation in microreactors—The influences of exothermicity and asymmetry. Appl. Therm. Eng. 2017, 119, 403–424. [Google Scholar] [CrossRef]
  22. Mohammadi, I.; Ajam, H. A theoretical study of entropy generation of the combustion phenomenon in the porous medium burner. Energy 2019, 188, 116004. [Google Scholar] [CrossRef]
  23. Bazdidi-Tehrani, F.; Abedinejad, M.S. Influence of incoming air conditions on fuel spray evaporation in an evaporating chamber. Chem. Eng. Sci. 2018, 189, 233–244. [Google Scholar] [CrossRef]
  24. Alemi, E.; Zargarabadi, M.R. Effects of jet characteristics on NO formation in a jet-stabilized combustor. Int. J. Therm. Sci. 2017, 112, 55–67. [Google Scholar] [CrossRef]
  25. Lu, H.; Liu, F.; Wang, Y.; Fan, X.; Liu, C.; Xu, G. The effect of different reaction mechanisms on combustion simulation of a reverse-flow combustor. J. Therm. Sci. 2020, 29, 793–812. [Google Scholar] [CrossRef]
  26. Bazdidi-Tehrani, F.; Teymoori, A.; Ghiyasi, M. Sensitivity Analysis of Pollutants and Pattern Factor in a Gas Turbine Model Combustor due to Changes in Stabilizing Jets Characteristics. J. Therm. Sci. 2022, 31, 1622–1641. [Google Scholar] [CrossRef]
  27. Ganji, H.B.; Ebrahimi, R. Numerical estimation of blowout, flashback, and flame position in MIT micro gas-turbine chamber. Chem. Eng. Sci. 2013, 104, 857–867. [Google Scholar] [CrossRef]
  28. Bazdidi-Tehrani, F.; Abedinejad, M.S.; Mohammadi, M. Analysis of Relationship between Entropy Generation and Soot Formation in Turbulent Kerosene/Air Jet Diffusion Flames. Energy Fuels 2019, 33, 9184–9195. [Google Scholar] [CrossRef]
  29. Shih, T.-H.; Liou, W.W.; Shabbir, A.; Yang, Z.; Zhu, J. A new k-ϵ eddy viscosity model for high reynolds number turbulent flows. Comput. Fluids 1995, 24, 227–238. [Google Scholar] [CrossRef]
  30. Strokach, E.; Zhukov, V.; Borovik, I.; Sternin, A.; Haidn, O.J. Simulation of a GOx-GCH4 Rocket Combustor and the Effect of the GEKO Turbulence Model Coefficients. Aerospace 2021, 8, 341. [Google Scholar] [CrossRef]
  31. Yu, C.; Shrotriya, P.; Li, X.; Maas, U. Reduced modeling of the NOx formation based on the reaction-diffusion manifolds method for counterflow diffusion flames. Proc. Combust. Inst. 2022, in press. [Google Scholar] [CrossRef]
  32. Torkzadeh, M.; Bolourchifard, F.; Amani, E. An investigation of air-swirl design criteria for gas turbine combustors through a multi-objective CFD optimization. Fuel 2016, 186, 734–749. [Google Scholar] [CrossRef]
  33. Yao, Q.; Zhang, Y.; Wang, X.; Tian, Z.; Hu, G.; Du, W. Investigation of NOx emission under different burner structures with the optimized combustion model. Neurocomputing 2022, 482, 224–235. [Google Scholar] [CrossRef]
  34. Pitsch, H.; Peters, N. A consistent flamelet formulation for non-premixed combustion considering differential diffusion effects. Combust. Flame 1998, 114, 26–40. [Google Scholar] [CrossRef]
  35. Hjertager, L.K.; Hjertager, B.H.; Solberg, T. CFD modelling of fast chemical reactions in turbulent liquid flows. Comput. Chem. Eng. 2002, 26, 507–515. [Google Scholar] [CrossRef]
  36. Ranzi, E.; Frassoldati, A.; Grana, R.; Cuoci, A.; Faravelli, T.; Kelley, A.; Law, C. Hierarchical and comparative kinetic modeling of laminar flame speeds of hydrocarbon and oxygenated fuels. Prog. Energy Combust. Sci. 2012, 38, 468–501. [Google Scholar] [CrossRef]
  37. Peters, N. Turbulent Combustion; Cambridge University Press: Cambridge, UK, 2000. [Google Scholar]
  38. Abedinejad, M.S.; Bazdidi-Tehrani, F.; Mirzaei, S. Investigation of turbulent flow structures in a wall jet can combustor: Application of large eddy simulation. Eur. Phys. J. Plus 2021, 136, 665. [Google Scholar] [CrossRef]
  39. Sarlak, R.; Shams, M.; Ebrahimi, R. Numerical simulation of soot formation in a turbulent diffusion flame: Comparison among three soot formation models. Proc. Inst. Mech. Eng. Part C J. Mech. Eng. Sci. 2012, 226, 1290–1301. [Google Scholar] [CrossRef]
  40. Bidabadi, M.; Dizaji, H.B.; Dizaji, F.F.; Ghahsareh, M.S. Effect of thermal radiation on initiation of flame instability in moisty organic dust combustion. In Proceedings of the 20th Annual International Conference on Mechanical Engineering (ISME), Ropar, India, 19–21 May 2012; Shiraz University: Shiraz, Iran, 2012. [Google Scholar]
  41. Bidabadi, M.; Beidaghy Dizaji, H.; Faraji Dizaji, F.; Mostafavi, S.A. A parametric study of lycopodium dust flame. J. Eng. Math. 2015, 92, 147–165. [Google Scholar] [CrossRef] [Green Version]
  42. Bidabadi, M.; Mostafavi, S.; Beidaghy Dizaji, H.; Faraji Dizaji, F. Lycopodium dust flame characteristics considering char yield. Sci. Iran. 2013, 20, 1781–1791. [Google Scholar]
  43. Fiveland, W. Discrete-ordinates solutions of the radiative transport equation for rectangular enclosures. J. Heat Transf. 1984, 106, 699–706. [Google Scholar] [CrossRef]
  44. Bazdidi-Tehrani, F.; Mirzaei, S.; Abedinejad, M.S. Influence of Chemical Mechanisms on Spray Combustion Characteristics of Turbulent Flow in a Wall Jet Can Combustor. Energy Fuels 2017, 31, 7523–7539. [Google Scholar] [CrossRef]
  45. Smith, T.; Shen, Z.; Friedman, J. Evaluation of coefficients for the weighted sum of gray gases model. J. Heat Transf. 1982, 104, 602–608. [Google Scholar] [CrossRef]
  46. Rahmanpour, M.; Ebrahimi, R.; Shams, M. Numerically gas radiation heat transfer modeling in chemically nonequilibrium reactive flow. Heat Mass Transf. 2011, 47, 1659–1670. [Google Scholar] [CrossRef]
  47. Howell, J.R.; Menguc, M.P.; Siegel, R. Thermal Radiation Heat Transfer; CRC Press: Boca Raton, FL, USA, 2010. [Google Scholar]
  48. Dressler, L.; Nicolai, H.; Agrebi, S.; Ries, F.; Sadiki, A. Computation of Entropy Production in Stratified Flames Based on Chemistry Tabulation and an Eulerian Transported Probability Density Function Approach. Entropy 2022, 24, 615. [Google Scholar] [CrossRef] [PubMed]
  49. Ismail, N.C.; Abdullah, M.Z.; Mazlan, N.M.; Mustafa, K.F. Entropy Generation and Exergy Analysis of Premixed Fuel-Air Combustion in Micro Porous Media Burner. Entropy 2020, 22, 1104. [Google Scholar] [CrossRef]
  50. Sadiki, A.; Agrebi, S.; Ries, F. Entropy Generation Analysis in Turbulent Reacting Flows and Near Wall: A Review. Entropy 2022, 24, 1099. [Google Scholar] [CrossRef]
  51. Korpyś, M.; Gancarczyk, A.; Iwaniszyn, M.; Sindera, K.; Jodłowski, P.J.; Kołodziej, A. Analysis of Entropy Production in Structured Chemical Reactors: Optimization for Catalytic Combustion of Air Pollutants. Entropy 2020, 22, 1017. [Google Scholar] [CrossRef]
  52. Miller, J.A.; Bowman, C.T. Mechanism and modeling of nitrogen chemistry in combustion. Prog. Energy Combust. Sci. 1989, 15, 287–338. [Google Scholar] [CrossRef]
  53. Tarokh, A.; Lavrentev, A.; Mansouri, A. Numerical investigation of effect of porosity and fuel inlet velocity on diffusion filtration combustion. J. Therm. Sci. 2021, 30, 1278–1288. [Google Scholar] [CrossRef]
  54. Hampartsoumian, E.; Nimmo, W.; Pourkashanian, M.; Williams, A.; Missaghi, M. The prediction of NOx emissions from spray combustion. Combust. Sci. Technol. 1993, 93, 153–172. [Google Scholar] [CrossRef]
  55. Westbrook, C.K.; Dryer, F.L. Chemical kinetic modeling of hydrocarbon combustion. Prog. Energy Combust. Sci. 1984, 10, 1–57. [Google Scholar] [CrossRef]
  56. De Soete, G.G. Overall reaction rates of NO and N2 formation from fuel nitrogen. Symp. (Int.) Combust. 1975, 15, 1093–1102. [Google Scholar] [CrossRef]
  57. Patankar, S. Numerical Heat Transfer and Fluid Flow; CRC Press: Boca Raton, FL, USA, 1980. [Google Scholar]
  58. Ashgriz, N.; Mostaghimi, J. An introduction to computational fluid dynamics. In Fluid Flow Handbook; McGraw-Hill: New York, NY, USA, 2002. [Google Scholar]
  59. Davidson, L. Fluid Mechanics, Turbulent Flow and Turbulence Modeling; Chalmers University of Technology: Goteborg, Sweden, 2011. [Google Scholar]
Figure 1. A schematic illustration of model combustor.
Aerospace 09 00666 g001
Figure 2. Independence evaluation of grid: (a) mean temperature, (b) NO concentration on center line (Y = 0, Z = 0).
Aerospace 09 00666 g002
Figure 3. Discretized structured grid on model combustor’s geometry.
Aerospace 09 00666 g003
Figure 4. Present simulation profiles in comparison with experiment [1] along center line (Z = Y = 0): (a) Mean temperature, (b) X-velocity.
Aerospace 09 00666 g004
Figure 5. Contours of mean temperature and velocity (mid-plane, Z = 0).
Aerospace 09 00666 g005
Figure 6. Present lateral profiles of X-velocity as compared with experimental data [1], at different positions.
Aerospace 09 00666 g006
Figure 7. Present lateral profiles of mean temperature as compared with experimental data [1], at different positions.
Aerospace 09 00666 g007aAerospace 09 00666 g007b
Figure 8. Formation rates of (a) prompt NO, and (b) thermal NO, and (c) concentration of NO in model combustor (mid-plane, Z = 0).
Aerospace 09 00666 g008
Figure 9. Present lateral profiles of NO species concentration as compared with experimental data [1], at three different positions.
Aerospace 09 00666 g009
Figure 10. Generation rate of entropy owing to (a) chemical reactions, (b) heat conduction, (c) mass diffusion and (d) viscous dissipation along mid-plane (Z = 0).
Aerospace 09 00666 g010
Figure 11. Distributions of (a) mean temperature, (b) NO concentration and (c) total entropy generation rate along mid-plane (Z = 0).
Aerospace 09 00666 g011
Figure 12. Normalized variable of total entropy generation rate and NO formation rate: (a) mean temperature and (b) along center line (Y = Z = 0).
Aerospace 09 00666 g012
Table 1. Geometrical, flow, and boundary conditions details [1].
ParameterAmount
Diameter of inlet air ( mm )50.8
Diameter of Fuel inlet ( mm )8.4
Flow rate of air ( kg / s )0.55
Flow rate of fuel ( kg / s )0.0162
Inlet Air temperature ( K )293
Inlet fuel temperature ( K )293
Fuel (gas)Propane (C3H8)
Conditions of wallsNo-slip
Exit pressure ( atm )1.0
Outlet diameter ( mm )50.5
Table 2. Four different sizes of grids.
Name of GridSize X   ×   R × θ
(A) 250 , 000 165   ×   33   ×   46
(B) 500 , 000 215   ×   40   ×   58
(C) 1 , 000 , 000 298   ×   46   ×   73
(D) 1 , 500 , 000 338   ×   53   ×   83
Publisher’s Note: MDPI stays neutral with regard to jurisdictional claims in published maps and institutional affiliations.

