Article

Cooperation of Trailing-Edge Flap and Shock Control Bump for Robust Buffet Control and Drag Reduction

1
College of Aerospace Engineering, Nanjing University of Aeronautics and Astronautics, Nanjing 210016, China
2
Department of Mechanical Engineering, The University of Sheffield, Sheffield S1 3JD, UK
*
Author to whom correspondence should be addressed.
Aerospace 2022, 9(11), 657; https://doi.org/10.3390/aerospace9110657
Submission received: 21 September 2022 / Revised: 24 October 2022 / Accepted: 24 October 2022 / Published: 27 October 2022
(This article belongs to the Special Issue Transonic Flow)

Abstract

:
At transonic flight conditions, the buffet caused by the interaction between the shock waves and the boundary layers can degrade an aircraft’s aerodynamic performance and even threaten its safety. In this paper, the shock control bumps, originally designed to reduce the wave drag at cruise speeds, are applied to enhance the robustness of the closed-loop buffet control system using the trailing-edge flap. For the OAT15A supercritical airfoil, a closed-loop buffet control system is first designed with a feedback signal of lift coefficient. Then, the shock control bumps designed for drag reduction are integrated into the active buffet control system. The results show that the closed-loop flap control can be greatly enhanced by coupling with the shock control bumps. At the steady state under control, the shock control bumps can slightly increase the airfoil lift–drag ratio. More importantly, the ranges of control parameters that can effectively suppress the buffet are significantly enlarged with the help of the bumps; thus, the robustness of the control system is greatly enhanced.

1. Introduction

Modern civil transport aircraft, usually adopting supercritical wings for delaying the transonic drag rise, are strongly impacted by the appearance of the normal shock waves on the wing surfaces at both the cruise and buffet conditions [1]. The phenomenon of transonic shock buffet occurs when the shock waves induce boundary layers separation, resulting in a self-sustained periodic shock motion leading to large lift fluctuations [2]. For modern aircraft flying at high subsonic Mach numbers or high angles of attack, periodic shock oscillations with large amplitudes are observed on the wing surfaces [3]. The resulting oscillating loads on aircraft may cause structure fatigue and flight accidents, which severely limit the flight envelopes of aircraft [4]. Therefore, the research on transonic buffet is of practical significance for improving the aerodynamic performances and safety of civil transport aircraft.
The buffet phenomenon can be explained by a self-sustained feedback model originally proposed by Lee [5]. The model shows that the self-sustained shock oscillation is due to a feedback loop between the shock and the acoustic waves. Lee’s model was supported by a large number of experimental and numerical studies [3,6,7,8], which explained periodic shock motion properly. It is well known that transonic buffet involves complex shockwave/boundary-layer interactions that pose significant challenges to numerical simulations. The most promising approaches are the high-fidelity Reynolds stress turbulence models and eddy-resolved turbulence models, such as detached-eddy simulations [7,8]. However, such techniques are currently not practical for studying a large parameter space due to their extremely high computational cost. A number of studies have been dedicated to assessing the efficiency and accuracy of various unsteady Reynolds-averaged Navier–Stokes (URANS) methods in capturing shock buffet [9,10]. In their studies, the numerical schemes [11], turbulence models [11,12,13,14,15], time-step sizes [16], and grids [10,16,17] have all been shown to be crucial in predicting shock oscillation. Recently, Giannelis et al. [18,19] also carried out the relevant transonic buffet simulations using the URANS method based on Menter’s k-ω SST turbulence model [20] and obtained a good prediction in buffet frequency and shock oscillation amplitude.
From the perspective of aircraft design, it is highly desirable to suppress the shock buffet in order to extend the flight envelope. Various buffet control methods have been proposed. The active control methods such as the trailing-edge deflector [21,22], trailing-edge flap [23], and fluidic vortex generator [24] were found to be able to provide the most effective buffet control over a wide range of flow conditions. In particular, the approach aimed to reduce the shock oscillation by changing the trailing-edge shear layer directly, such as the trailing-edge deflector (TED) or trailing-edge flap, was thought to have great potential in practice. Caruana et al. [21,22] developed a closed-loop control system based on a trailing edge deflector to suppress the transonic buffet. Their study showed that the control effectiveness reached its maximum value when the TED oscillation frequency was close to the buffet frequency. Later, Gao et al. [23] investigated the effect of trailing-edge flaps on transonic buffet. They proved that under various buffet conditions, a closed-loop law for actuation was an effective technique for buffet suppression. Recently, the effect of an upper trailing-edge flap (UTEF) on buffet alleviation was investigated by Tian et al. [25]. They found that the buffet was successfully delayed to a higher angle of attack due to the suppression of flow separation downstream of the shock wave.
The passive methods for buffet control, such as the streamwise slots [26,27], the shock control bumps (SCBs) [28,29], and the vortex generators [30,31], were also pursued due to their simplicity in comparison with the active methods. Among them, the SCBs are particularly attractive for their ability to reduce wave drag at cruise speeds. The SCBs are originally designed to reduce the strength of the normal shock waves on the wing surfaces. In early studies [32], the application of two-dimensional SCBs was found to reduce the transonic wave drag without a significant viscous drag penalty. This was accomplished by a split of the normal shock into a λ-shock structure; thus, the total pressure losses could be reduced. The potential of 2D shock control bumps has been investigated by a number of computational and experimental investigations [33,34,35]. According to these studies, a local contour bump is the most effective shock control method for drag reduction. The drawbacks of 2D bumps were confirmed in their studies with poor off-design performance. Since then, 3D shock control bumps have been introduced and examined by Qin et al. [36]. The 3D bumps were proved to have the same level of drag reduction as that of 2D bumps and have more robustness in some cases.
Later, Birkemeyer et al. [33] concluded that the shock control bumps positioned significantly downstream of the shock wave could reduce the pressure fluctuations close to the trailing edge, thus delaying the shockwave–boundary layer interaction. Mayer et al. [29] compared and assessed two different types of contour bumps for delaying buffet onset. The results showed that in addition to delaying the buffet onset by increasing the maximum lift coefficient, 2D bumps were also capable of damping the buffet-related lift oscillations inside the buffet regime by an efficient shock strength reduction in combination with the positive effects on flow separations. Tian et al. [37] found that the downstream SCB could reduce the adverse pressure gradient and the separation bubble downstream, resulting in better buffet performance for a wide range of flight conditions. Geoghegan et al. [38] performed a parametric study on the contour bump for buffet control and found that the SCB location suitable for drag reduction often conflicted with that for buffet suppression. As pointed out by Mayer et al. [39], a robust design is required to improve the overall performance of an airfoil over a wide range of angles of attack.
As mentioned above, although active control methods have the potential of completely suppressing the shock buffet, the issues related to their robustness still need to be further addressed in order to make them more useful for practical applications. On the other hand, passive shock control bumps provide a cheaper way to suppress the buffet, whereas bump designs have to balance their drag-reduction capability. This motivated the present study to explore the possibility of enhancing the robustness of an active buffet control system using the trailing-edge flap by coupling the passive shock control bumps for drag reduction. It is believed that this integrated control system can achieve a more robust buffet control without degrading the SCB performance for drag reduction.
The paper is organized as follows. First, the numerical method for the airfoil buffet simulations is described and validated with the experimental data on a supercritical airfoil under an experimentally observed buffet flow condition. Then, the closed-loop buffet control based on the feedback of the lift coefficient is investigated, with a discussion on the effect of the control parameters on the buffet control. After that, two SCBs are designed for drag reduction at given design points. Finally, these two bumps are integrated into the active buffet control system, and the performances of the integrated control systems are discussed.

2. Problem Definition

2.1. Baseline Airfoil

The OAT15A supercritical airfoil was chosen as the baseline in this study because it has been widely tested in wind tunnel experiments [40] and numerical studies [8,18,41,42,43]. In order to develop an extensive experimental database for the validation of the numerical buffet simulations, Jacquin et al. [40] performed the buffet experiment on the OAT15A airfoil section in the ONERA S3Ch transonic wind tunnel. The wind tunnel model is an OAT15A profile with a chord length of 230 mm, a span of 780 mm, a relative thickness of 12.3%c, and a blunt trailing edge of 0.5%c. With the stagnation conditions of p 0 = 10 5   Pa , T 0 = 300   K , and a chord-based Reynolds number of 3 × 10⁶, the flow Mach number varied in the range of 0.70 to 0.75, and the angle of attack between 2.5 ° and 3.91 ° . The boundary layer transition is fixed at 7%c on the upper and lower surfaces of the airfoil. At the condition of M = 0.73 and α = 3.5 ° , the captured unsteady pressure signals showed that the flow became fully periodic, and the power spectra analysis indicated a buffet frequency of 69 Hz.

2.2. Definition of Trailing-Edge Flap

The trailing-edge flap is deformed by changing the parametrically defined camber line y t with a fixed thickness distribution. The camber line associated with the trailing-edge flap is parameterized by a third-order polynomial. As shown in Figure 1, the starting location of the deformation of the flap is defined by x H , with the flap length given by l T = c x H . The current position of the surface nodes on the flap is indicated by x t , as follows:
0 x t = ( x x H ) / l T 1
The flap profile parameterization can be defined as follows:
y t = h T sin ( 2 π f ( t t H ) ) x t 3
where t and t H define the current time and the start time of the deflection, respectively, and h T represents the maximum displacement of the trailing edge. The deflection angle is defined by β, which can be computed as follows:
β = arctan ( h T / l T )

2.3. Definition of Shock Control Bump

Based on previous work on shock control bumps for transonic drag reduction [38,44,45], the chosen SCB geometry is displayed in Figure 2, with its size and position relative to the OAT15A airfoil. The bump length is given as a percentage of the chord length, l b / c , the position of the bump crest relative to the bump length, c b / l b , and the bump local position, x s , defined as the distance between the bump crest and the mean shock location, x s h . The local position is defined by the following equation:
x s = ( x 0 + c b x s h ) / c
where x 0 is the coordinate of the starting point of the bump. The bump crest location can be defined as
x c = ( x 0 + c b ) / c
and the local position coordinate, x b , is expressed as
0 x b = ( x x 0 ) / l b 1
The SCB geometry is defined by the Hicks-Henne function shown as follows
H ( x b ) = sin 4 ( π x b m ) , m = ln ( 0.5 ) / ln ( c b / l b )
Since H ( x b ) is normalized by definition, the resulting SCB geometry is given as
F b ( x b ) = h b H ( x b )
where h b is the bump height.

3. Numerical Methods

3.1. Numerical Algorithm

The simulations based on solving the unsteady Reynolds-averaged Navier–Stokes equations are performed to calculate the two-dimensional compressible viscous flows. The open-source code CFL3D [46] is used for the flow solution. An upwind Roe flux difference splitting method with a third-order upwind MUSCL scheme is used to resolve the inviscid fluxes. The diffusive fluxes are treated using the second-order central differencing method. According to recent research on the numerical method of shock buffet [18], the Spalart–Allmaras one equation turbulence model failed to produce shock unsteadiness on the OAT15A airfoil under the condition of M = 0.73 , α = 3.5 ° and R e c = 3 × 10 6 , whereas the Stress-Omega Reynolds stress model (SORSM) overpredicted the pressure fluctuations. Menter’s k-ω SST model with a reduced a 1 coefficient was found to capture the shock unsteadiness properly. Based on our own experiences, Menter’s k-ω SST turbulence model with a a 1 coefficient of 0.286 was used for the closure of the Reynolds-averaged Navier–Stokes equations. An implicit dual-time marching scheme was applied for this study, and the time step size was chosen to be 2 μs (approximately 750 time steps per buffet cycle). Additionally, the dynamic grid method was adopted to simulate the movement of the trailing-edge flap under the closed-loop control.

3.2. Grid Convergence Study

A C-type grid has been generated to carry out the simulations. The grid extends 80 chord lengths in both the upstream and vertical directions and 100 chord lengths in the downstream direction, as illustrated in Figure 3. Three meshes of different grid densities named L1, L2, and L3 were created to assess grid independence, with the detailed parameters provided in Table 1. In order to capture the shock wave accurately, the grid near the trailing edge was refined, with a cell size of no more than 0.5%c in the streamwise direction. A maximum wall y + < 1 was achieved at the boundary layer in the wall-normal direction of all grids, as required for the near-wall resolution for the turbulence model. The grid convergence was assessed under the condition of M = 0.73 , α = 3.5 ° , and R e c = 3 × 10 6 using Menter’s k-ω SST turbulence model and based on the computed buffet characteristics. Table 2 shows the results of the buffet characteristics, including the mean lift coefficient, peak-to-peak lift differential, and buffet frequency. The flow properties computed by the medium grid are very close to that of the finest grid, indicating a reasonable grid convergence with the L2 grid. As a result, this grid was used for all subsequent simulations.

3.3. Numerical Validation

For comparison with the experimental data, the mean and RMS pressure coefficients (defined as ( p p a v e ) r m s / q 0 ) on the upper surface calculated under the condition of M = 0.73 , α = 3.5 ° , and R e c = 3 × 10 6 are presented in Figure 4. It can be seen that the calculated mean pressure coefficient has a good agreement with the experimental data. Although the peak pressure fluctuation amplitude and trailing-edge pressure fluctuation are slightly underpredicted, the shock travel and mean location of the shock movement are well captured by the current simulation. The numerical results by other authors are also presented in the figure. It can be seen that there is a noticeable discrepancy between the results of different turbulence models. The Reynolds stress model and eddy-resolved turbulence models, including several variants of the DES method and a wall-modeled LES method, tend to overpredict the pressure fluctuation, although they demand much higher computational costs than that of the URANS method. The remainder of this study proceeds with Menter’s k-ω SST turbulence model.

4. Results and Discussion

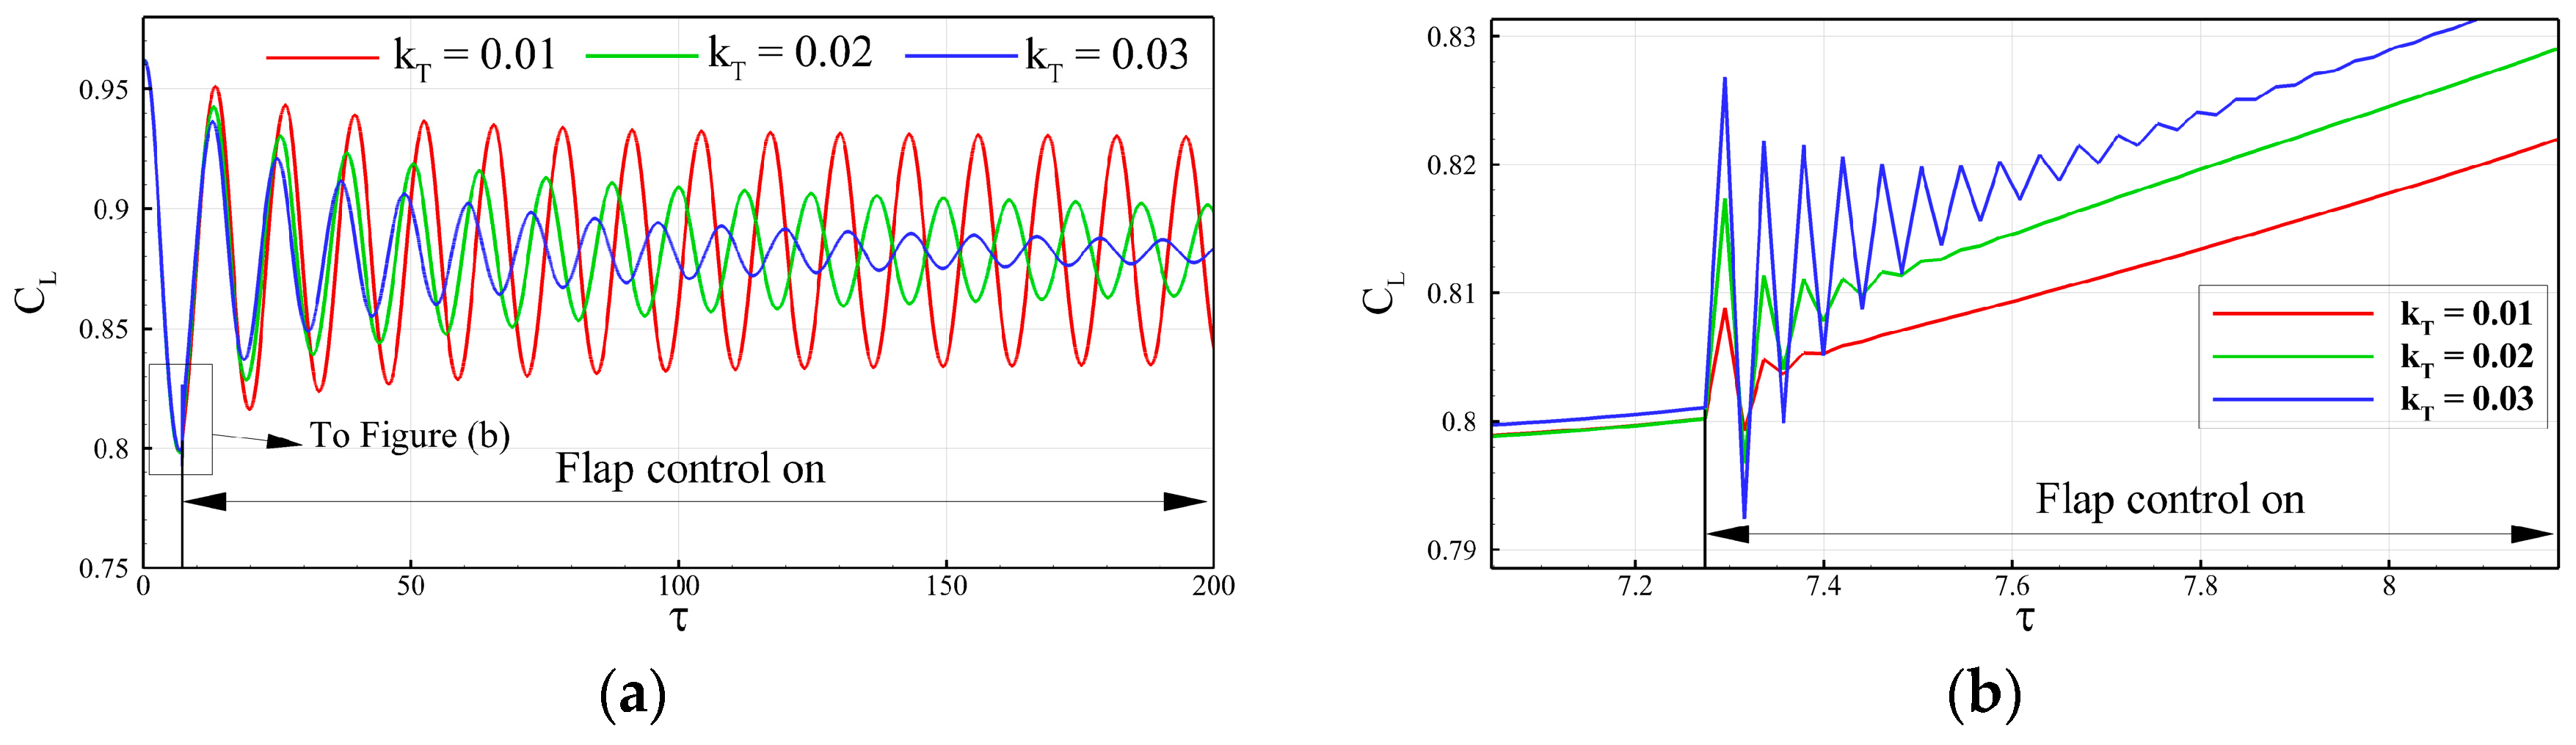
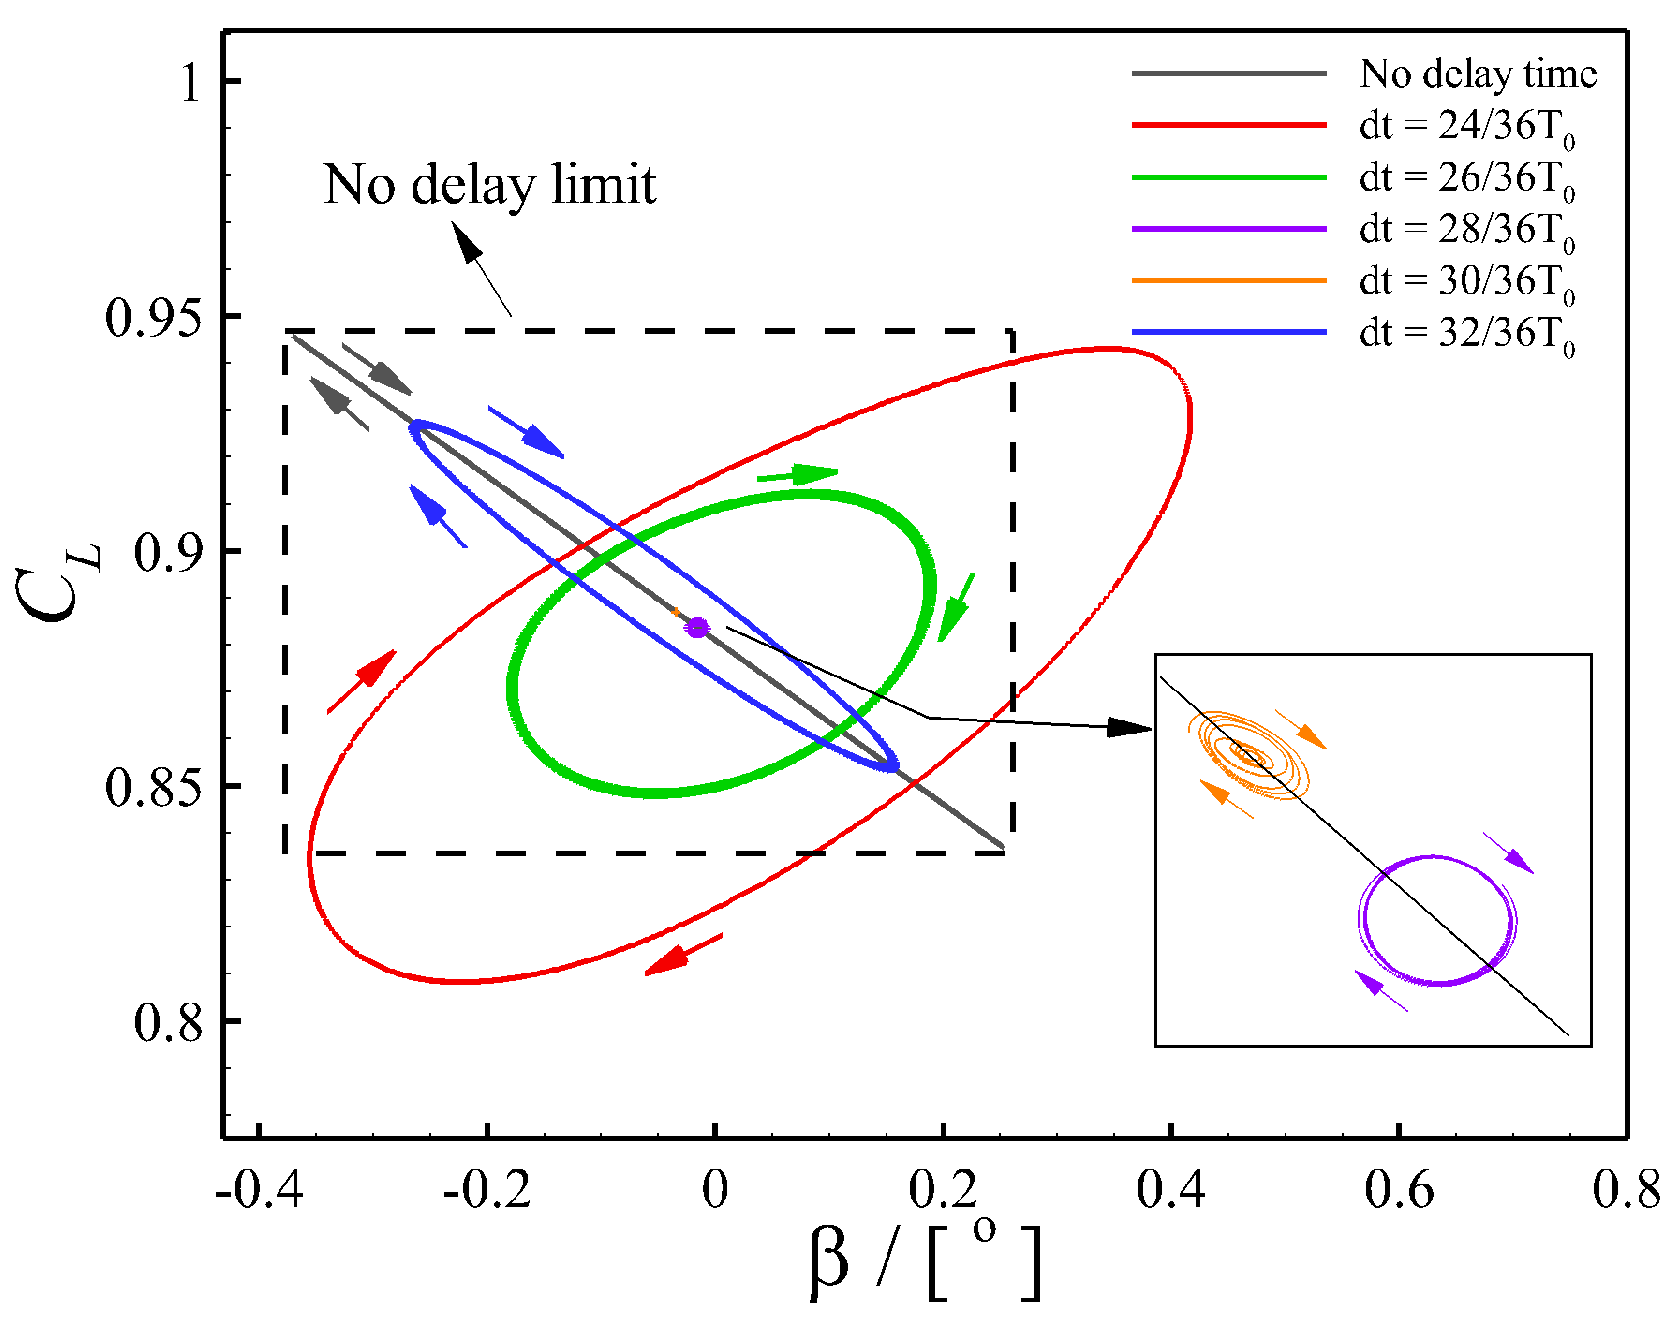
4.1. Closed-Loop Buffet Control Using the Trailing-Edge Flap

Following the work of [23], this study proposed a flight condition of M = 0.73 , α = 3.5 ° , and R e c = 3 × 10 6 on the OAT15A airfoil. This active flap device was chosen as a trailing-edge flap with a 10% chord length, corresponding to a starting location x H of 0.9c, and its deflection axis was located at 90% of the airfoil chord, corresponding to a flap length l T of 0.1c. Note that a flap length of 0.1c is considered to be enough for effective buffet control without changing the original airfoil significantly.
Following the work by Gao et al. [23], the closed-loop control law is defined as follows:
β ( t ) = λ [ C L ( t Δ t ) C L 0 ]
where β(t) is the flap deflection angle, C L 0 is the balanced lift coefficient, Δ t is the delay time, and λ is the gain to control the flap by fluctuating C L ( t ) . According to the geometric definition of the trailing-edge flap shown in Figure 1, the closed-loop feedback control law is redefined as follows:
h T = k T [ C L ( t Δ t ) C L 0 ]
where β = arctan ( h T / l T ) that is hT > 0 corresponds to β < 0, which means the flap rotates upward, and vice versa; and kT is the gain to control the flap. The balanced lift coefficient C L 0 was set to 0.881, which is the mean lift coefficient of the original airfoil under the buffet state of α = 3.5 ° . Note that as the gain kT exceeds 0.03, the flow simulation fails to converge properly, possibly due to a large disturbance to the flow field caused by the flap deflection. Figure 5 shows the effect of gain value on the response of lift coefficient at Δ τ = 0 . Figure 5b shows the variation in the lift coefficient at the beginning of flap control. It can be seen that as the gain increases, the flow disturbance caused by the flap deflection increases. As the gain exceeds the critical value (0.03), the lift coefficient changes abruptly in a very short amount of time, causing difficulties for numerical simulations. A similar conclusion is also mentioned in the study of [23]. In a further study, a gain value kT greater than 0.03 was not considered. In order to achieve an effective buffet suppression, a proper combination of control parameters, including the gain and the delay time, is needed.
The possible combination of control parameters for an effective buffet control is explored by fixing the gain kT as 0.01 while the delay time varies. A gain value of 0.01 is considered to be a reasonable representation for practical applications. Figure 6 illustrates the phase graph of C L versus β, with the delay times ranging from 24 36 T 0 to 32 36 T 0 . Note that T 0 is the buffet period. The phase diagram for the control without delay time, which is a rectangle, is also given in the figure for comparison. At a delay time of 24 36 T 0 , the phase diagram becomes a large ellipse with a clockwise rotation, indicating that the amplitude of the lift fluctuation is relatively large. As the delay time increases to 26 36 T 0 , the area of the phase diagram is reduced and closer to a circle, meaning that the flap has already played a role in suppressing the amplitude of lift fluctuation. At the delay times ranging from 28 36 T 0 to 30 36 T 0 , the phase diagrams almost shrink to a point, indicating an effective buffet suppression. As the delay time continues to increase to 32 36 T 0 , the shock buffet occurs again as the area of the phase diagram becomes large again. It can be seen that the range of delay time for an effective buffet control is only about 2 36 T 0 , which is rather narrow.
The comparison of the C p and C f x distributions between the flows with and without flap control is shown in Figure 7. It shows that the steady state obtained by the flap-based control is slightly different from the mean flow state of the buffet flow. Under the closed-loop flap control, the strength of the shock wave becomes stronger than that of the original mean flow, resulting in an increase in wave drag.

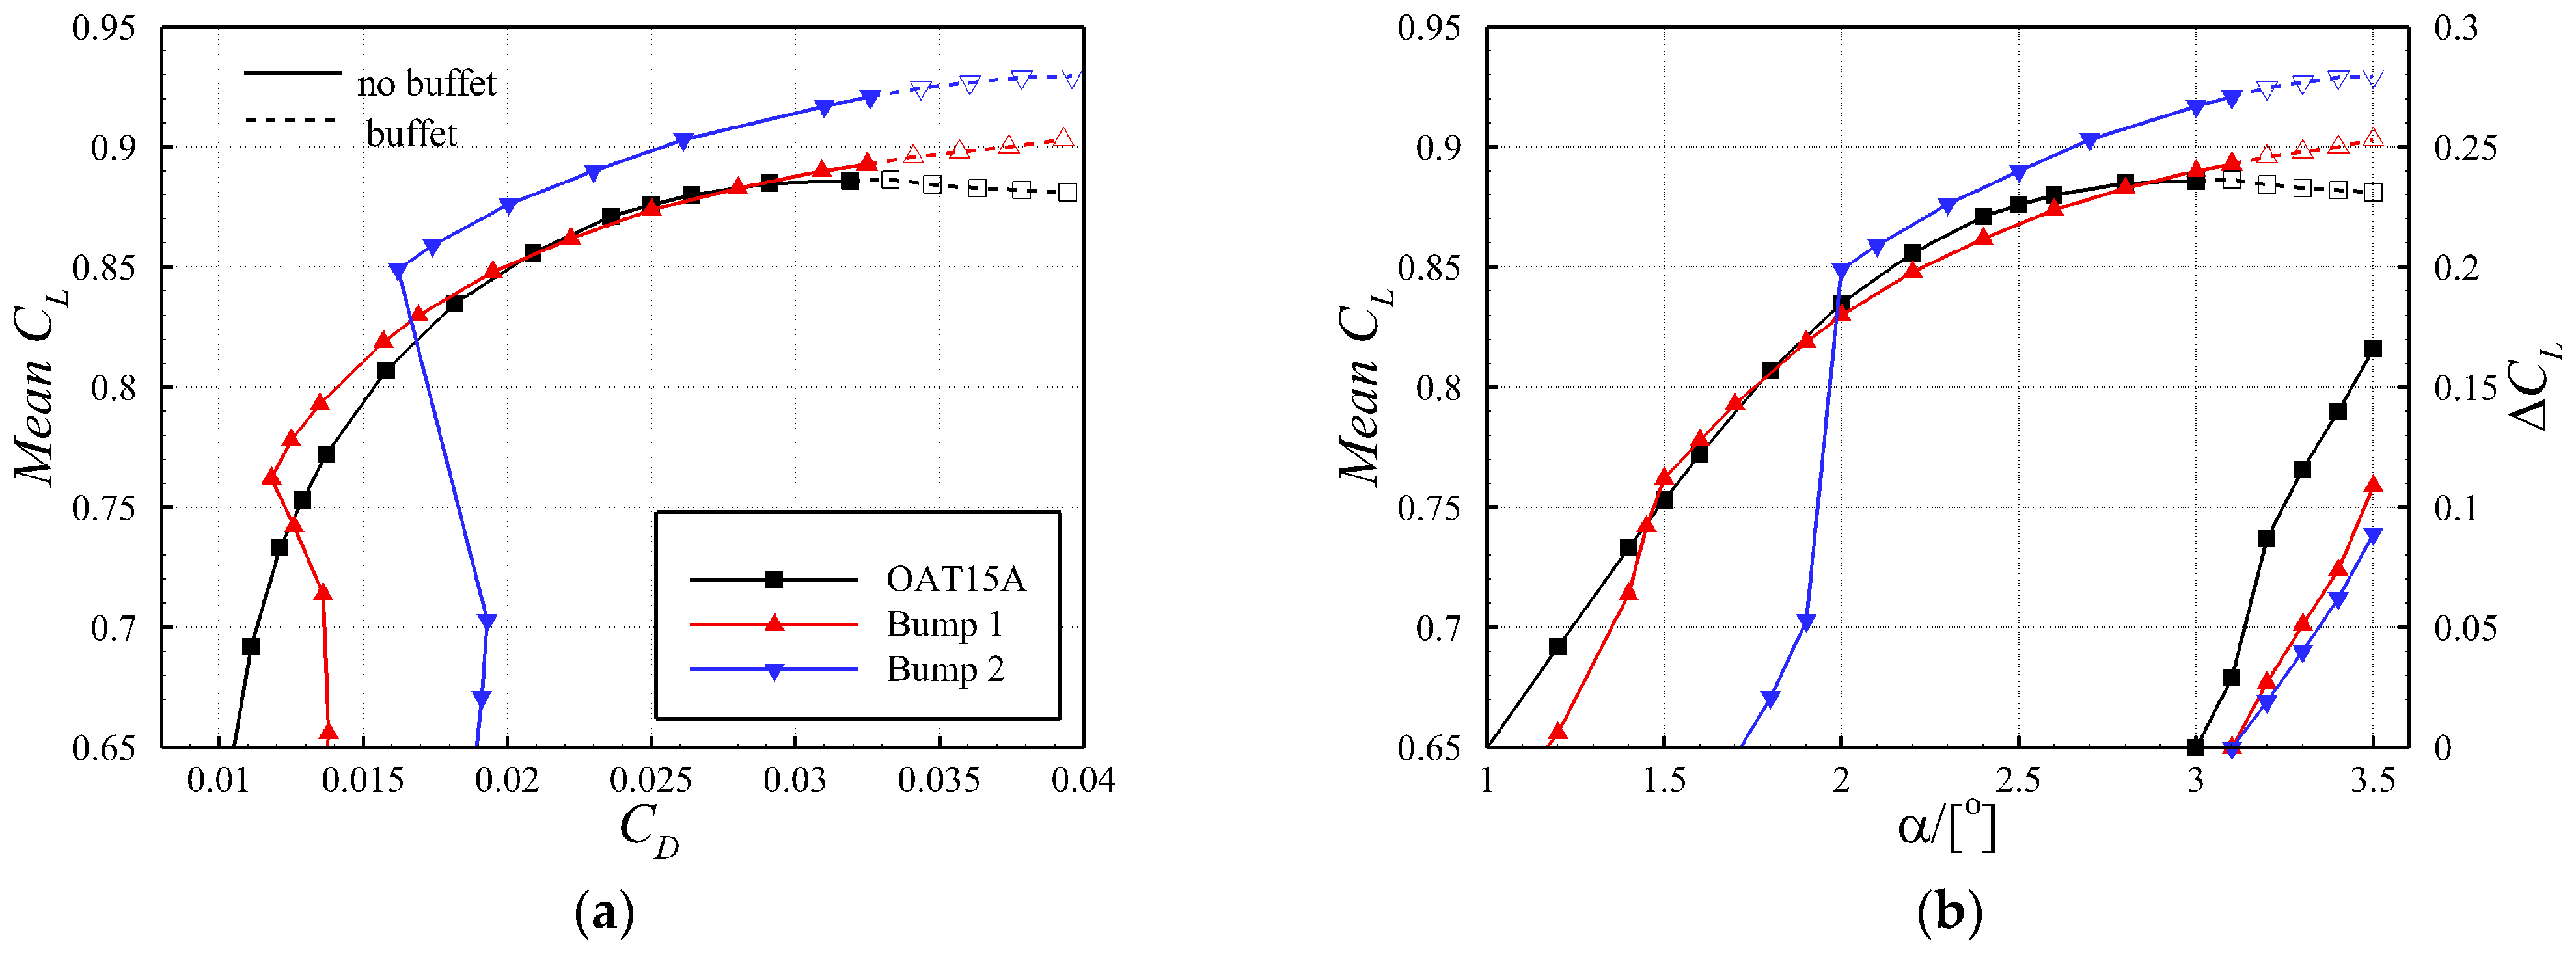
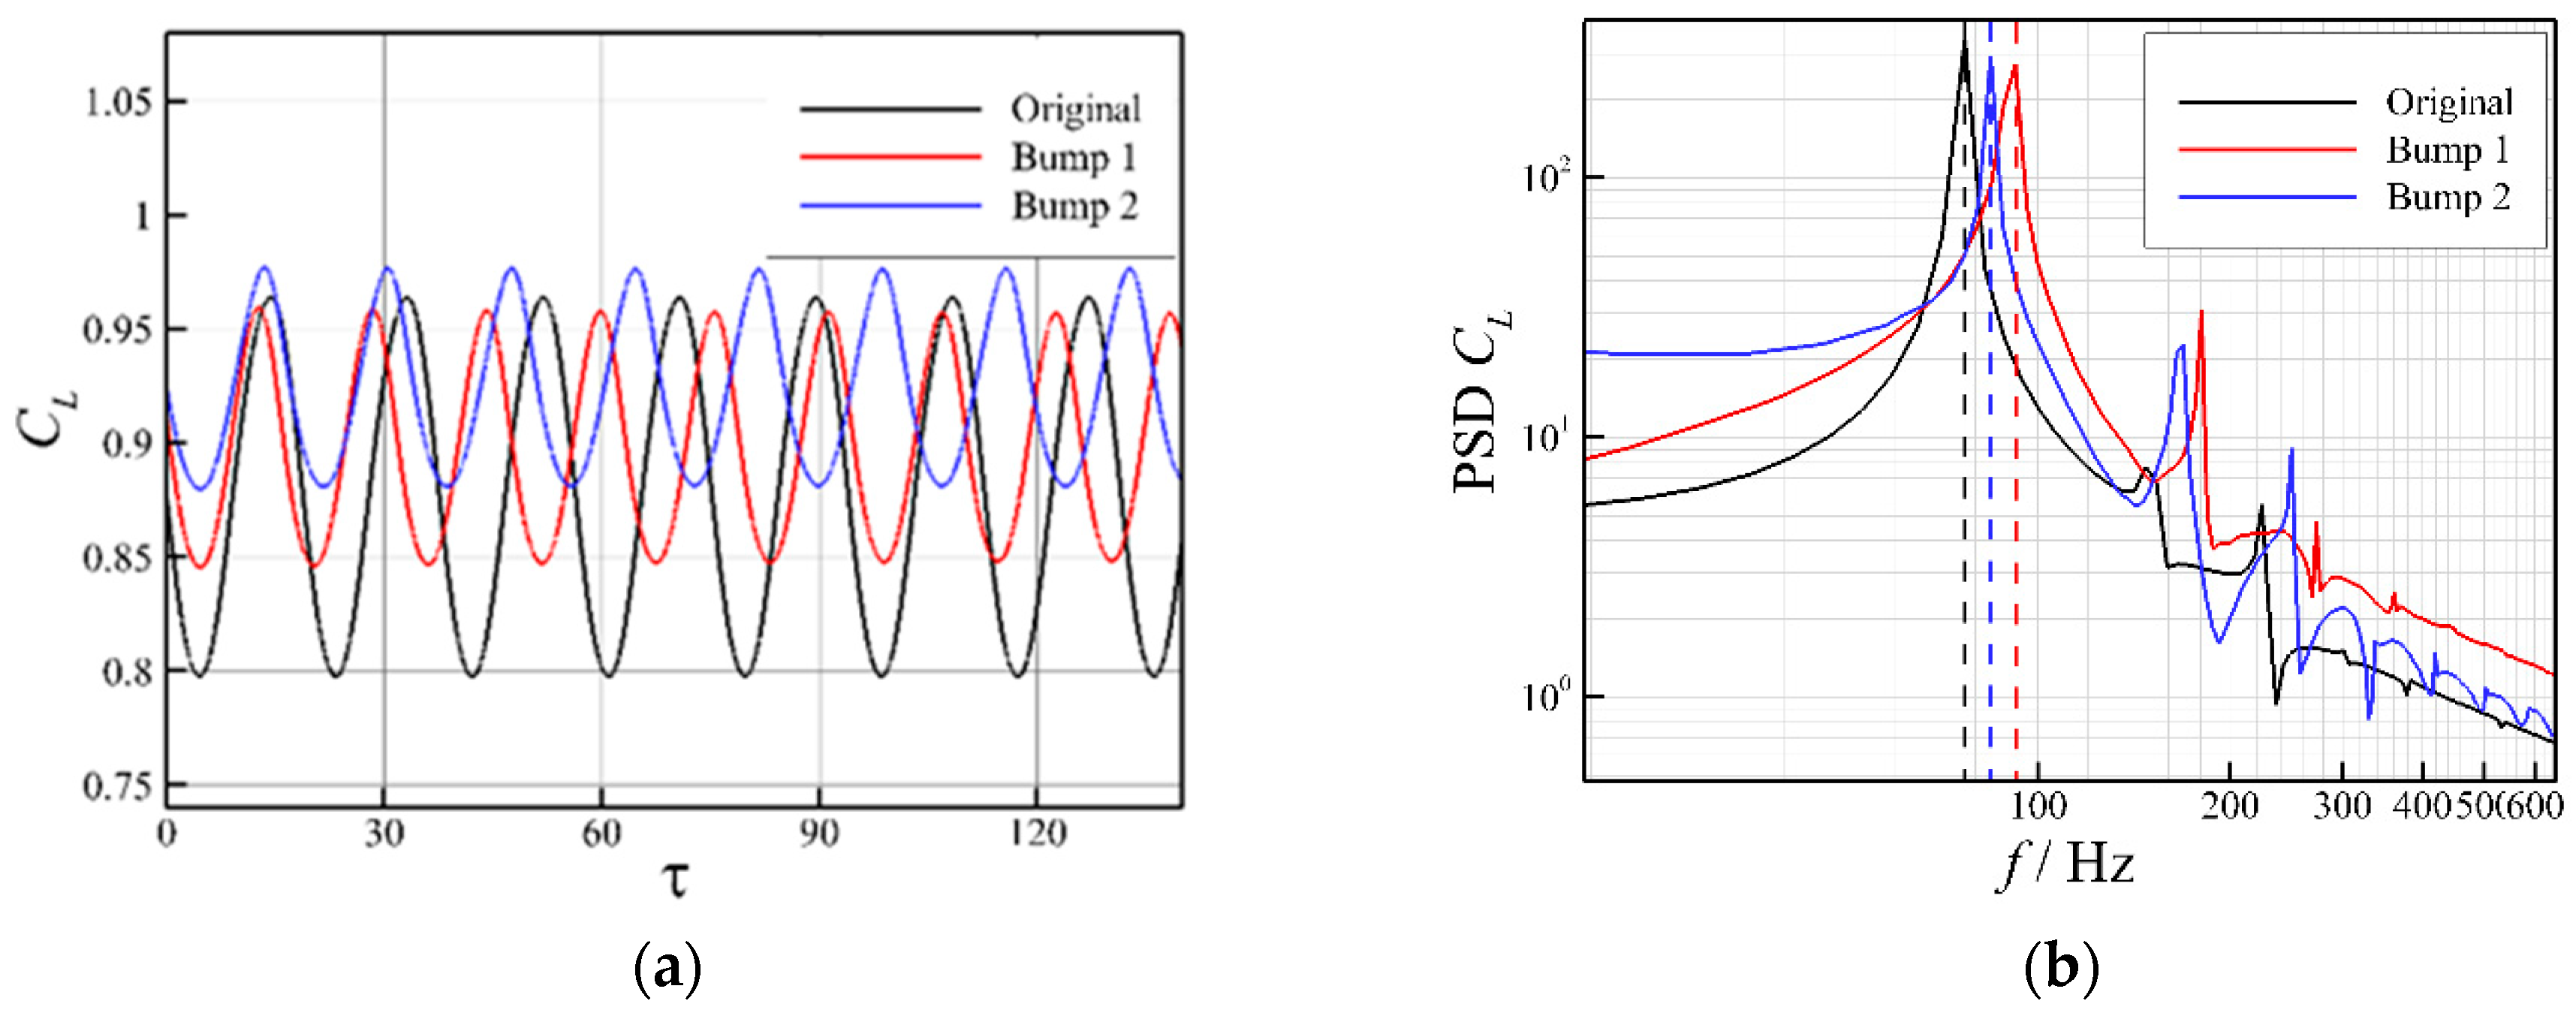
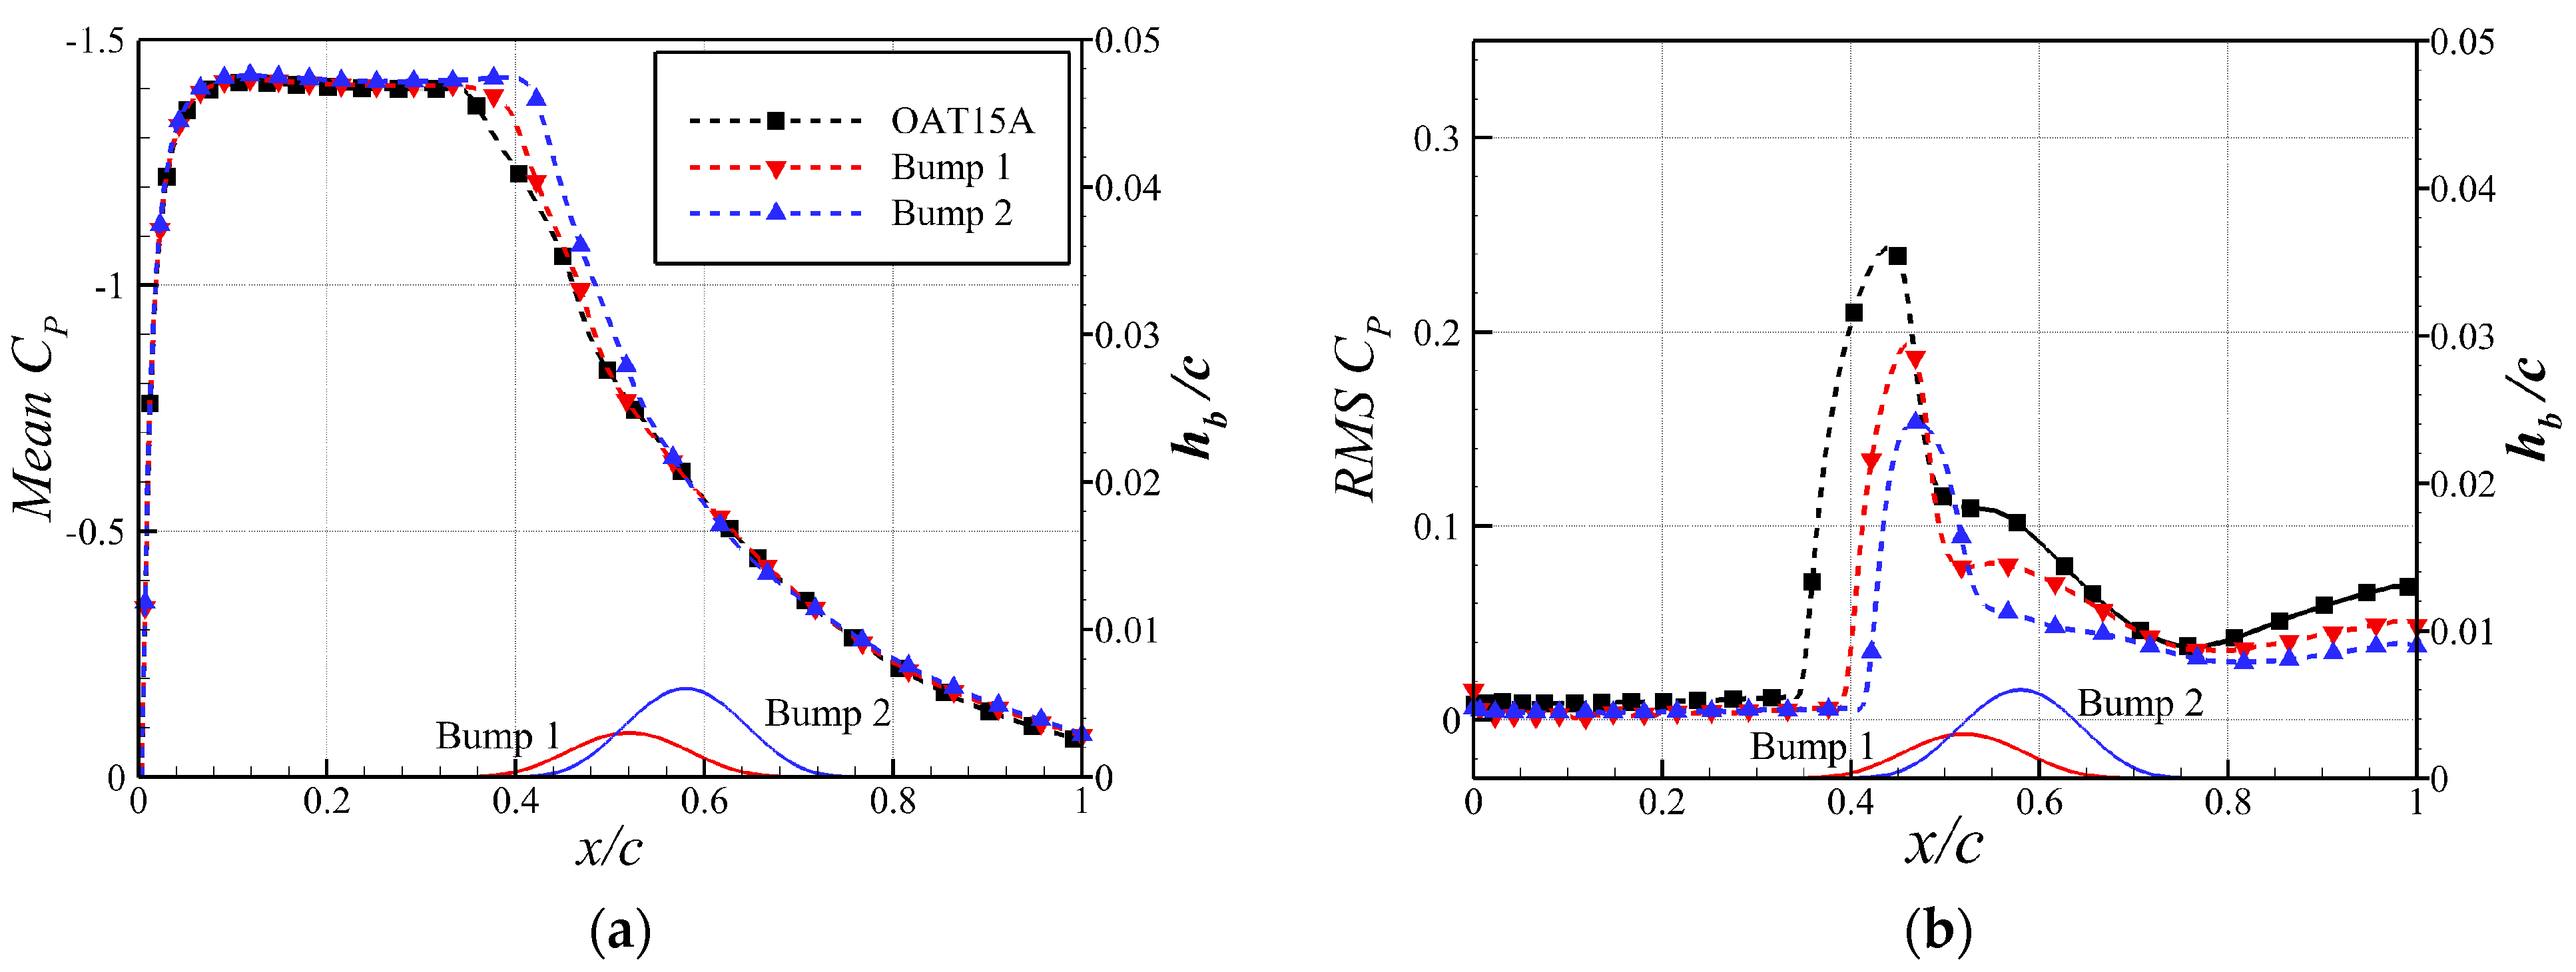
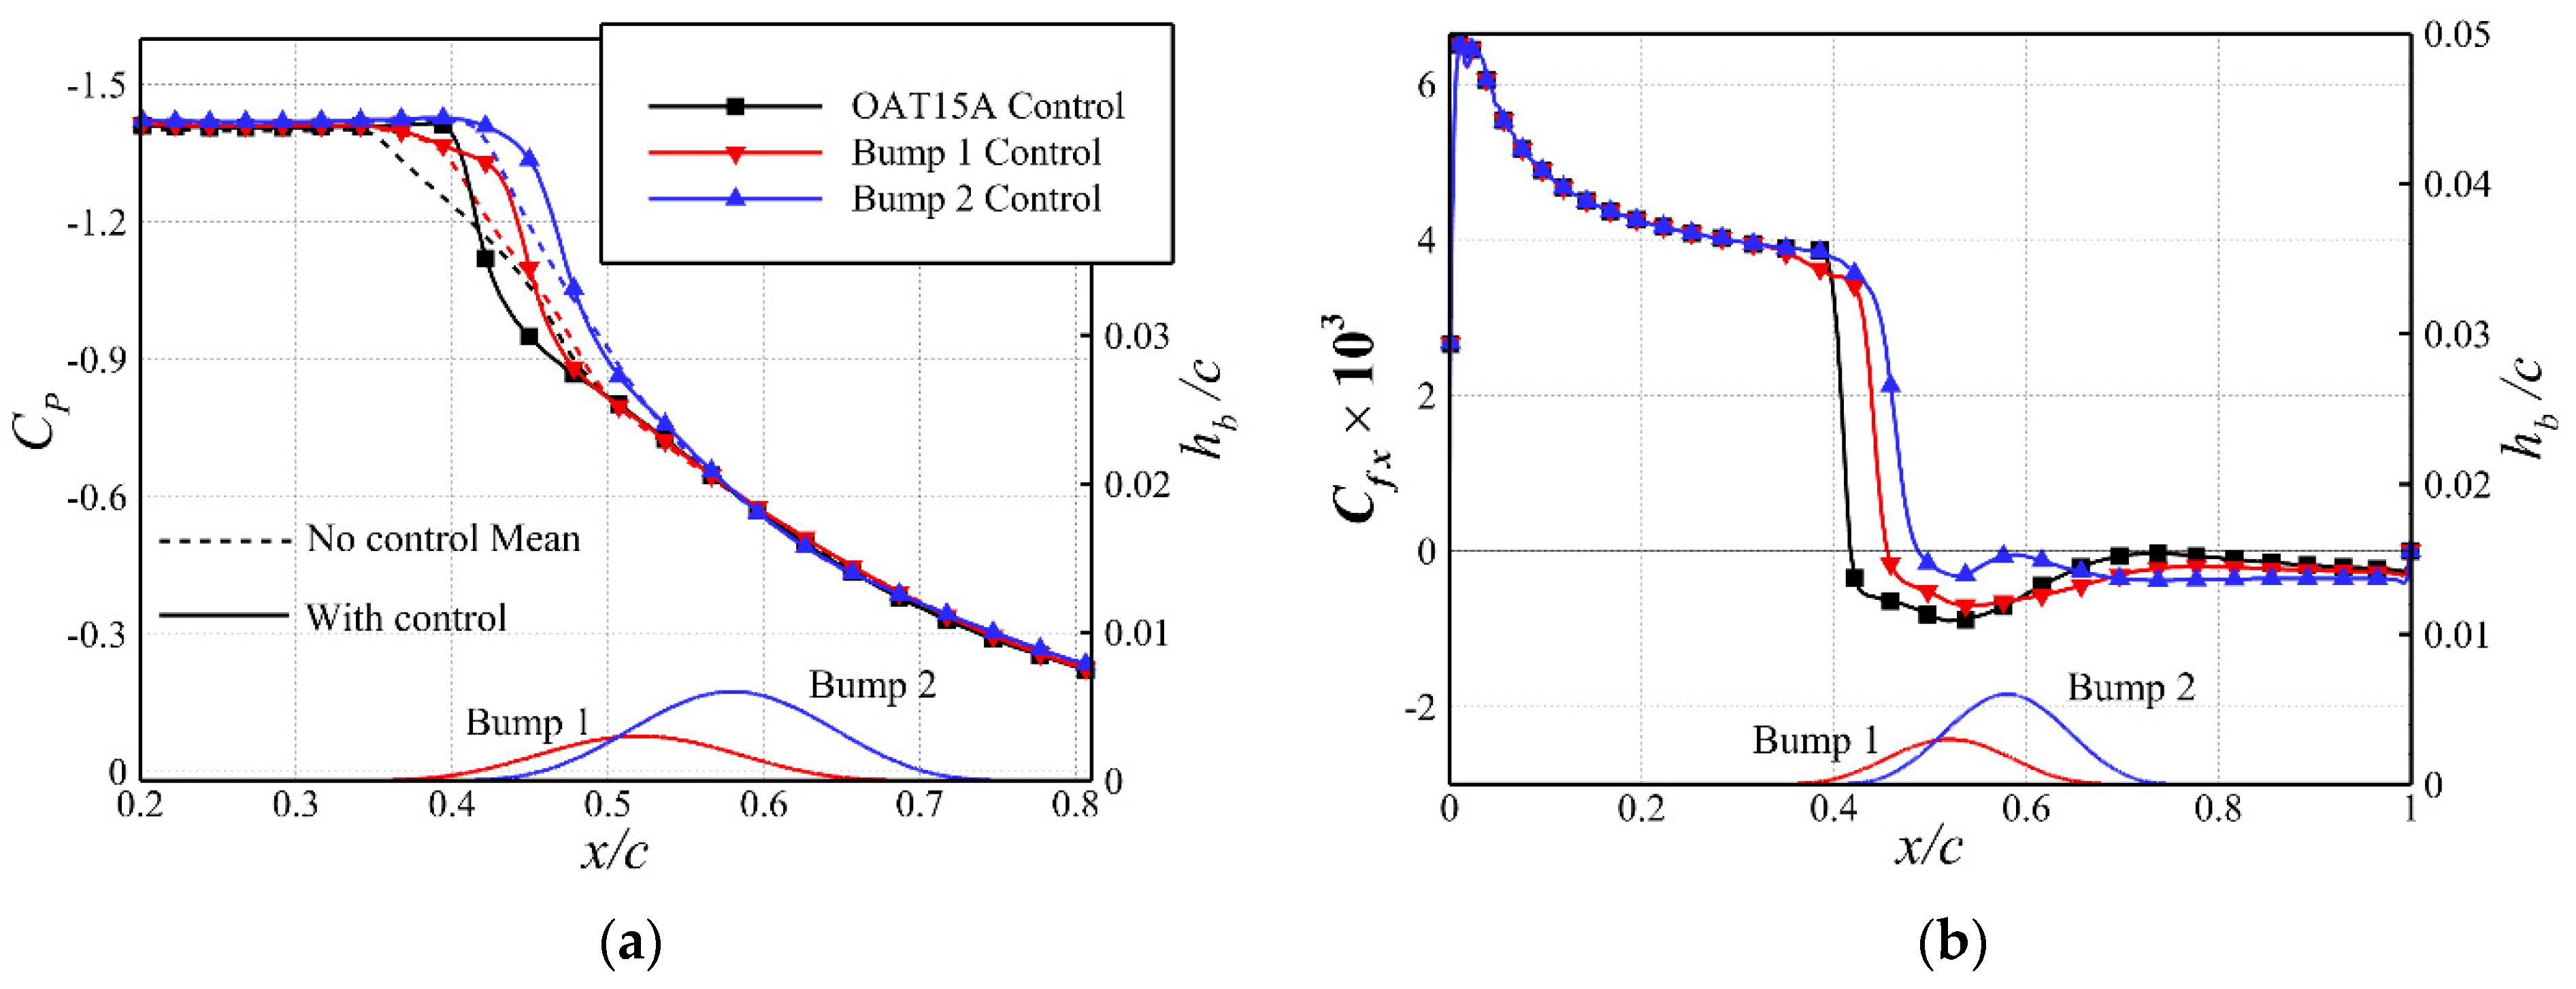
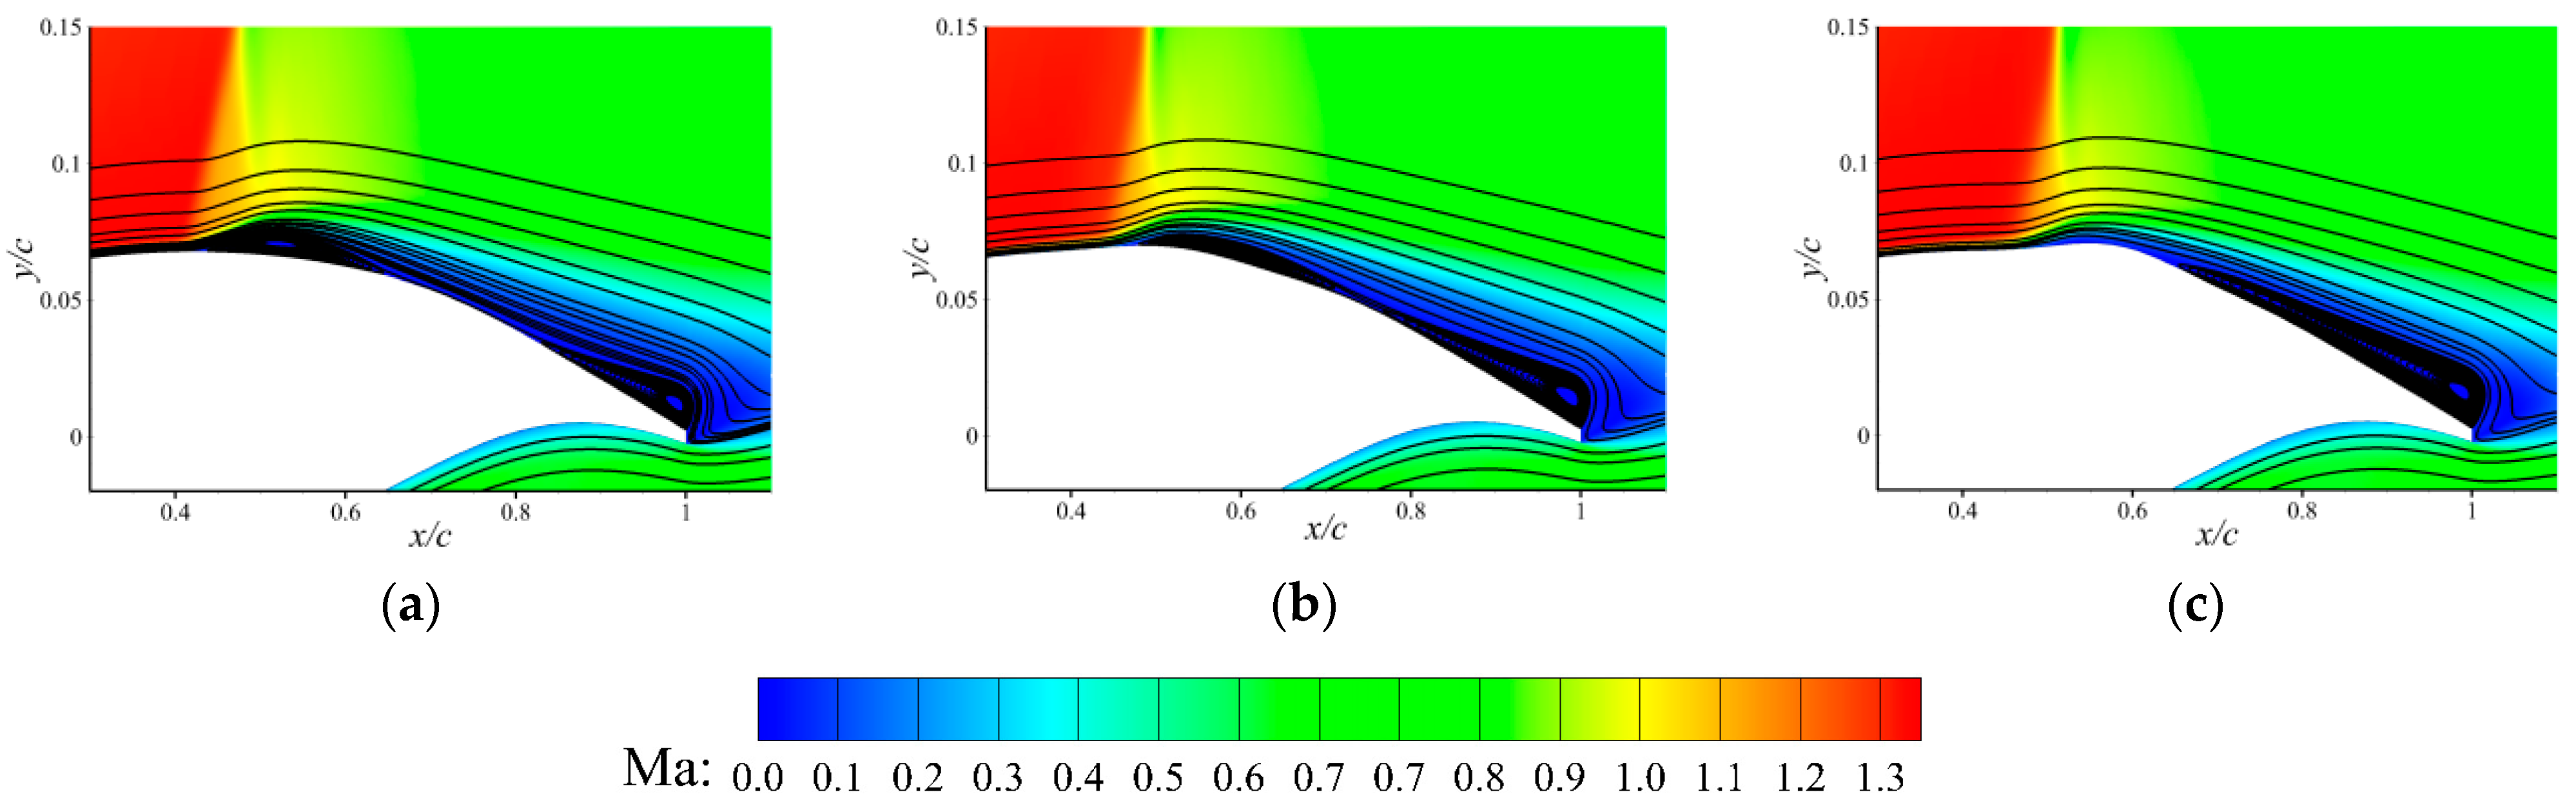
4.2. Shock Control Bumps for Drag Reduction

SCBs are usually designed to reduce the wave drag of wings flying at high speeds or high lift conditions. Two bumps on the airfoil are designed to reduce drag at C L = 0.76 and C L = 0.85, denoted as the D1 and D2 design points, respectively. The D1 condition is a typical high-speed flight condition for a large civil transport aircraft, and the D2 condition is a typical high-lift flight condition [29]. According to the swept theory [47], these two lift coefficients for an airfoil section correspond to C L = 0.51 and C L = 0.57, respectively, for an infinite swept wing with a sweep angle of 35 ° , a typical value for a large civil transport aircraft. The other flow conditions are the same as those mentioned above, namely M = 0.73 and R e c = 3 × 10 6 . Note that the bumps designed at D1 and D2 are named Bump 1 and Bump 2, respectively.
According to the previous study [44], the SCB parameters optimal for drag reduction at a given lift coefficient can be obtained, which are provided in Table 3. The comparison of the aerodynamic coefficients is shown in Figure 8. The designed bumps reduce about 11% and 19% of the total drag, respectively, at their design points compared to that of the baseline airfoil. The two designed SCBs effectively reduce the drag at their design points by turning the normal shock wave on the baseline airfoil into a λ-type shock wave, therefore weakening the shock strength and reducing the wave drag. The same conclusion has been drawn in [32,35]. In comparison with the D2 condition, the wave drag reduction under the D1 condition is lower due to a weaker shock intensity. In addition to drag reduction, both bumps slightly delay the buffet onset, resulting in increased maximum lift coefficients of 2.5% and 5.6% higher than that of the baseline airfoil, respectively. Additionally, both bumps damp lift oscillations Δ C L inside the buffet regime, as shown in Figure 8b.
Figure 9a shows the calculated lift coefficient C L under the condition of M = 0.73 , α = 3.5 ° , and R e c = 3 × 10 6 . The lift history is present with respect to the nondimensional time τ = t × U 0 / c , where U 0 and t represent inflow velocity and flow time, respectively. Compared with the original airfoil, the lift fluctuation amplitude of the buffet is reduced under the effect of bumps. From the PSD C L of different configurations shown in Figure 9b, it is clear that both bump configurations increase the frequency of lift coefficient oscillation in comparison with the original configuration. It is evident that the geometric bump parameters, including the position and height, have a significant impact on the buffet frequency, as also shown in the study by Tian et al. [37].
The mean pressure distributions and the RMS of pressure fluctuations of different configurations are illustrated in Figure 10. It shows that the increase in mean lift is mainly due to postponing the mean shock location of the bumps. Additionally, the pressure fluctuations near the mean shock location and the trailing edge are both reduced, while the bumps postpone the beginning point of the pressure fluctuation downstream. Geoghegan et al. [38] investigated the influence of passive SCB parameters on shock buffet control and found that both the position and height of SCB have a significant impact on buffet control. At the same time, they noted that the bumps, within 5% of the chord length of the mean shock position at the buffet condition, suppressed the shock oscillation earlier than the bumps positioned downstream. This explains that in this paper, Bump 1, located further upstream, can accomplish the same level of buffet alleviation with a lower height than Bump 2 (located further downstream).
Overall, the bumps designed for drag reduction can slightly improve the buffet behavior of the supercritical airfoil by delaying the buffet onset and weakening the lift oscillation inside the buffet regime. Nevertheless, the bumps fail to achieve an effective buffet suppression.

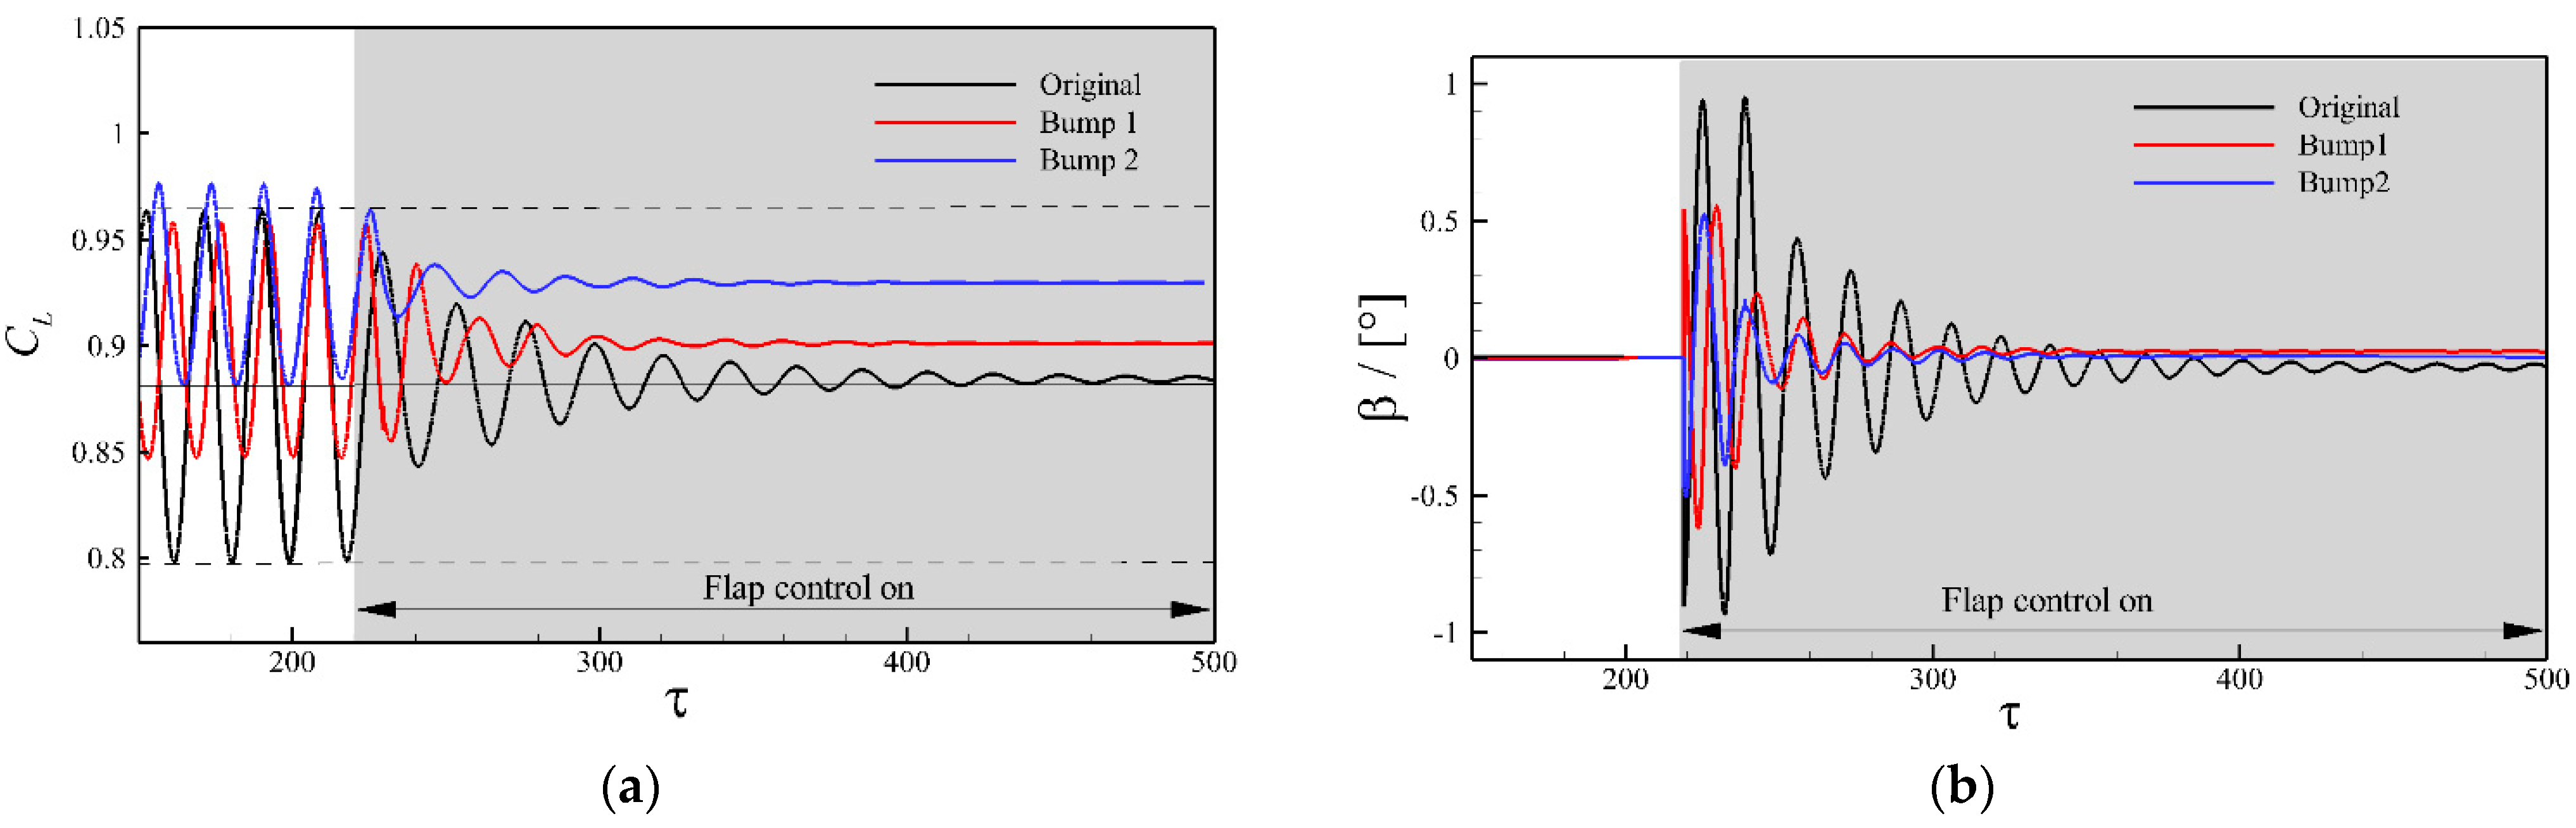
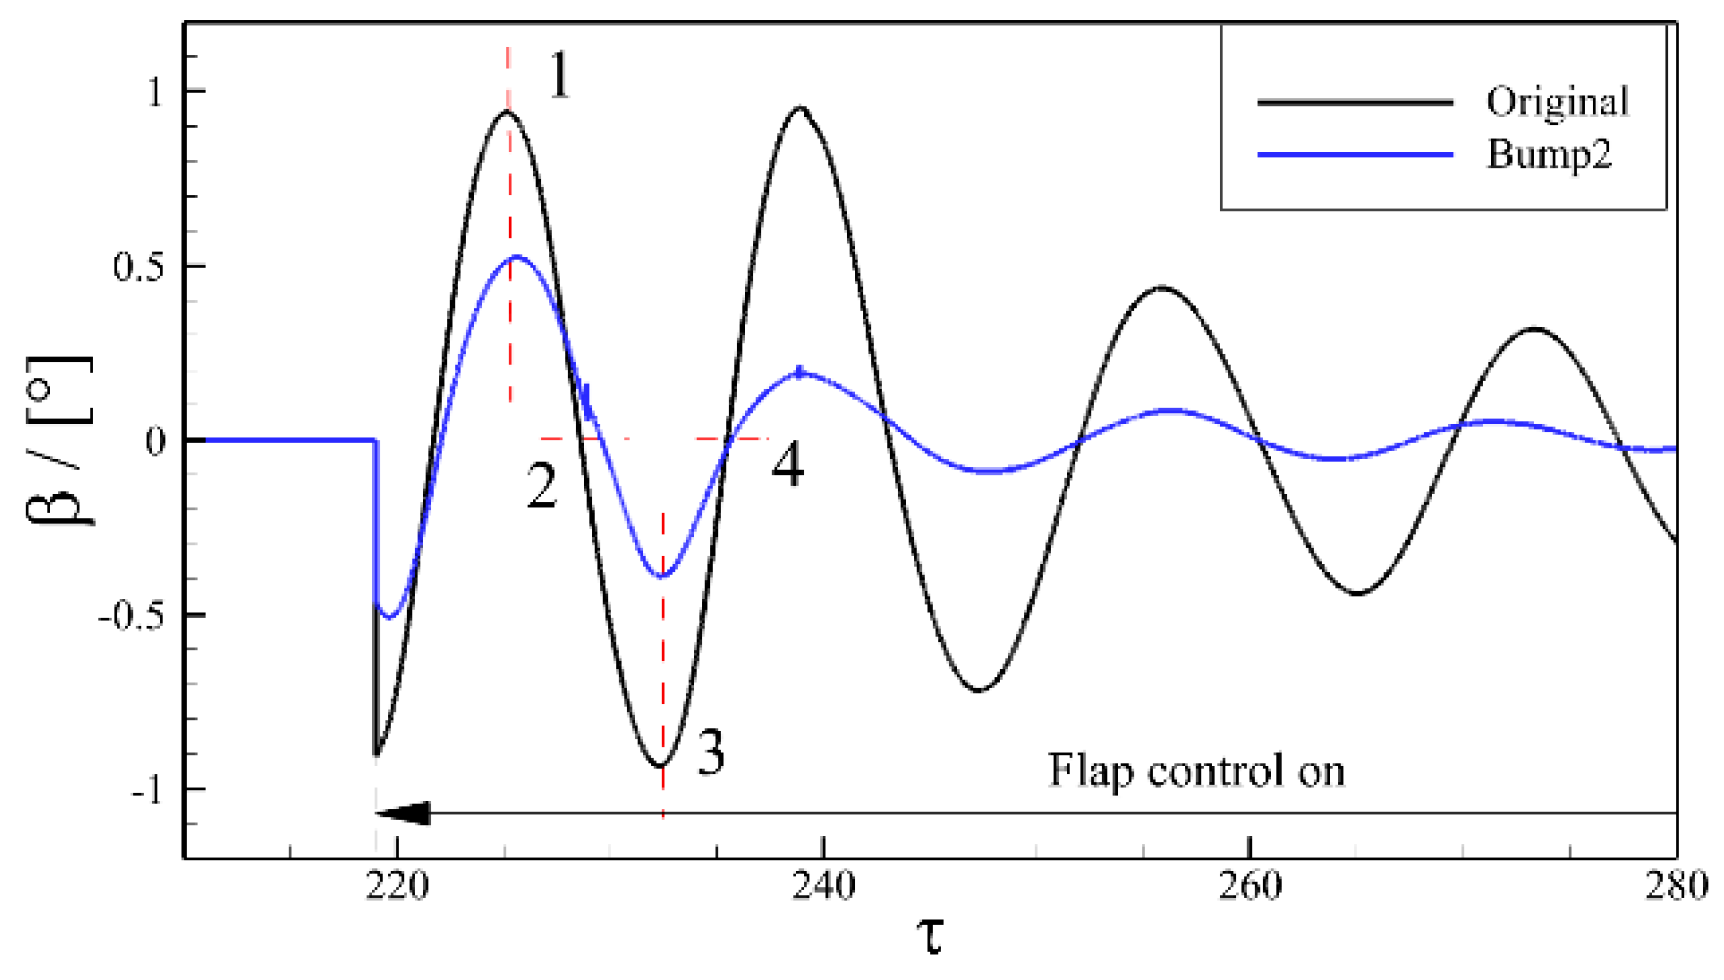
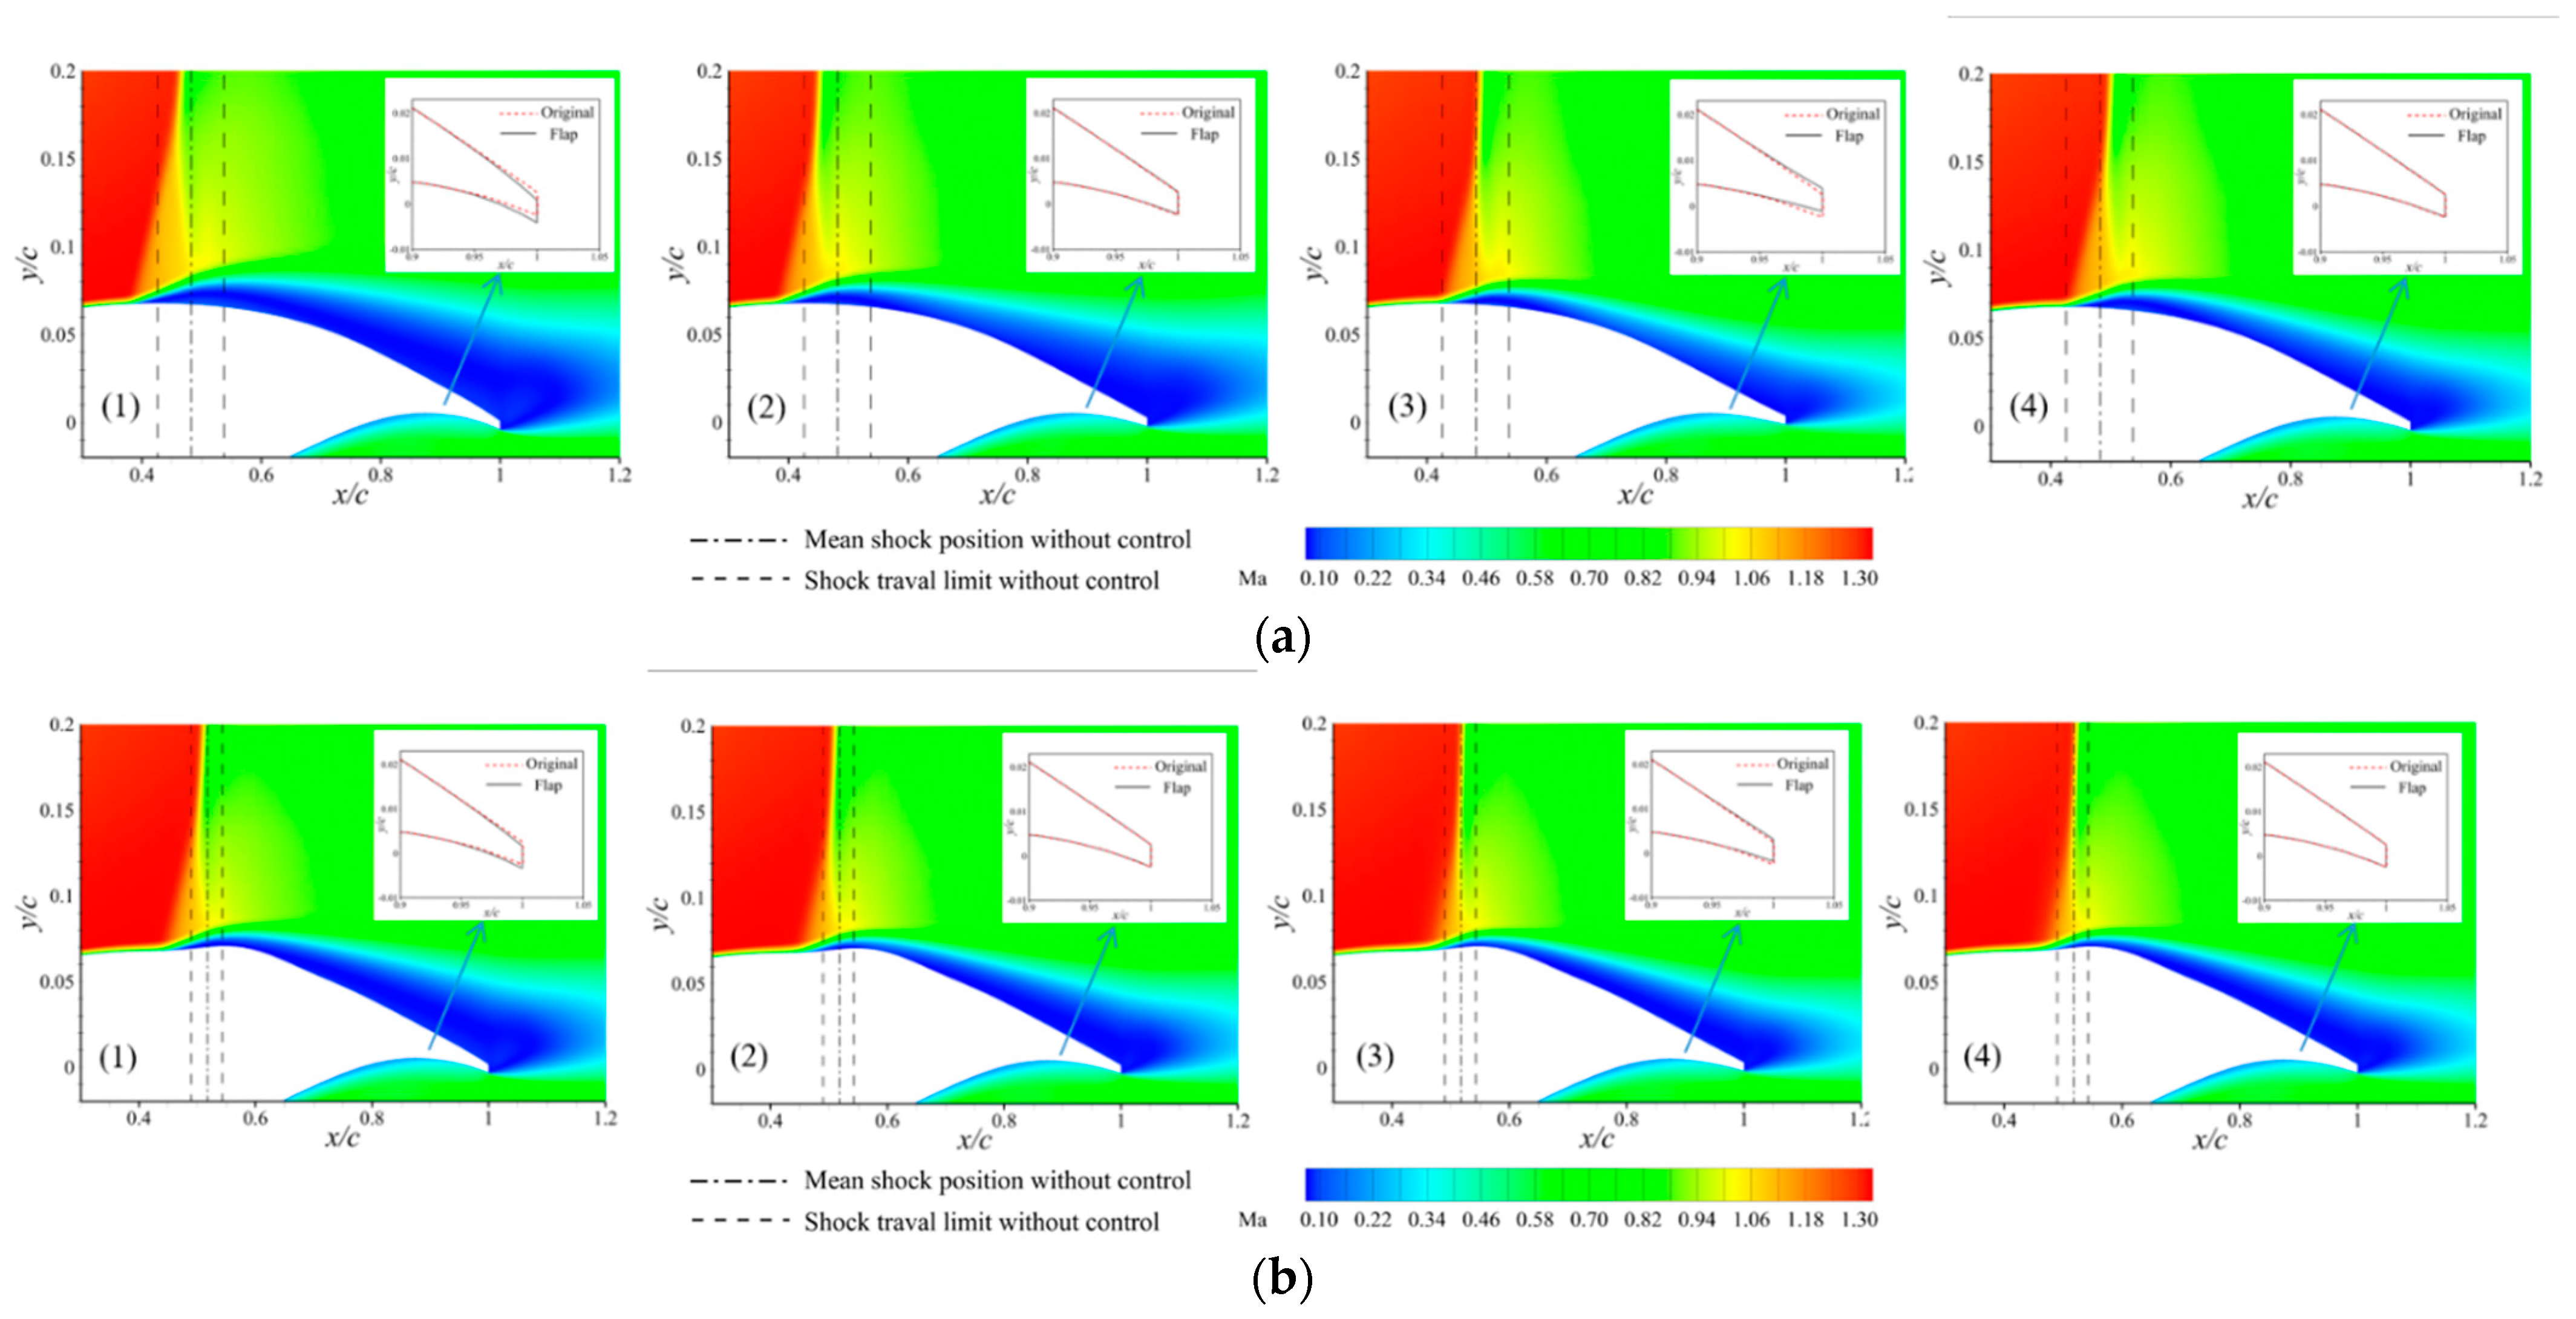
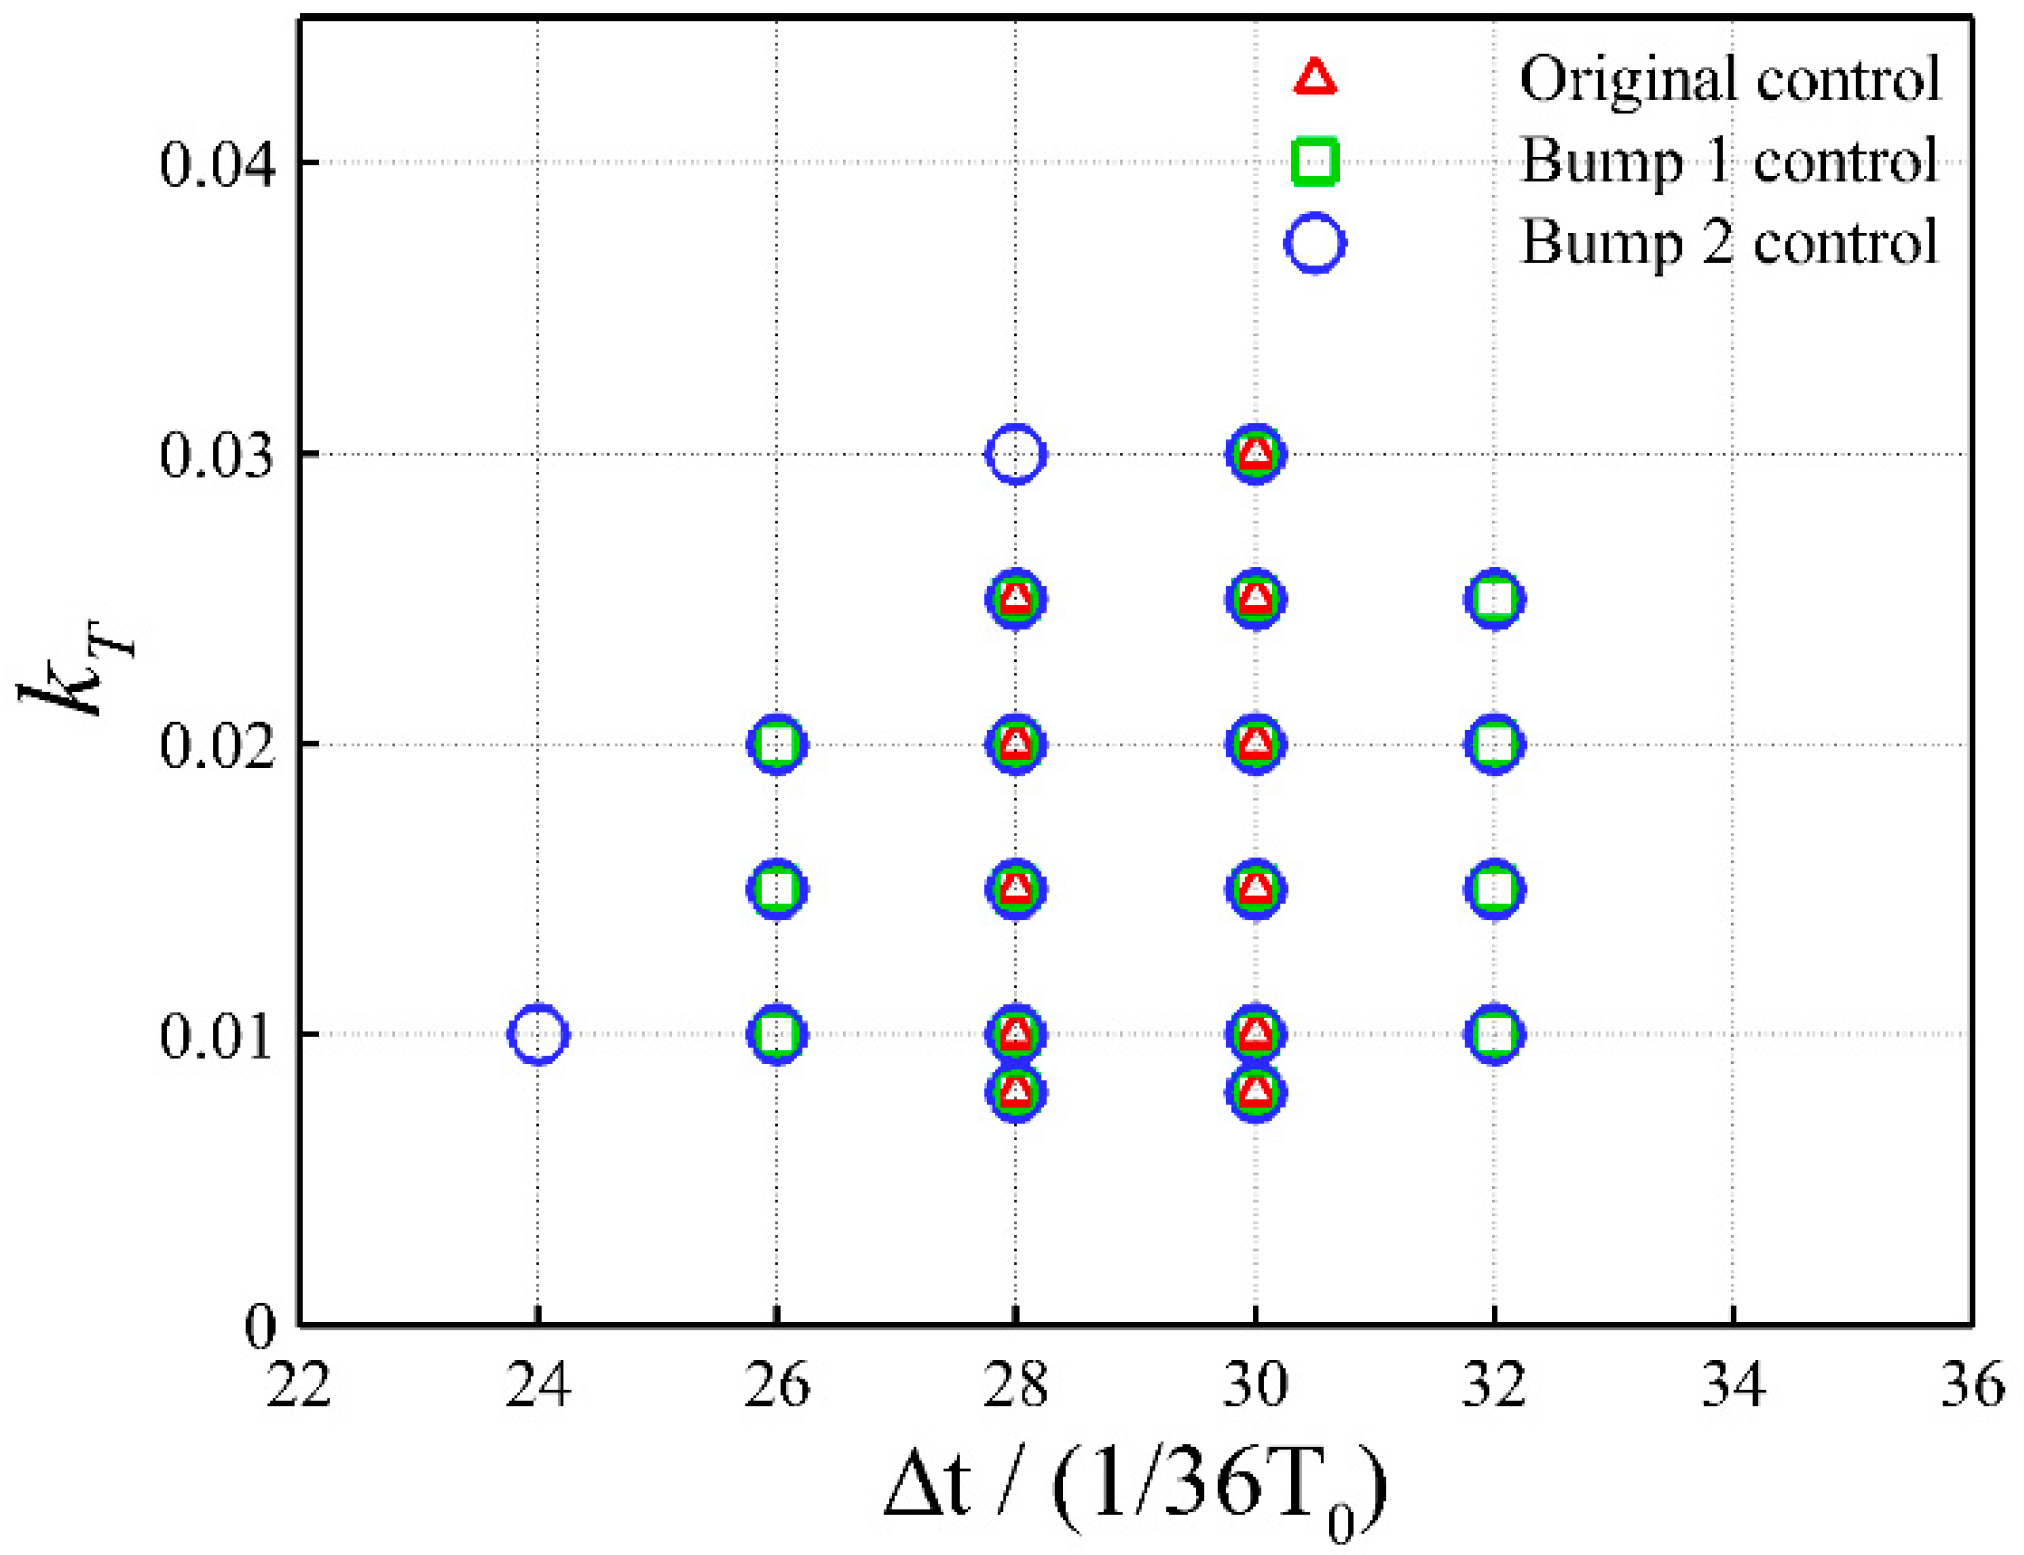
4.3. Closed-Loop Flap Buffet Control Enhanced by Shock Control Bumps

In this section, the possibility of integrating the passive SCBs into the closed-loop flap control system is explored. The active flap buffet control on the two bump configurations mentioned above has been carried out at the condition of M = 0.73 , α = 3.5 ° and R e c = 3 × 10 6 .
The lift time histories for different configurations under the closed-loop control are illustrated in Figure 11a. The lift fluctuations of all three configurations are suppressed to almost steady states by the closed-loop control of kT = 0.02 and Δ t = 28 36 T 0 . It can be seen that the bumps designed for drag reduction do not degrade the effectiveness of the closed-loop flap control. Furthermore, the bumps can effectively increase the lift at a steady state, especially for Bump 2. Figure 11b shows the comparison of the time histories of the flap deflection angle. It can be observed that the bumps can greatly reduce the amplitude of the flap deflection angle.
Figure 12 and Figure 13 show the dynamic process in one period of flap control. The figures illustrate the trailing-edge flap deflections and the Mach number contours at different moments. In Figure 13a, it can be seen that the shock wave goes from downstream to upstream from time (1) to time (2), and the flap deflects downward, restricting the shock wave’s upstream moving trend. At time (2), it is clear that the upstream range of the shock movement becomes smaller due to the downward flap deflection as compared to that without flap control. From time (2) to time (3), the shock wave begins to move downstream from upstream, while the trailing edge begins to deflect upward, limiting the downstream trend of the shock movement. The shock wave moves to the farthest downstream location at time (4), and the buffet range is significantly reduced compared to that without flap control. After repeating the above process, the motion of the shock wave is eventually stabilized around the mean location, achieving the buffet suppression. A similar dynamic process can be found in Figure 13b as well, except that the flap deflection angle is reduced due to a shorter range of the shock movement restricted by the presence of the bump.
Table 4 shows the aerodynamic performances of different configurations with and without the closed-loop flap control. In the table, “mean” represents the mean value of the aerodynamic coefficient for the configurations without the closed-loop flap control. For the configurations with the closed-loop flap control, the aerodynamic coefficients are the stable values after control. As shown in the table, the lift–drag ratios of the airfoils with Bumps 1 and 2 have been increased by 4% and 6% compared to that of the original airfoil, respectively. The changes in the lift and drag coefficients for different configurations are presented in Table 5. It can be concluded that the SCBs designed for drag reduction can slightly improve the steady-state airfoil performance under the closed-loop flap control.
Figure 14 shows the pressure and skin friction distributions at the steady state under the closed-loop control for all three configurations. It can be clearly seen that the bumps with control push the shock downstream and weaken the shock strength, resulting in an increase in lift and a decrease in pressure drag at the cost of a small increase in skin friction drag, as shown in Figure 14b. Using the skin friction in the streamwise direction C f x as an indication of boundary layer separation, it can be concluded that the bumps postpone the flow separation region downstream, thus weakening the shock-induced flow separation around the foot of the shock wave. Figure 14b presents the C f x distributions for different configurations. For the Bump 2 configuration, some variation in the skin friction coefficient can be observed around the bump crest position. The reason is that the presence of the bump causes the separated boundary layer in the upstream to reattach at the front of the bump, and then the boundary layer separates again at the bump tail due to a high local curvature.
The Mach number contours for the steady states are shown with streamlines in Figure 15. Two flow separation bubbles can be observed on the upper surface of the original airfoil. The upstream one is apparently induced by the shock wave, while the downstream one is due to the trailing-edge separation. The bumps have effectively reduced the size of the upstream bubble due to their ability to weaken shock strength. However, due to a higher local curvature caused by the bump, the downstream flow tends to be more easily separated, resulting in an enlarged separation bubble downstream. Although the downstream bubble is enlarged by the bumps, it can be seen that this negative effect is surpassed by the positive effect of reducing the shock strength. Overall, it can be concluded that the passive shock control bumps designed for drag reduction can coexist with the active flap-buffet control system and can even improve their performances in buffet control.
As previously mentioned, a proper combination of the delay time Δ t and the gain kT is required for an effective closed-loop flap control. Therefore, different combinations of these two control parameters are investigated. Figure 16 shows the combinations of control parameters that can completely suppress the transonic buffet under the condition of M = 0.73 , α = 3.5 ° , and R e c = 3 × 10 6 . It is clear that the range of the delay time for an effective buffet control is very narrow on the original airfoil, whereas Bump 1 almost doubles the effective range, and Bump 2 can further improve from that of Bump 1. Note that the control system with a wider range of effective control parameters can tolerate a higher level of fluctuations in the operating environment, thus offering more robustness. In summary, the SCBs designed for drag reduction have a positive effect on improving the robustness of the closed-loop flap control.

5. Conclusions

Based on the time-resolved URANS simulations, the effects of the closed-loop control by coupling a flap and an SCB for transonic buffet have been investigated. The closed-loop control using the trailing-edge flap was designed by referring to the lift coefficient of the configurations, while the bumps are designed to reduce drag at the given design conditions. It is confirmed that the closed-loop control using the trailing-edge flap can effectively suppress the buffet flow to an almost steady flow with a proper combination of control parameters. On the other hand, the two designed bumps obtained about 11% and 19% drag reduction at their design points compared to the clean airfoil. At the buffet condition, the two bumps can also reduce the amplitudes of lift oscillations and increase the mean lift coefficients. Furthermore, it is found that the closed-loop flap control can be greatly enhanced by coupling with the SCBs. At the steady state under control, the lift–drag ratios of Bumps 1 and 2 have been increased by 4% and 6% compared to that of the original airfoil, respectively. More importantly, the ranges of control parameters that can effectively suppress the buffet are significantly enlarged with the help of the bumps; thus, the robustness of the control system is greatly enhanced.

Author Contributions

Conceptualization, F.D.; methodology, S.Z.; software, S.Z.; validation, S.Z. and F.D.; investigation, S.Z.; resources, F.D.; data curation, S.Z.; writing—original draft preparation, S.Z. and F.D.; writing—review and editing, F.D. and N.Q.; visualization, S.Z.; supervision, F.D. and N.Q.; project administration, F.D.; funding acquisition, F.D. All authors have read and agreed to the published version of the manuscript.

Funding

This research was supported by the Fundamental Research Funds for the Central Universities (No. NJ2022008) and a project funded by the Priority Academic Program Development of Jiangsu Higher Education Institutions.

Institutional Review Board Statement

Not applicable.

Data Availability Statement

Some or all data, models, or codes that support the findings of this study are available from the corresponding author upon reasonable request.

Conflicts of Interest

The authors declare no conflict of interest.

Nomenclature

cAirfoil chord length
C L Lift coefficient
C D Drag coefficient
C p Pressure coefficient
C f x x-component of skin friction coefficient
fsbShock buffet frequency
hbBump height
kTGain of the closed-loop control
lbBump length
MFreestream Mach number
pPressure
q 0 Dynamic pressure
RecReynolds number based on the airfoil chord length
T 0 Shock buffet period
xsDistance between the bump crest and the mean shock location
xshMean shock location
αFreestream angle of attack
βFlap deflection angle
τNon-dimensional time step
Δ t Delay time of the closed-loop control
PSDPower spectral density
RMSRoot mean square

References

  1. Runze, L.I.; Kaiwen, D.; Zhang, Y.; Haixin, C. Pressure Distribution Guided Supercritical Wing Optimization. Chin. J. Aeronaut. 2018, 31, 1842–1854. [Google Scholar]
  2. Crouch, J.D.; Garbaruk, A.; Mmagidov, D.; Travin, A. Origin of transonic buffet on aerofoils. J. Fluid Mech. 2009, 628, 357–369. [Google Scholar] [CrossRef]
  3. Lee, B.H.K. Self-sustained shock oscillations on airfoils at transonic speeds. Prog. Aerosp. Sci. 2001, 37, 147–196. [Google Scholar] [CrossRef]
  4. Lee, B.H.K. Effects of trailing-edge flap on buffet characteristics of a supercritical airfoil. J. Aircr. 1992, 29, 93–100. [Google Scholar] [CrossRef]
  5. Lee, B.H.K. Oscillatory shock motion caused by transonic shock boundary-layer interaction. AIAA J. 1990, 28, 942–944. [Google Scholar] [CrossRef]
  6. Xiao, Q.; Tsai, H.-M.; Liu, F. Numerical Study of Transonic Buffet on a Supercritical Airfoil. AIAA J. 2006, 44, 620–628. [Google Scholar] [CrossRef] [Green Version]
  7. Deck, S. Zonal-Detached-Eddy Simulation of the Flow Around a High-Lift Configuration. AIAA J. 2005, 43, 2372–2384. [Google Scholar] [CrossRef] [Green Version]
  8. Deck, S. Numerical Simulation of Transonic Buffet over a Supercritical Airfoil. AIAA J. 2005, 43, 1556–1566. [Google Scholar] [CrossRef]
  9. Levy, L.L. Experimental and Computational Steady and Unsteady Transonic Flows about a Thick Airfoil. AIAA J. 1978, 16, 564–572. [Google Scholar] [CrossRef]
  10. Iovnovich, M.; Raveh, D.E. Reynolds-Averaged Navier-Stokes Study of the Shock-Buffet Instability Mechanism. AIAA J. 2012, 50, 880–890. [Google Scholar] [CrossRef]
  11. Goncalves, E.; Houdeville, R. Turbulence model and numerical scheme assessment for buffet computations. Int. J. Numer. Methods Fluids 2004, 46, 1127–1152. [Google Scholar] [CrossRef]
  12. Barakos, G.; Drikakis, D. Numerical simulation of transonic buffet flows using various turbulence closures. Int. J. Heat Fluid Flow 2000, 21, 620–626. [Google Scholar] [CrossRef]
  13. Thiery, M.; Coustols, E. URANS Computations of Shock-Induced Oscillations Over 2D Rigid Airfoils: Influence of Test Section Geometry. Flow Turbul. Combust. 2005, 74, 331–354. [Google Scholar] [CrossRef]
  14. Thiery, M.; Coustols, E. Numerical prediction of shock induced oscillations over a 2D airfoil: Influence of turbulence modelling and test section walls. Int. J. Heat Fluid Flow 2006, 27, 661–670. [Google Scholar] [CrossRef]
  15. Illi, S.; Lutz, T.; Krämer, E. On the Capability of Unsteady RANS to Predict Transonic Buffet. In Proceedings of the Third Symposium Simulation of Wing and Nacelle Stall, Braunschweig, Germany, 21–22 June 2012. [Google Scholar]
  16. Rumsey, C.L.; Sanetrik, M.D.; Biedron, R.T.; Melson, N.D.; Parlette, E.B. Efficiency and accuracy of time-accurate turbulent Navier-Stokes computations. Comput. Fluids 1996, 25, 217–236. [Google Scholar] [CrossRef] [Green Version]
  17. Bhamidipati, K.K.; Reasor, D.A.; Pasiliao, C.L. Unstructured Grid Simulations of Transonic Shockwave-Boundary Layer Interaction-Induced Oscillations. In Proceedings of the 22nd AIAA Computational Fluid Dynamics Conference, Reston, VA, USA, 22–26 June 2015. [Google Scholar]
  18. Giannelis, N.F.; Levinski, O.; Vio, G.A. Influence of Mach number and angle of attack on the two-dimensional transonic buffet phenomenon. Aerosp. Sci. Technol. 2018, 78, 89–101. [Google Scholar] [CrossRef]
  19. Giannelis, N.F.; Levinski, O.; Vio, G.A. Origins of atypical shock buffet motions on a supercritical aerofoil. Aerosp. Sci. Technol. 2020, 107, 106304. [Google Scholar] [CrossRef]
  20. Menter, F.R. Two-equation eddy-viscosity turbulence models for engineering applications. AIAA J. 1994, 32, 1598–1605. [Google Scholar] [CrossRef] [Green Version]
  21. Caruana, D.; Mignosi, A.; Robitaillié, C.; Corrège, M. Separated Flow and Buffeting Control. Flow Turbul. Combust. (Former. Appl. Sci. Res.) 2003, 71, 221–245. [Google Scholar] [CrossRef]
  22. Caruana, D.; Mignosi, A.; Corrège, M.; Le Pourhiet, A.; Rodde, A.M. “Buffet and buffeting control in transonic flow. Aerosp. Sci. Technol. 2005, 9, 605–616. [Google Scholar] [CrossRef]
  23. Gao, C.; Zhang, W.; Ye, Z. Numerical study on closed-loop control of transonic buffet suppression by trailing edge flap. Comput. Fluids 2016, 132, 32–45. [Google Scholar] [CrossRef]
  24. Dandois, J.; Lepage, A.; Dor, J.-B.; Molton, P.; Ternoy, F.; Geeraert, A.; Brunet, V.; Coustols, É. Open and Closed-Loop Control of Transonic Buffet on 3D Turbulent Wings Using Fluidic Devices. Comptes Rendus Mec. 2014, 342, 425–436. [Google Scholar] [CrossRef]
  25. Tian, Y.; Li, Z.; Liu, P.Q. “Upper Trailing-Edge Flap for Transonic Buffet Control. J. Aircr. 2018, 55, 382–389. [Google Scholar] [CrossRef]
  26. Smith, A.N.; Babinsky, H.; Fulker, J.L.; Ashill, P.R. Normal Shock Wave-Turbulent Boundary-Layer Interactions in the Presence of Streamwise Slots and Grooves. Aeronaut. J. 2002, 106, 493–500. [Google Scholar] [CrossRef]
  27. Holden, H.A.; Babinsky, H. Separated Shock-Boundary-Layer Interaction Control Using Streamwise Slots. J. Aircr. 2005, 42, 166–171. [Google Scholar] [CrossRef]
  28. Eastwood, J.P.; Jarrett, J.P. Toward Designing with Three-Dimensional Bumps for Lift/Drag Improvement and Buffet Alleviation. AIAA J. 2012, 50, 2882–2898. [Google Scholar] [CrossRef]
  29. Mayer, R.; Lutz, T.; Krämer, E. Numerical Study on the Ability of Shock Control Bumps for Buffet Control. AIAA J. 2018, 56, 1978–1987. [Google Scholar] [CrossRef]
  30. Holden, H.; Babinsky, H. Effect of Microvortex Generators on Seperated Normal Shock/Boundary Layer Interactions. J. Aircr. 2007, 44, 170–174. [Google Scholar] [CrossRef]
  31. Rybalko, M.; Babinsky, H.; Loth, E. Vortex Generators for a Normal Shock/Boundary Layer Interaction with a Downstream Diffuser. J. Propuls. Power 2012, 28, 71–82. [Google Scholar] [CrossRef]
  32. Ashill, P.R.; Fulker, J.L.; Shires, J.L. A Novel Technique for Controlling Shock Strength of Laminar-Flow Airfoil Sections. In Proceedings of the 1st European Forum on Laminar Flow Technology, Hamburg, Germany, 16–18 March 1992; pp. 175–183. [Google Scholar]
  33. Birkemeyer, J.; Rosemann, H.; Stanewsky, E. Shock control on a swept wing. Aerosp. Sci. Technol. 2000, 4, 147–156. [Google Scholar] [CrossRef]
  34. Stanewsky, E.; Délery, J.; Fulker, J.; De Matteis, P. Synopsis of the Project EUROSHOCK II. Notes on Numerical Fluid Mechanics and Multidisciplinary Design: Drag Reduction by Shock and Boundary Layer Control-Results of the Project EUROSHOCK II; Springer: Berlin/Heidelberg, Germany, 2002. [Google Scholar]
  35. Qin, N.; Zhu, Y.; Shaw, S. Numerical study of active shock control for transonic aerodynamics. Int. J. Numer. Methods Heat Fluid Flow 2004, 14, 444–466. [Google Scholar] [CrossRef]
  36. Qin, N.; Wong, W.S.; Le Moigne, A. Three-Dimensional Contour Bumps for Transonic Wing Drag Reduction. Proc. Inst. Mech. Eng. Part G J. Aerosp. Eng. 2008, 222, 619–629. [Google Scholar] [CrossRef]
  37. Tian, Y.; Gao, S.; Liu, P.; Wang, J. Transonic buffet control research with two types of shock control bump based on RAE2822 airfoil. Chin. J. Aeronaut. 2017, 30, 1681–1696. [Google Scholar] [CrossRef]
  38. Geoghegan, J.A.; Giannelis, N.F.; Vio, G.A. A Numerical Investigation of the Geometric Parametrisation of Shock Control Bumps for Transonic Shock Oscillation Control. Fluids 2020, 5, 46. [Google Scholar] [CrossRef] [Green Version]
  39. Mayer, R.; Lutz, T.; Krämer, E.; Dandois, J. Control of Transonic Buffet by Shock Control Bumps on Wing-Body Configuration. J. Aircr. 2019, 56, 556–568. [Google Scholar] [CrossRef]
  40. Jacquin, L.; Molton, P.; Deck, S.; Maury, B.; Soulevant, D. Experimental Study of Shock Oscillation over a Transonic Supercritical Profile. AIAA J. 2009, 47, 1985–1994. [Google Scholar] [CrossRef]
  41. Grossi, F.; Braza, M.; Hoarau, Y. Prediction of Transonic Buffet by Delayed Detached-Eddy Simulation. AIAA J. 2014, 52, 2300–2312. [Google Scholar] [CrossRef] [Green Version]
  42. Huang, J.B.; Xiao, Z.X.; Liu, J.; Fu, S. Simulation of shock wave buffet and its suppression on an OAT15A supercritical airfoil by IDDES. Sci. China Ser. G Physics Mech. Astron. 2012, 55, 260–271. [Google Scholar] [CrossRef]
  43. Fukushima, Y.; Kawai, S. Wall-Modeled Large-Eddy Simulation of Transonic Airfoil Buffet at High Reynolds Number. AIAA J. 2018, 56, 2372–2388. [Google Scholar] [CrossRef]
  44. Deng, F.; Qin, N. Quantitative comparison of 2D and 3D shock control bumps for drag reduction on transonic wings. Proc. Inst. Mech. Eng. Part G J. Aerosp. Eng. 2019, 233, 2344–2359. [Google Scholar] [CrossRef]
  45. Geoghegan, J.A.; Giannelis, N.F.; Vio, G.A. Parametric Study of Active Shock Control Bumps for Transonic Shock Buffet Alleviation. In Proceedings of the AIAA Scitech 2020 Forum, Orlando, FL, USA, 6–10 January 2020; pp. 1–16. [Google Scholar]
  46. Sclafani, A.J.; DeHaan, M.A.; Vassberg, J.C.; Rumsey, C.L.; Pulliam, T.H. Drag Prediction for the Common Research Model Using CFL3D and OVERFLOW. J. Aircr. 2014, 51, 1101–1117. [Google Scholar] [CrossRef]
  47. Vos, R.; Farokhi, S. Introduction to Transonic Aerodynamics; Springer: Dordrecht, The Netherlands, 2015. [Google Scholar]
Figure 1. The definition of trailing-edge flap relative to the OAT15A airfoil.
Aerospace 09 00657 g001
Figure 2. The definition of shock control bump relative to the OAT15A airfoil.
Aerospace 09 00657 g002
Figure 3. Computational grid. (a) Near wall grid. (b) Far-field grid.
Aerospace 09 00657 g003
Figure 4. Comparison of mean and RMS pressure between the calculated results and observed in the experiments of [40] and numerical studies of [8,18,41,42,43]. Figures created by the authors using the data from the aforementioned publications. (a) Mean pressure coefficient. (b) RMS pressure coefficient.
Aerospace 09 00657 g004
Figure 5. Lift coefficient responses with three different gains at Δ τ = 0 . (a) CL with control on. (b) CL near control start.
Aerospace 09 00657 g005
Figure 6. Comparison of phase graph of C L vs. β with different Δ t under kT = 0.01.
Aerospace 09 00657 g006
Figure 7. Comparison of aerodynamic force distributions between the flows with and without flap control. (a) Pressure coefficient. (b) x-component of skin-friction coefficient.
Aerospace 09 00657 g007
Figure 8. Aerodynamic performances of different configurations. (a) Drag polar. (b) Lift coefficient vs. angle of attack.
Aerospace 09 00657 g008
Figure 9. Time-histories of C L and PSD C L for different configurations at the buffet condition. (a) Lift coefficient. (b) Power spectral density.
Aerospace 09 00657 g009
Figure 10. Mean and unsteady characteristics of different configurations. (a) Mean Cp. (b) RMS Cp.
Aerospace 09 00657 g010
Figure 11. Comparison of the responses with different configurations under kT = 0.02 and Δ t = 28 36 T 0 . (a) Lift coefficient. (b) Flap deflection angle.
Aerospace 09 00657 g011
Figure 12. Diagram of time phase in one period when flap control on.
Aerospace 09 00657 g012
Figure 13. Instantaneous Mach number contours in different time phrases of flap control. (a) Basline configuration. (b) Bump 2 configuration.
Aerospace 09 00657 g013
Figure 14. Comparison of C p and C f x distributions in steady state for different configurations. (a) Pressure coefficient. (b) x-component of skin friction coefficient.
Aerospace 09 00657 g014
Figure 15. Mach number contours and streamlines in steady state for different configurations. (a) Original. (b) Bump 1. (c) Bump 2.
Aerospace 09 00657 g015
Figure 16. Combinations of control parameters for an effective buffet control.
Aerospace 09 00657 g016
Table 1. The details of the computational grids.
GridAirfoil NodesFirst Layer y m a x + Cell Count
L14171.5 × 10−60.7555,000
L25171.2 × 10−60.7083,000
L36471.0 × 10−60.50106,000
Table 2. The computed buffet characteristics using different levels of grid.
Grid Δ C L Mean   C L f s b   ( Hz )
L10.0500.89676
L20.1660.88175
L30.1590.88275
Experiment [40]0.220-69
Table 3. Optimized bump parameters.
Parameterxrhb/clb/c
Bump 10.520.0030.4
Bump 20.580.0060.4
Table 4. Aerodynamic performances of different configurations with and without the closed-loop flap control.
Shape Mean   C L C L Mean   C D C D Mean   L / D   L / D  
Flap controlOff OnOffOnOffOn
Original0.8810.8830.03950.038922.322.7
Bump 10.9030.9010.03930.038823.023.2
Bump 20.9300.9300.03960.039223.523.7
Table 5. Changes of aerodynamic coefficients for different configurations with and without the closed-loop flap control.
Force CoefficientOriginalBump 1Bump 2
Flap controlOffOnOffOnOffOn
CL-+0.0020+0.0120−0.0020+0.0490−0.0000
CD-−0.0006−0.0002−0.0005+0.0001−0.0004
Publisher’s Note: MDPI stays neutral with regard to jurisdictional claims in published maps and institutional affiliations.

