Article

Numerical and Experimental Study on Jet Trajectory and Fuel Concentration Distribution Characteristics of Kerosene Jet in Air Crossflow

School of Energy and Power Engineering, Beihang University, Beijing 100191, China
*
Author to whom correspondence should be addressed.
Aerospace 2022, 9(11), 637; https://doi.org/10.3390/aerospace9110637
Submission received: 20 September 2022 / Accepted: 21 October 2022 / Published: 23 October 2022

Abstract

:
The fuel concentration distribution in an afterburner is a critical factor that affects its ignition, flameout, stability, and combustion efficiency. Additionally, the trajectory of the fuel jet directly affects the distribution of the downstream fuel. Hence, this paper studied the factors that affect a jet’s trajectory and fuel concentration distribution through numerical calculations. The change law of the fuel jet trajectory under various parameters was studied, and the jet penetration depth change rate was analyzed. Moreover, the empirical formula of the spanwise distribution range of the liquid fuel in front of the stabilizer was fitted. Furthermore, this study investigated fuel concentration distribution experimentally in the afterburner under normal temperature and pressure. The paper obtained the variation law of fuel concentration in the spanwise and radial directions, and the proportion of the gaseous fuel in the flow section under the influence of different parameters. Additionally, the spatial distribution of the droplet concentration was obtained, revealing that it increased initially, and then decreased in the flow direction, reaching a peak at the end of the recirculation zone. In the radial direction, two concentration peaks were found in the boundary of the recirculation zone and in the main flow region.

1. Introduction

The performance of afterburners, ramjet combustors, and scramjet combustors depend largely on liquid jet injection, evaporation, and mixing [1,2,3,4,5]. With the development of a new generation of aero engines, the requirements for thrust-to-weight ratio are constantly improving, and the working conditions at the inlet of the afterburner are more severe. Therefore, it is fundamental to research the fuel jet trajectory and fuel concentration distribution characteristics of the direct fuel injector, and to explore the influence of different factors on the fuel distribution characteristics in the afterburner, in order to achieve complete combustion under increasingly harsh inlet conditions such as low pressure and high speed [6,7,8,9].
The crushing process of the transverse jet in high-speed air flow can be divided into initial crushing and secondary crushing [10,11,12,13,14,15]. When the liquid is ejected from the nozzle, a continuous liquid column is formed. Then, under the joint action of the aerodynamic force, i.e., liquid surface tension and liquid viscous force, liquid films are gradually formed on the liquid surface. The liquid film’s surface fluctuation gradually increases as the liquid progressively ejects. When the influence of the aerodynamic force exceeds the liquid’s surface tension, the liquid film breaks and becomes liquid filaments or droplets that separate from the surface of the liquid film, completing the breaking process. Chen [16] found that large droplets after the primary crushing were further broken under the influence of aerodynamic forces. Bag breaking occurs at a low Weber number, while shear breaking occurs at a high Weber number, breaking into fine droplets and mist. Chihiro [17] studied the atomization phenomenon of a coaxial direct-injection nozzle. He compared the effects of different gas flow rates on the atomization of liquid jets under fixed liquid flow rates, and found that when the gas flow rate was low, the atomization effect of the jet was poor, consistent with the linear stability analysis of two-dimensional flow. When the Weber number was large, the liquid atomization effect became better.
For a direct injection nozzle, the fuel injection and mixing are related to the combustion process, and play a crucial role in combustion stability. The penetration depth of the fuel jet is an essential parameter of the direct injection nozzle in the transverse jet, with most scholars investigating the outer boundary trajectory of the jet as the research object. For instance, Lin [18] defined the penetration depth as 90% of the laser penetration distance, and argued that the main factor affecting the penetration depth is the momentum ratio of the fuel jet to the transverse air jet. He also claimed that the greater the momentum ratio, the greater the fuel penetration depth. In addition, the penetration depth is also affected by the Weber number of the gas flow, and the physical parameters of the jet liquid. Stenzler et al. [19] studied the influence of the momentum ratio, Weber number, and liquid viscosity on spray penetration under the studied conditions. Masaki et al. [20] found that increasing the nozzle diameter increases the penetration depth, while increasing temperature decreases the penetration depth. Fuller et al. [21] studied the influence of injection angle on penetration depth, utilizing water as the working medium, and concluded that the penetration depth becomes smaller when the injection angle reduces. Kolpin [22] investigated fuel injection in uniform high-speed transverse flow, and found that using dual nozzles at a rake angle θ > 90 does not help to improve the penetration depth. Tambe et al. [23] studied the flow structure in the shear layer of a liquid column in a transverse jet using particle image velocimetry (PIV), and Olinger et al. [24] investigated the influence of air momentum ratio on jet penetration depth using optical technology.
Currently, the research on fuel concentration distribution is generally expressed by the fuel–air ratio in different sections, and is mainly based on experimental studies. For example, Chin [25] found that the concentration of gaseous fuel increased with temperature, while the concentration of liquid fuel presented the opposite trend. Cao et al. [26] studied the fuel distribution of the transverse jet of the direct injector under high speed and low temperature, and developed a semi-empirical calculation formula of the fuel distribution. Lovett et al. [27] studied the influence of the structure of bluff body stable flame and non-premixed transverse jet fuel distribution.
Spurred by the above research, this paper studied the fuel’s jet penetration depth and trajectory in the afterburner, and the fuel–air distribution behind the stabilizer under harsh inlet conditions, including high speed. The study in this paper was based on numerical simulations and experiments. The direct fuel injector was considered the research object, in order to study the influence of various parameters on the jet trajectory, the distribution of the liquid fuel concentration behind the stabilizer, and the empirical formula fitting of the spanwise distribution range LY of the liquid fuel. Subsequently, a fuel concentration distribution test bench was built to study the effects of various parameters on the fuel concentration distribution, by combining experimental and numerical simulations.

2. Materials and Methods

This chapter introduces the basic equations and theories used in numerical calculations, the geometric model of the numerical calculations, the mesh generation method, the mesh independence, and the method verification and calculation process.

2.1. Numerical Model

Comprehensively considering the calculation accuracy and computational cost, the three-dimensional Reynolds-averaged Navier–Stokes (RANS) equations were employed as the governing equations using the commercial CFD software, ANSYS Fluent 2020, in this paper. The RANS equations are defined as follows:
ρ t + x j ρ u j = S m  
t ρ u i + x j ρ u i u j = x j δ i j P + τ i j + F i + S u i  
t ( ρ h t P ) + x j ( ρ h t u j ) = x j ( q j + τ i j u i ) + u j F j + S h
t ρ Y m + x j ρ Y m u j + ρ Y m V j , m = S Y m + ω ˙ m  
Equations (1)–(4) are the continuity equation, momentum conservation equation, energy conservation equation, and species conservation equation, respectively. The shear stress tensor τ i j in Equation (2) can be expressed as follows:
τ i j = μ ( u i x j + u j x i 2 3 u k x k δ i j )
where δ i j is the Kronecker Delta function, and μ represents the dynamic viscosity coefficient, which can be calculated from a polynomial function of the temperature by the Sutherland formulation:
μ = μ 0 ( T T 0 ) 3 / 2 T 0 + S μ T + S μ
Here, T 0 = 273.15 K, and μ 0 is the reference viscosity coefficient. For air, μ 0 = 1.7161 × 10 5 N·s/m2, S μ = 124.0 K.
The total enthalpy h t in Equation (3) can be expressed as shown below:
h t = h + u i u j 2
and the heat flux vector q j can be expressed as follows:
q j = λ T x j + m = 1 N s ρ Y m V j . m h m
where λ is the thermal conductivity, Y m is the mass fraction of the components, and V j . m is the molecular diffusion rate.
The source terms S m , S u i , and S h , respectively, denote the changes in mass, momentum, and energy between the droplet and gas phases. The source term S Y m represents the change in mass of the components that are involved in the chemical reactions, while the source term ω ˙ m represents the generation rate of the chemical reactions.
The state equation of an ideal gas was finally added to solve the above RANS equations:
p = ρ T m = 1 N Y m R u M m
Here, R u = 8.314 J/(mol·K) is the universal gas constant, and M m is the molar mass of component m .

2.2. Numerical Set and Validation

The rectangular calculation domain was designed on the basis of the afterburner (Figure 1), where the channel size is 130 × 150 mm, the total length of the drainage basin is 800 mm; the fuel injection rod is arranged radially, and the V-shaped flame stabilizer is placed at the center of the experimental section. The X-axis, Z-axis, and Y-axis directions were defined as the flow direction, radial direction, and the spanwise direction, respectively. The origin of the coordinate system is at the center of the inlet section.
All numerical simulations were conducted using the pressure-based solver on the FLUENT platform, adapting the coupled solution method. The second-order upwind difference scheme was also used to discretize and solve the flow term and other governing equations. The realizable k-ε model was adopted as a turbulence model, where the inlet boundary condition was set as the velocity inlet, and the incoming flow velocity, temperature, static pressure, and other parameters were specified. Free flow export conditions were adopted for export, and the wall surface was set as an adiabatic sliding free boundary.
The ANSYS fluent meshing completed the mesh generation, and the poly-hexcore mesh generation method was adopted, in order to generate a hexahedral mesh and polyhedral mesh at the same time. The minimum mesh quality was higher than 0.5. The liquid film model based on Lagrange was adopted for the surface of the flame stabilizer, and the grid height near the wall was considered y + =1. The mesh was densified near the stabilizer, comprising a boundary layer mesh, transition polyhedron mesh, and hexahedron mesh. The maximum mesh size of the other parts was controlled at 2 mm. The mesh generation of the computing domain is illustrated in Figure 2.
The parameters studied in this paper could be divided into aerodynamic-thermodynamic parameters and structural parameters. The aerodynamic–thermodynamic parameters included inflow velocity, inflow temperature, and fuel supply pressure difference, and the structural parameters included nozzle diameter, mixing distance, and injection angle. The parameter variation ranges are shown in Table 1.
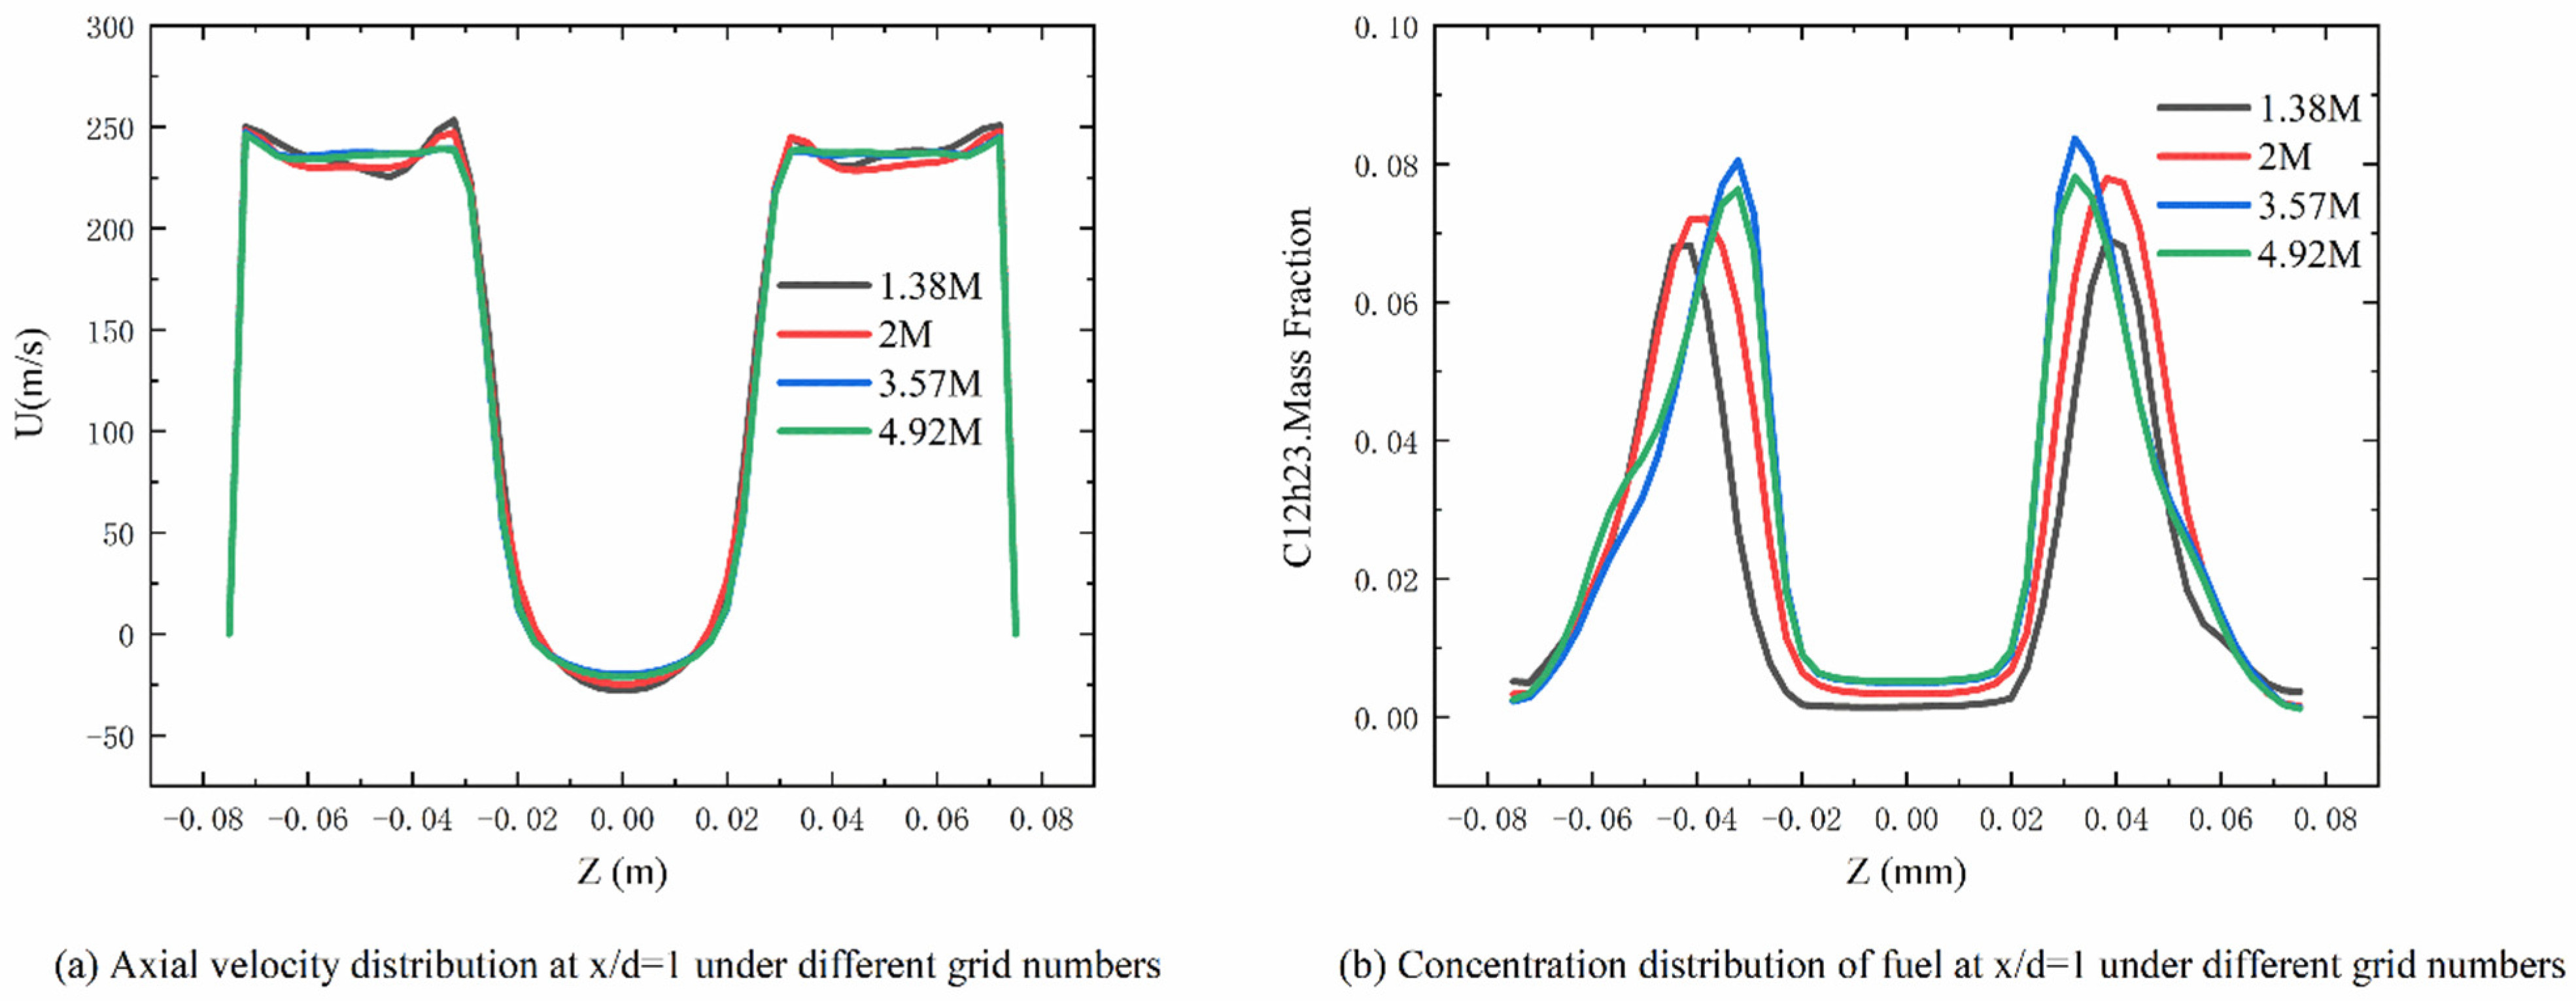
In order to ensure that the numerical simulation results were not affected by the number of grids, we selected the grids with 1.38 M, 2 M, 3.57 M, and 4.92 M for grid independence verification. In addition, during the verification process, the grid quality was ensured to be about 0.4, and the inflow velocity, inflow temperature, and inlet pressure were 172 m/s, 800 K, and 0.2 MPa, respectively. Additionally, the fuel injection direction was along the flow direction, and the fuel flow rate was 0.0039159 kg/s for a single hole. The mass fraction of the gaseous fuel and the size of the recirculation zone of the cross section at x/d = 1 downstream of the stabilizer were considered as the judgment parameters. The verification results are illustrated in Figure 3.
Figure 3a,b show that the number of grids has a minor influence on the flow field, with a grid number of about 1 M meeting the calculation requirements. For the discrete phase and grids of about 3 M, the calculation error of the simulation was about 2%, still meeting the calculation requirements. Therefore, the number of grids in this paper was set to 3.57 M.
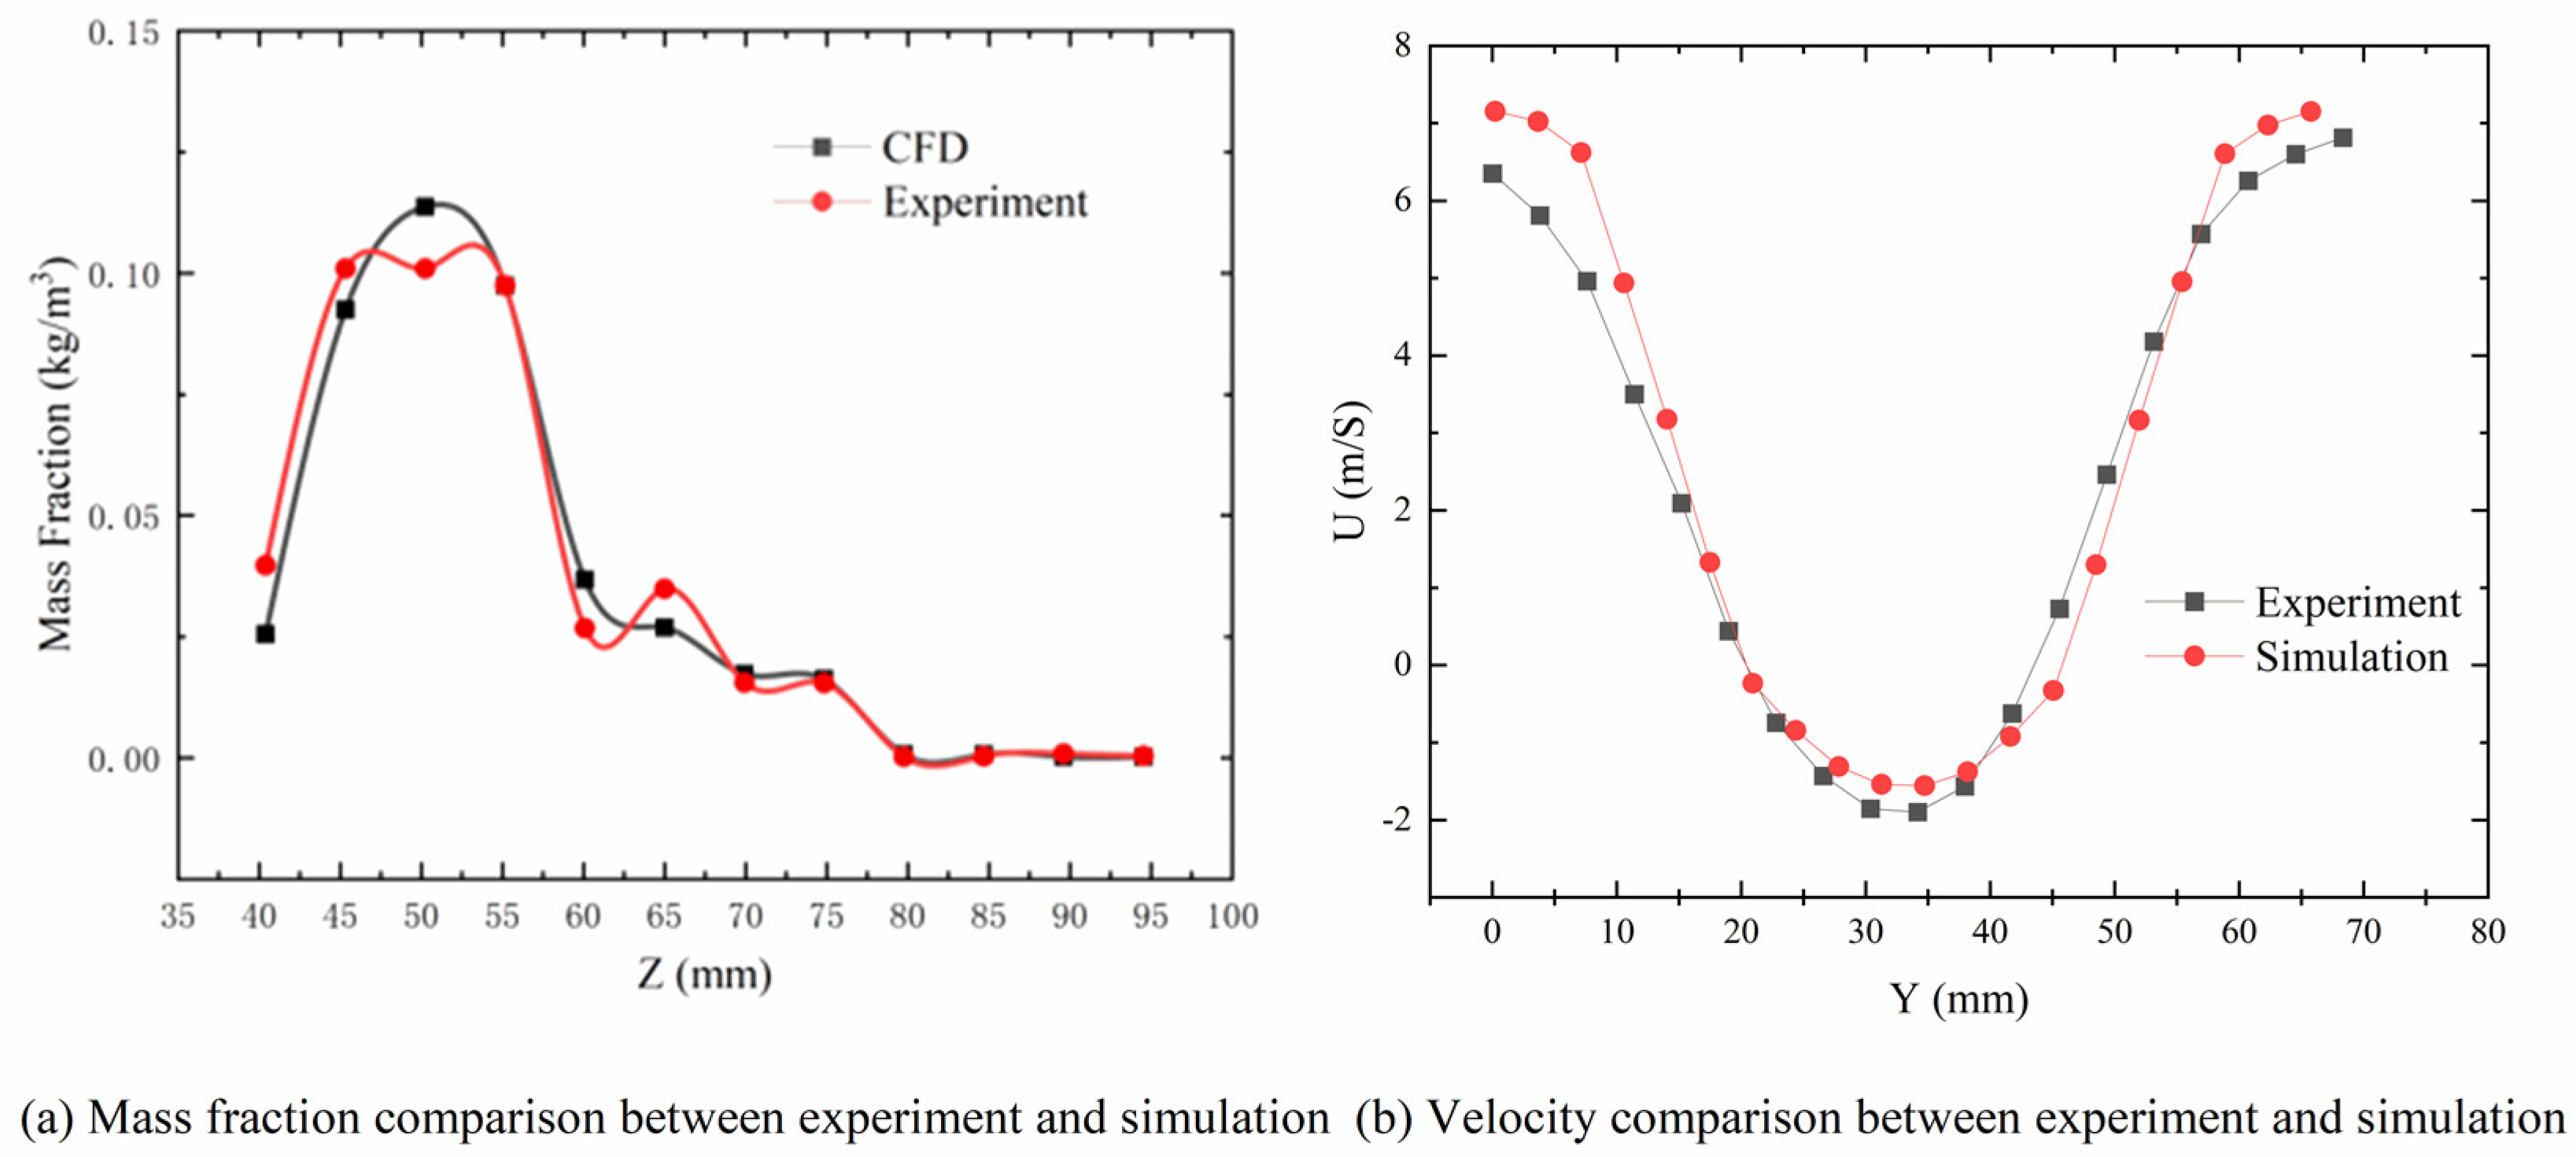
According to Gu [28], the discrete phase model was verified on the basis of the fuel concentration distribution measurement results in the flame stabilizer’s cross section. Specifically, Figure 4a compares the numerical simulation and the experimental results by Gu [28] of the corresponding geometric model, revealing their consistency. A slight difference between the numerical simulation and the experimental results was observed at the flame stabilizer’s trailing edge, while the fuel concentration distribution at the other locations was consistent. Considering the experimental accuracy limitations, the numerical simulation results are considered acceptable. Figure 4b is a comparison diagram of the radial velocity obtained by this paper’s experiment and by simulation at 37 mm behind the stabilizer. The figure shows that the experimental results were very close to the simulation results, indicating that the PIV results and simulation results in this paper are reliable.

2.3. Experimental Method

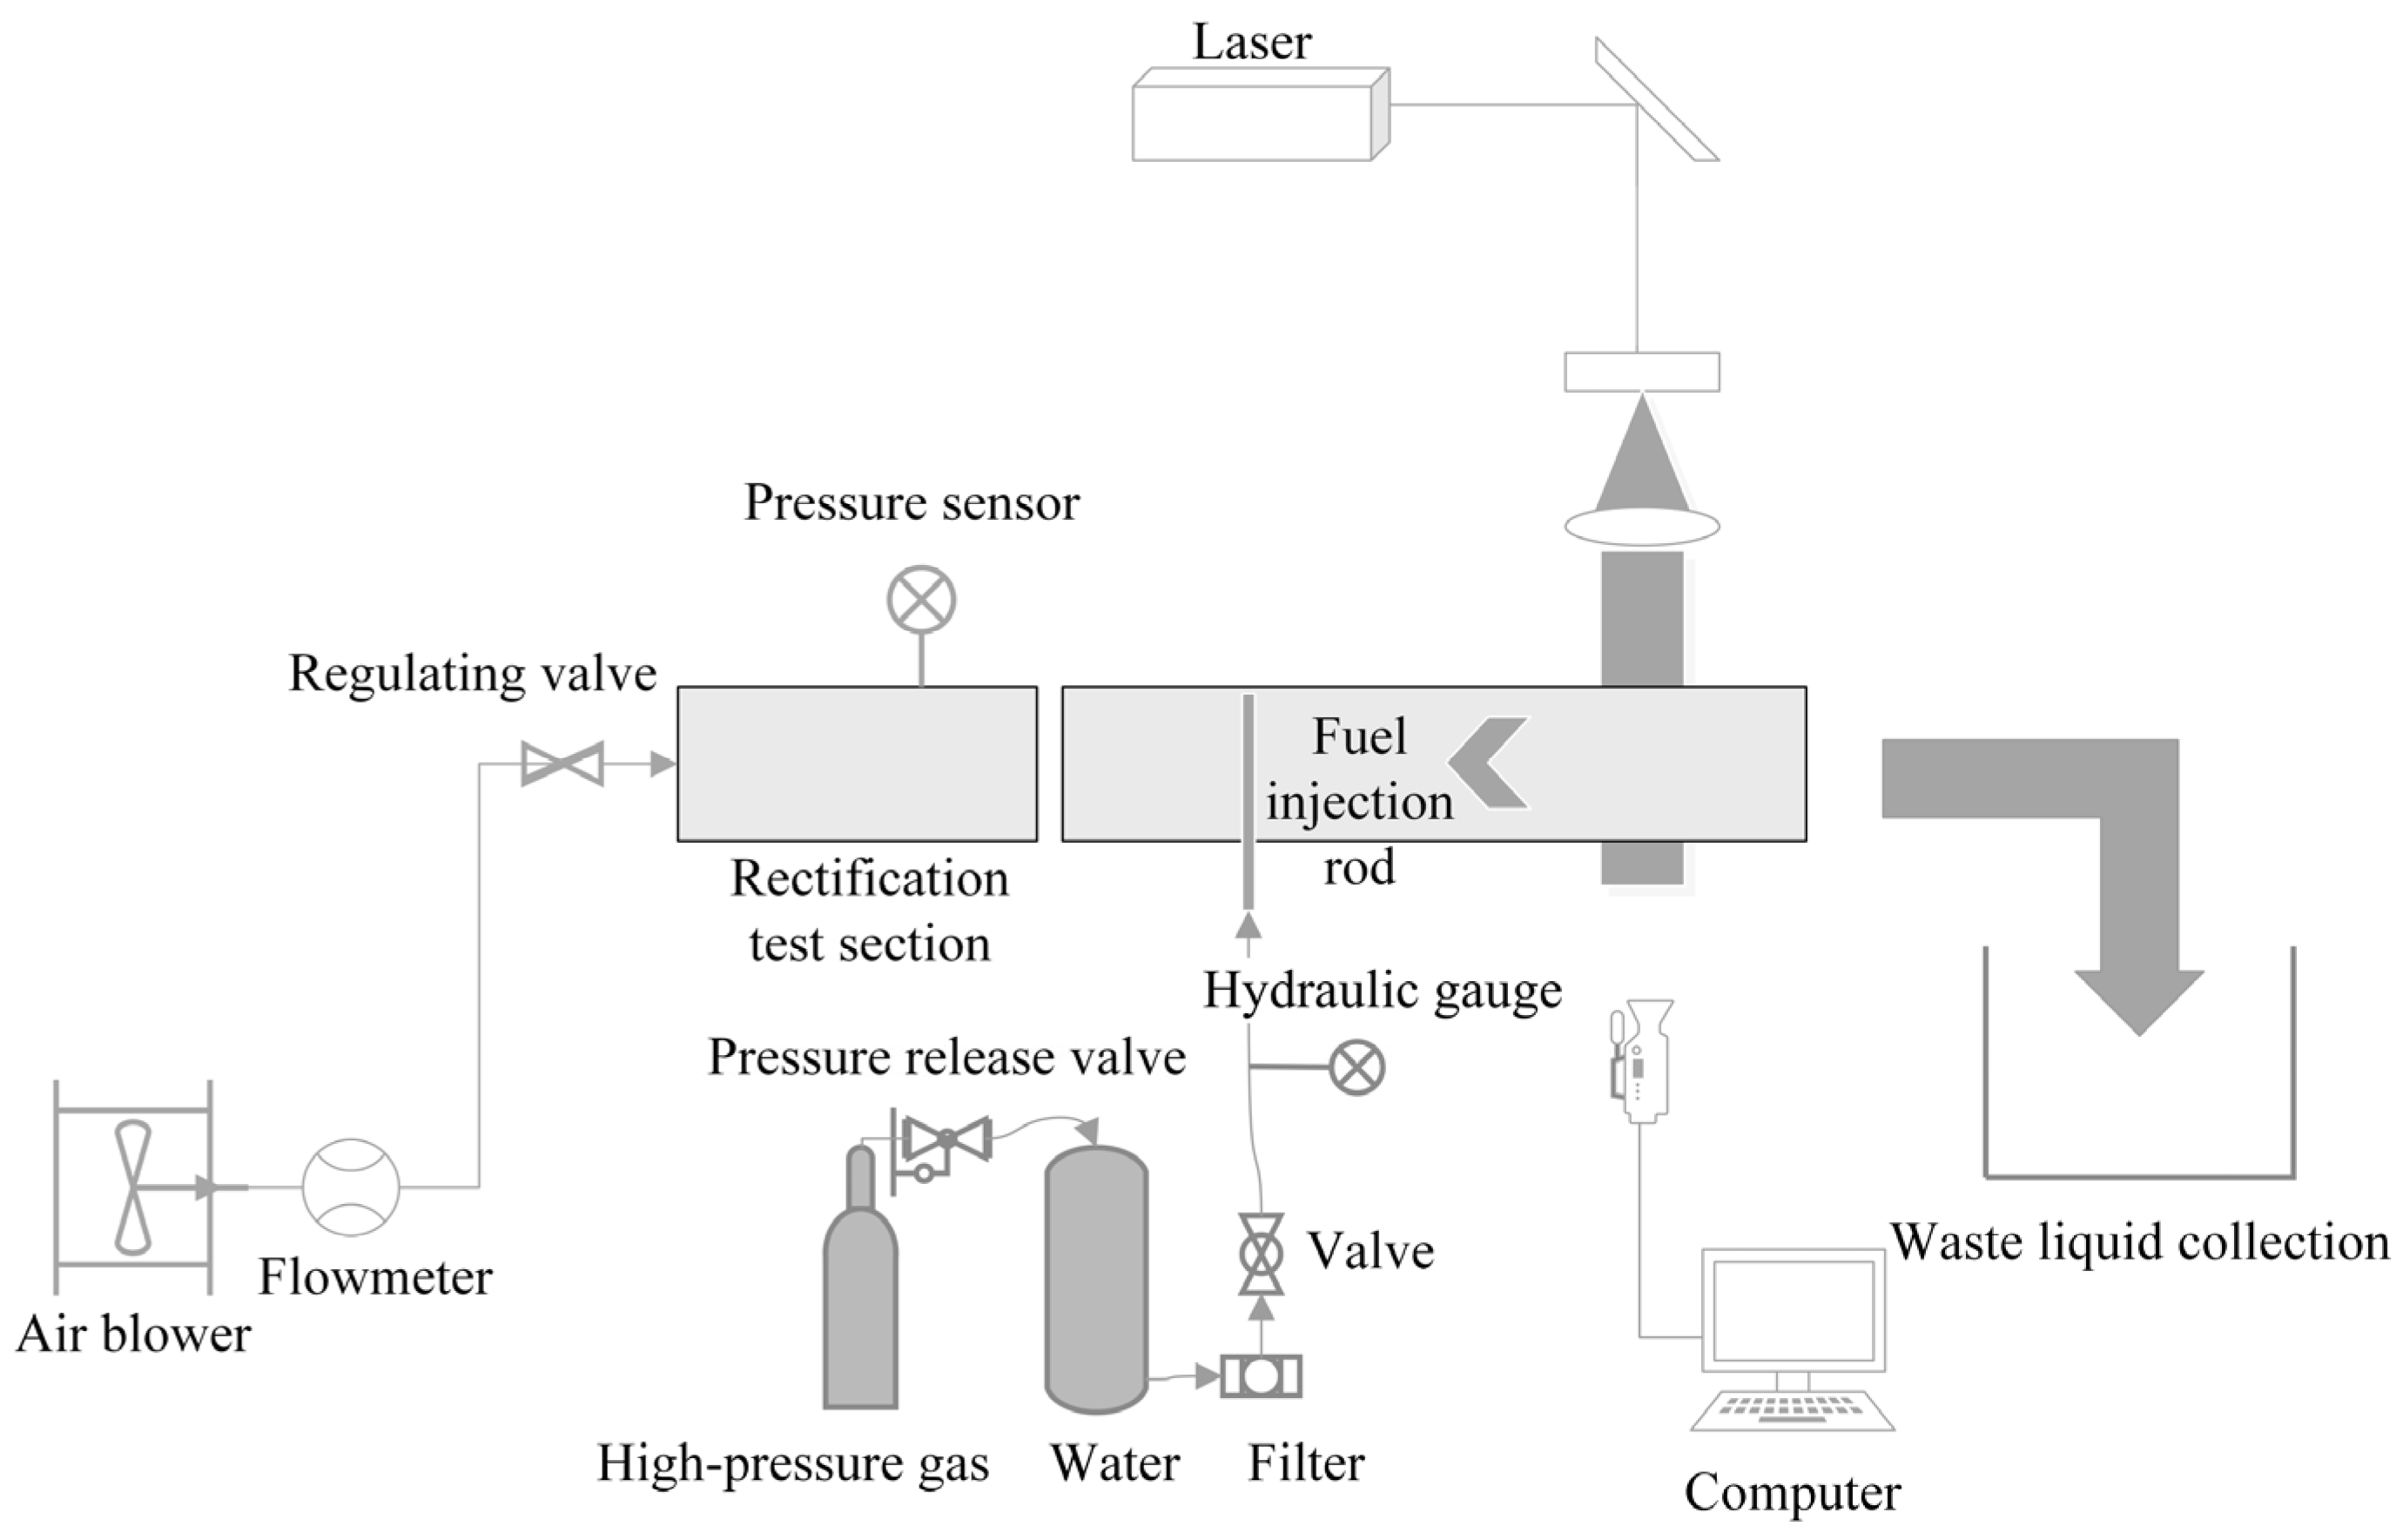
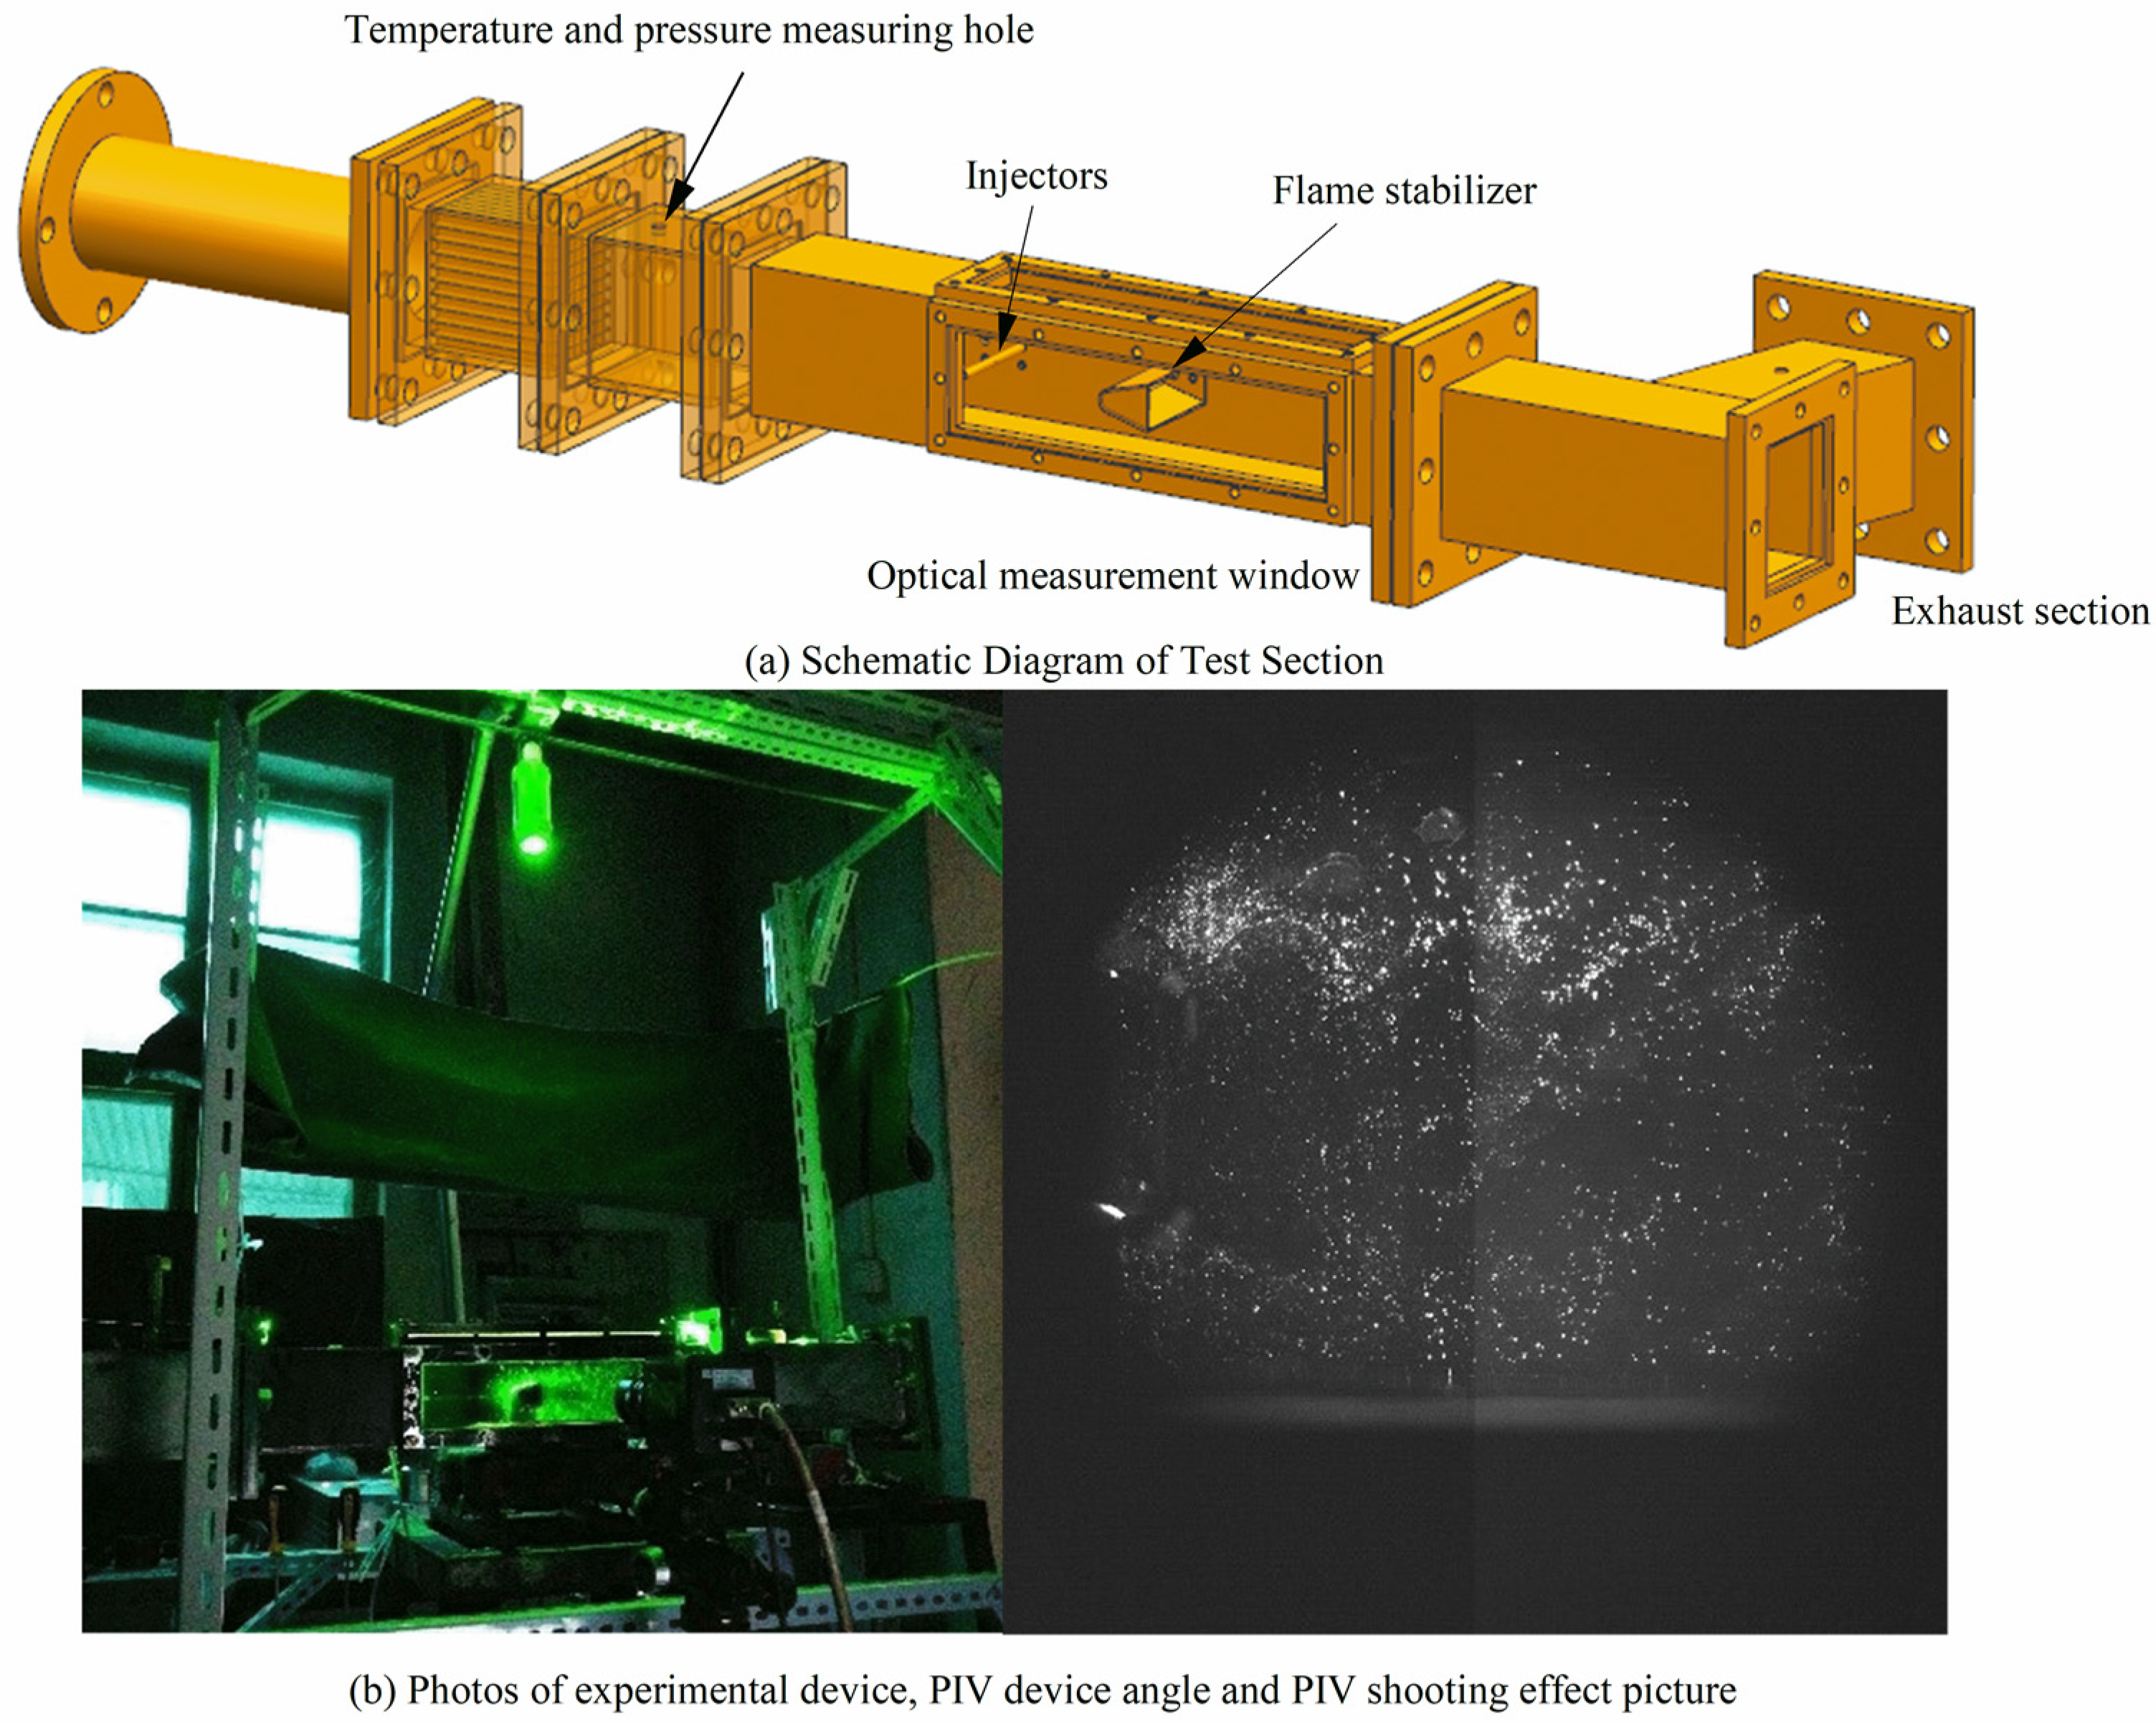
The experiment in this paper was conducted on the atomization platform of the afterburner, with the corresponding system diagram illustrated in Figure 5 and Figure 6. The experimental platform mainly included the air supply system, test section, measurement system, fuel supply system, and the optical test system.
The laser generator, synchronizer, and CCD camera in the particle image velocimetry (PIV) system were used to shoot the spanwise section of aviation kerosene that was injected into the air crossflow with high temperature and low pressure. The PIV system was produced by Dantec Dynamics. The laser was a 566 nm dual optical path laser with a maximum operating frequency of 15 Hz, a pulse interval of 0.5 μ s –50 ms, and a pulse width of 9 ns, which met the flow measurement requirements from low speed to high speed. The resolution of the CCD camera was 2048 × 2048. The CCD camera had very high light sensitivity. The fuel concentration field was characterized by small particles and weak reflection. The CCD camera captured the information of particles in the fuel concentration field.

3. Results and Discussion

3.1. Jet Trajectory

This paper studied the parameters that affected the jet’s trajectory, including the inflow velocity, inflow temperature, fuel supply pressure difference, nozzle diameter, and injection angle (Table 2). Considering the concept of controlling a single variable, we designed 20 working conditions that involved a variation range in the fuel–air momentum ratio (liquid–gas ratio) in the range of 19–74, and the variation range of Weber number within 149–587.
The calculation formulas of the fuel–air momentum ratio q (liquid–gas momentum ratio) and air Weber number are as follows:
q = ρ j v j 2 ρ a v a 2
W e = ρ a v a 2 d σ

3.1.1. Influence of Inflow Temperature and Fuel Supply Pressure Difference

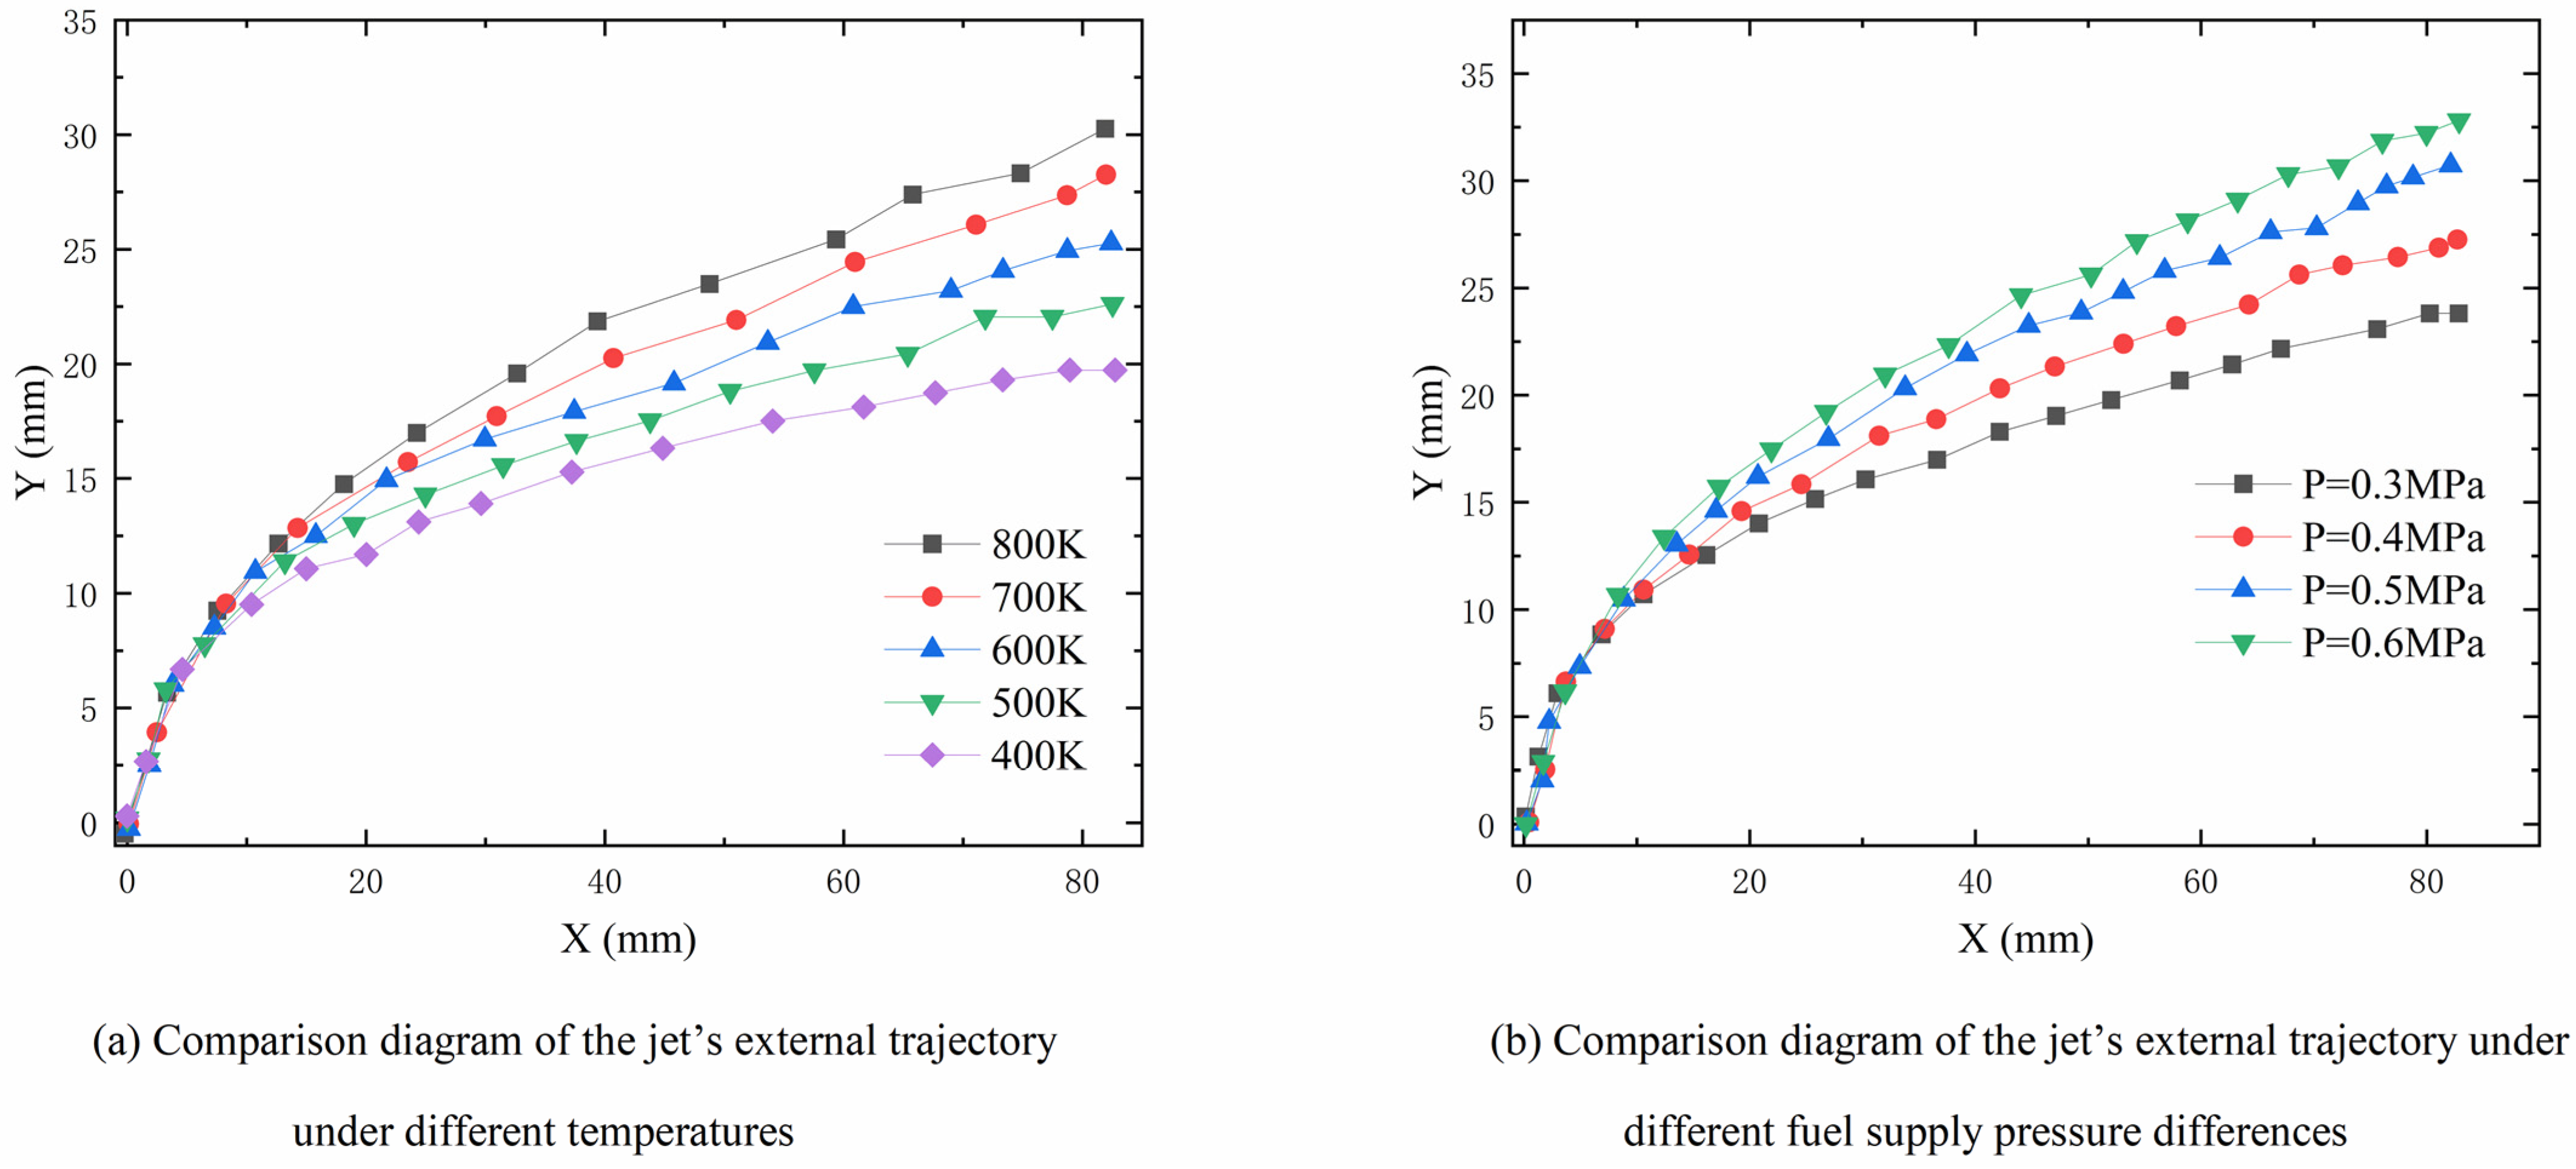
A different incoming temperature corresponds to a different air density, and the change in the air density affects the momentum ratio of liquid to gas. When the other conditions are unchanged, the influence of the incoming flow temperature on the jet trajectory is depicted in Figure 7a. The figure considers temperatures of 400 K, 500 K, 600 K, 700 K, and 800 K, with the corresponding fuel–air momentum ratios being 19, 23, 28, and 33, respectively. This figure highlights that as the temperature increases, the outer boundary of the jet trajectory gradually increases. At X = 8 mm away from the nozzle downstream, the outer boundary of the jet under different temperatures begins to change. As the downstream distance increases, the difference in the outer boundary of the jet trajectory under different temperatures becomes larger. This is because when the fuel is just ejected from the injection hole, the fuel exists in the form of a liquid column, and the surface tension of the liquid column has a solid ability to resist the aerodynamic force; thus, the action time of the inflow on the liquid column is short. The liquid column is slightly bent, and the influence of the temperature on the jet of the liquid column is small. Once the liquid column is broken, it converts into liquid film and is further broken into liquid filaments and large droplets, under the action of aerodynamic force. At this time, the ability of the surface tension of the liquid filament and the liquid droplet to resist the aerodynamic force is weak, and the aerodynamic force is dominant. Therefore, the influence of the inflow conditions on the jet becomes more extensive, and the influence of the temperature gradually becomes prominent.
The fuel supply pressure difference directly affects the fuel outlet’s quality and, thus, the liquid gas momentum ratio. The jet’s external trajectory under different fuel supply pressure differences is illustrated in Figure 7b, which highlights that as the fuel supply pressure difference increases, the penetration depth of the fuel jet increases, and the changing trend slows down. Additionally, Table 2 indicates that when the fuel supply pressure difference was 0.3–0.6 MPa, the corresponding liquid gas momentum ratios were 22.64, 30.18, 38, and 45.28, and the Weber number was 293, inferring that the liquid gas momentum ratio had a significant impact when changing the fuel supply pressure difference. Under certain conditions, the fuel flow rate positively related to the square of the fuel supply pressure difference. According to the results of previous research, the penetration depth of the jet was positively associated with the square of the liquid gas momentum ratio when the other parameters were consistent. Therefore, as the fuel supply pressure difference increased, the increase in the jet penetration depth became slower.

3.1.2. Influence of Inflow Velocities and Injection Angles

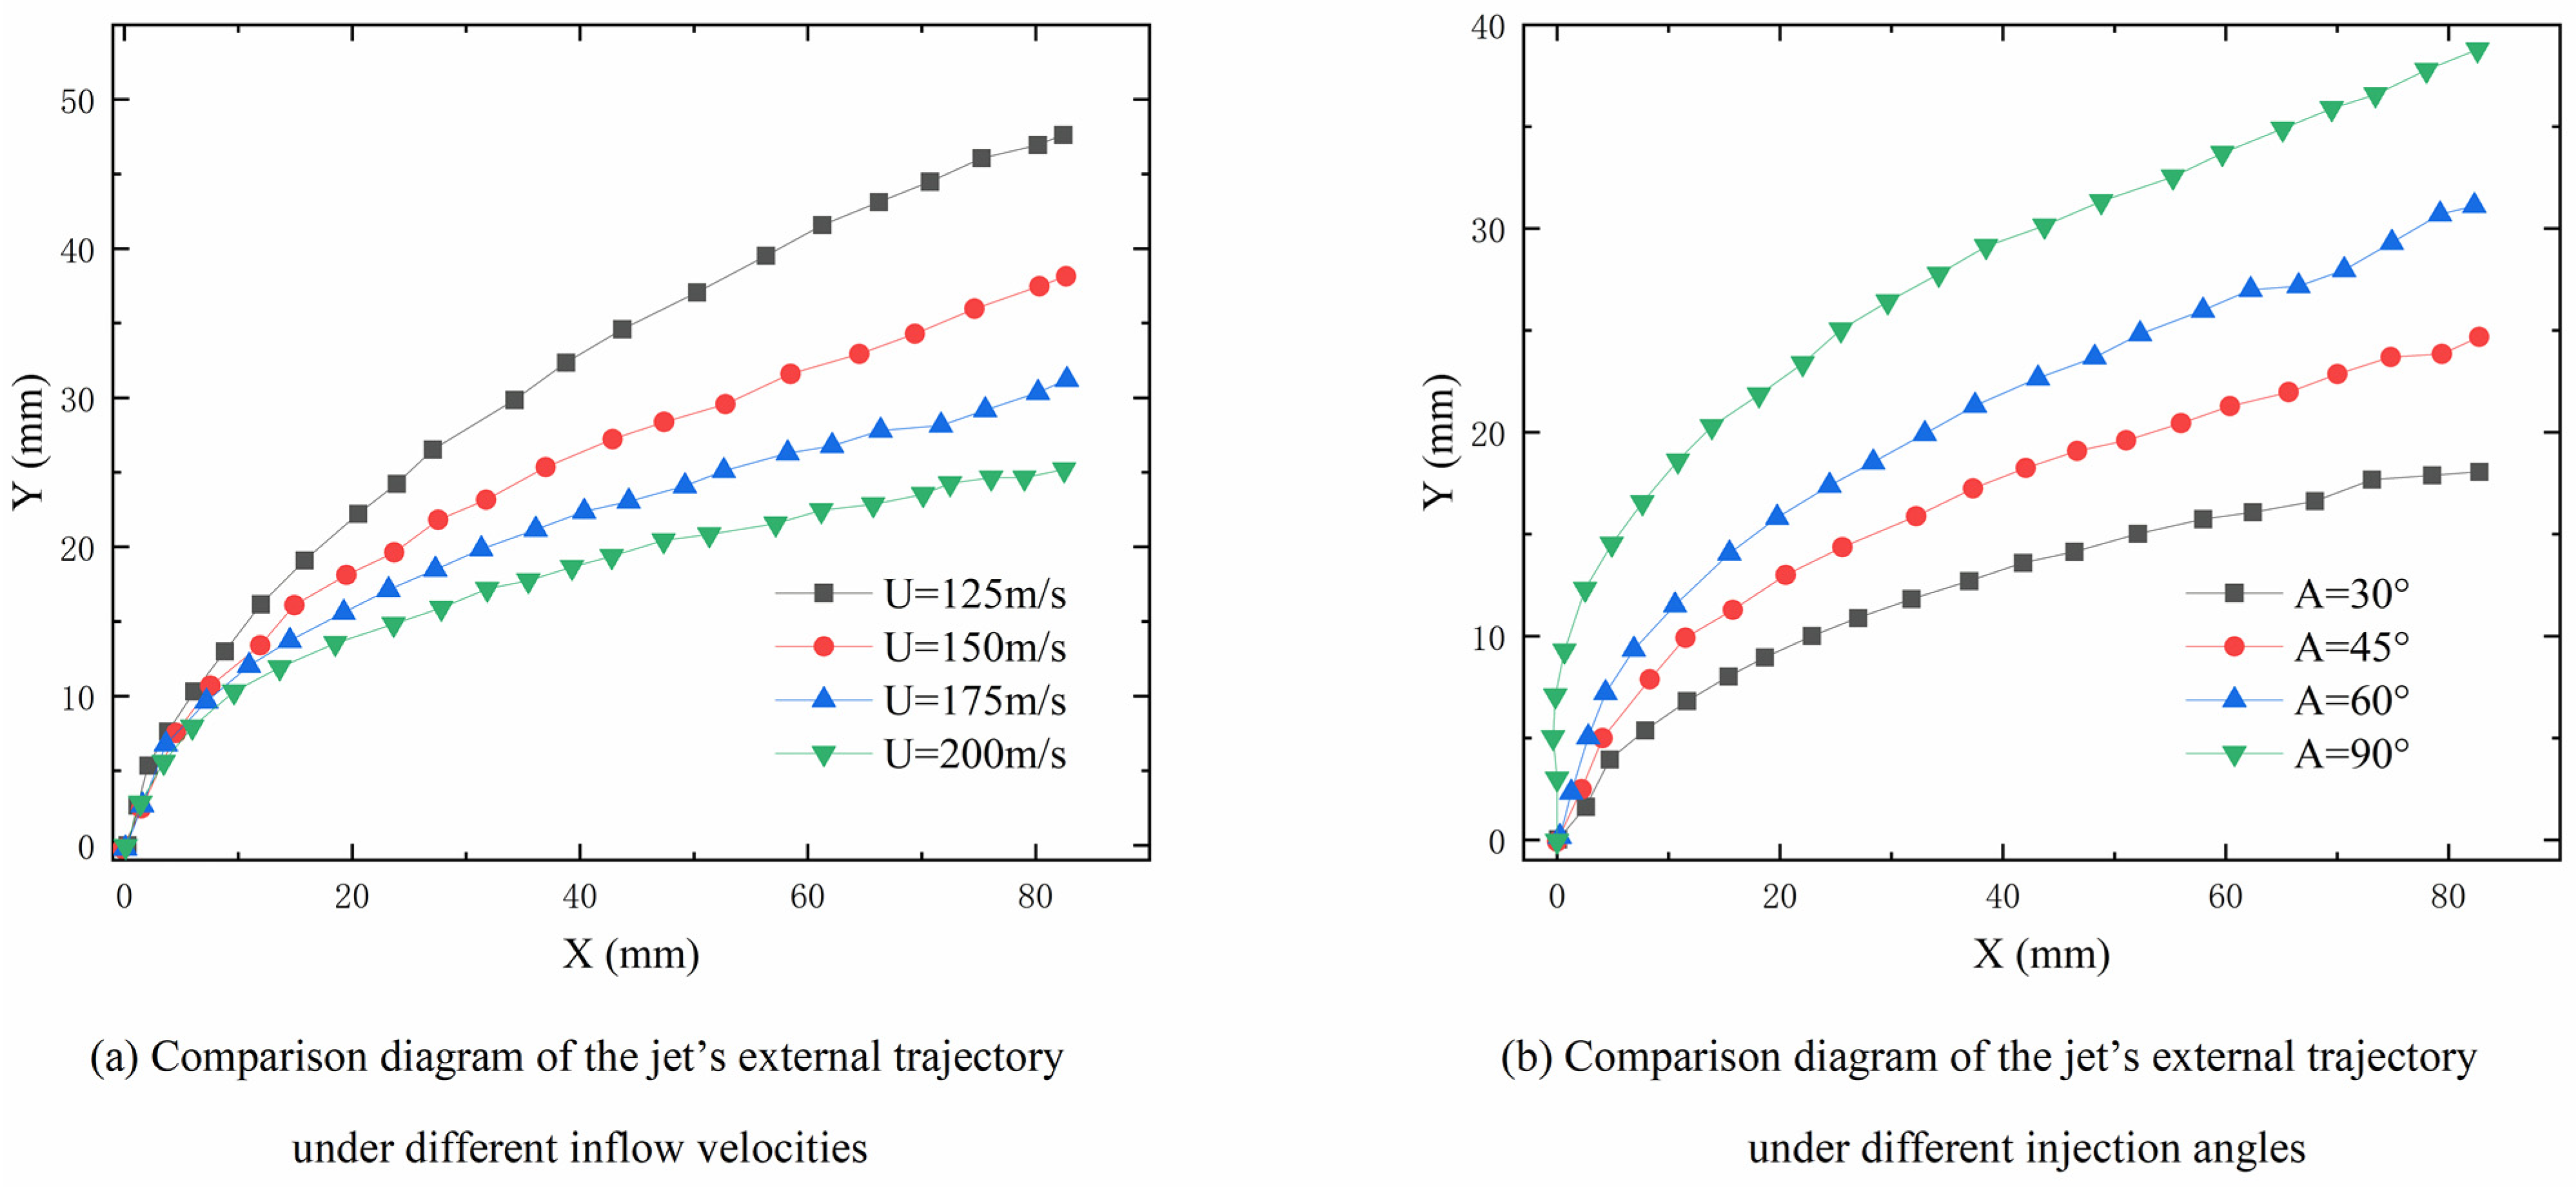
When other parameters are constant, the velocity change of the inflow air directly affected the air flow rate, thus affecting the momentum ratio of liquid to gas. The comparison diagram of the external trajectory of the jet at different inflow velocities is depicted in Figure 8, involving inflow velocities of 125 m/s, 150 m/s, 175 m/s, and 200 m/s. The corresponding liquid gas momentum ratios are 74.5, 51.7, 38, and 29, and the Weber numbers are 149, 215, 293, and 383, respectively. Figure 8a reveals that with a linear velocity increase, the momentum ratio of liquid to gas gradually decreased, but the decreasing range slowed down. At the same time, the gas Weber number increased, and the increased range became larger. Moreover, the aerodynamic force increased. Under the double influence of the liquid gas momentum ratio and the gas Weber number, the fuel jet’s penetration depth decreased gradually with the inflow air velocity. However, the range of decrease became slower.
Figure 8b highlights that when the injection angle is smaller than 90°, the penetration depth of the fuel jet increases gradually with the increase in the injection angle. This is because when the injection angle was small, the partial velocity along the Y direction gradually increased as the angle increased, and the momentum ratio along the Y direction gradually increased.

3.1.3. Influence of Nozzle Diameters

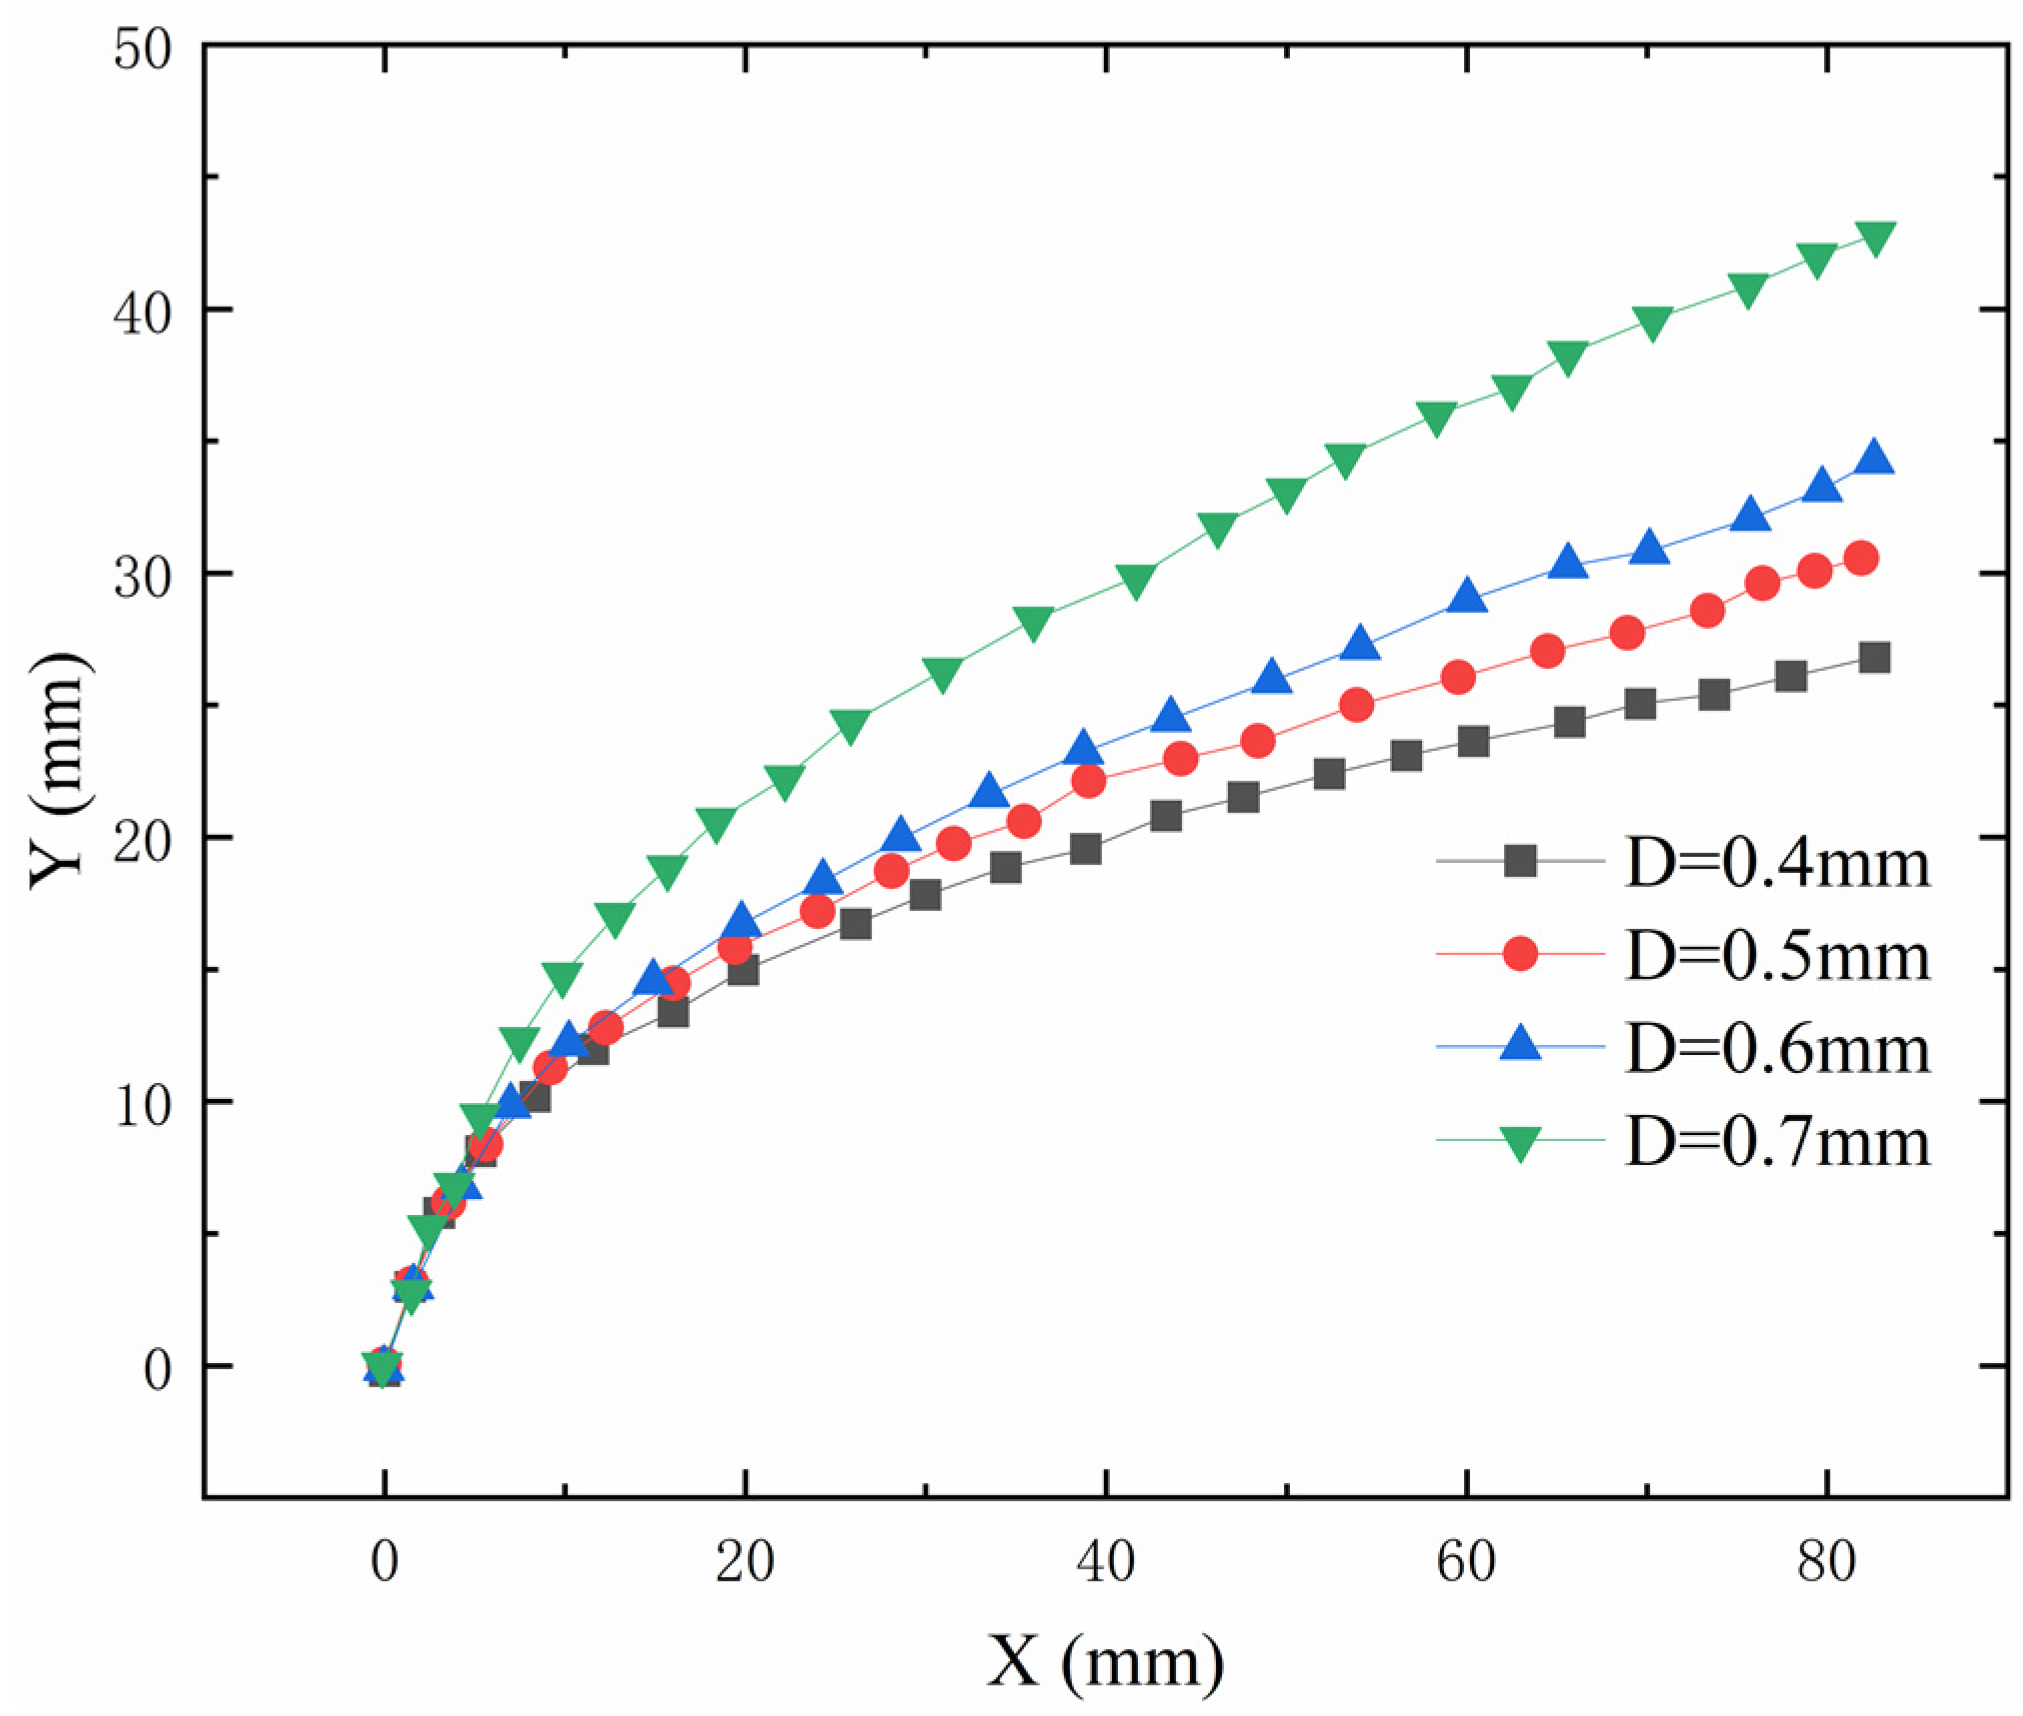
Figure 9 illustrates the external trajectory jet when the nozzle diameter is 0.4 mm, 0.5 mm, and 0.6 mm, revealing that the jet’s penetration depth gradually increased as the nozzle diameter increased. Moreover, Table 2 infers that changing the nozzle diameter did not affect the liquid gas momentum ratio and gas Weber number. Under certain conditions of other parameters, with an increase in nozzle diameter, the nozzle’s outlet flow, the volume and mass of the liquid column and the jet micro-element become larger, increasing the jet’s total momentum per unit time and inertial force. Under the same aerodynamic force, when the nozzle diameter is larger, the liquid jet is less likely to be accelerated and bent by the aerodynamic force. Hence, the penetration depth of the jet becomes larger.

3.1.4. Spanwise Distribution Fitting of Fuel

In order to further analyze the distribution law of the liquid fuel concentration in front of the stabilizer, we fitted the empirical formula of the spanwise distribution range LY of the liquid fuel in the stabilizer, employing the parameters that affected the jet’s penetration depth. The physical parameters that affected the jet’s penetration depth were the inflow velocity V, the inflow temperature T, the fuel supply pressure difference P, the nozzle diameter D, and the injection angle θ. Here, the injection angle varied from 0 to 90°. From the empirical formula of the fuel jet’s penetration depth, we observed that the latter depth was related to the exponential product of the inflow velocity, fuel supply pressure difference, and nozzle diameter. According to the above analysis, the spanwise distribution range of the fuel in the front edge of the stabilizer was positively related to the jet’s penetration depth.
Thus, dimensionless treatment was performed for the relevant factors to obtain the spanwise distribution range of liquid fuel LY.
L Y D 0 = C · ( V V 0 ) α · ( P P 0 ) β · ( T T 0 ) γ · ( D D 0 ) φ · sin θ ι
where the values of D0, V0, P0, and T0 have an important influence on fitting the determined coefficient, which was obtained by nonlinear fitting using the least square method. The fitting results of different coefficients are as follows:
L Y = C · V 1.90202 · P 0.4324 · T 0.1085 · D 0.5084 · sin 1.1959 θ
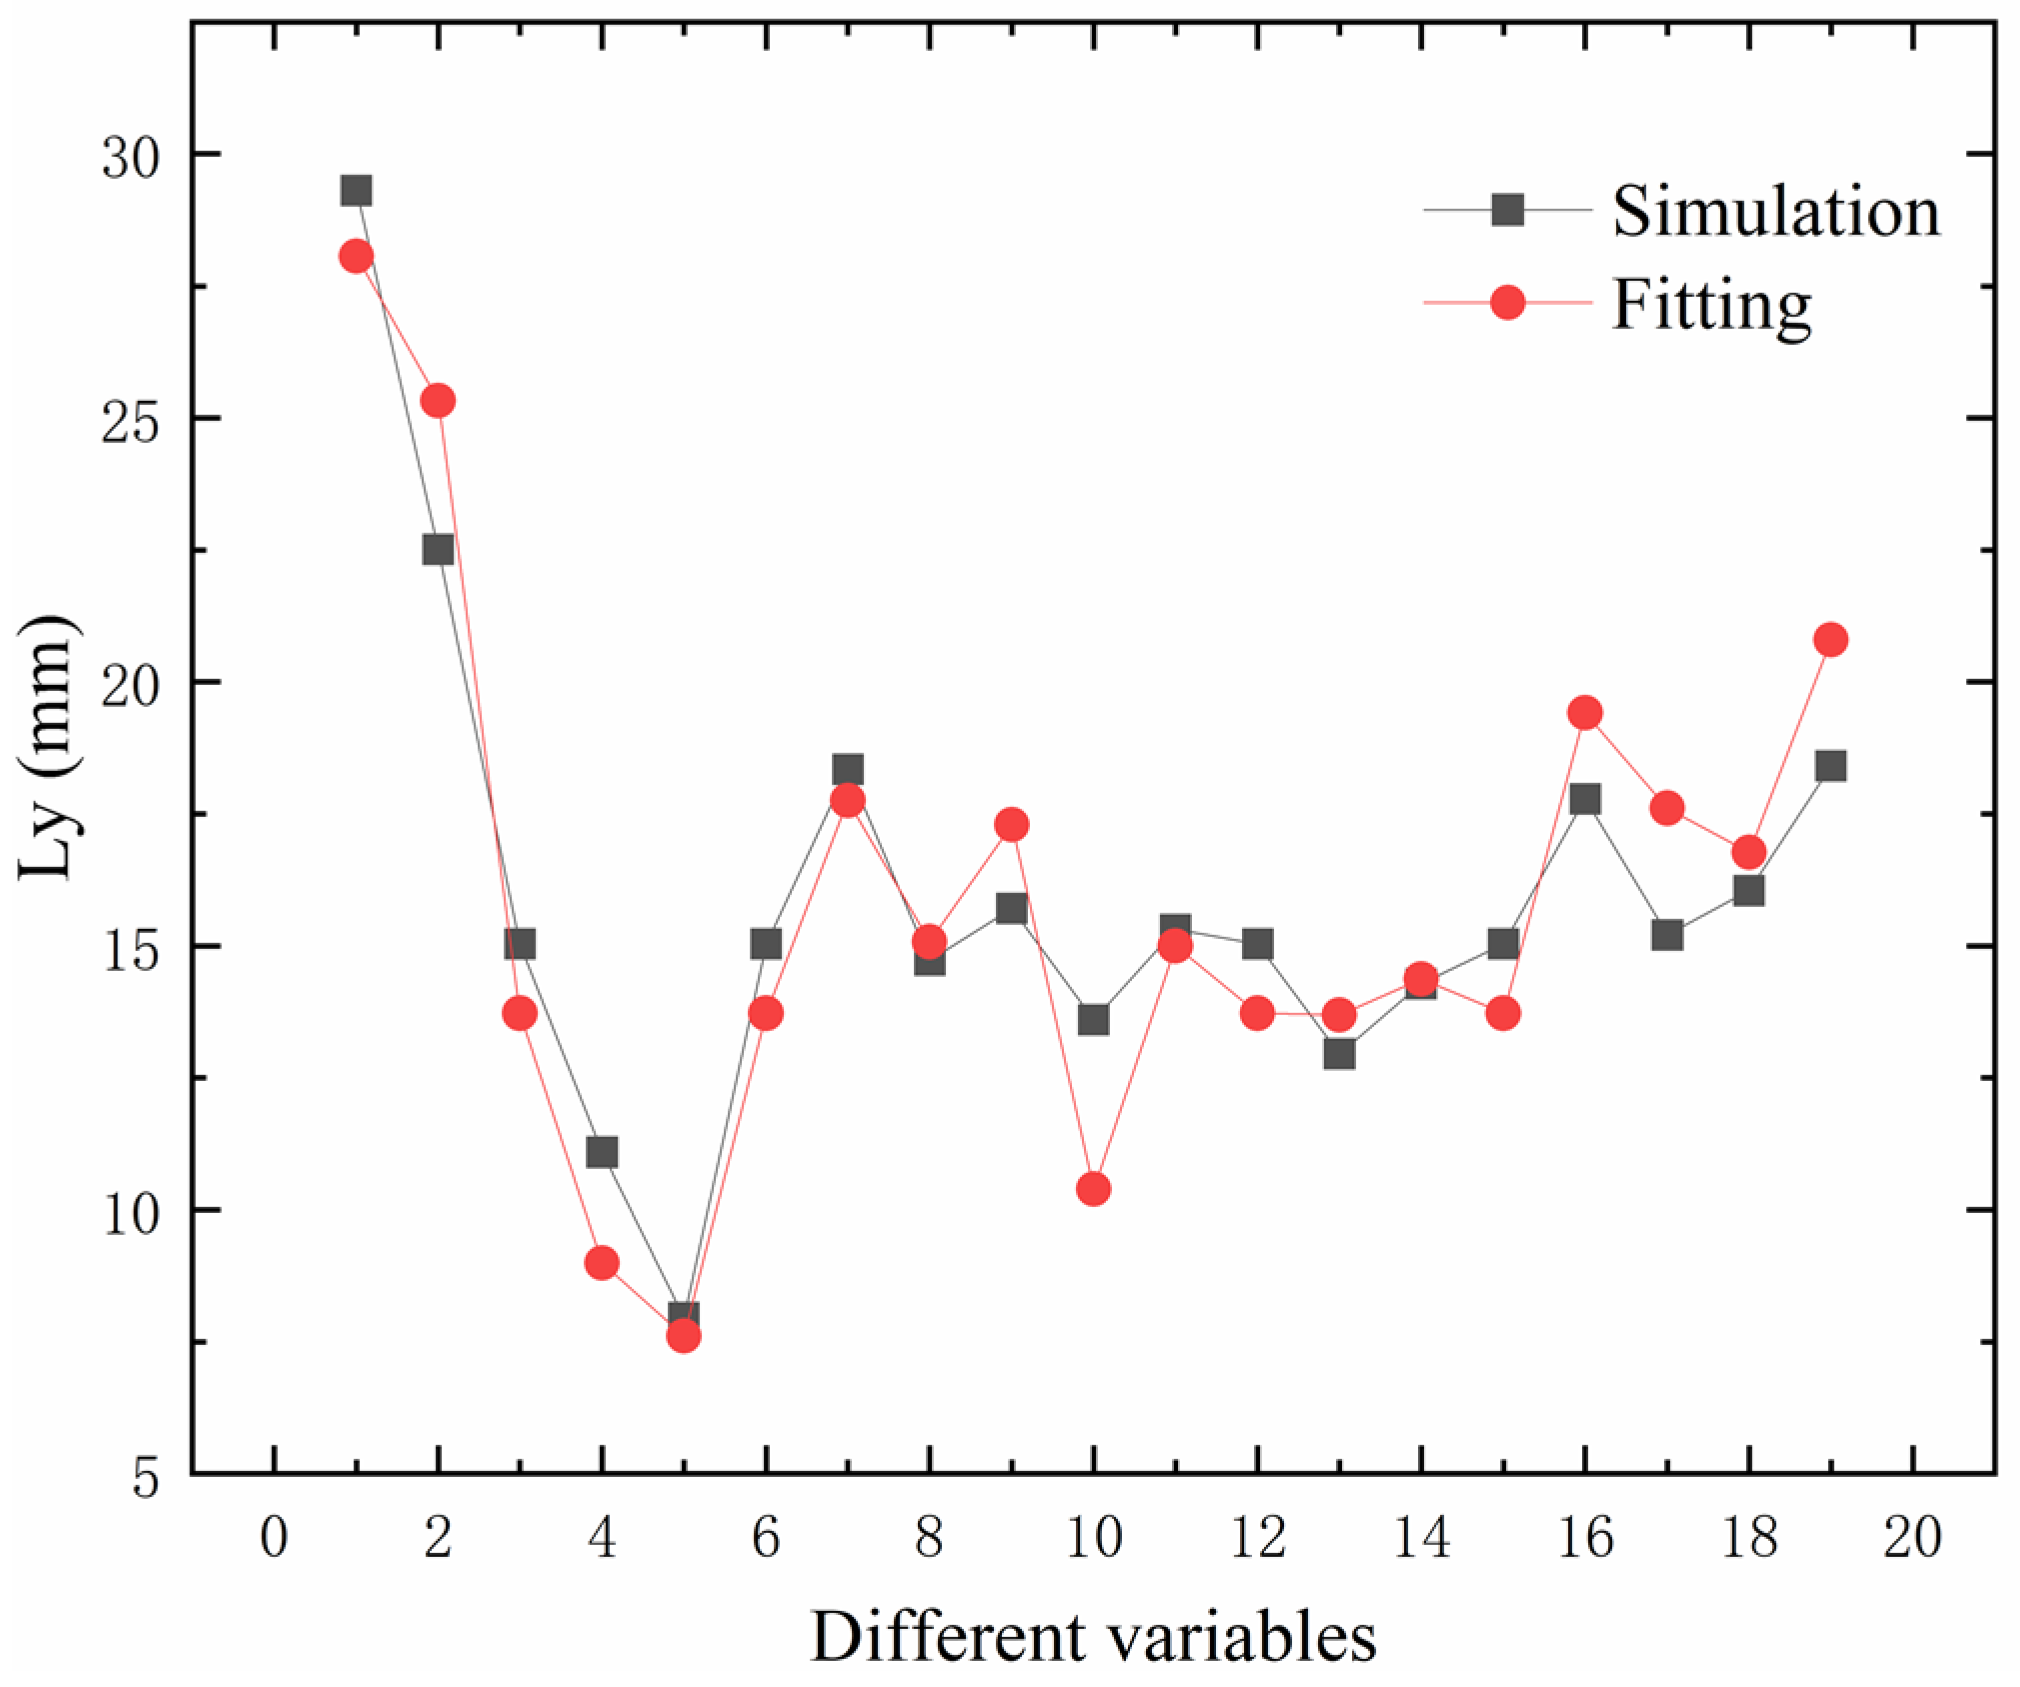
From the fitting equation, it is evident that among all the influencing factors, the inflow velocity had the most significant influence on the spanwise distribution of the liquid fuel concentration at the front edge of the stabilizer. Moreover, the temperature change had the least effect on the liquid fuel distribution range.
Figure 10 compares the simulation and fitting results under different parameters, revealing that the overall fitting degree was high; the overall goodness of fit of the fitting equation was R2 = 0.9644.

3.2. Fuel Concentration Distribution

This chapter combines the numerical and experimental methods to conduct our research with the reliability of the above numerical calculations. The spatial distribution of the fuel concentration under different water pressure, mixing distance, blockage ratios, and nozzle diameter was studied experimentally. Given the test bench condition limitations, the spatial distribution of fuel concentration under different inflow velocities, inflow temperature, and fuel injection angles could not be evaluated. Thus, these are studied by numerical simulations.

3.2.1. Numerical Simulations

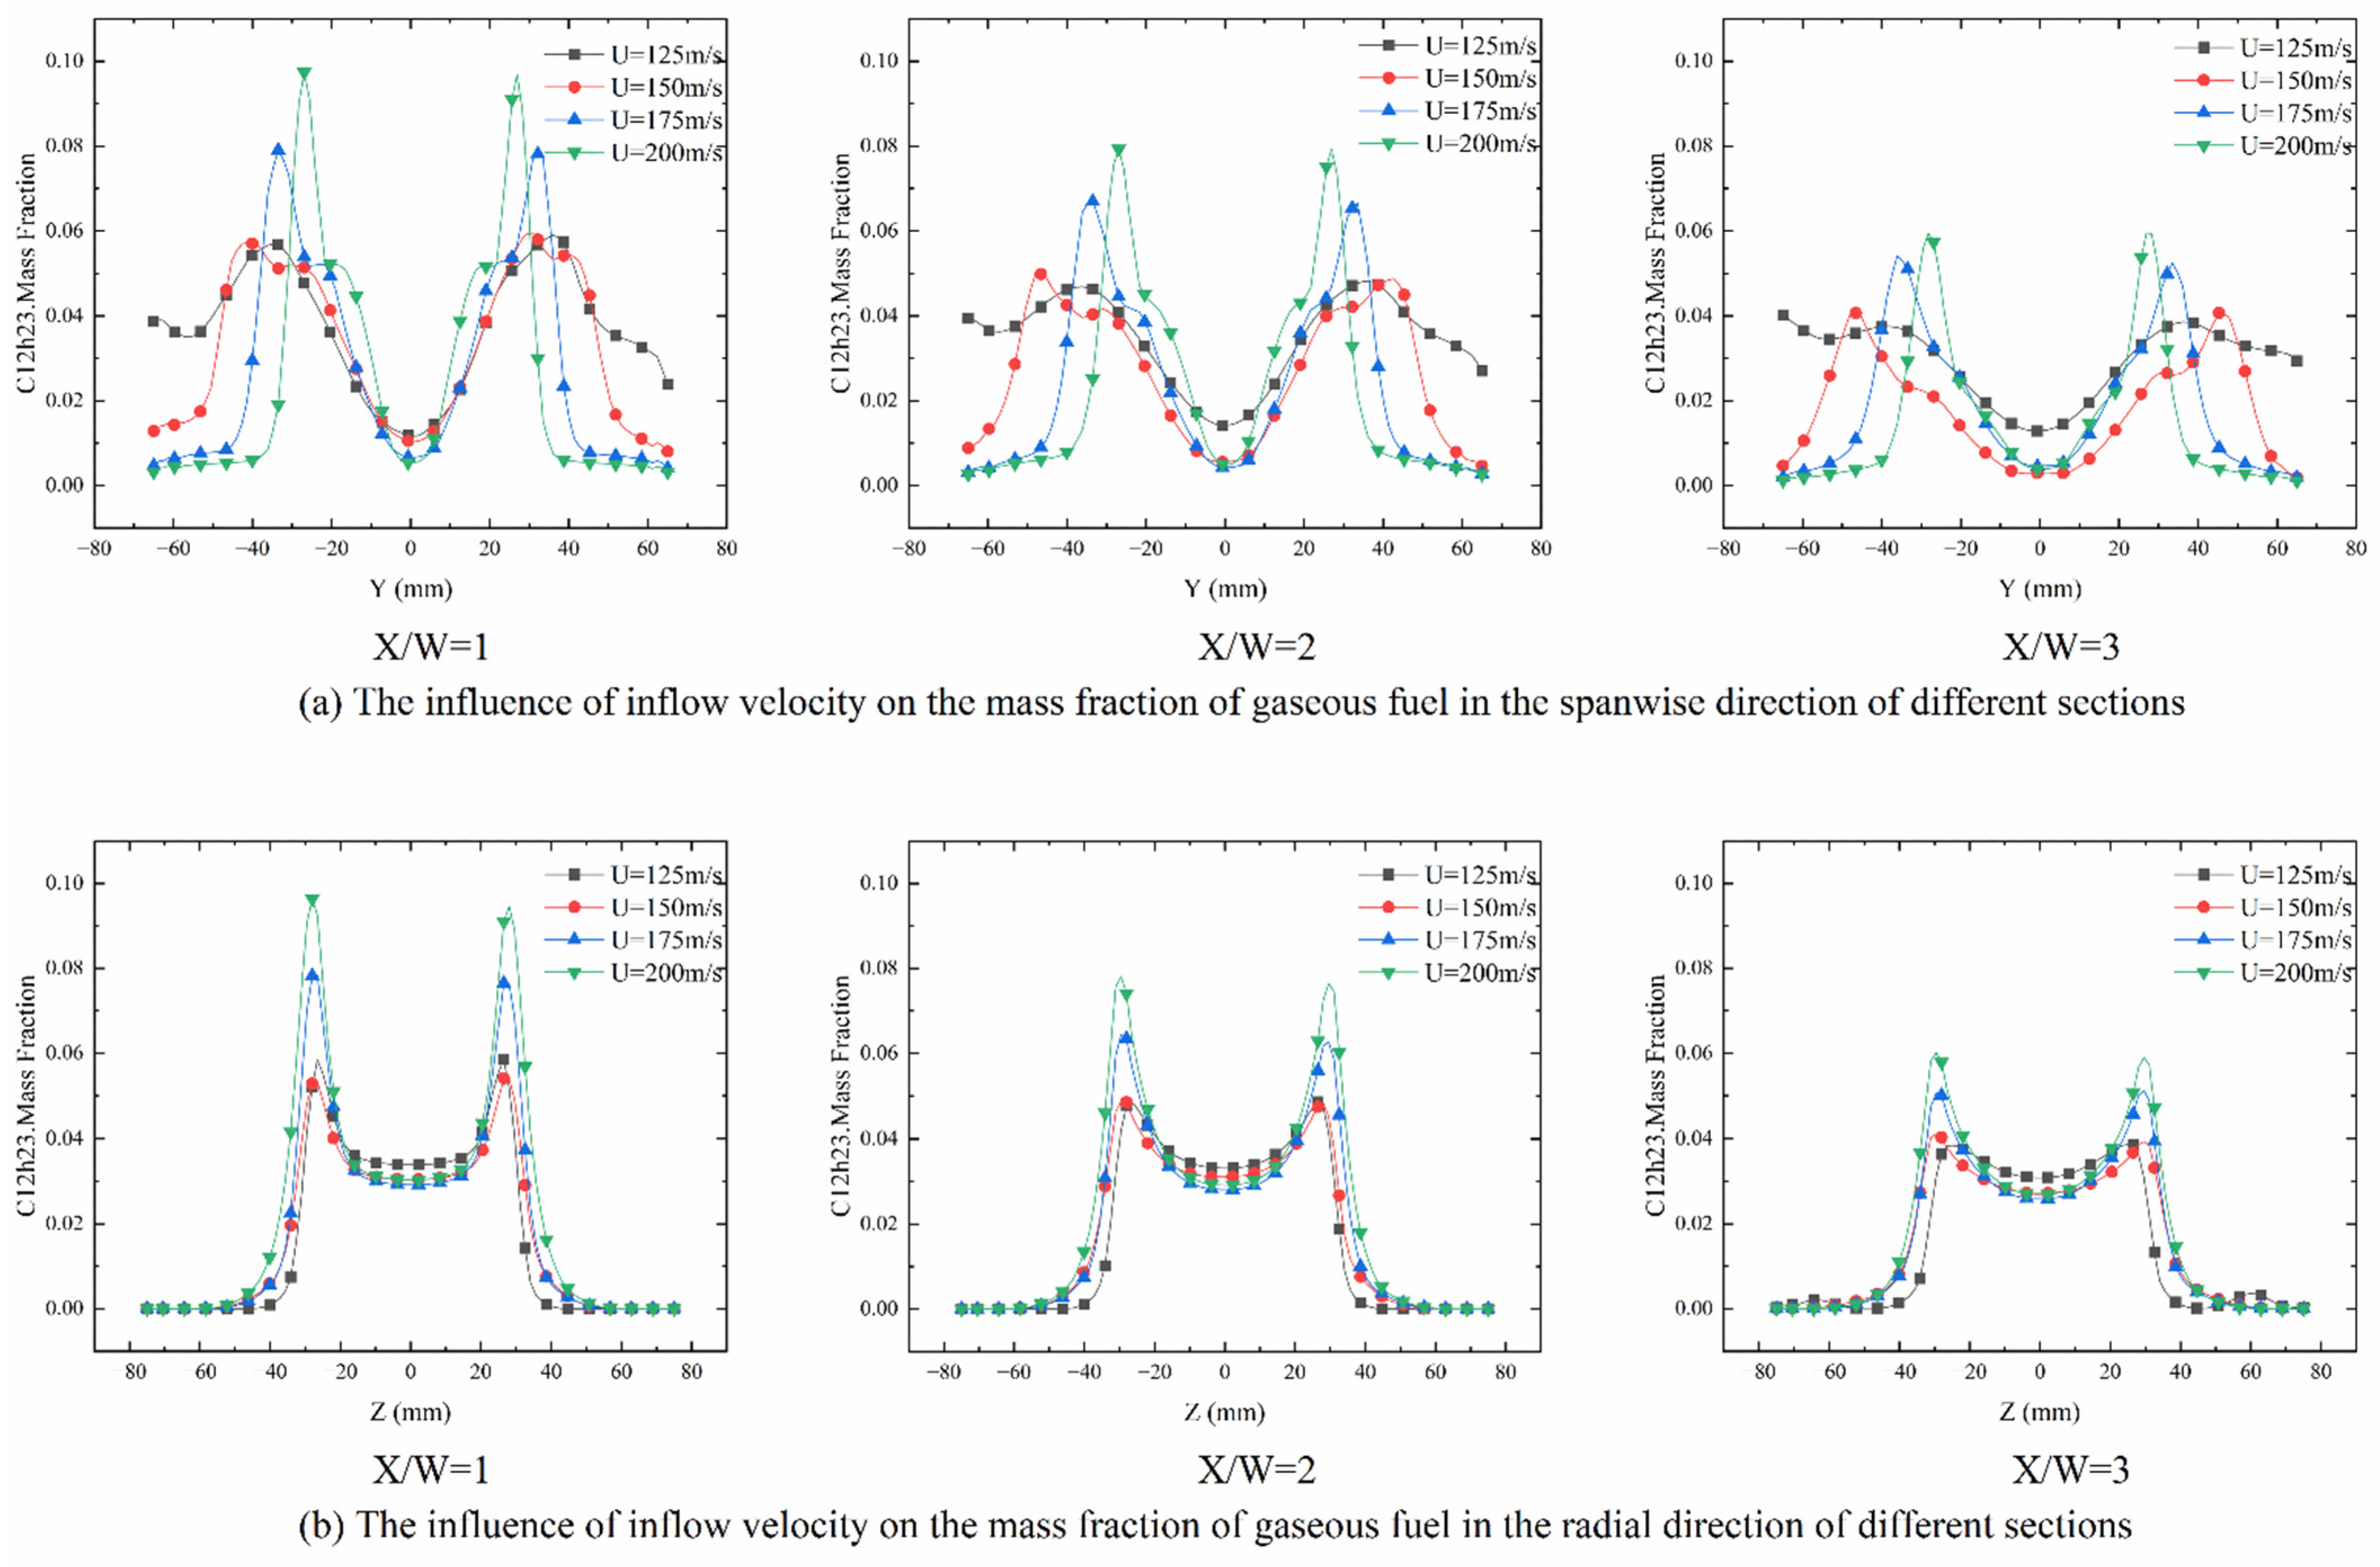
In the following example, the inlet temperature is Tf = 800 K, the fuel supply pressure difference is p = 0.5 MPa, the nozzle diameter is D = 0.5 mm, the mixing distance is L = 150 mm, the width of the stabilizer groove is W = 45 mm, and the fuel injection mode is 60° spanwise bilateral injection with the flow direction. The fuel concentration distribution was analyzed when the flow velocities were 125 m/s, 150 m/s, 175 m/s, and 200 m/s, respectively.
The mass fractions of the gaseous fuel in the spanwise and radial directions on the sections with flow direction distance X/W = 1,2, and 3, are depicted in Figure 11a,b. These figures show that along the spanwise direction, as the inflow velocity increased, the gaseous fuel concentration distribution law along the spanwise direction on the cross sections of different flow directions was consistent. Thus, the fuel concentration gradually increased along the Y direction, but its distribution range in the Y direction decreased. In the radial direction, the gaseous fuel concentration gradually increased with the inflow velocity, and the maximum fuel concentration points were located at the upper and lower boundaries of the recirculation zone. The reason for this is because the higher the inflow velocity, the higher the degree of fuel fragmentation, the smaller the particle size of the droplet at the rear edge of the stabilizer, and the greater the evaporation.
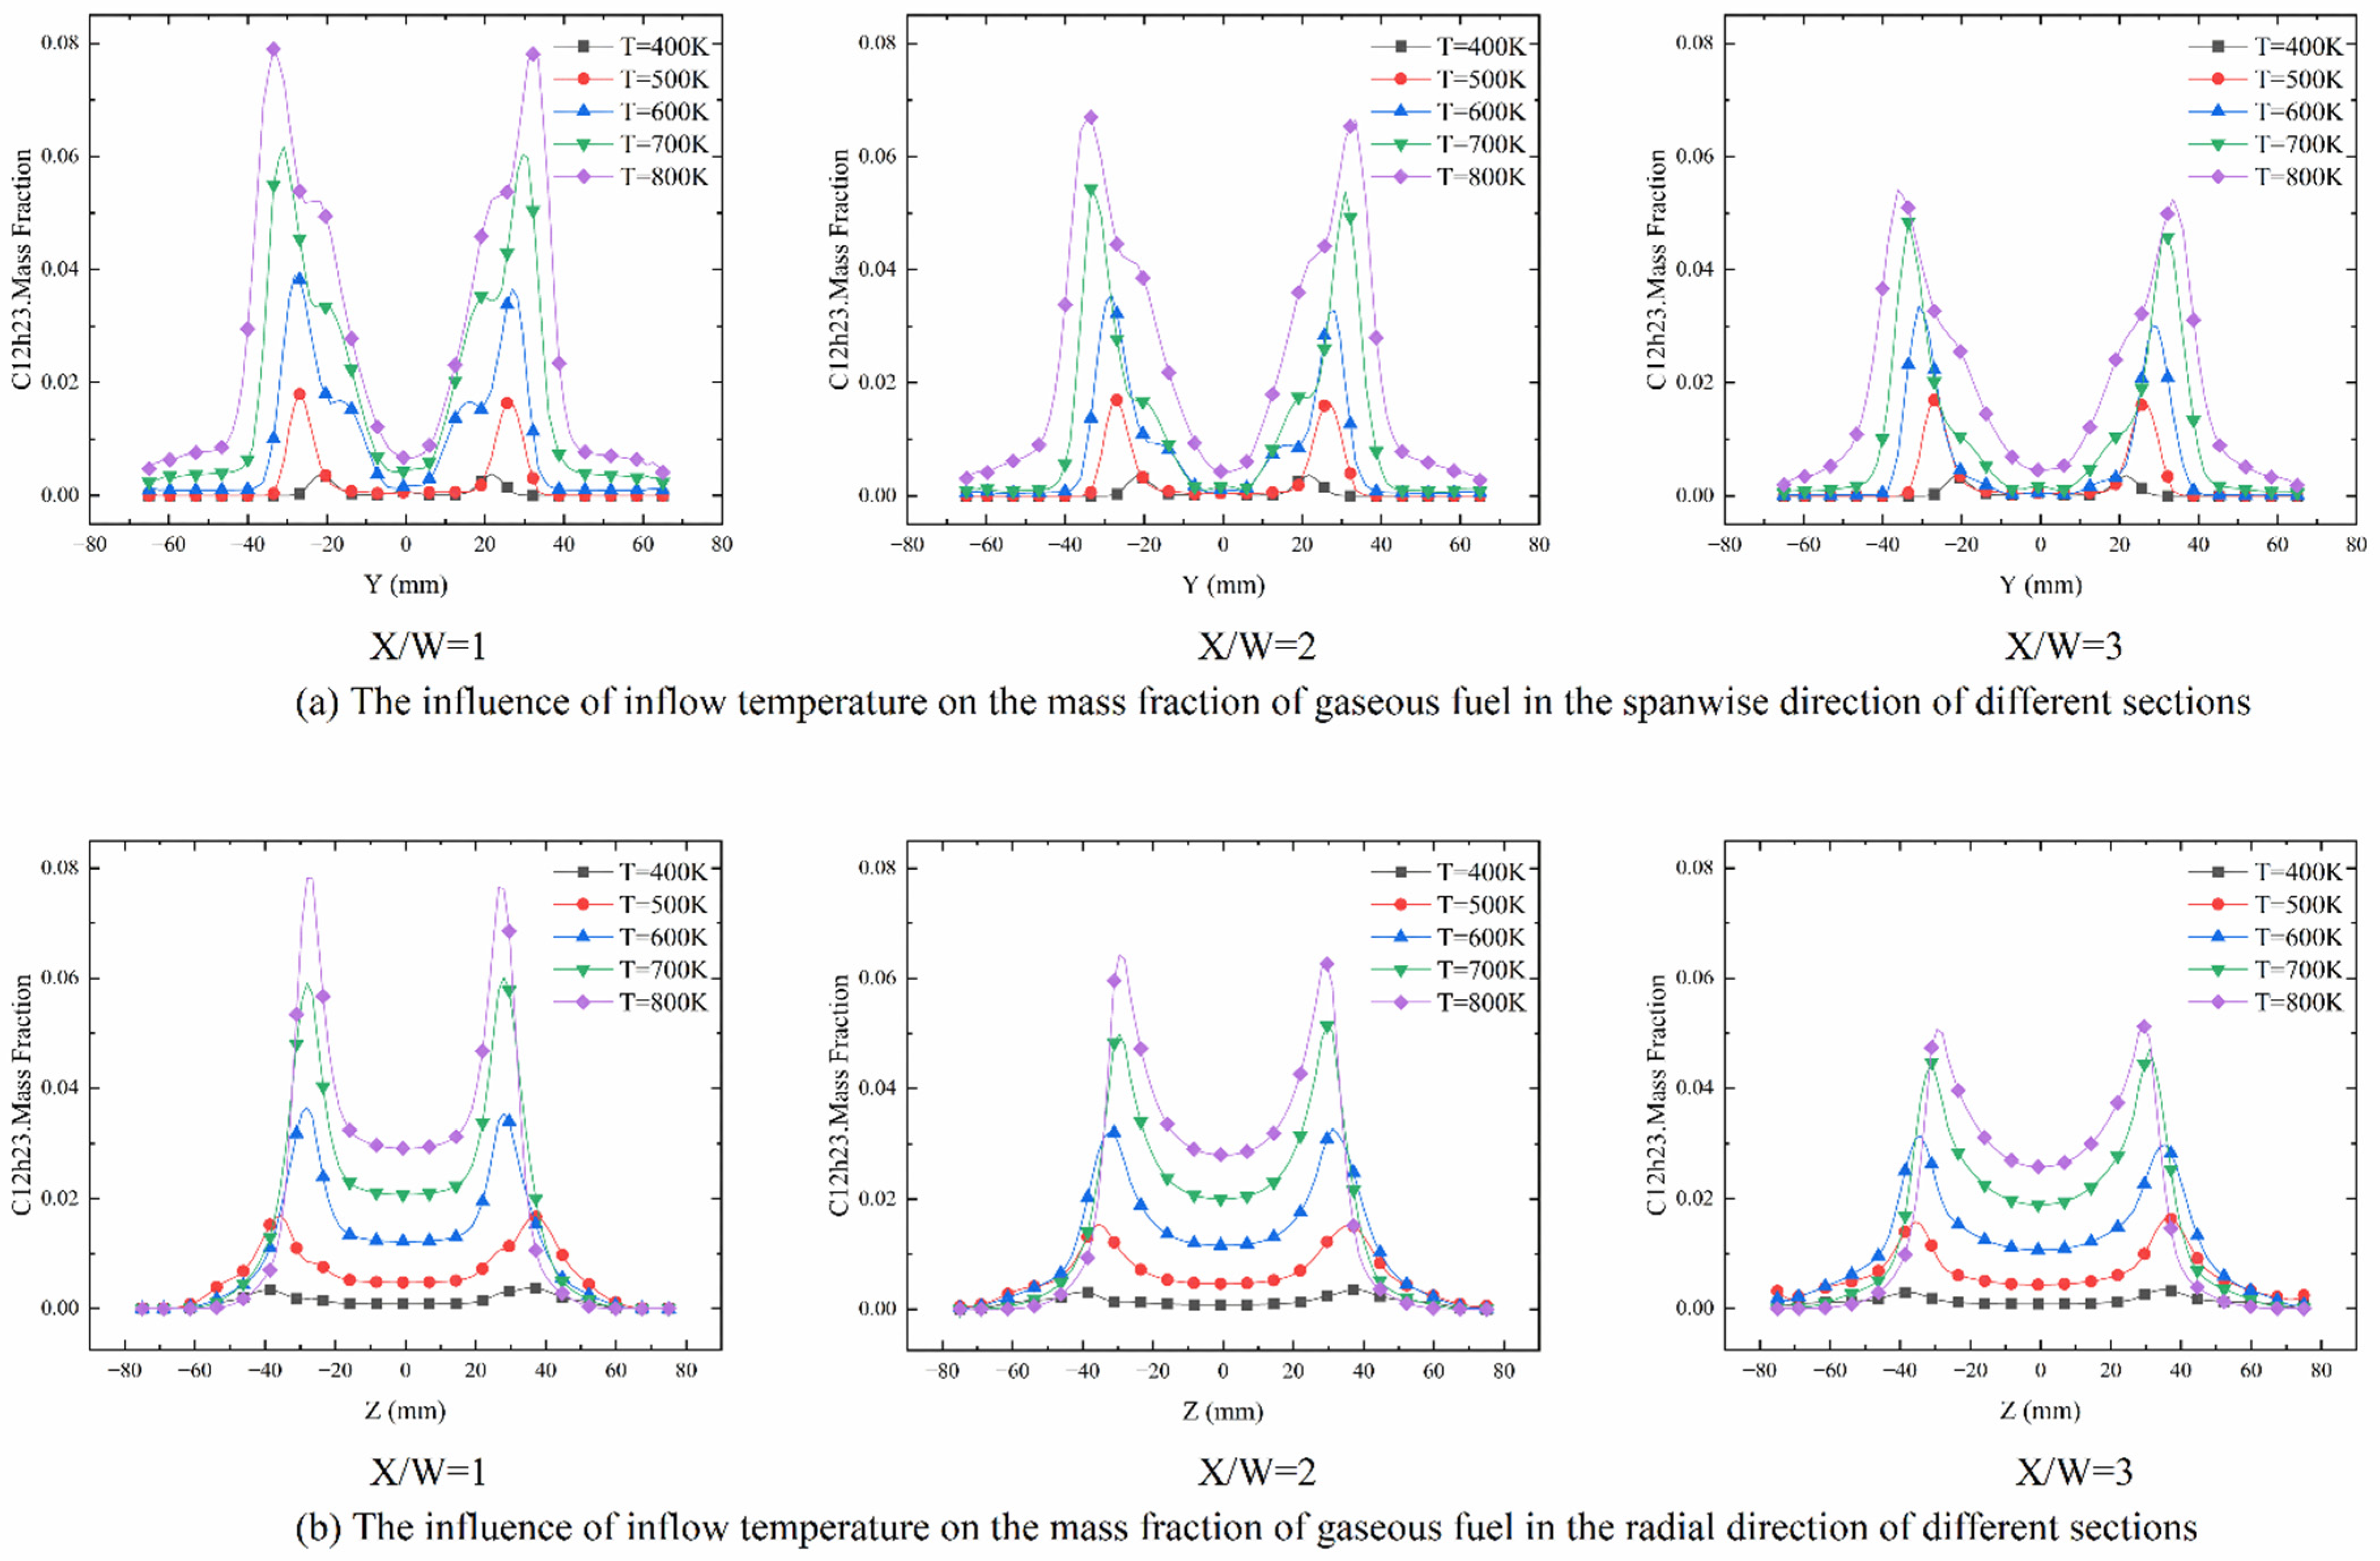
In the following example, the inlet velocity is U = 170 m/s, the fuel supply pressure difference is p = 0.5 MPa, the nozzle diameter is D = 0.5 mm, the mixing distance is L = 150 mm, the width of the stabilizer groove is W = 45 mm, and the fuel injection mode is 60° spanwise bilateral injection with the flow direction. The following experiments analyzed the distribution of the fuel concentration when the inflow temperatures were 400 K, 500 K, 600 K, 700 K, and 800 K, respectively.
Figure 12a,b present the influence of the incoming flow temperature on the mass fraction of the gaseous fuel in the spanwise and radial directions of different sections. Both figures highlight that the fuel concentration presented a bimodal distribution in the spanwise direction. With the continuous increase in the inflow temperature, the mass fraction of the gaseous fuel in each section gradually increased, the range of the gaseous fuel distribution in the spanwise direction gradually increased, and the distribution of gaseous fuel concentration became more uniform. With the inflow temperature increase, the heating effect of the incoming air on the fuel droplets became stronger, resulting in the fuel’s faster evaporation speed. At the same flow distance, the higher the inflow temperature, the greater the gaseous fuel mass fraction. Gaseous fuel had better diffusion ability than liquid fuel. Therefore, with the inflow temperature increase, the gaseous fuel distribution range in the spanwise direction was wider.
In the radial direction, the concentration distribution of the gaseous fuel presented a bimodal distribution due to the stabilizer’s partition effect, resulting in the distribution of gaseous fuel near the upper and lower edges of the stabilizer. With an increase in the inflow temperature, the radial gaseous fuel concentration gradually increased. Along the flow direction, the farther the flow section was from the rear edge of the stabilizer, the smaller the concentration of the gaseous fuel in the section. At the same time, as the flow direction distances increased, the distribution of the gaseous fuel in the return area became more uniform. The reason for this is because, in places where X/W was small, the fuel was concentrated at the junction of the return recirculation zone and the main flow. With an increase in the flow direction distance, the shedding vortices on the upper and lower wall surfaces of the stabilizer continued to develop, move and finally converge, shifting the gaseous fuel to the center of the recirculation zone so that the mass distribution of the gaseous fuel on the cross section where X/W was large and more uniform.

3.2.2. Experimental Research

According to the existing conditions, this section presents the experimental study of four parameters: mixing distance, nozzle diameter, fuel supply pressure difference, and blockage ratio. Their specific parameter ranges are reported in Table 3.
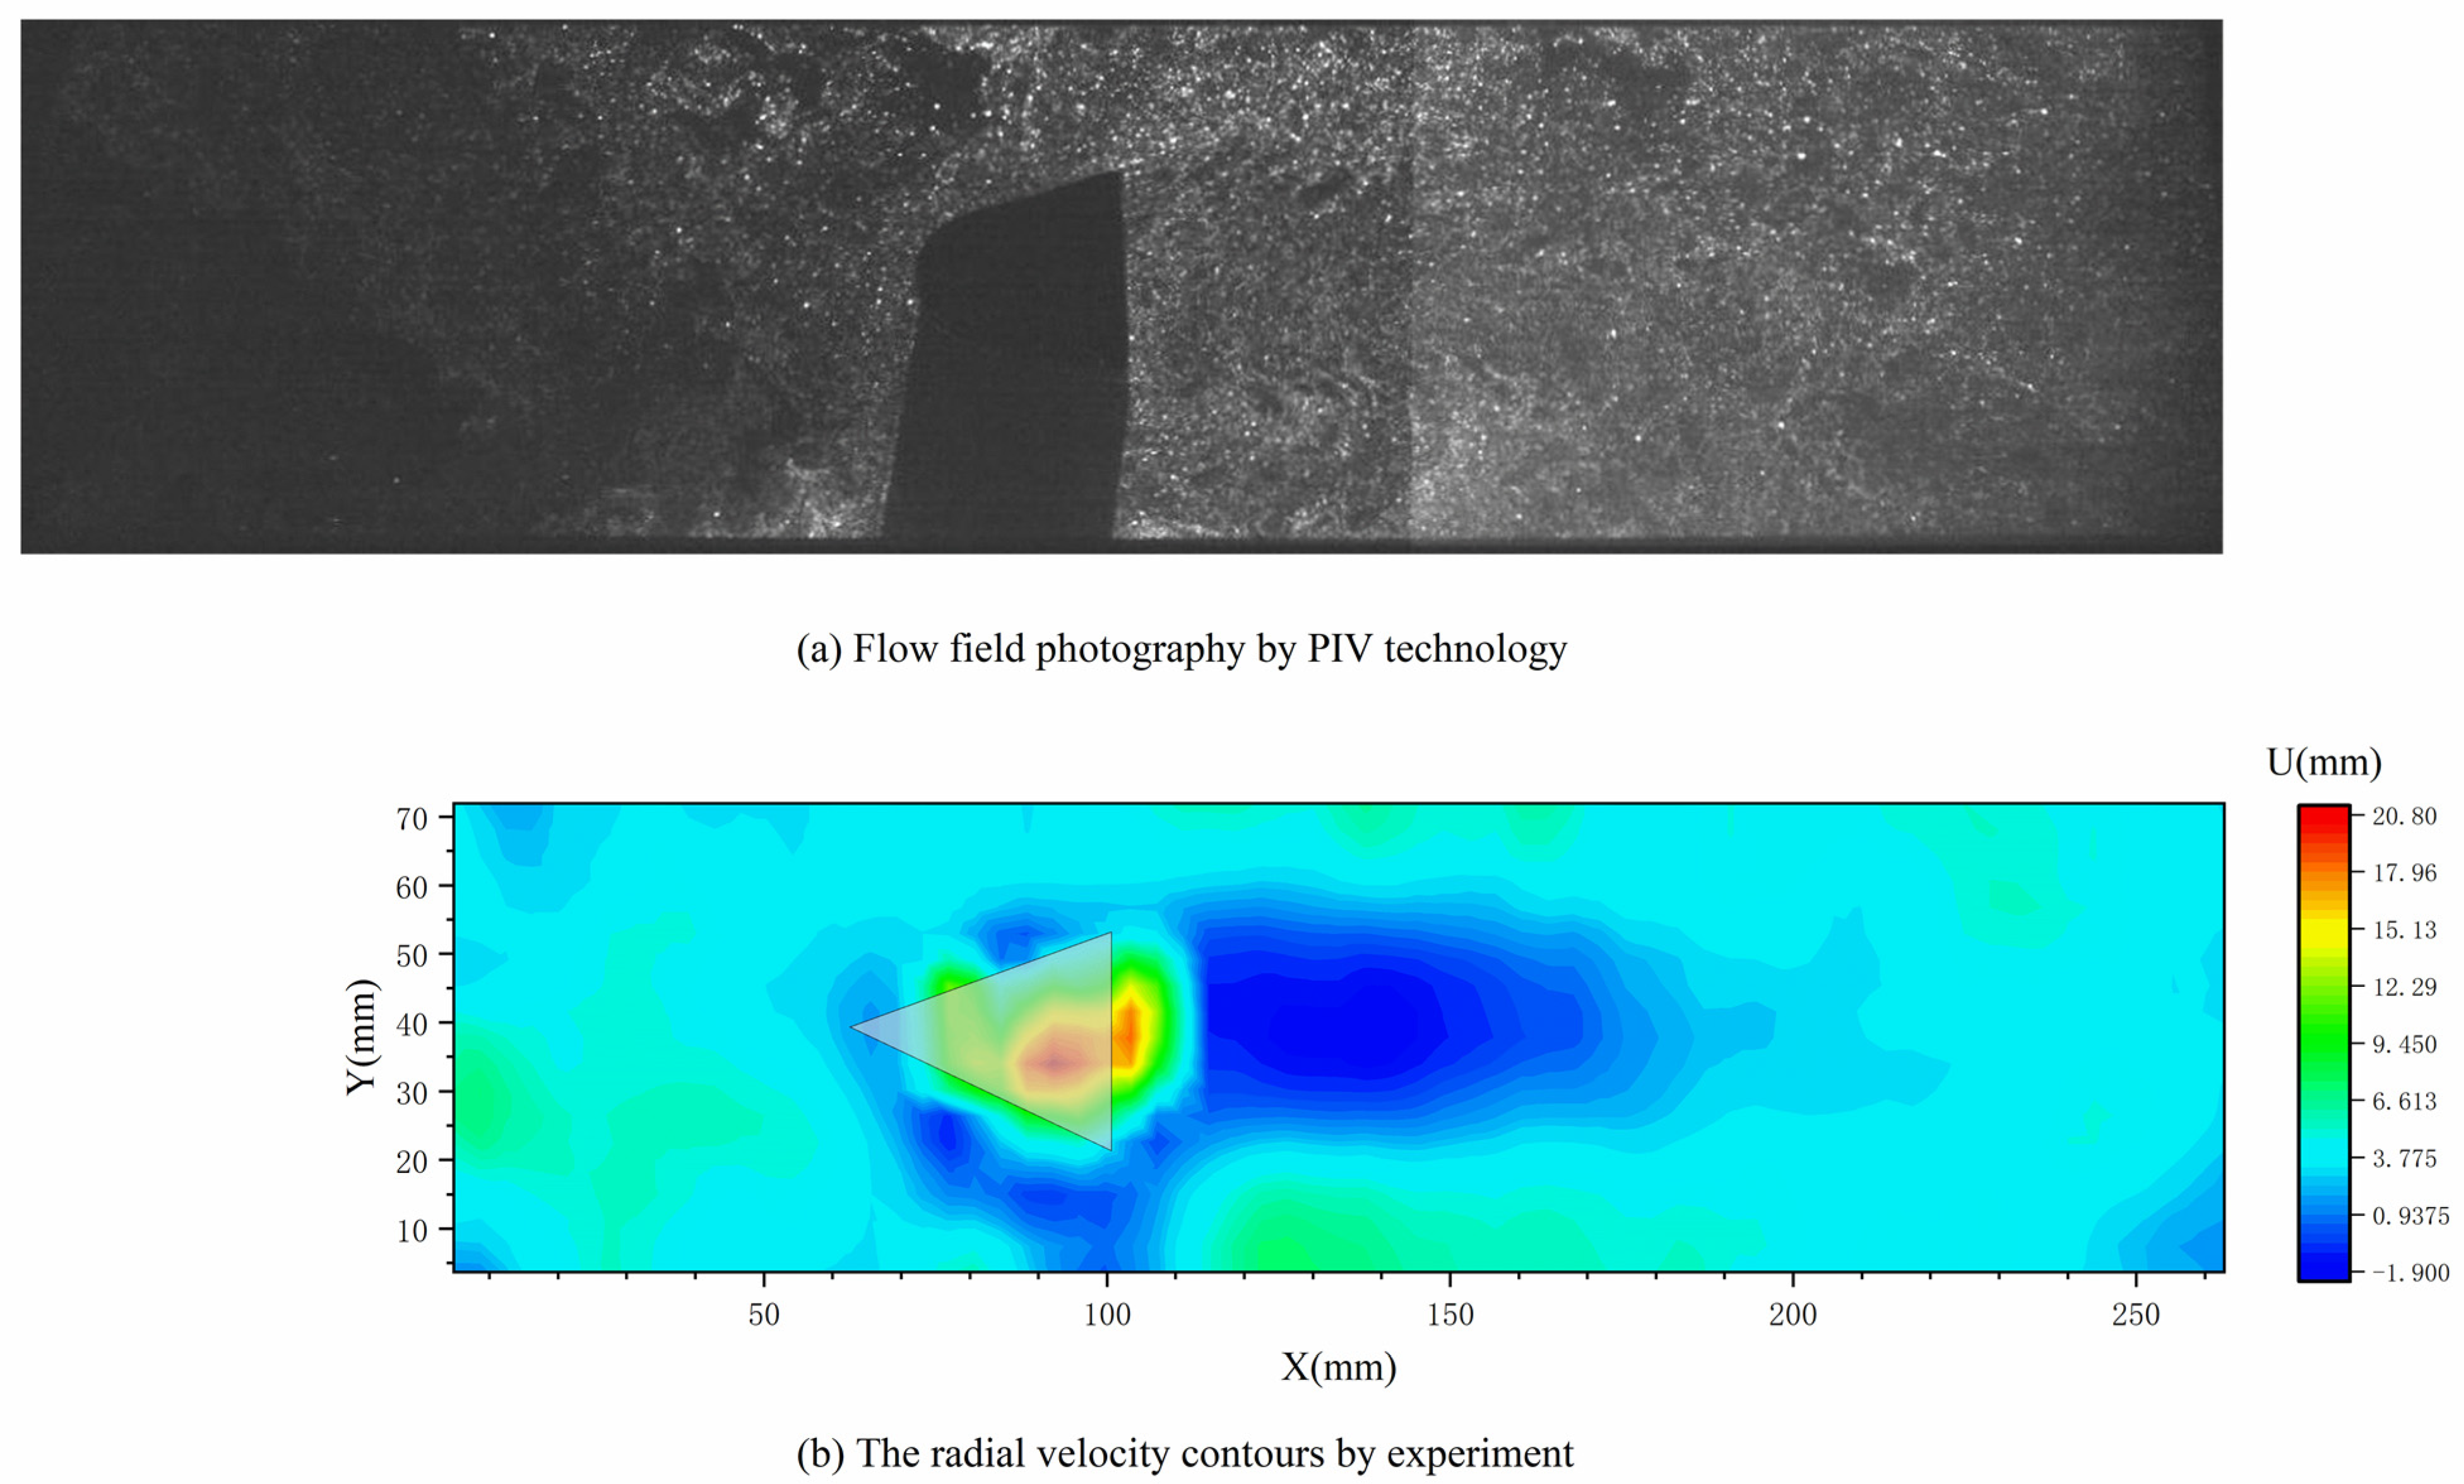
Figure 13a illustrates a flow field diagram that was obtained using PIV technology. During the experimental shooting, the laser irradiated from top to bottom, and due to the stabilizer’s shelter, the light shadow formed under the stabilizer, affecting the later stage’s speed calculation. Figure 13b presents the experimental contours of the flow field when the blockage ratio was 0.35, and Figure 4b is a comparison diagram of the radial velocity obtained experimentally and by simulation, at 37 mm behind the stabilizer. As mentioned in Section 2.2, the results of the experiment and numerical simulation were very close, which proves the reliability of the experiment and numerical simulation.
The image was subjected to block processing in order to calculate the fuel’s spatial density. Under each working condition, 10 photos were selected. Precisely, each group of photos was initially superimposed and averaged. Then, the spatial average concentration C in the Y direction in units of 20-pixel points in the X direction (the corresponding actual size is 1 mm) was calculated in order to obtain the concentration distribution in the X direction. The spatial average concentration C in the X direction in units of 20-pixel points in the Y direction (the corresponding actual size is 1 mm) was calculated to obtain the concentration distribution in the Y direction. The photograph was divided into rectangular units of 20 × 20 pixels (corresponding to the actual size of 1 × 1 mm) in the same calculation domain, in order to calculate the spatial density C of the whole plane. C is expressed as follows:
C = Number   of   pixels   occupied   by   all   droplets   in   the   picture   unit Total   number   of   pixels   in   the   picture   unit × 100 %
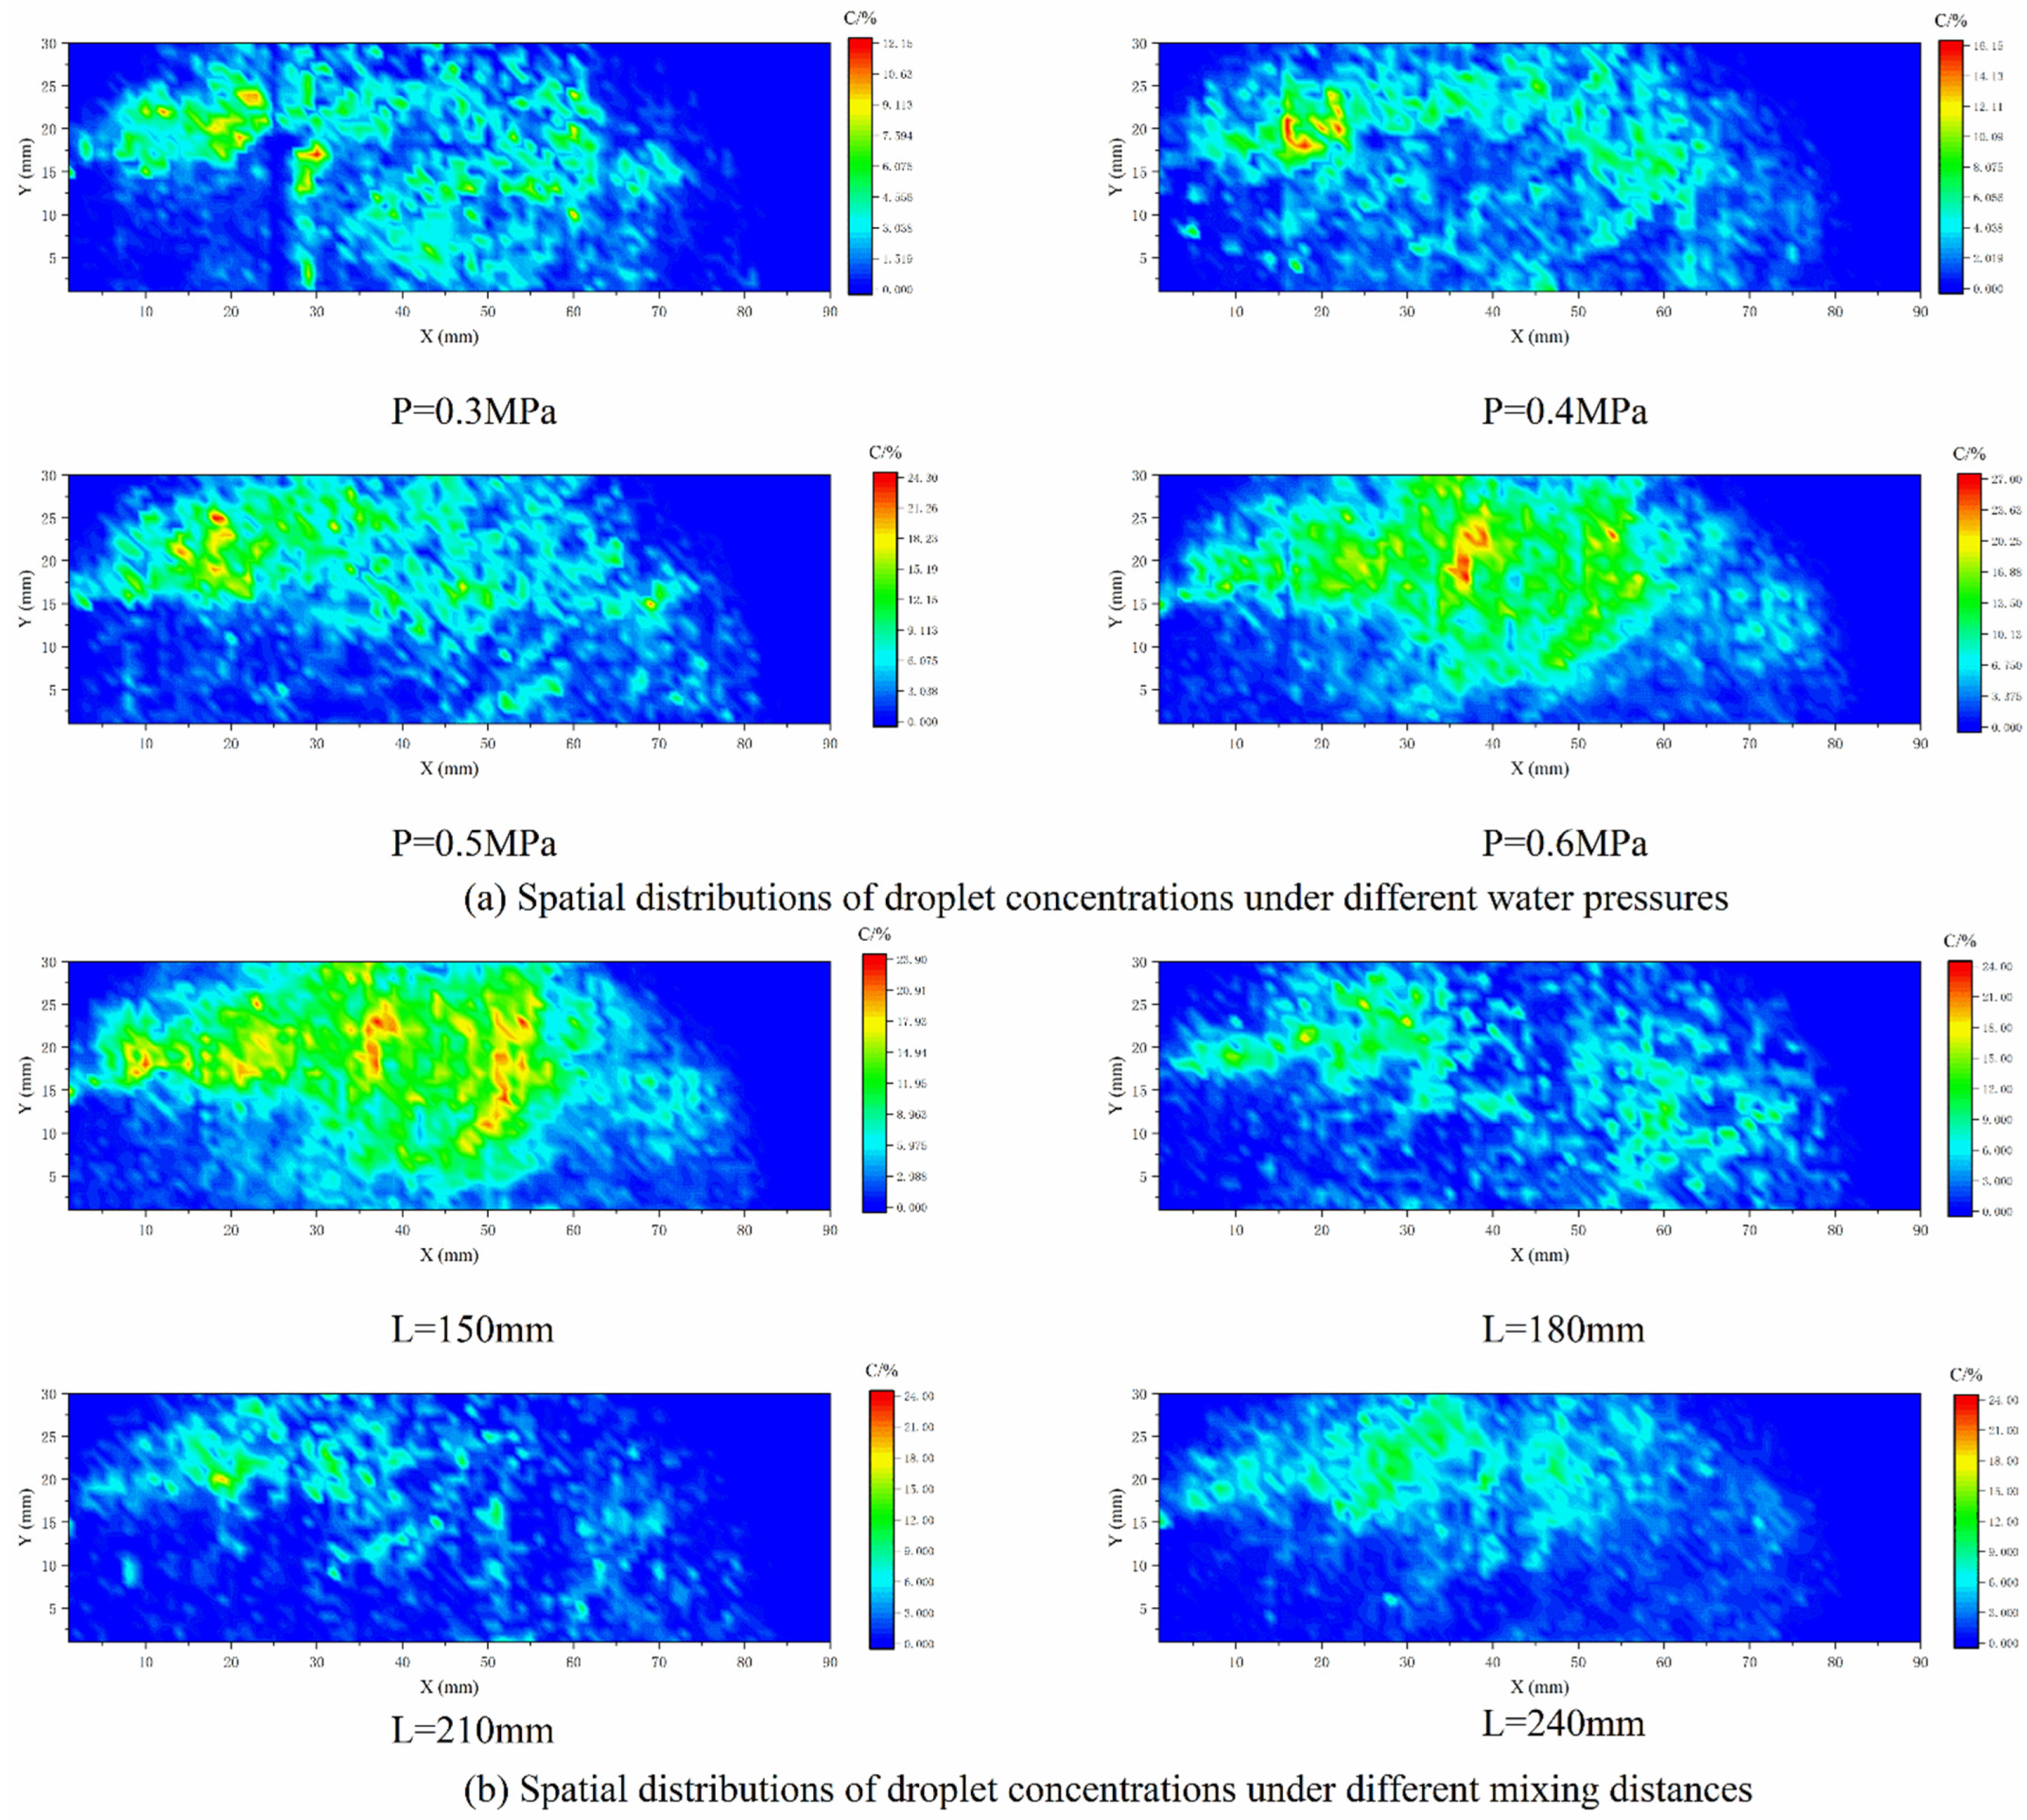
Under a d = 0.4 mm nozzle diameter, L = 150 mm mixing distance, ε = 0.3 blockage ratio, and y = 0 mm spanwise distance, four groups of fuel pressure differences were changed to obtain the spatial distribution of the droplet concentration under different pressures.
Figure 14a demonstrates the spatial contours of the droplet concentration under different water pressures, highlighting that with an increase in water pressure, the spatial distribution range of the droplets was wider, and the maximum concentration appeared at the rear upper part of the rear edge of the stabilizer.
The droplet concentration distributions along the flow and radial directions under different water pressures are depicted in Figure 15a,b. The figures reveal that the droplets’ spatial distribution gradually increased with an increase in water pressure difference. With the increased water pressure, the mass of liquid that was ejected simultaneously increased, thus the relative concentration value in the flow and the radial directions also increased. In the flow direction, the relative concentration of droplets increased first, and then decreased with an increase in the flow distance. The reason for this is because after the liquid collided with the front end of the stabilizer, part of the liquid diffused backward along the stabilizer wall. The droplet distribution was relatively concentrated upon leaving the tail edge of the stabilizer. As the droplet moved backward, the distribution range of some droplets in the back region of the recirculation zone became the widest, presenting a peak on the flow direction concentration distribution map. Then, when reducing the camera range, the liquid droplets exceeded the view range, and gradually decreased in the flow direction concentration map. With an increase in the radial distance, the concentration distribution presented two peaks in the radial direction. The reason for this is because, under the influence of the stabilizer, the liquid droplets could directly enter the rear area of the stabilizer, and needed to be slowly scattered into the recirculation zone from both sides. At the same time, due to the entrainment of the recirculation zone, some small droplets became trapped at the interface between the recirculation zone and the mainstream. Droplets of a large particle size had a strong penetration ability and a high concentration distribution on the outside.
Under a d = 0.4 mm nozzle diameter, P = 0.6 MPa water pressure, ε = 0.3 blockage ratio, and y = 0 mm spanwise distance, four mixing groups were changed to obtain the spatial distribution of the droplet concentration under different mixing distances.
Figure 14b shows the spatial distribution of the droplet concentration under different mixing distances. The figure reveals that the droplet concentration gradually decreased with an increase in mixing distance; however, the droplets’ distribution range remained the same.
Figure 15c,d illustrate the droplet concentration distributions in the flow and the radial directions at different mixing distances, respectively. It can be seen that when the mixing distance increased, the droplet concentration decreased gradually in the flow and in the radial directions. When the mixing distance increased to 210 mm, the concentration distributions in the flow and the radial directions were almost equal. When the liquid was ejected from the nozzle at a certain cone angle, with an increase in the mixing distance, the dispersion area of the liquid droplets at the same cross-sectional position of the downstream vertical flow direction became larger. The droplets’ concentration in the flow section with Y = 0 mm decreased, but this trend slowed down when the mixing distance reached 210 mm. When the mixing distance continued to increase, there was little difference between the concentration distributions in the flow and the radial directions.
Under the conditions of a nozzle diameter of d = 0.4 mm, mixing distance of L = 150 mm, blockage ratio of ε = 0.3, and spanwise distance of y = 0 mm, three groups of stabilizer groove widths were changed to obtain the spatial distributions of the droplet concentrations under different stabilizer groove widths.
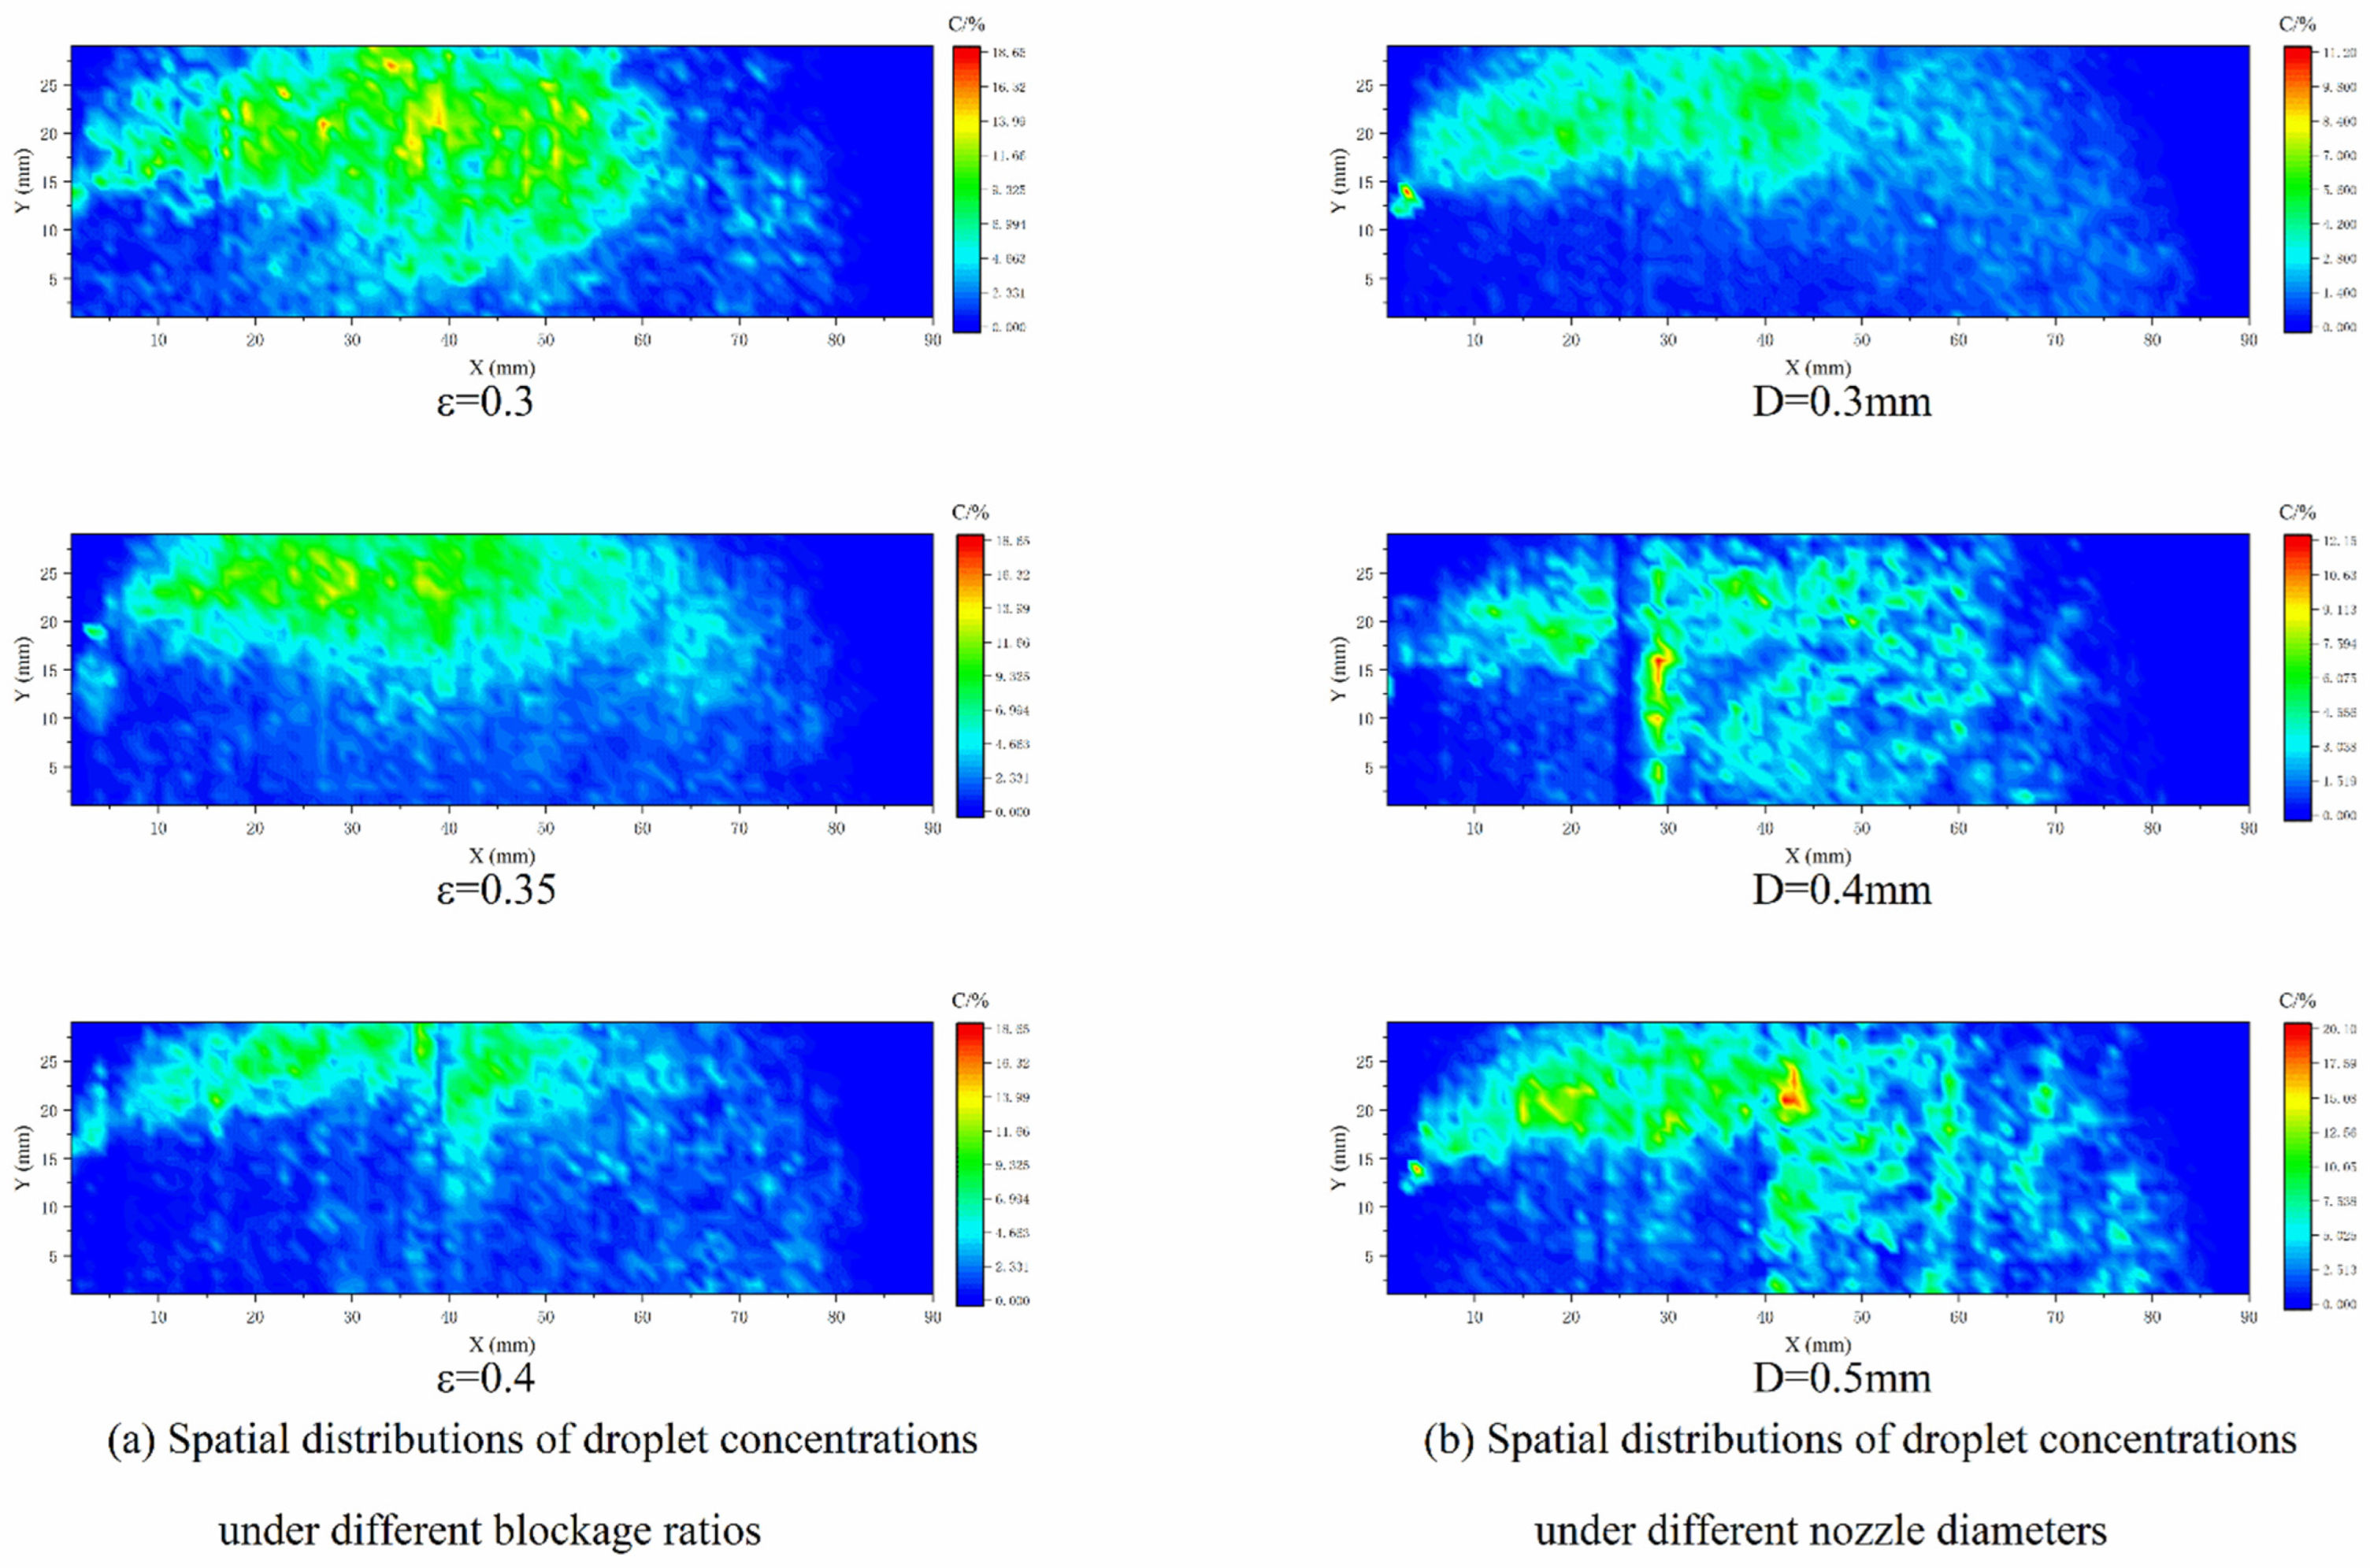
The spatial distributions of droplet concentrations under different blockage ratios are depicted in Figure 16a, where the concentration region of the droplet concentration moves upward with an increase in the blockage ratio. The concentration in the central area is reduced due to the blockage of the flame stabilizer.
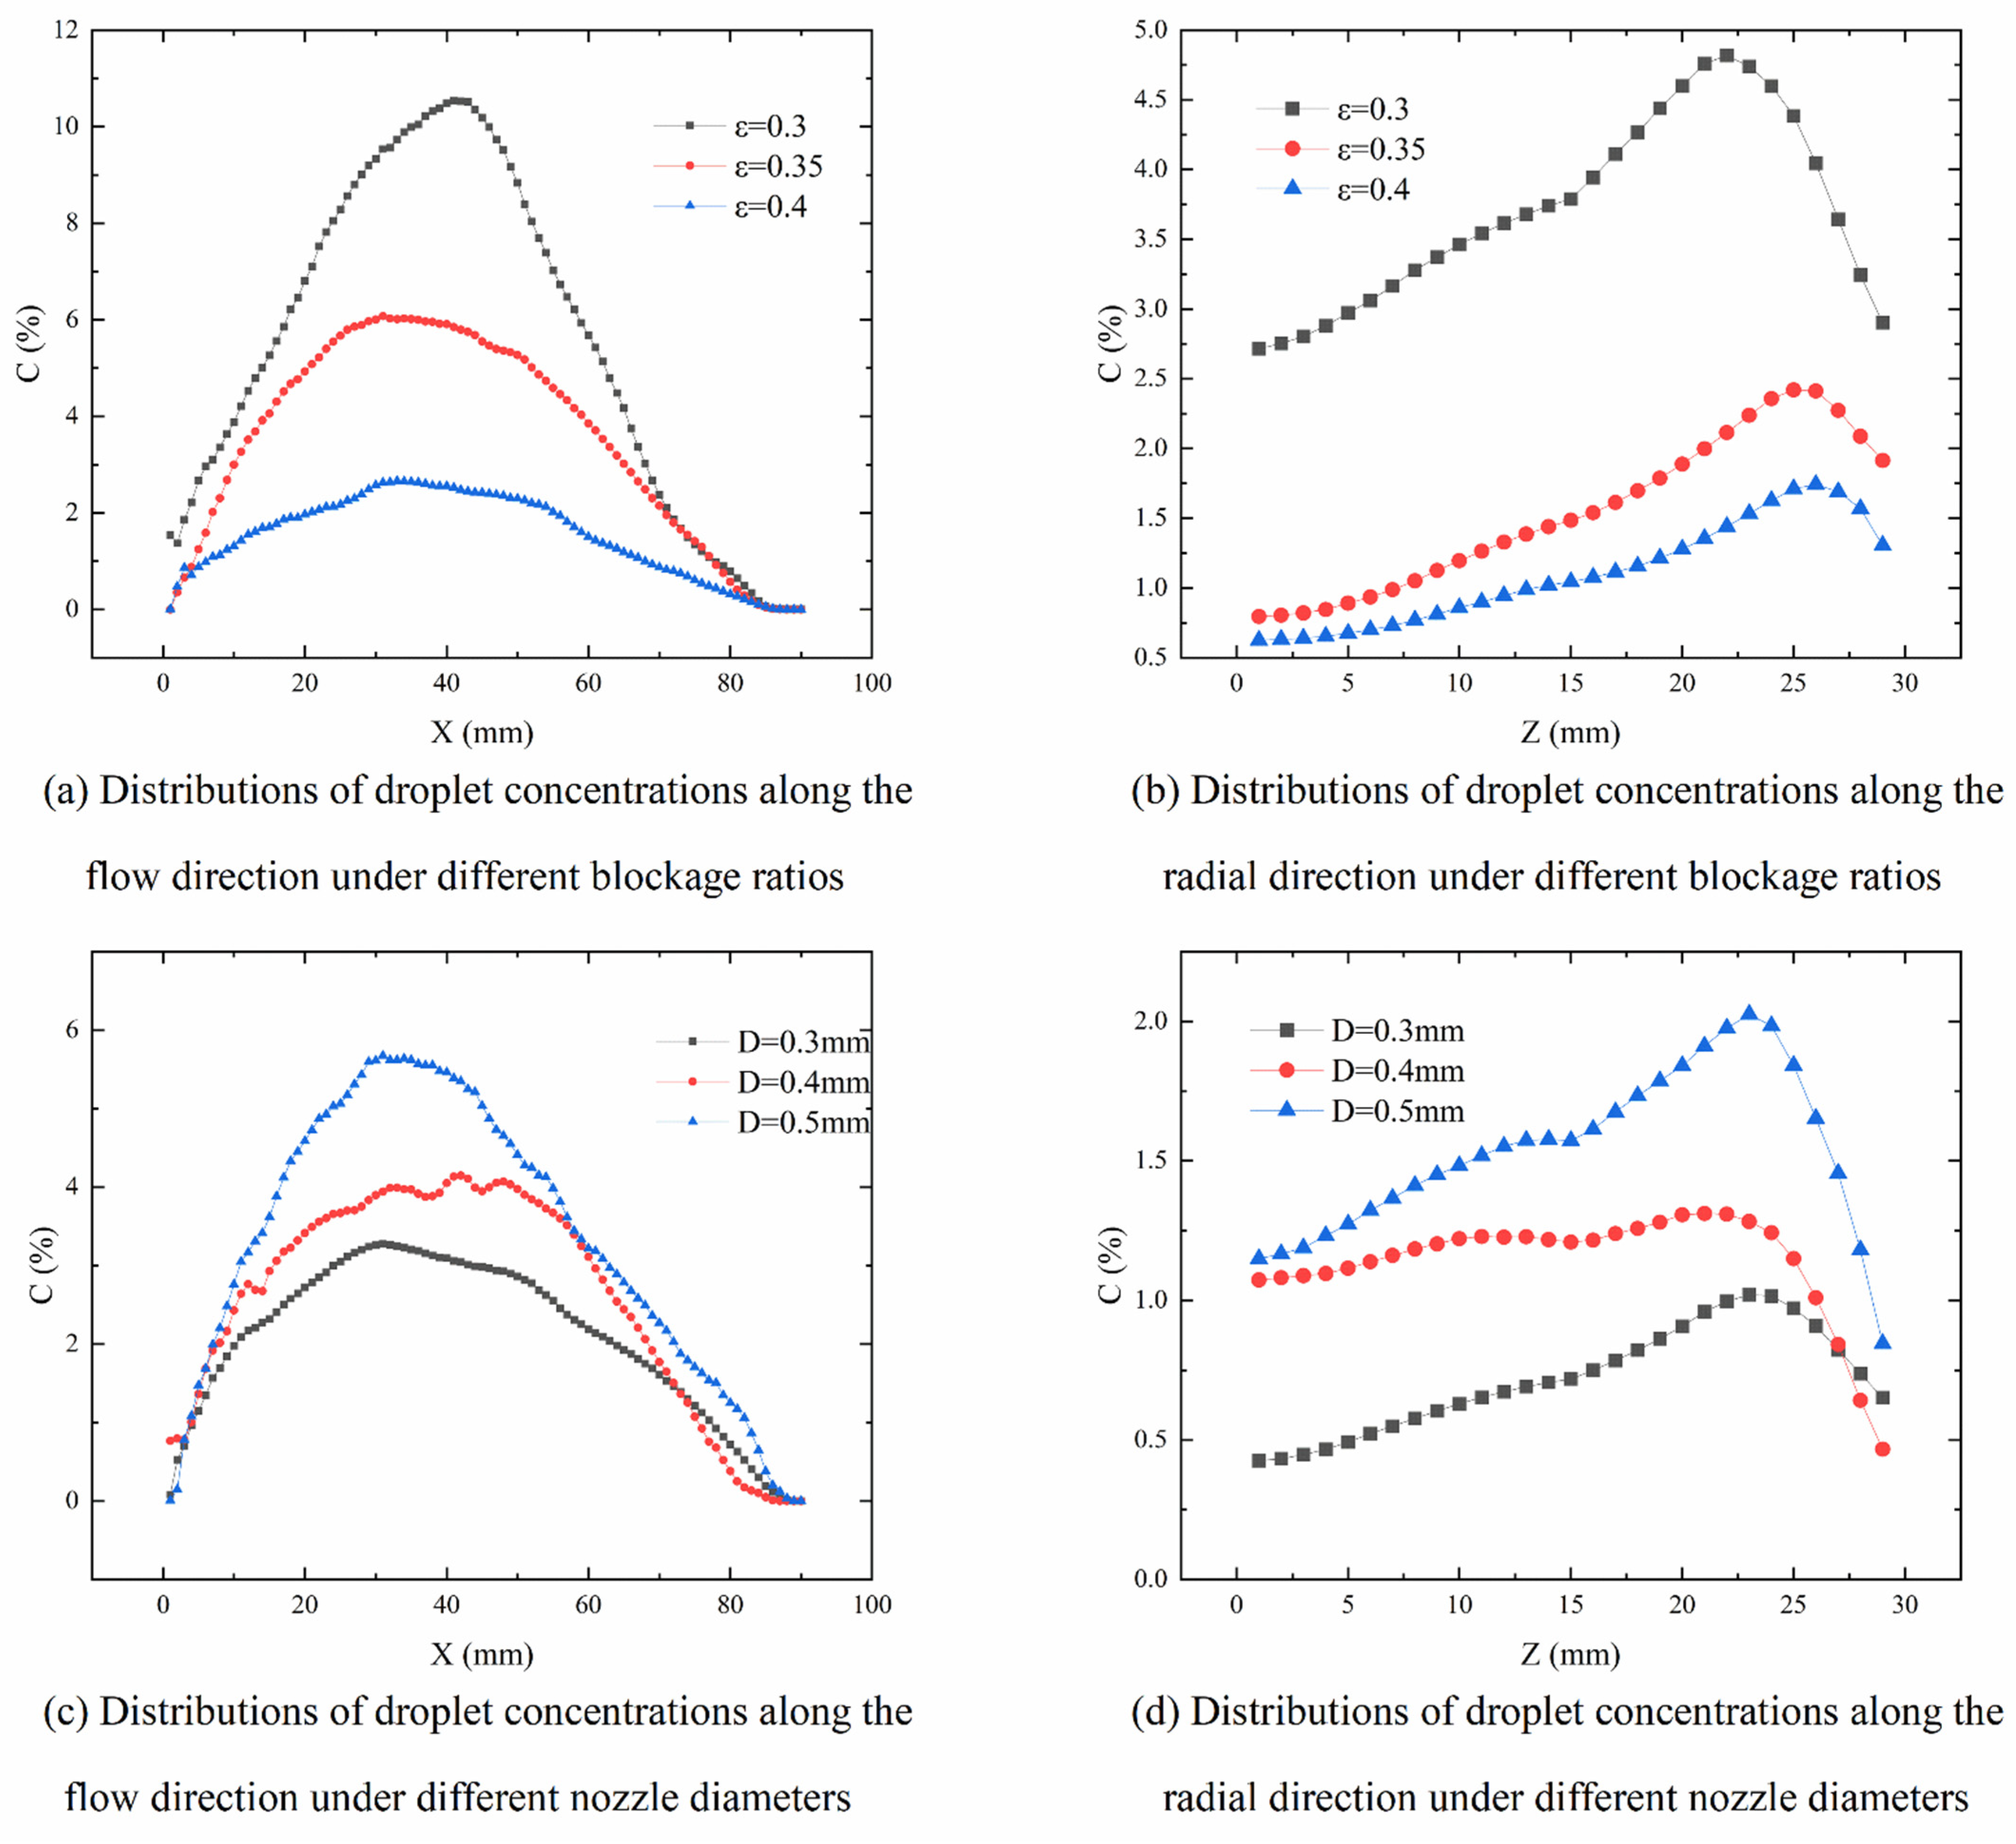
Figure 17a,b illustrate the spatial distributions of droplet concentrations along the flow direction and the radial direction for various blockage ratios. The flow diagram reveals that the droplets’ distribution in the flow direction tended to decrease as the blockage ratio increased. The reason for this is because the area of liquid passing through the stabilizer side decreased with an increase in the blockage ratio; the distribution of droplets became more concentrated, and the pixel size occupied in the image became smaller. The observed changing trend of the droplet distribution in the radial direction was consistent with the trend in the flow direction. Thus, the droplet concentration gradually decreased with an increase in the blockage ratio. At the same time, with an increase in the blockage ratio, the peak of the droplet concentration in the radial direction moved to a place with a larger radial distance. The reason for this is because as the stabilizer’s blockage ratio increased, the droplet concentration distribution gradually converged to a place with a larger radial distance.
Under a mixing distance of L = 150 mm, blockage ratio of ε = 0.3, and spanwise distance of y = 0 mm, three groups of nozzle diameters were changed to obtain the spatial distributions of droplet concentrations under different nozzle diameters.
The spatial distributions of the droplet concentrations under different nozzle diameters are depicted in Figure 16b. It was found that with an increase in nozzle diameter, the mass of liquid flowing out at the same time increased, and the spatial concentration of droplets gradually increased.
Figure 17c,d show the spatial distributions of the droplet concentrations along the flow and the radial directions under different nozzle diameters. Changing the nozzle diameter affected the nozzle’s outlet flow under the same pressure. When the nozzle diameter increased from 0.3 mm to 0.4 mm, the flow change was smaller than when increasing the nozzle diameter from 0.4 mm to 0.5 mm. From the flow direction concentration distribution curve, it is evident that the concentration along the flow direction gradually increased with an increase in the nozzle diameter. However, when the nozzle diameter increased from 0.3 mm to 0.4 mm, the flow increment became smaller than when the nozzle diameter increased from 0.4 mm to 0.5 mm, which is consistent with the results that were measured by the nozzle flow characteristic curve. Accordingly, the droplet concentration distribution in the radial direction also showed the same trend as that in the flow direction.

4. Conclusions

The penetration depth of the fuel jet changed in the spanwise direction when the fuel was injected laterally. Among the influencing factors, the liquid–gas momentum ratio played a significant role in the penetration depth of the fuel jet, and the Weber number of the gas also affected the jet penetration depth of the fuel jet. With an inflow temperature increase, the fuel trajectory’s separation point moved backwards, and the inhibition effect of the temperature on the fuel jet decreased. With a flow velocity increase, the fuel jet’s penetration depth decreased, but the change rate slowed down. As the fuel supply pressure difference increased, the fuel jet trajectory increased, but the change rate slowed down. For different injection angles, the main influence factor was the separated liquid–gas momentum ratio along the Y direction. The larger the nozzle diameter, the larger the mass volume of the liquid column micro-element, and the greater the penetration depth of the fuel jet. According to the results of previous research, the spanwise distribution range LY of the liquid fuel at the front edge of the stabilizer was fitted on the basis of an empirical formula, and the influences of various parameters on the liquid fuel distribution were quantitatively analyzed. The inflow velocity has the greatest influence.
The gaseous fuel was concentrated in the stabilizer’s front edge, the wall surface, and the recirculation zone in the combustion chamber, when the fuel was injected laterally. Moreover, the gaseous fuel was distributed symmetrically in the cross section behind the stabilizer, while liquid fuel was distributed and concentrated on the upper and lower sides of the stabilizer. With an increase in the inflow temperature, the fuel evaporation increased, and the distribution range of gaseous fuel increased correspondingly. The larger the inflow velocity, the smaller the local fuel–air ratio after the stabilizer, and the smaller the spanwise distribution. With an increase in fuel supply pressure difference, the distribution range of gaseous fuel in the spanwise direction became larger. When the mixing distance exceeded 180 mm, the fuel distribution changed little, and the distribution range of the reverse spraying at the same angle was larger than the forward spraying. The droplet concentration increased initially, and then decreased in the flow direction. In the radial direction, with an increase in the radial distance, there were two concentration peaks at the intersection of the recirculation zone, the main flow area, and the corresponding positions of the main flow area.
This paper’s current limitation is that the fuel jet trajectory research was based on the DPM discrete phase model. Although capturing the external trajectory was relatively accurate, it could not obtain the breakup details of the fuel liquid column. In future studies, the breakup details of the fuel jet should be studied and analyzed on the basis of the CLSVOF method.

Author Contributions

Conceptualization, K.W. and F.L.; methodology, K.W. and F.P.; software, F.P.; validation, F.P. and F.L.; formal analysis, F.P.; investigation, F.L.; resources, F.L.; data curation, F.P.; writing—original draft preparation, K.W.; writing—review and editing, K.W.; visualization, K.W. and F.P.; funding acquisition, F.L. All authors have read and agreed to the published version of the manuscript.

Funding

This research was supported by the National Science and Technology Major Project (2017-III-0006-0031 and J2019-III-0002-0045).

Acknowledgments

The authors would like to express their gratitude to EditSprings (https://www.editsprings.cn accessed on 5 September 2022) for the expert linguistic services provided.

Conflicts of Interest

The authors declare no conflict of interest.

References

  1. Clenci, A.; Berquez, J.; Stoica, R.; Niculescu, R.; Cioc, B.; Zaharia, C.; Iorga-Simăn, V. Experimental Investigation of the Effect of an Afterburner on the Light-off Performance of an Exhaust after-Treatment System. Energy Rep. 2022, 8, 406–418. [Google Scholar] [CrossRef]
  2. Luo, S.; Feng, Y.; Song, J.; Xu, D.; Xia, K. Progress and Challenges in Exploration of Powder Fueled Ramjets. Appl. Therm. Eng. 2022, 213, 118776. [Google Scholar] [CrossRef]
  3. Wang, K.; Li, F.; Zhao, K.; Zhou, T. Numerical Study on the Lobed Nozzles for Enhancing the Mixing and Combustion Performance of Rocket-Based Combined Cycle Engine. Energy Rep. 2022, 8, 6645–6658. [Google Scholar] [CrossRef]
  4. Han, Y.; Shen, C.; Du, Z.; Tang, H. Numerical Study of the Induced Shock on the Mixing Augmentation of Hydrogen Counter-Flow Jet in the Supersonic Flow. Aerospace 2022, 9, 506. [Google Scholar] [CrossRef]
  5. Chang, M.; Park, S. Spray Characteristics of Direct Injection Injectors with Different Nozzle Configurations under Flash-Boiling Conditions. Int. J. Heat Mass Transf. 2020, 159, 120104. [Google Scholar] [CrossRef]
  6. Yang, X.; Fan, W.; Zhang, R. Experimental Investigations on Aviation Kerosene Multi-Jets in High Temperature and Low Pressure Air Crossflow. Fuel 2022, 324, 124828. [Google Scholar] [CrossRef]
  7. Guo, J.P.; Wang, Y.B.; Bai, F.Q.; Du, Q. Unstable Breakup of a Power-Law Liquid Fuel Jet in the Presence of a Gas Crossflow. Fuel 2020, 263, 116606. [Google Scholar] [CrossRef]
  8. Kazemi Seresht, S.; Mohammadi, A. Liquid Fuel Distribution in the Combustion Chamber by Jet Impingement on Small Cylindrical Obstacles. Fuel 2021, 304, 121387. [Google Scholar] [CrossRef]
  9. Chang, J.; He, L.; Chen, L.; Shen, Z.; Chuah, L.F.; Bokhari, A.; Klemeš, J.J.; Han, N. Numerical Simulation of Liquid Jet Atomization in Subsonic Crossflow. Energy 2022, 257, 124676. [Google Scholar] [CrossRef]
  10. Yong, S.H.; Yu, I.J. The Penetration Characteristics of Normally Injected Kerosene Liquid Jet in High Weber Number Flow. In Proceedings of the AIAA/ASME/SAE/ASEE Joint Propulsion Conference & Exhibit, Denver, CO, USA, 2–5 August 2009. [Google Scholar]
  11. Ragucci, R.; Bellofiore, A.; Cavaliere, A. Breakup and Breakdown of Bent Kerosene Jets in Gas Turbine Conditions. Proc. Combust. Inst. 2007, 31, 2231–2238. [Google Scholar] [CrossRef]
  12. Birouk, M.; Iyogun, C.O.; Popplewell, N. Role of Viscosity on Trajectory of Liquid Jets in a Cross-Airflow. At. Sprays 2007, 17, 267–287. [Google Scholar] [CrossRef]
  13. Sallam, K.A.; Ng, C.L.; Sankarakrishnan, R.; Aalburg, C.; Lee, K. Breakup of Turbulent and Non-Turbulent Liquid Jets in Gaseous Crossflows. Collect. Tech. Pap. 44th AIAA Aerosp. Sci. Meet. 2006, 24, 18081–18093. [Google Scholar] [CrossRef] [Green Version]
  14. Wang, Q.; Mondragon, U.M.; Brown, C.T.; McDonell, V.G. Characterization of Trajectory, Break Point, and Break Point Dynamics of a Plain Liquid Jet in a Crossflow. At. Sprays 2011, 21, 203–219. [Google Scholar] [CrossRef]
  15. Lubarsky, E.; Shcherbik, D.; Bibik, O.; Gopala, Y.; Zinn, B.T. Fuel Jet in Cross Flow—Experimental Study of Spray Characteristics. Adv. Fluid Dyn 2012, 59, 60–80. [Google Scholar] [CrossRef]
  16. Chen, T.H.; Smith, C.R.; Schommer, D.G.; Nejad, A. Multi-zone behavior of transverse liquid jet in high-speed flow. In Proceedings of the 31st AIAA Aerospace Sciences Meeting and Exhibit, Reno, NV, USA, 11–14 January 1992. [Google Scholar]
  17. Inoue, C.; Watanabe, T.; Himeno, T.; Uzawa, S. Numerical and Experimental Study on Liquid Jet Atomization at Near-Field of Coaxial Type Injector. In Proceedings of the AIAA/ASME/SAE/ASEE Joint Propulsion Conference & Exhibit, San Diego, CA, USA, 31 July–3 August 2013. [Google Scholar]
  18. Lin, K.C.; Kennedy, P.; Jackson, T. Penetration heights of liquid jets in high-speed crossflows. In Proceedings of the 40th AIAA Aerospace Sciences Meeting & Exhibit, Reno, NV, USA, 14–17 January 2002. [Google Scholar]
  19. Stenzler, J.N.; Lee, J.G.; Santavicca, D.A.; Lee, W. Penetration of Liquid Jets in a Crossflow. At. Sprays 2013, 16, 887–906. [Google Scholar] [CrossRef]
  20. Sasaki, M.; Takahashi, M.; Sakamoto, H.; Kumakawa, A.; Yatsuyanagi, N.; Sei, M.; Yoshimura, K.; Inamura, T. Spray and Combustion Characteristics of a Liquid-fueled Ramjet Combustor. Tech. Rep. Natl. Aerosp. Lab. 1998, 1349, 860–868. [Google Scholar]
  21. Joshi, P.B.; Schetz, J.A. Effect of Injector Shape on Penetration and Spread of Liquid Jets. Aiaa J. 2015, 13, 1137–1138. [Google Scholar] [CrossRef]
  22. Horn, K.P.; Kolpin, M.A.; Reichenbach, R.E. A study of penetration of a liquid injectant into a supersonic flow. Aiaa J. 2015, 6, 39. [Google Scholar]
  23. Tambe, S.B.; Elshamy, O.M.; Jeng, S.M. Liquid Jets Injected Transversely into a Shear Layer. In Proceedings of the Aiaa Aerospace Sciences Meeting & Exhibit, Reno, NV, USA, 8–11 January 2013. [Google Scholar]
  24. Olinger, D.; Sallam, K.; Lin, K.C.; Carter, C. Effects of GLR on the Spray in the Near-Injector Region of Aerated Liquid Jets in Crossflow. In Proceedings of the 47th AIAA Aerospace Sciences Meeting including The New Horizons Forum and Aerospace Exposition, Orlando, FL, USA, 5–8 January 2009. [Google Scholar]
  25. Chin, J.S.; Durrett, R.; Lefebvre, A.H. The study on the interdependence of spray characteristics and evaporation history of fuel spray in high temperature air crossflow-22nd Joint Propulsion Conference (AIAA). J. Eng. Gas Turbines Power 1984, 106, 639–644. [Google Scholar] [CrossRef]
  26. Cao, M. Semi-Empirical Analysis of Liquid Fuel Distribution Downstream of a Plain Orifice injector Under Cross-Stream Air Flow. J. Eng. Gas Turbines Power 1982, 104, 788–795. [Google Scholar] [CrossRef]
  27. Lovett, J.A.; Ahmed, K.; Bibik, O.; Smith, A.G.; Lubarsky, E.; Menon, S.; Zinn, B.T. On the Influence of Fuel Distribution on the Flame Structure of Bluff-Body Stabilized Flames. J. Eng. Gas Turbines Power 2014, 136, V01BT04A069. [Google Scholar] [CrossRef]
  28. Shanjian, G.; Jian, W.; Maolin, Y.; Yong, H. Calculation of two—phase fuel distribution in afterburner flameholder plane. J. Aerosp. Power 1993, 8, 134–137. [Google Scholar]
Figure 1. Schematic diagram of the calculation domain model.
Aerospace 09 00637 g001
Figure 2. Schematic diagram of the calculation domain model.
Aerospace 09 00637 g002
Figure 3. Axial velocity and fuel concentration distribution under different grid numbers.
Aerospace 09 00637 g003
Figure 4. Comparison between numerical simulation results and experimental results.
Aerospace 09 00637 g004
Figure 5. Schematic diagram of the experimental system.
Aerospace 09 00637 g005
Figure 6. Schematic diagram of experimental section and photos of the experimental device.
Aerospace 09 00637 g006
Figure 7. Comparison diagram of the jet’s external trajectory under different temperatures and fuel supply pressure differences.
Aerospace 09 00637 g007
Figure 8. Comparison diagram of the jet’s external trajectory under different inflow velocities and injection angles.
Aerospace 09 00637 g008
Figure 9. Comparison diagram of the jet’s external trajectory under different nozzle diameters.
Aerospace 09 00637 g009
Figure 10. Comparison between fitting results and simulation results.
Aerospace 09 00637 g010
Figure 11. The influence of inflow velocity on the mass fraction of gaseous fuel of different sections.
Aerospace 09 00637 g011
Figure 12. The influence of inflow temperature on the mass fraction of gaseous fuel of different sections.
Aerospace 09 00637 g012
Figure 13. Flow field photography using PIV technology, and velocity contours by experiment.
Aerospace 09 00637 g013
Figure 14. Spatial distributions of droplet concentration.
Aerospace 09 00637 g014
Figure 15. Distributions of droplet concentrations along the flow direction and radial direction.
Aerospace 09 00637 g015
Figure 16. Spatial distributions of droplet concentrations.
Aerospace 09 00637 g016
Figure 17. Distributions of droplet concentrations along the flow direction and radial direction.
Aerospace 09 00637 g017
Table 1. The parameter variation ranges.
ParameterVariation Range
Inflow velocity (m/s)125, 150, 175, 200
Inflow temperature (K)400, 500, 600, 700, 800
Mixing distance (mm)120, 150, 170, 210, 240
Nozzle diameter (mm)0.4, 0.45, 0.5, 0.55, 0.6
Injection angle (°)30, 60, 90, 120, 150
Fuel supply pressure difference (MPa)0.3, 0.4, 0.5, 0.6
Blockage ratio (ε)0.25, 0.3, 0.35, 0.4
Table 2. Calculation conditions of the parameters affecting the jet trajectory.
Inflow
Temperature
(K)
Inflow
Velocity
(m/s)
Fuel Supply
Pressure
Difference (MPa)
Nozzle
Diameter (mm)
Injection
Angle (°)
Fuel
Velocity (m/s)
Fuel–Air
Momentum Ratio
Weber
Number
4001750.50.56025.65819587.52
5001750.50.56025.65823.75470.01
6001750.50.56025.65828.5391.68
7001750.50.56025.65833.25335.72
8001750.50.56025.65838293.76
8001250.50.56025.65874.48149.88
8001500.50.56025.65851.72215.82
8002000.50.56025.65829.09383.68
8001750.30.56019.80522.64293.76
8001750.40.56022.86930.19293.76
8001750.60.56028.00945.28293.76
8001750.50.53025.65838293.76
8001750.50.54525.65838293.76
8001750.50.59025.65838293.76
8001750.50.512025.65838293.76
8001750.50.513525.65838293.76
8001750.50.515025.65838293.76
8001750.50.46025.65838293.76
8001750.50.66025.65838293.76
8001750.50.76025.65838293.76
Table 3. The parameter variation ranges.
ParameterVariation Range
Fuel supply pressure difference (MPa)0.3, 0.4, 0.5, 0.6, 0.7
Mixing distance L (mm)150, 180, 210, 240
Blockage ratio (ε)0.3, 0.35, 0.4
Nozzle diameter (mm)0.3, 0.4, 0.5
Publisher’s Note: MDPI stays neutral with regard to jurisdictional claims in published maps and institutional affiliations.