1. Introduction
With the evolution of algorithms and computers, the aerodynamic performance evaluation of aerospace vehicles by computational fluid dynamics (CFD) has become a requisite tool. It is used not only in research but also in actual design to shorten the design process. Integrating with machine learning has recently been improving both the accuracy and speed of CFD [
1]. However, the Navier–Stokes equations, which are the governing equations, are not mathematically guaranteed to have analytical solutions; to apply various modelings such as temporal and spatial discretization and turbulence phenomena is to derive approximate solutions. Even now, the use of experimental fluid dynamics (EFD) is vital to ensure the quality of CFD solutions. In contrast, EFD also introduces deviations from free-stream conditions, such as test chamber airflow alignment, wall interference, and Reynolds number effects on aerodynamic performance due to the scale of the model. Both CFD and EFD are not ideal methodologies and are complementary to each other [
2].
One of the problems of EFD, when applied to the design of pragmatic products, is data productivity [
3]. Unlike changing the entire model’s angle for uniform flow, altering the configuration of a part of the model, such as control surfaces, must be implemented manually, with ventilation stopped in many cases. Since not many institutes have wind tunnel test (WTT) facilities, the demand and supply are not in balance; the experimental period allotted for a test is a few weeks at most. Thus, usual facilities have no choice but to prioritize the test conditions to be conducted; the best they can accomplish is to obtain discrete data. Hence, it is naturally challenging to secure enough data for statistical analyses on the data’s reliability. Furthermore, dimensionality reduction for aerodynamic data acquired by WTT [
4] must work better when the data set is generated consecutively/automatically rather than discrete/manually, regardless of any data reduction methods.
A system has been developed previously, incorporating actuators inside the National Advisory Committee for Aeronautics (NACA) 0018 WTT model and deflecting the flap by remote control to solve this problem [
5]. This system achieved the precise input deflection angle on the model by adding feedback control with optical measurement. However, since the previous research’s primary purpose was to validate the above idea’s functionality, a WTT model was sized and manufactured according to the size of the commercial actuator. In contrast, the present study installed this system in the existent WTT model to procure aerodynamic data and assess its accuracy. Therefore, the new system specially ordered the motor to be incorporated and aimed the model’s internal mechanism to be the most compact.
The target WTT model will be usually experimented upon with the whole body. However, this study retains only the 3D wing that was fitted with the remote and feedback control system. The first experiment gained aerodynamic data by consecutive deflection angle change several times to validate the reproducibility and investigate the reliability by comparing it with the conventional stepwise deflection angle adjustment. Moreover, the second experiment tested this system to investigate if the hysteresis emerged by continuously acquiring the three force aerodynamic components. The objective is to ensure aerodynamic data’s reliability along the continuous deflection angle shift, ameliorate data gaining capability in WTTs, and enhance the WTT into a device for study of complex physical phenomena.
This paper is structured as follows:
Section 2 outlines the wind tunnel model for aerodynamic data acquisition, the remote-controlled drive mechanism incorporated in the model, and the feedback control based on optical measurements to drive the mechanism.
Section 3 describes the measurement conditions for the aerodynamic data presented in this article.
Section 4 compiles and discusses the data obtained based on the conditions described in
Section 3. Finally,
Section 5 concludes this paper.
This paper refers to the WTT model as “wing” and the accompanying control surface as “flap”. The method of continuously acquiring aerodynamic data by rotating the flap at a constant angular speed is called “sweeping mode”. The conventional process of developing aerodynamic data for each configuration while stopping the flap once by once is named “stepwise mode”.
2. System Outline
WTTs were conducted using the Japan Aerospace Exploration Agency (JAXA) 0.65 m × 0.55 m low-turbulence wind tunnel, a closed-circuit type; the available speed range is from 5 to 50 m/s.
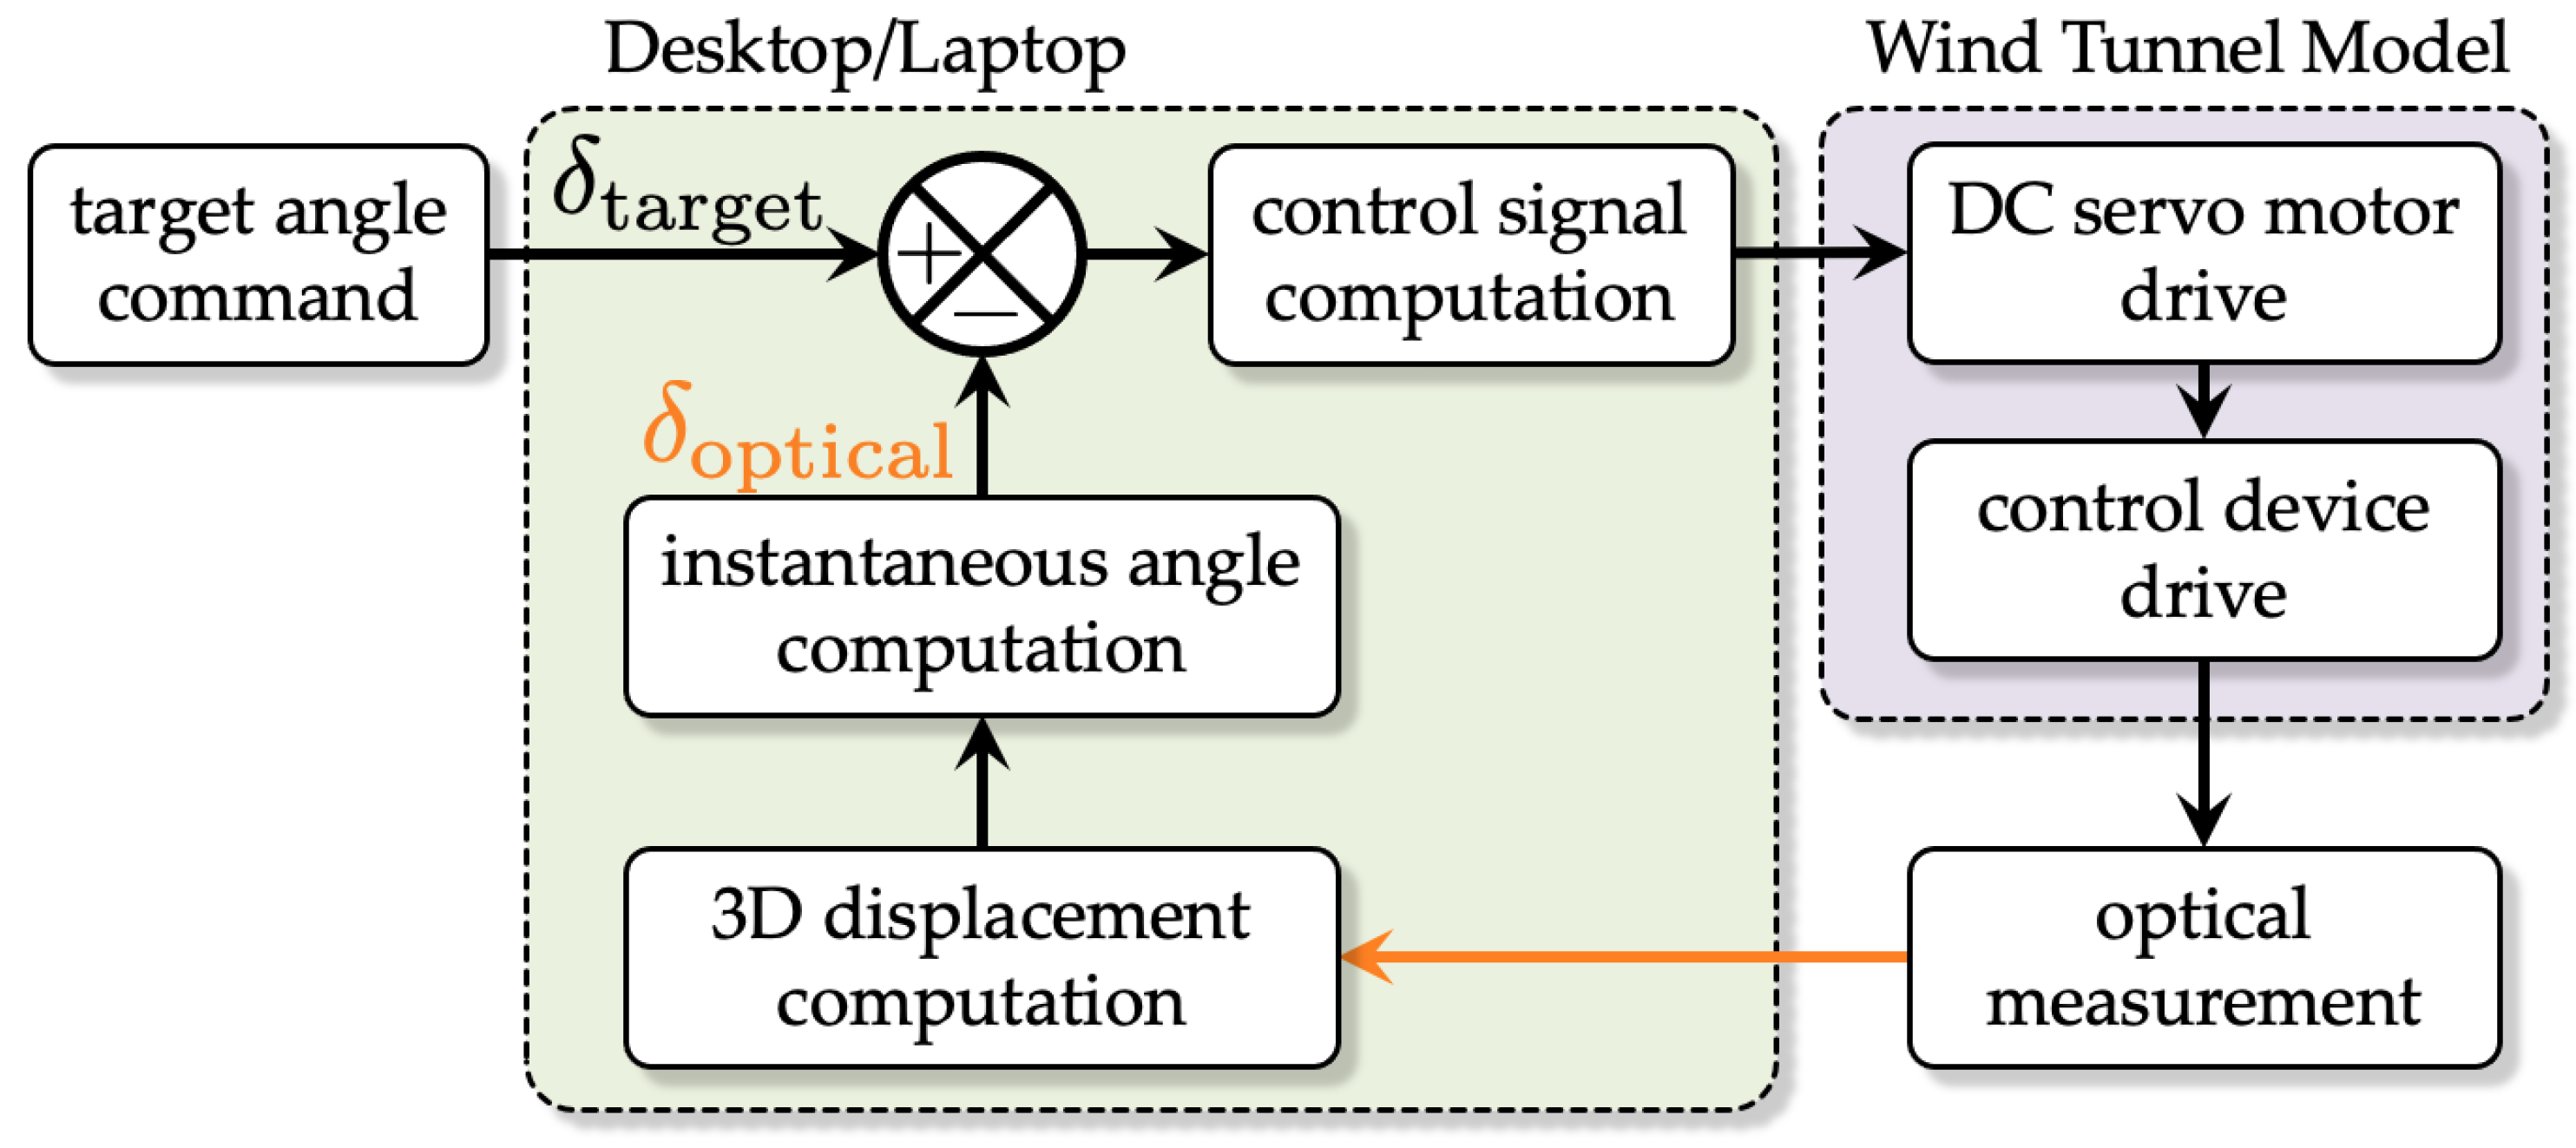
Figure 1 displays the composition of the remote and feedback control system used in this study. When the target deflection angle
is passed to the computer, the motor driver turns the direct current (DC) servo motor according to the required control amount, and the control surface rotates. The actual deflection angle
is defined as the average value of the deflection angles at each cross-section in the spanwise direction by 3D optical measurement. If the WTT models are completely rigid, the system identifies the identical angle for all cross-sections. However, since the optical measurement considers the deformation of the WTT model due to aerodynamic forces; the angles are not strictly equivalent. Therefore, this system performs feedback control until the difference between the calculated actual and the input deflection angles
fulfills
Since this comparison target would be the resolution of the DC servo motor, the threshold in Equation (
1) was set. The prior preparation was confirmed to work under the condition of Equation (
1) at wind off successfully. If the purpose is to compare the accuracy of positioning the flap deflection angle manually, the threshold in Equation (
1) should be supposed accordingly.
The following subsections outline the WTT model, the drive mechanism incorporated, the instruments used for optical measurements, and the apparatus used for aerodynamic force measurements.
2.1. Wind Tunnel Test Model
The object geometry of the WTT model required the following two conditions:
A symmetrical airfoil shape. After the validation of the aerodynamic forces measurement, this study assumes that hysteresis can be properly captured.
The thinnest 3D wing geometry among the transonic WTT models owned by JAXA. If the drive mechanism can be incorporated into the thinnest model, it can included in the mechanism in other models.
Therefore, the National Aeronautics and Space Administration (NASA) common research model (CRM) [
6] vertical tailplane 80% scale model [
7] was converted and modified for this study based on the above conditions.
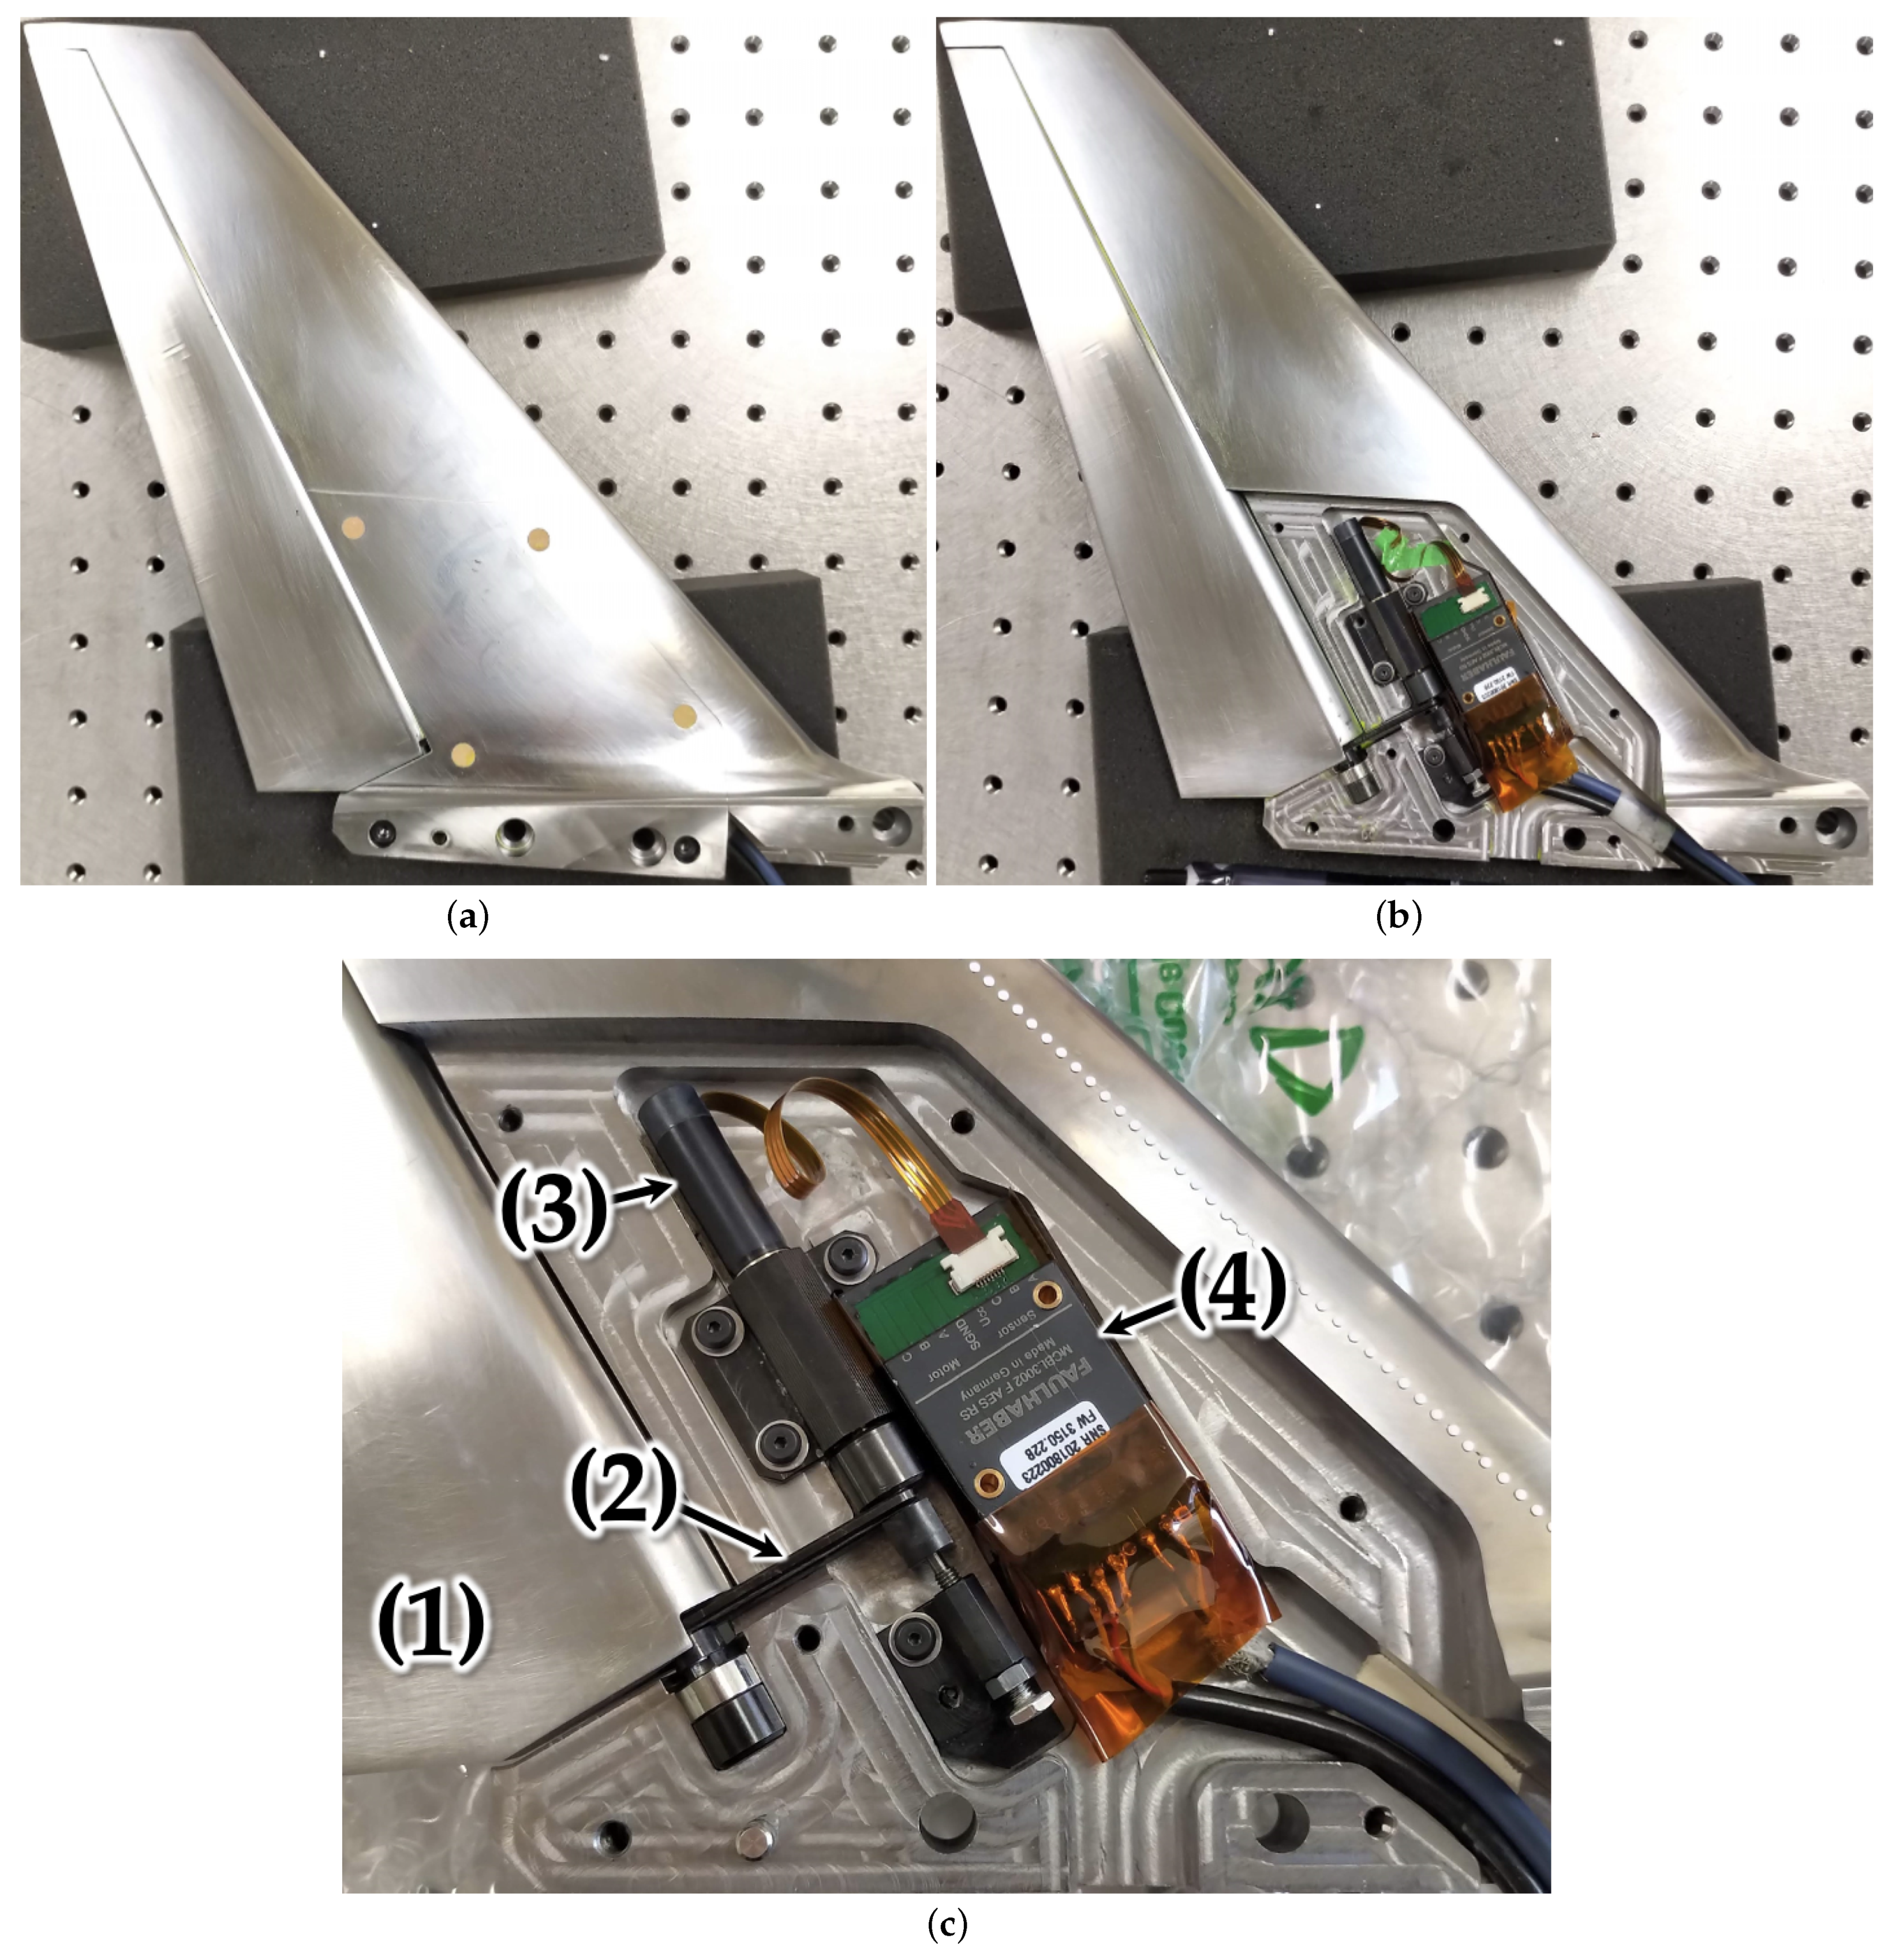
Figure 2a,b show the appearance of the WTT model and the drive mechanism, respectively.
Table 1 also summarizes the dimensions of the WTT model.
2.2. Drive Mechanism for Remote Control
The drive mechanism incorporated in the WTT model used the following two devices.
DC servo motor: 0824D012B AESM-4096 made by Faulhaber Minimotor SA (Croglio, Switzerland). The motor is equipped with an absolute encoder and gearhead. The motor’s starting torque is N·m, the maximum speed is 90,000 rpm, the encoder resolution is 0.088, and the gearhead reduction ratio is 1/650. In addition, the motor adopts a mechanism that eliminates backlash for high-precision positioning.
Motor controller: MCBL3002F AES made by Faulhaber Minimotor SA (Croglio, Switzerland).
2.3. Optical Measurement for Feedback Control
The control system was constructed based on the optical measurement apparatus used in the previous study [
5]. Note that the three apparatuses are modified for the current system.
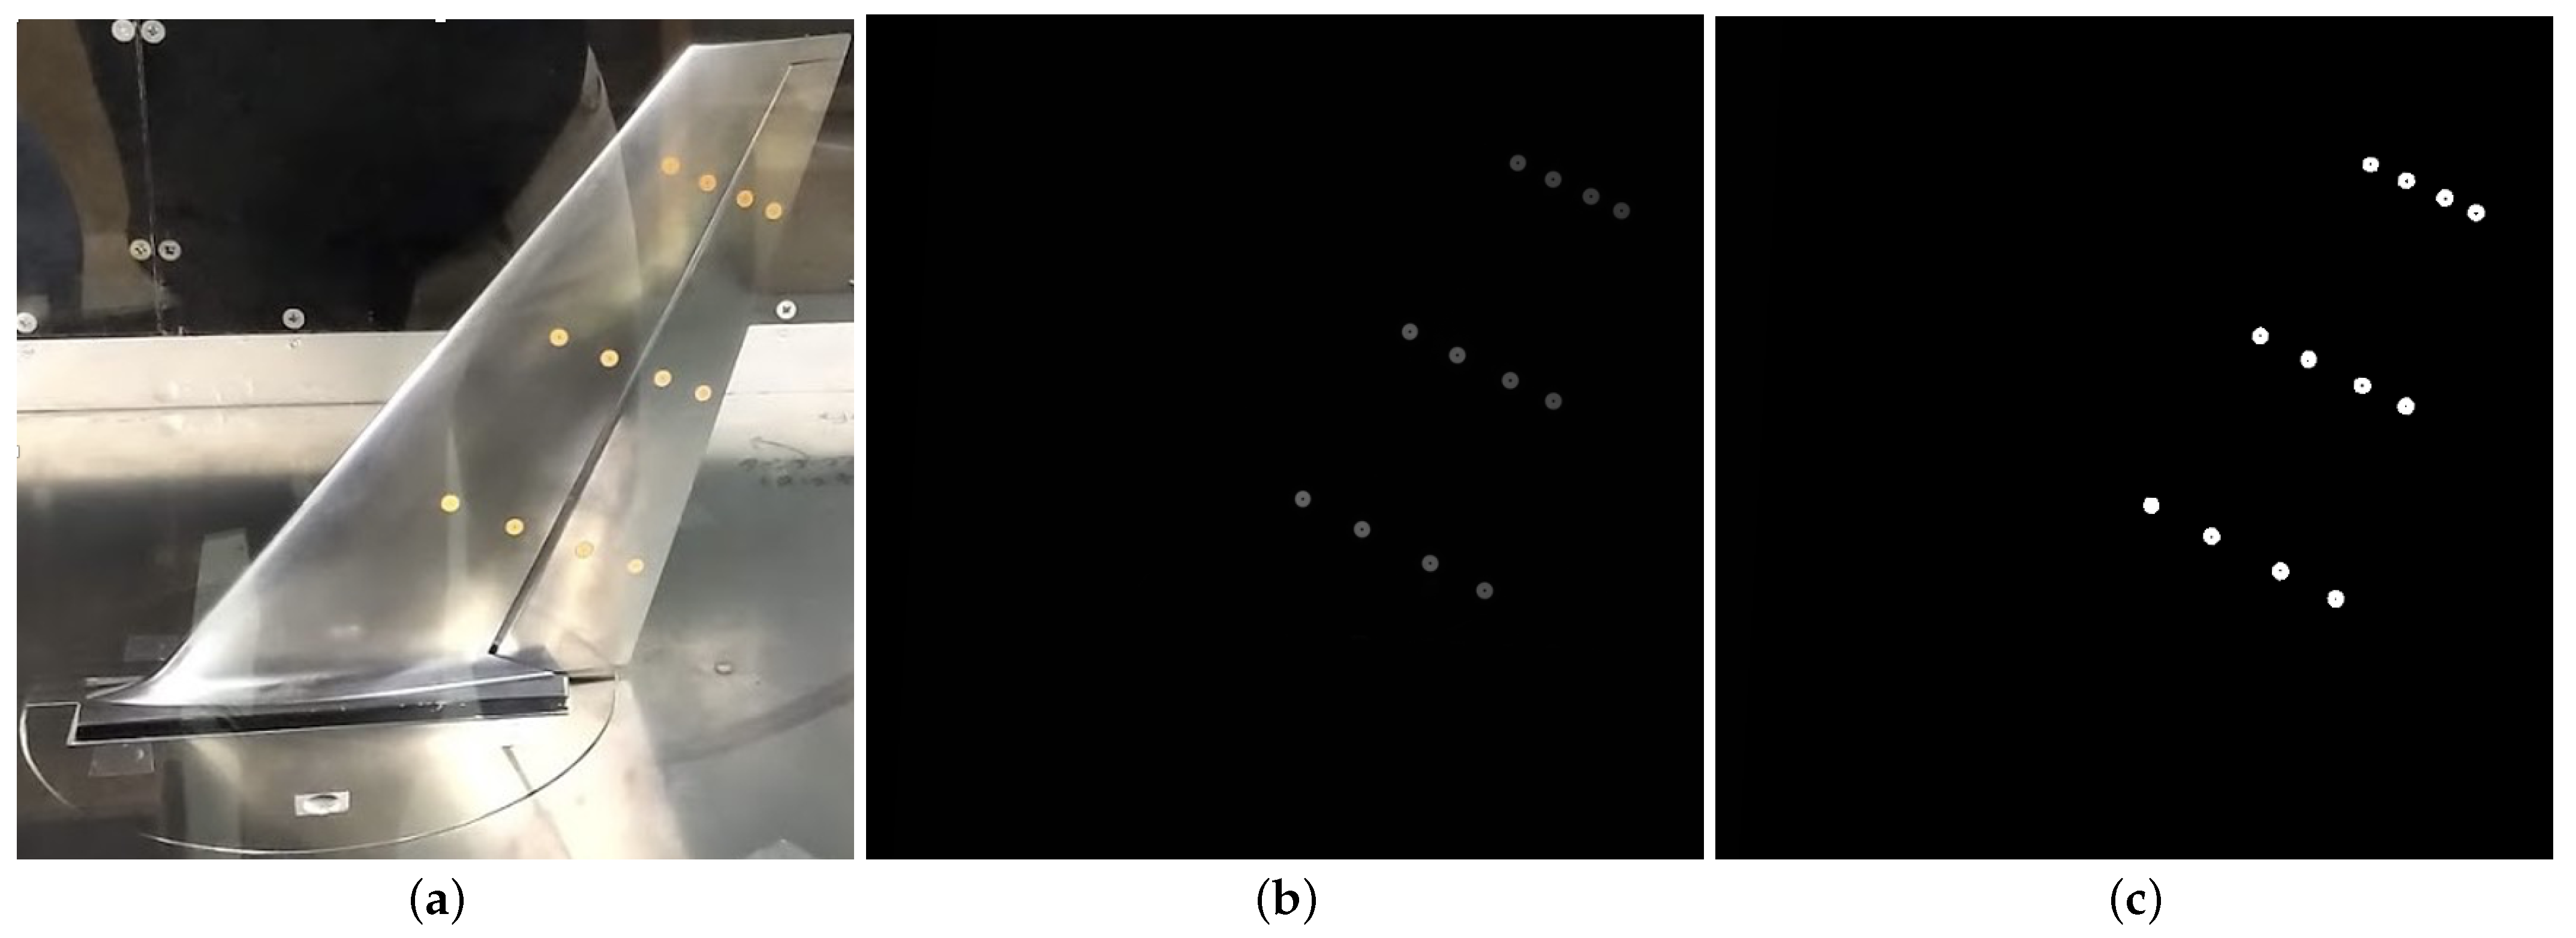
Marker: Optical measurements need markers attached to the WTT model surface. The number of circular markers was reduced from two to one per location and improved the model’s surface roughness. Moreover, the color was altered from black and white to fluorescent orange and changed the diameter from 8 to 9 mm to enhance the recognition rate of the camera.
Lighting device: Xenon light source developed by Hamamatsu Photonics K. K. (Hamamatsu, Shizuoka-prefecture, Japan). Since the marker’s color turned into fluorescent orange, a light emitting diode (LED) (300 mm square head) with a 460 mm wavelength was used to fit the optimal excitation wavelength of fluorescent orange.
Camera: Manta G-1236B made by Ad Science Inc. (Funabashi, Chiba-prefecture, Japan). The camera uses a Nikon F mount 24 mm lens to which a bandpass filter O56 was attached to suppress the influence of light emitted from sources other than the markers. In the consecutive sweeping mode, the frame rate was set to 8 fps.
Figure 3a shows the position and number of markers attached;
Figure 3b displays their appearance in the captured image;
Figure 3c exhibits them detected by image processing from the captured image. It can be seen that the system distinctly detects all the markers without any trouble.
2.4. Aerodynamic Measurement
As a result of preliminary examinations, the following equipment was selected to precisely acquire aerodynamic data in the consecutive sweeping mode.
Six-component balance: LMC-61359 made by NISSYO-ELECTRIC-WORKS CO., LTD. (Tokyo, Japan). The rated loads corresponding to lift coefficient (), drag coefficient (), and pitching moment coefficient () are ±50 N, ±50 N, and ±10 N·m, respectively.
DC amplifier: RS2603, made by Nippon Avionics Co. Ltd. (Yokohama, Japan), amplified the voltage output from the detector.
Manual secondary calibrator: CAL-200-3B-09 made by NISSYO-ELECTRIC-WORKS CO., LTD. (Tokyo, Japan). The nominal accuracy is ±0.2% FS (full scale).
Digital pressure gauge: MT210 made by Yokogawa Electric Co. (Tokyo, Japan).
I/O device: NI USB-6216 manufactured by National Instruments Co. (Austin, TX, USA).
Data were sampled at 1 kHz and organized into a time series with moving averages every 1 ms in the sweeping mode.
3. Problem Setting
First, the reliability of the aerodynamic data measured by this system was examined and the data accuracy depending on the driving conditions were determined. Based on the results, comprehensive aerodynamic data were obtained. After each data acquisition, flap alignment was performed to ensure that a single misalignment did not affect all test results.
3.1. Preliminary Attempt
Initially, data are acquired in the conventional stepwise mode to verify the accuracy of the system. Then, the data obtained in the sweeping mode were compared. The operational conditions for each mode are as follows:
stepwise mode
Uniform flow velocity : 40 m/s;
Angle of attack : ;
Deflection angle of flap : .
The angle near the limit where the flap can operate smoothly under the constant angular velocity of the flap in this model is 24. was placed in the order of , every 2. After the feedback control converges at each angle, the result is the average value of the data acquired for 10 s as the representative one.
Data were obtained for three round trips when one round trip was defined as starting the measurement at and returning to , viz., data were acquired for a total of six times, three times for the outward trip (from to ) and three times for the homeward trip (from to ) for each target angle.
sweeping mode
: 40 m/s;
: ;
.
is moved in the order of and is defined as one round trip, one experimental condition.
Angular velocity of flap has four cases: 0.8, 4.0, 8.0 and 16.0 /s.
Three measurements are taken under identical conditions.
3.2. Main Trial: Large-Scale Consecutive Acquisition of Aerodynamic Data
Based on the results obtained in the previous preliminary attempt, the uniform flow speed and the constant value of the flap angular velocity were set.
: 40 m/s;
every 2;
.
The data would be distinguished from of to (“down-wise route”) and those from of to (“up-wise route”) in this trial to investigate the hysteresis.
.
This test acquired only one reciprocating datum regarding to investigate disturbances involving the received raw data and actual measurement time.
4. Results
This section reveals the accuracy of the aerodynamic data procured by the constructed system. Then the section discusses the aerodynamic data acquired comprehensively by changing and .
4.1. Preliminary Attempt 1—Stepwise Mode
This test was performed under the conditions described in
Section 3.1 Preliminary Attempt 1. stepwise mode.
Figure 4 displays the
result of the preliminary attempt in the stepwise mode. This figure fills in the range of the six data taken at each
and depicts the average value in the plots and the standard deviation
. The error bars attached to these points indicate the nominal accuracy range of
FS due to the second-order calibrator. The results are physically unreasonable; this diagram is asymmetric for
. Moreover,
rises peculiarly at
. Therefore, it appears that
increases throughout
. This study ascribes this peculiar behavior to the precision of the WTT model fabrication because it occurs in all six experiments. The standard deviation
does not depend on
, but it becomes more prominent for
.
does not have such a divergence trend, which must be due to the adverse effect of the retracting lid of the drive mechanism. Experiments on this model before modifying it to incorporate the drive mechanism did not produce the asymmetry shown here. Thus, the wing is supposed not to be ideally vertically symmetrical due to the cover, which is attached only to the wing’s upper surface to house the drive mechanism. The clay used to fill in the screw holes and the unevenness of the lid shown in
Figure 2a must disrupt the boundary layer on the wing’s upper surface, resulting in unstable flow on the upper surface of the flap.
4.2. Preliminary Attempt 2—Sweeping Mode
This test was performed under the conditions described in
Section 3.1 Preliminary Attempt 2. sweeping mode.
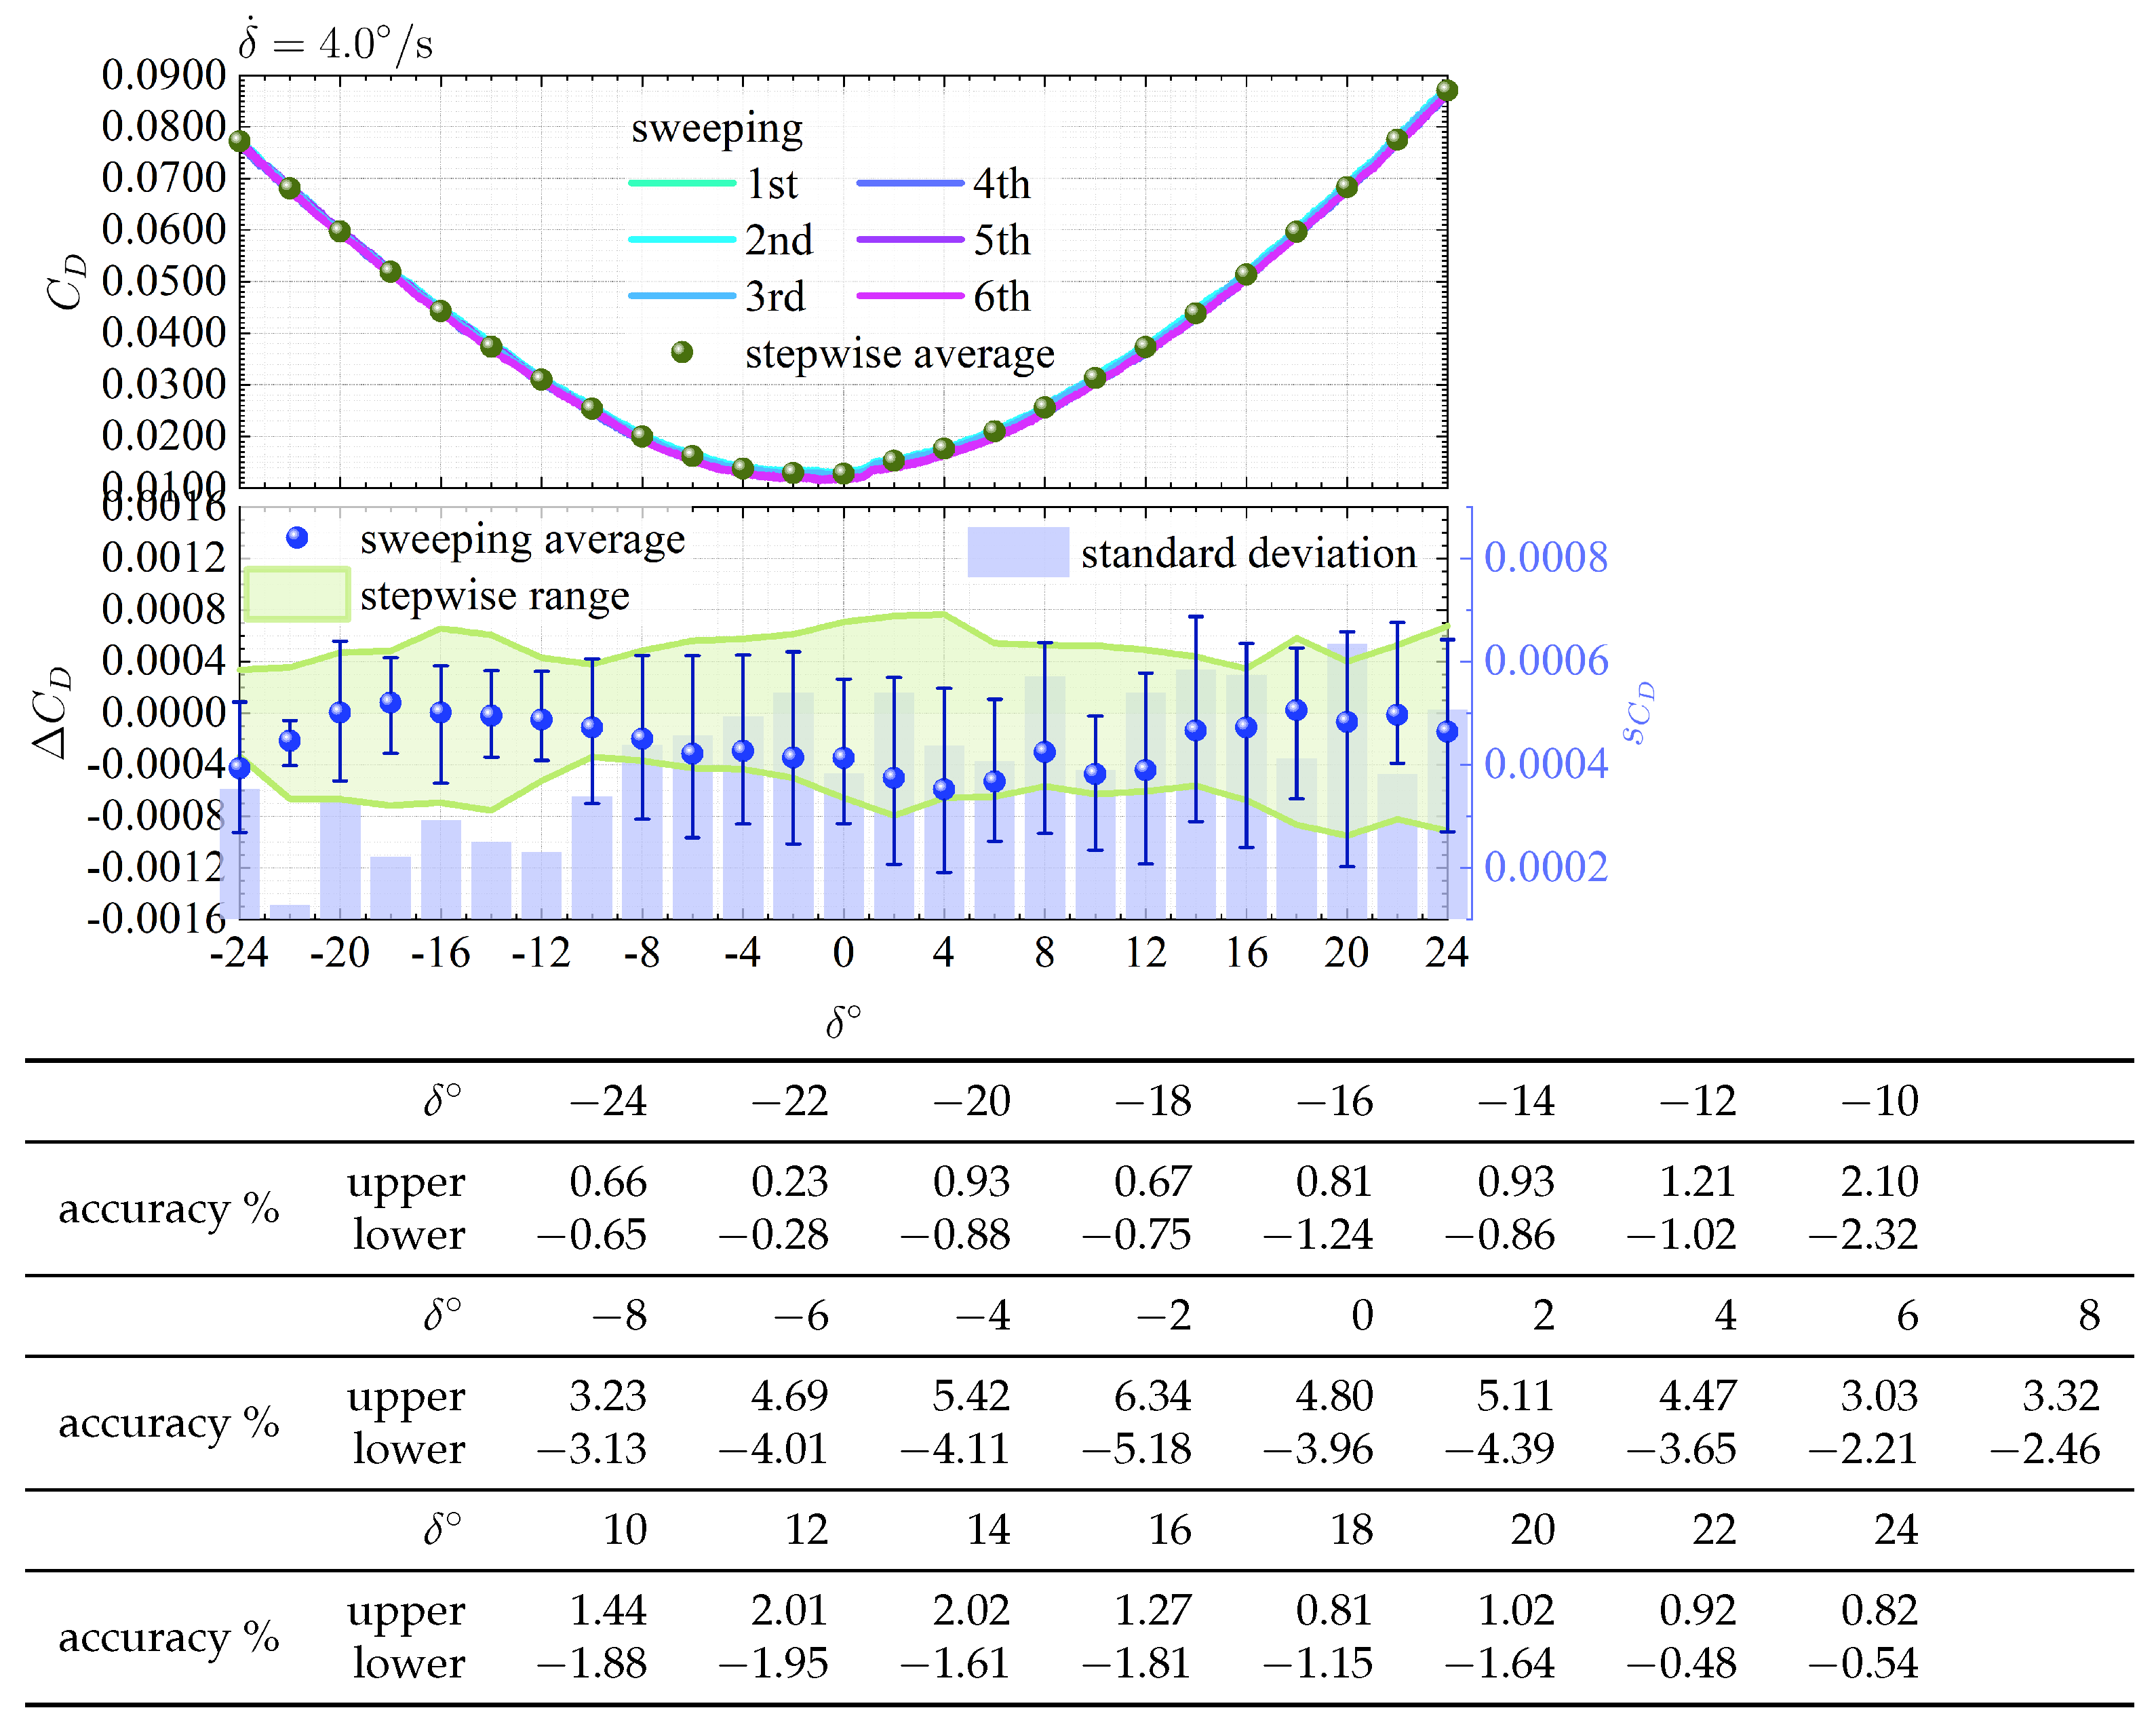
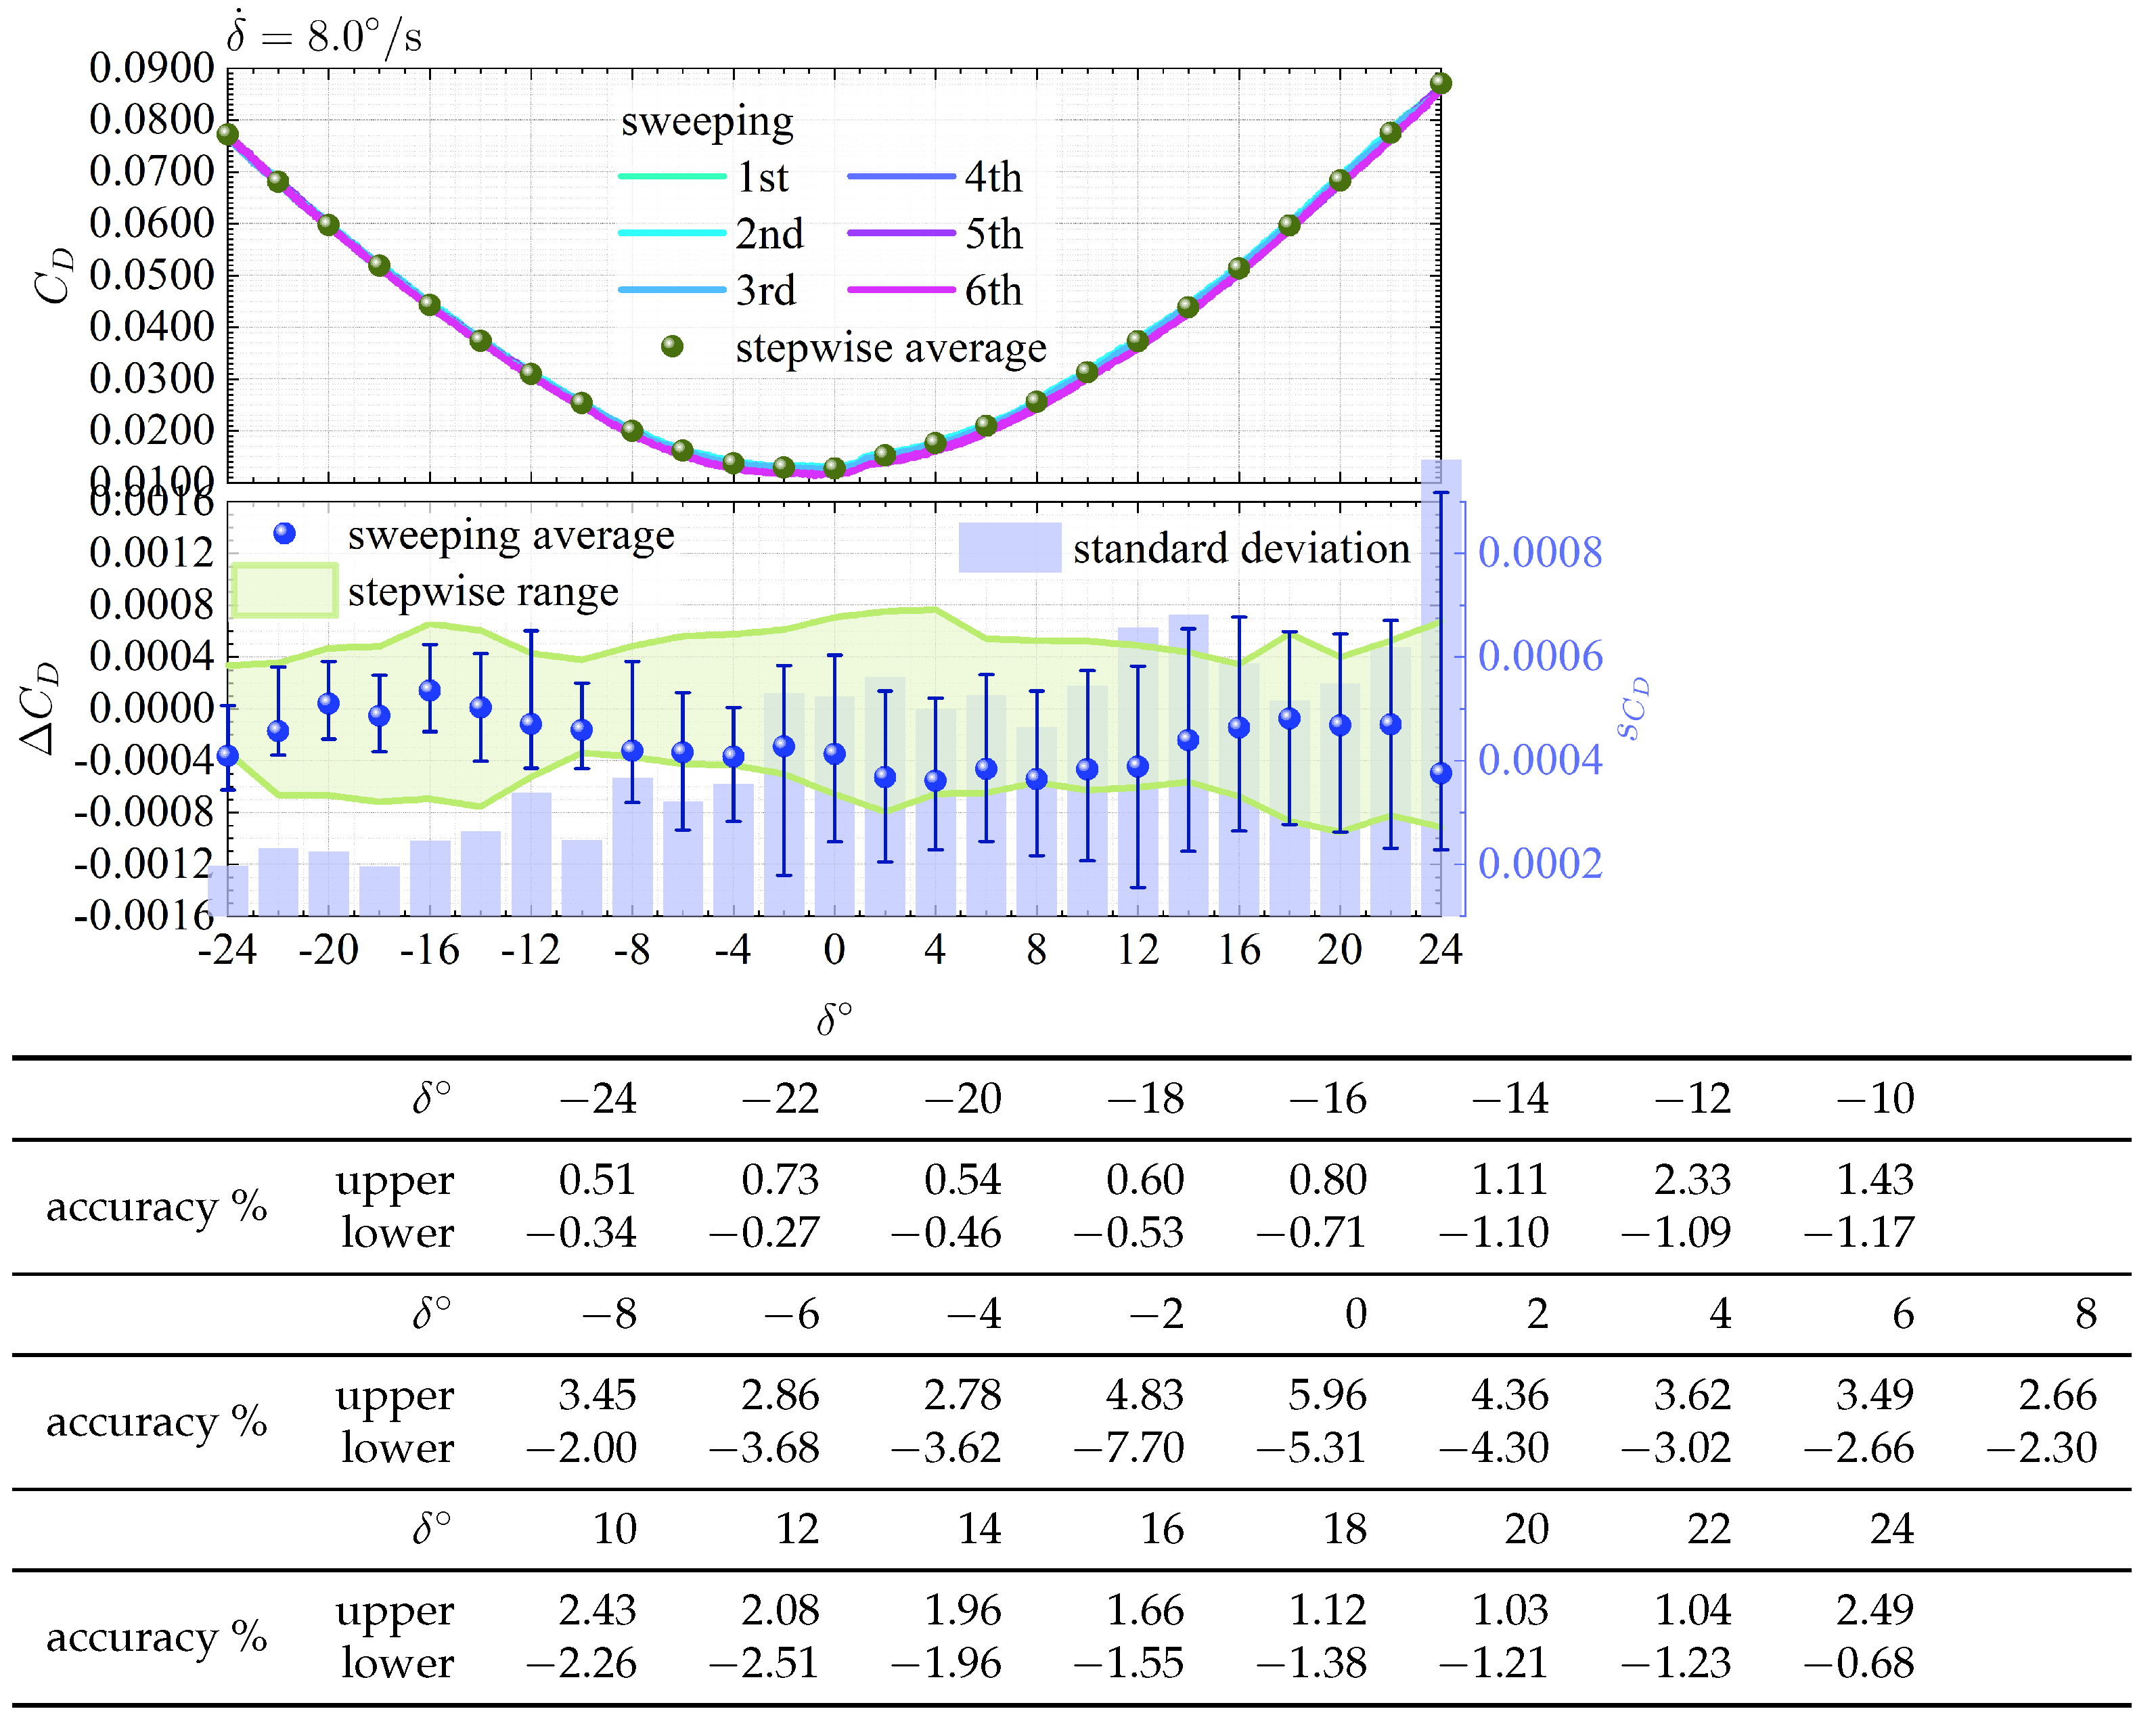
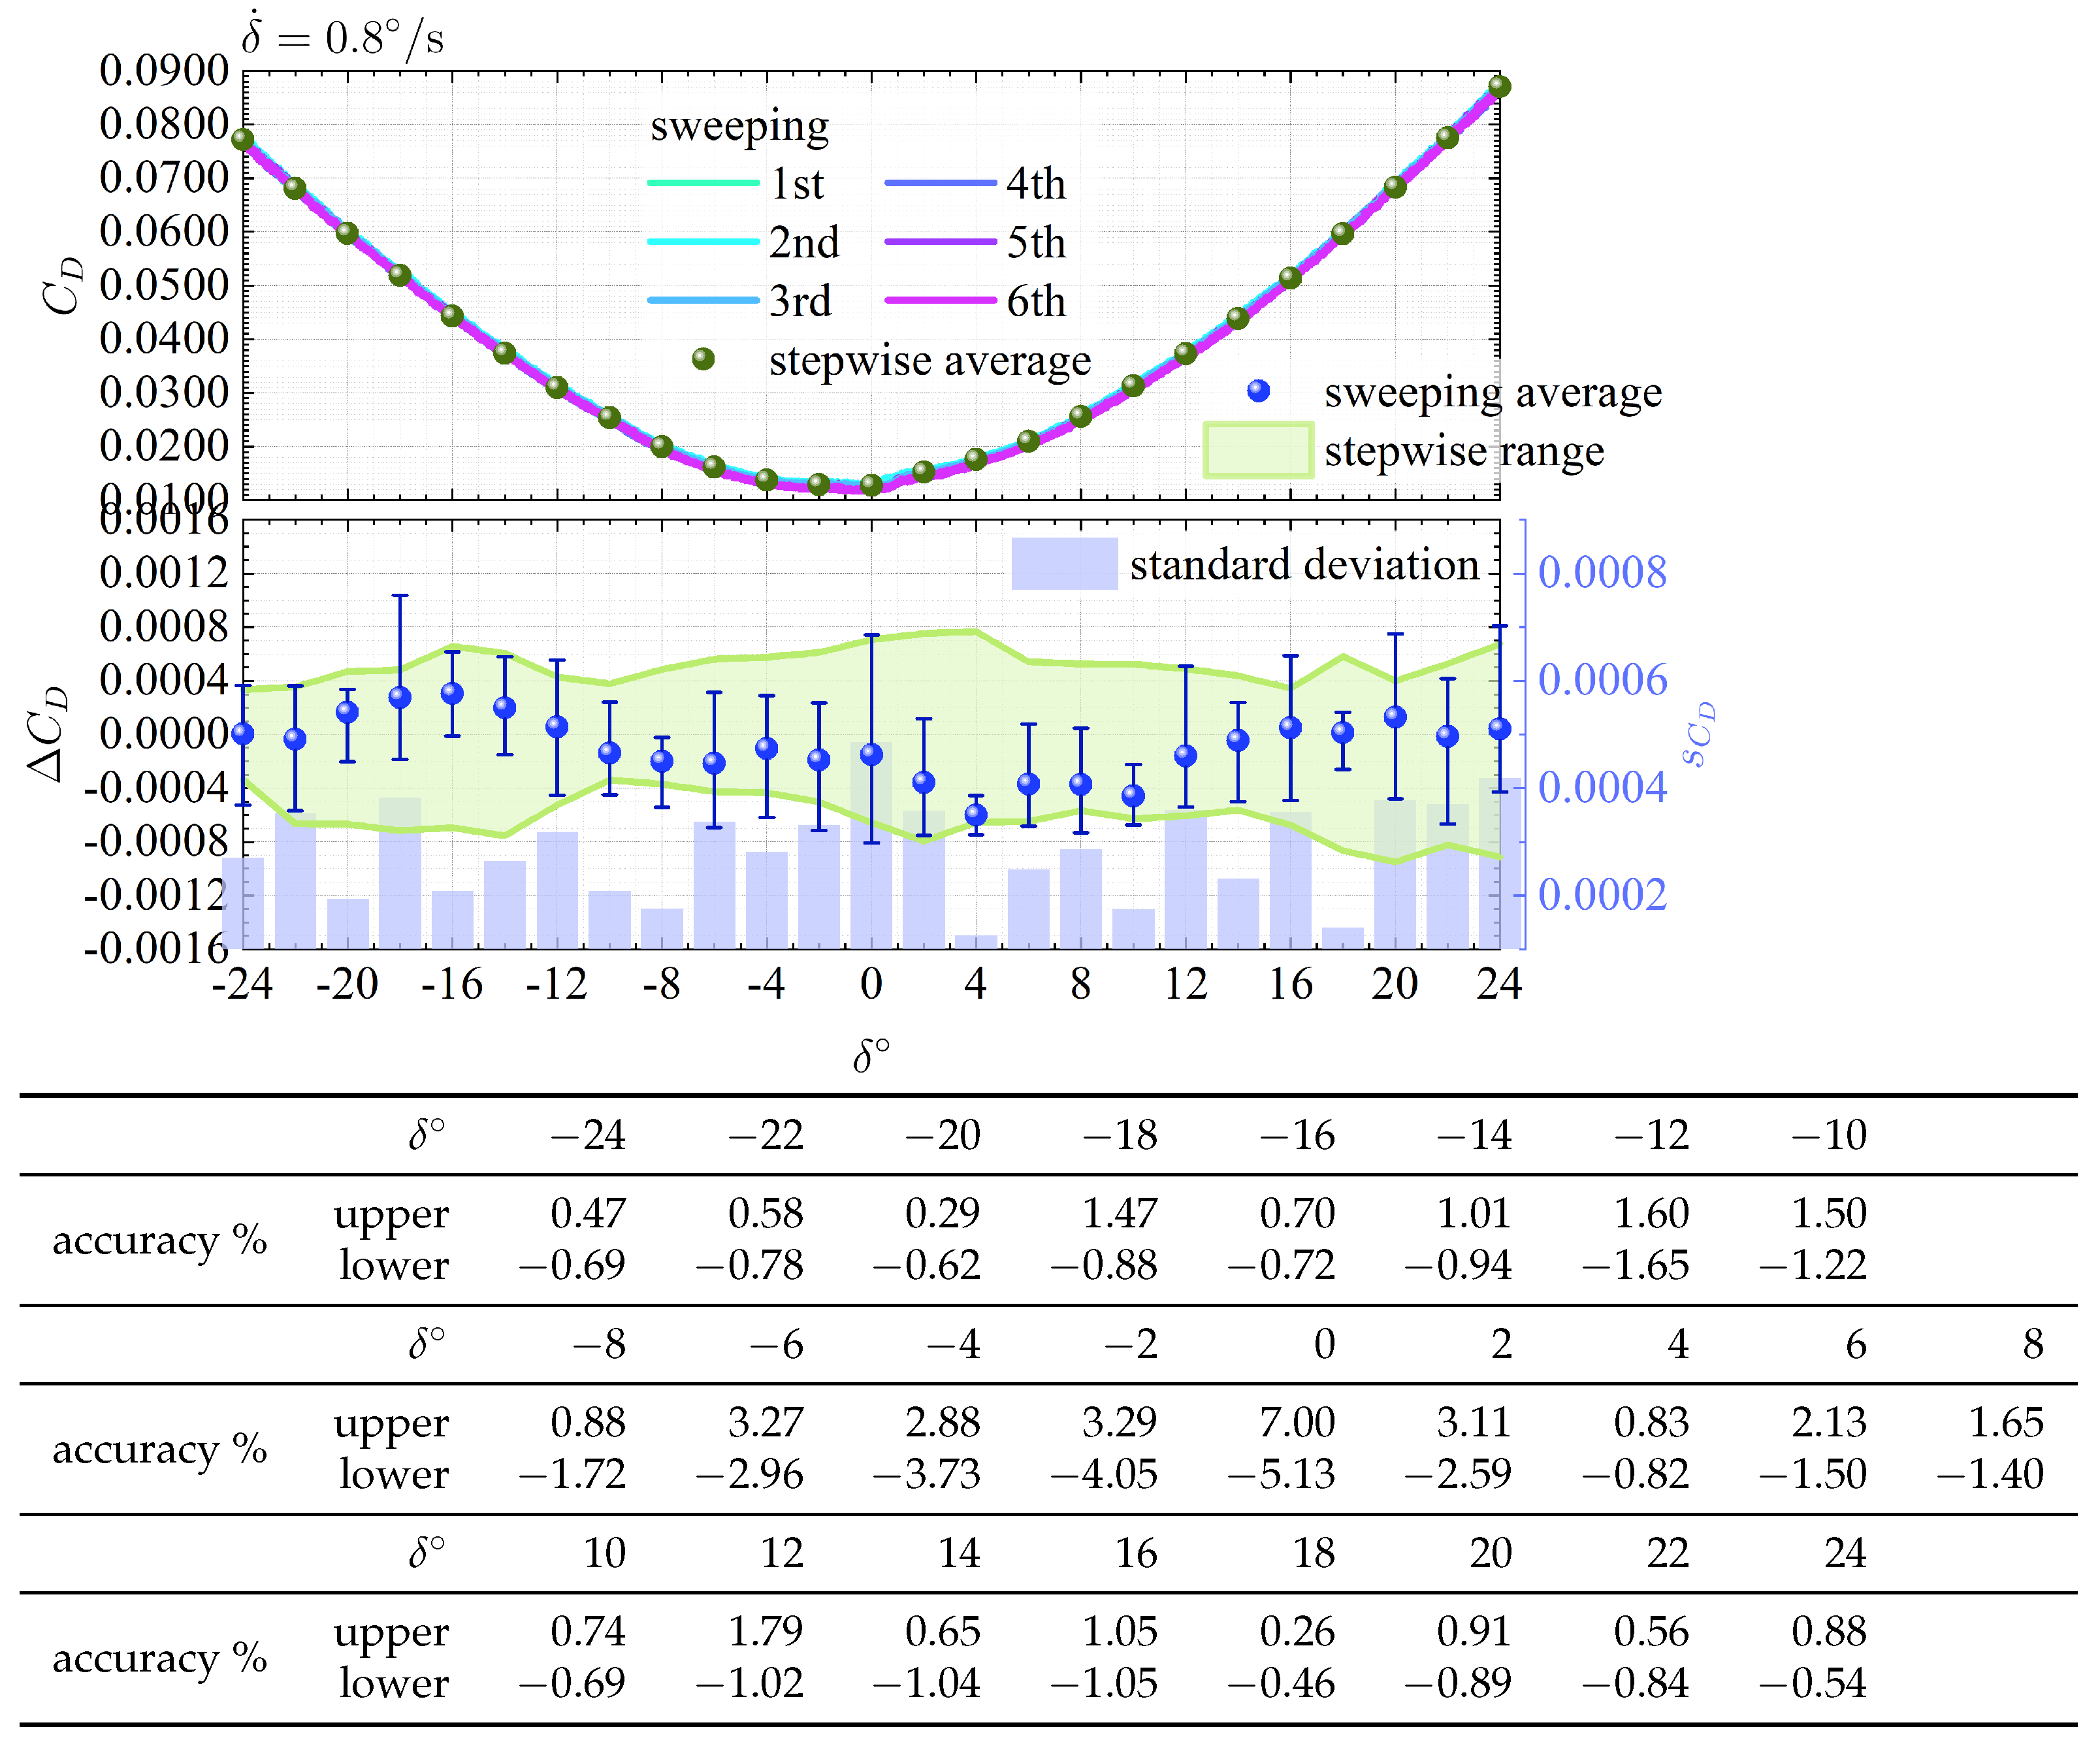
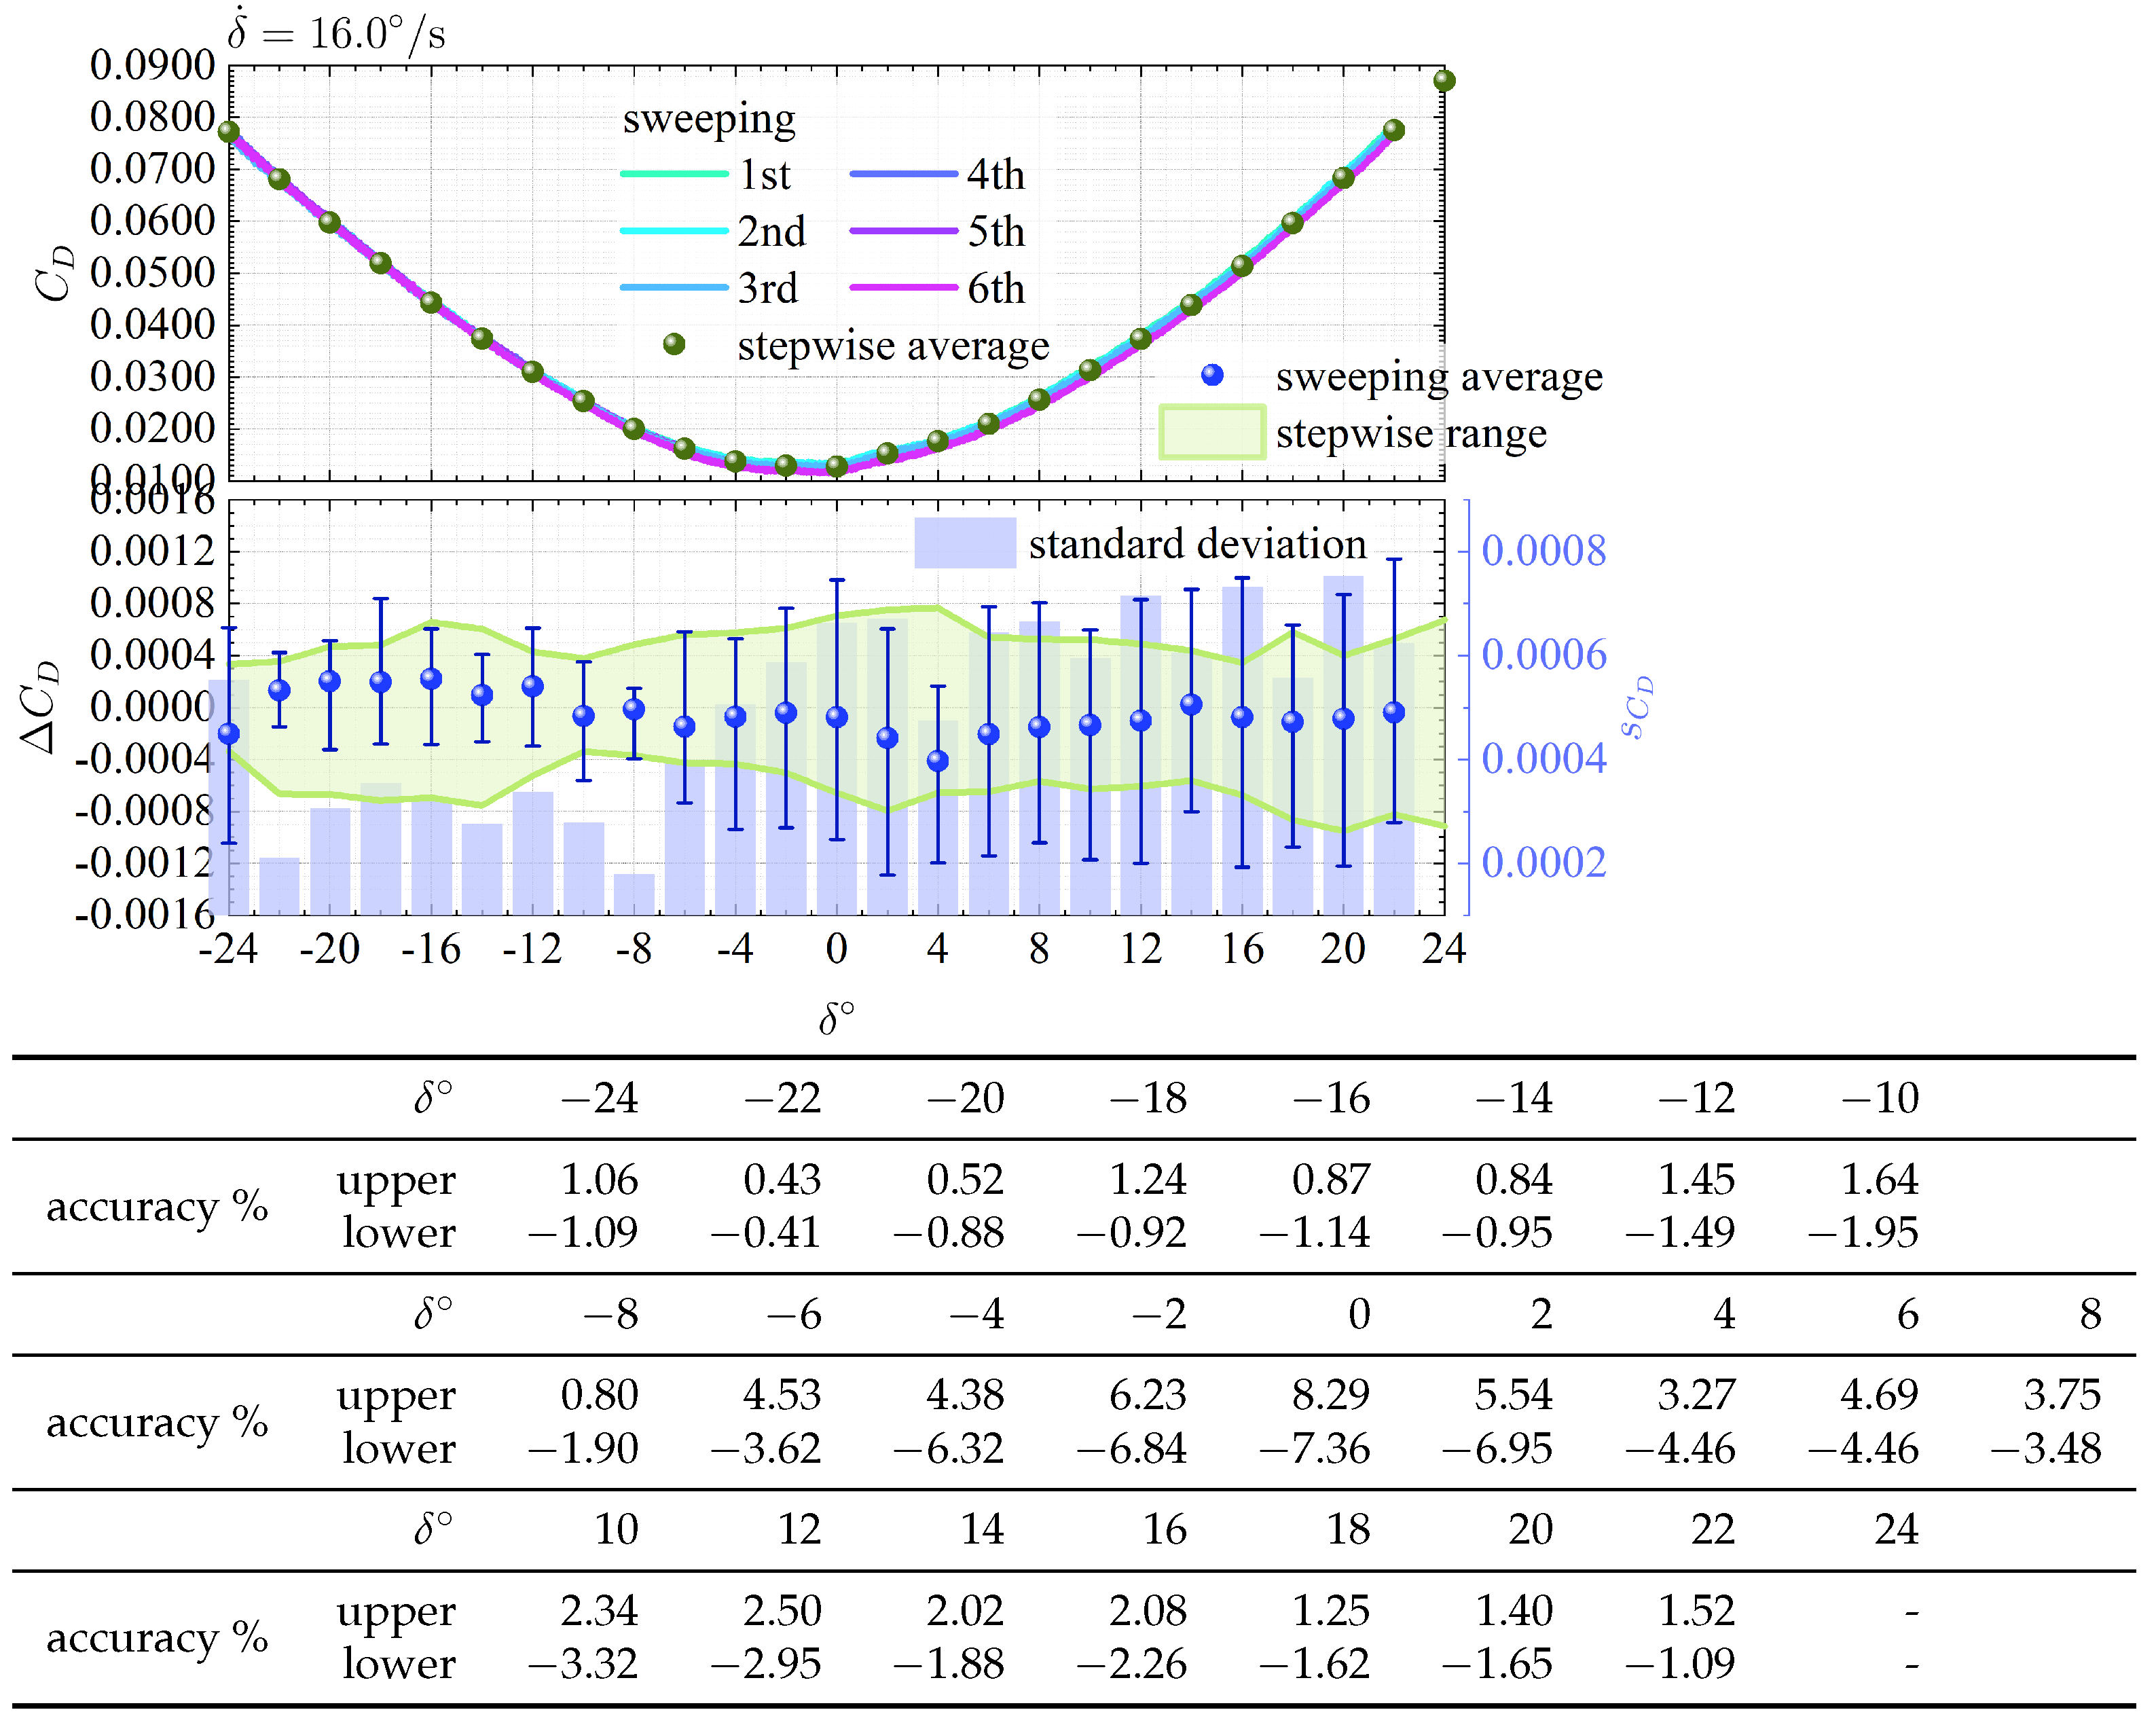
Figure 5,
Figure 6,
Figure 7 and
Figure 8 compile the
data acquired in the sweeping mode for each of the four
. Each figure divides into top and bottom. The top figure demonstrates the comparison between the six raw data acquired in the sweeping mode and the average value obtained in the stepwise mode displayed in
Figure 4. The bottom figure illustrates the difference
for the average value in the stepwise mode
as the vertical axis. It compares the variation of
in the sweeping mode for that in the stepwise mode. Only the data gained at intervals of 2
was extracted in the stepwise mode for a simple comparison. The experiment partially abandoned acquiring the data under
because the DC servo motor could not cope with the pressure generated by the separated flow, and the system became unstable when
. The error bars indicate the range of data taken six times in the sweeping mode. The table summarizes the data accuracy, as defined by
.
In the upper plots of each figure, the behavior is asymmetric for , and an inflection point occurs around , which is not found in the stepwise mode plot. The same locus is observed in all six trials. The lower plots of each figure indicate the variation becomes more severe as rises. When , the surface roughness of the wing upper surface increases due to the lid that houses the drive mechanism, which must trigger the transition to turbulence and separation. Thereby, the dispersion is more extensive in the sweeping mode than in the stepwise mode for . In contrast, when , the dispersion of the sweeping mode is smaller than that of the stepwise mode regardless of . At the bottom of each figure, the accuracy table reveals that the error is largest when and decreases as increases. There is no doubt that the slower the , the better the accuracy of the data. However, the accuracy does not become worse in proportion with the rise in . A detailed discussion of the effect of change on the data accuracy is a subject for future work.
The above results determined the experimental conditions shown in
Section 3.2. Main Trial.
was not a candidate because the DC servo motor could not cope with the pressure generated by the separated flow. The accuracy of
at the different angular velocities is comparable, roughly 7% at most, as summarized in the tables in
Figure 5,
Figure 6 and
Figure 7. This study eventually chose
, considering the WTT period available for this experiment.
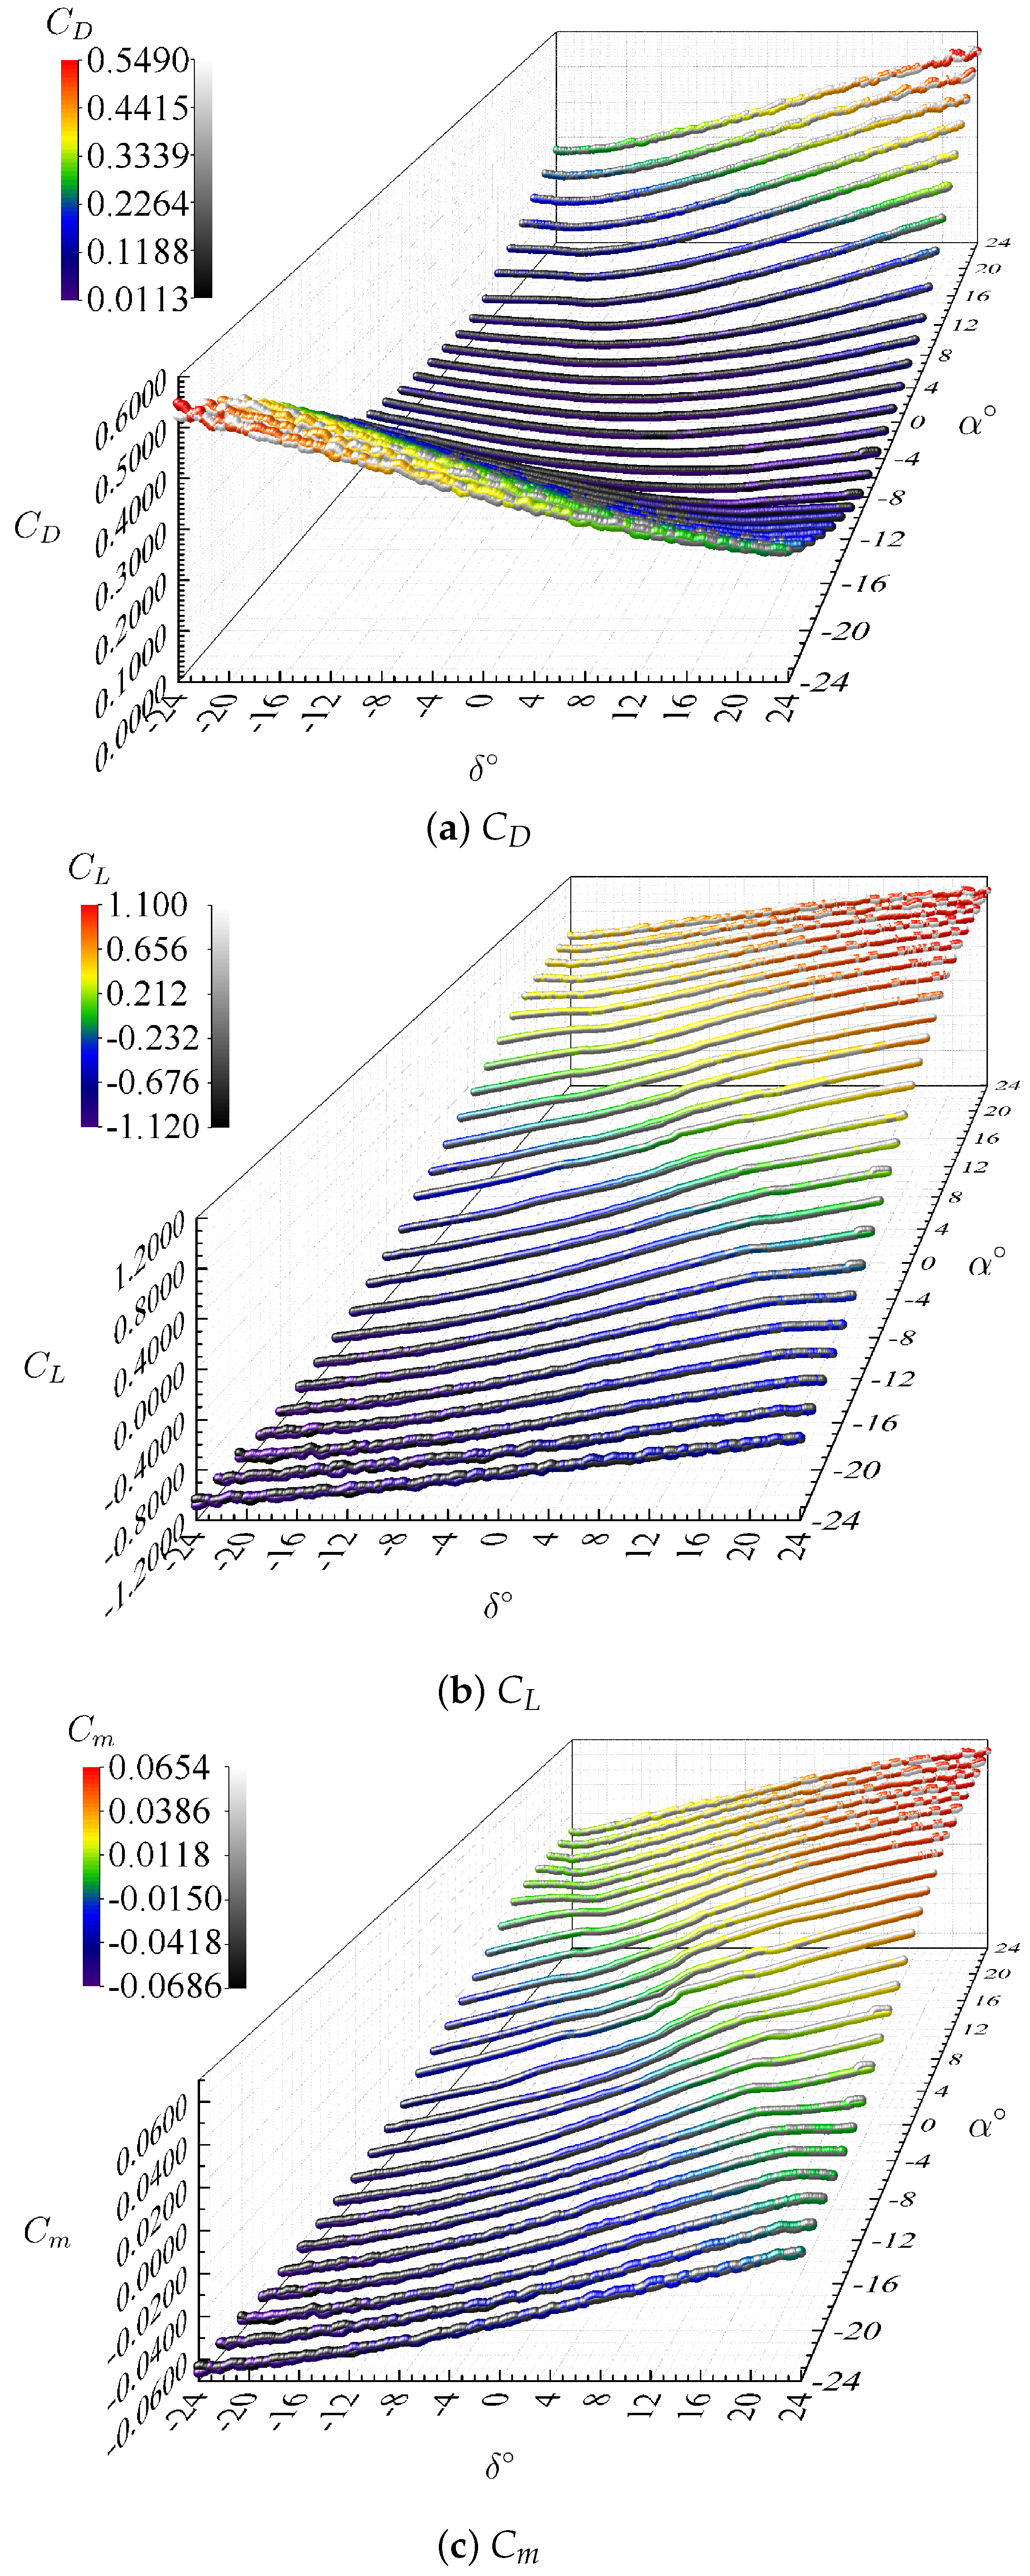
4.3. Data Confirmation on the Main Trial
This trial was performed under the conditions described in
Section 3.2 Main Trial. The acquired data are divided into
,
, and
, and shown in
Figure 9, which plots the data acquired by down-wise and up-wise routes to check for hysteresis. The system switched
in the stepwise mode and shifted
in the sweeping mode. The figure depicts data gained by the down-wise route in color and those procured by up-wise route in monochrome. Note that the time required for this trial was approximately 1 h.
As and grow, the disturbances in the data become larger. Specifically, the effect of is so influential that turbulent transition and separation on the WTT model surface destabilize the acquired data. This state is also the case in the conventional stepwise mode. Since the sweeping mode cannot average the data in the time direction, it should be averaged over several times under identical conditions or statistically processed based on the time-series data obtained in the stepwise mode to deal with disturbances. In other regions, the data are smoothly connected without sharply changing or oscillating. The consecutive data acquisition was conducted to recognize the inflection points.
There appear no significant differences between the aerodynamic performance values from down-wise and up-wise routes. The growing differences between the down-wise and up-wise results are in the regions with substantial
and
. As confirmed in the preliminary attempt described in
Section 4.2, in a turbulent flow field with separation, the DC servo motor must not cope with the pressure on the flap and must not be able to rotate with
As a result, the data connection should not be smooth. However, for
,
, and
, the up-wise route shows a swelling behavior where
is close to
. This trial did not remain the motor at both ends of
and
, and consecutively gained data from the outer range of these
to avoid disturbance of the data due to the drive mechanism not moving smoothly. In other words, the sweeping mode experiments did not start from
, but
. Hence, these behaviors indicate that the down-wise and the up-wise routes have distinct phenomena near
. Other regions under
and
conditions demonstrate different paths. For identifying the physical factors that cause these phenomena, it is necessary to comprehend the flow structure. Namely, the issue of this system is to incorporate the visualization means of the flow field under arbitrary conditions by simple tufts, dynamic pressure-sensitive paint (PSP) [
8], or other devices.
5. Conclusions
This work produced a miniaturized remote and feedback control system and integrated it into the vertical tail of the NASA CRM 80% model owned by JAXA. The apparatus was constructed to consecutively rotate the control surface using this wind tunnel test model and acquire continuous aerodynamic data to accomplish efficient wind tunnel tests. After confirming the reliability of the data by comparing the obtained aerodynamic data with the data in the conventional stepwise manner, the experiment succeeded in procuring comprehensive aerodynamic data with the angle of attack and the deflection angle of the control surface as parameters. However, integrating this system with a visualization method to confirm the flow aspect under arbitrary data acquisition conditions is a challenge for this system.
Author Contributions
Conceptualization, K.W., K.C., H.K. and K.N.; methodology, H.K. and K.N.; experiment, K.W.; validation, K.W., K.C., H.K. and K.N.; resources, H.K. and K.N.; data curation, K.W. and K.C.; writing—original draft preparation, K.C.; writing—review and editing, K.C.; visualization, K.C.; supervision, K.C.; project administration, H.K. and K.N. All authors have read and agreed to the published version of the manuscript.
Funding
This research received no external funding.
Institutional Review Board Statement
Not applicable.
Informed Consent Statement
Not applicable.
Data Availability Statement
The data that support the findings of this study are available from the corresponding author, K.C., upon reasonable request.
Acknowledgments
This study was conducted under the JAXA student training system (technical mastery).
Conflicts of Interest
The authors declare no conflict of interest.
Abbreviations
The following abbreviations are used in this manuscript:
| lift coefficient |
| drag coefficient |
| pitching moment coefficient |
| CFD | computational fluid dynamics |
| EFD | experimental fluid dynamics |
| JAXA | Japan Aerospace Exploration Agency |
| NACA | National Advisory Committee for Aeronautics |
| NASA | National Aeronautics and Space Administration |
| CRM | common research model |
| WTT | wind tunnel test |
| PSP | pressure-sensitive paint |
| DC | direct current |
| LED | light emitting diode |
| FS | full scale |
| 3D | three-dimensional |
References
- Kochkov, D.; Smith, J.A.; Alieva, A.; Wang, Q.; Brenner, M.P.; Hoyer, S. Machine Learning-accelerated Computational Fluid Dynamics. Proc. Natl. Acad. Sci. USA 2021, 118, e2101784118. [Google Scholar] [CrossRef] [PubMed]
- Mifsud, M.; Vendl, A.; Hansen, L.U.; Görtz, S. Fusion Wind-tunnel Measurements and CFD Data Using Constrained Gappy Proper Orthogonal Decomposition. Aerosp. Sci. Technol. 2019, 86, 312–326. [Google Scholar] [CrossRef]
- Liu, T.; Cattafesta, L.N., III; Radezsky, R.H. Photogrammetry Applied to Wind-Tunnel Testing. AIAA J. 2000, 38, 964–971. [Google Scholar] [CrossRef]
- Yondo, R.; Andrés, E.; Valero, E. A Review on Design of Experiments and Surrogate Models in Aircraft Real-time and Many-query Aerodynamic Analyses. Prog. Aerosp. Sci. 2018, 96, 23–61. [Google Scholar] [CrossRef]
- Chiba, K.; Komatsu, T.; Kato, H.; Nakakita, K. Remote and Feedback Control of the Flap Angle in a Wind Tunnel Test Model by Optical Measurement. Aerospace 2020, 7, 11. [Google Scholar] [CrossRef] [Green Version]
- Rivers, M.B. NASA Common Research Model: A History and Future Plans. In AIAA Paper 2019-3725 on the AIAA Aviation 2019 Forum; AIAA: Reston, VA, USA, 2019. [Google Scholar] [CrossRef]
- Ueno, M.; Kohzai, T.; Koga, S.; Kato, H.; Nakakita, K.; Sudani, N. 80% Scaled NASA Common Research Model Wind Tunnel Test of JAXA at Relatively Low Reynolds Number. In AIAA Paper 2013-0493 on the 51st AIAA Aerospace Sciences Meeting; AIAA: Reston, VA, USA, 2013. [Google Scholar] [CrossRef] [Green Version]
- Hayashi, T.; Houpt, A.W.; Leonov, S.B.; Sakaue, H. Motion-capturing Pressure-sensitive Paint Method under Transient Illumination by Plasma Source. J. Phys. D Appl. Phys. 2019, 52, 324005. [Google Scholar] [CrossRef]
| Publisher’s Note: MDPI stays neutral with regard to jurisdictional claims in published maps and institutional affiliations. |
© 2021 by the authors. Licensee MDPI, Basel, Switzerland. This article is an open access article distributed under the terms and conditions of the Creative Commons Attribution (CC BY) license (https://creativecommons.org/licenses/by/4.0/).


