
Plunging Airfoil: Reynolds Number and Angle of Attack Effects


Abstract
:1. Introduction
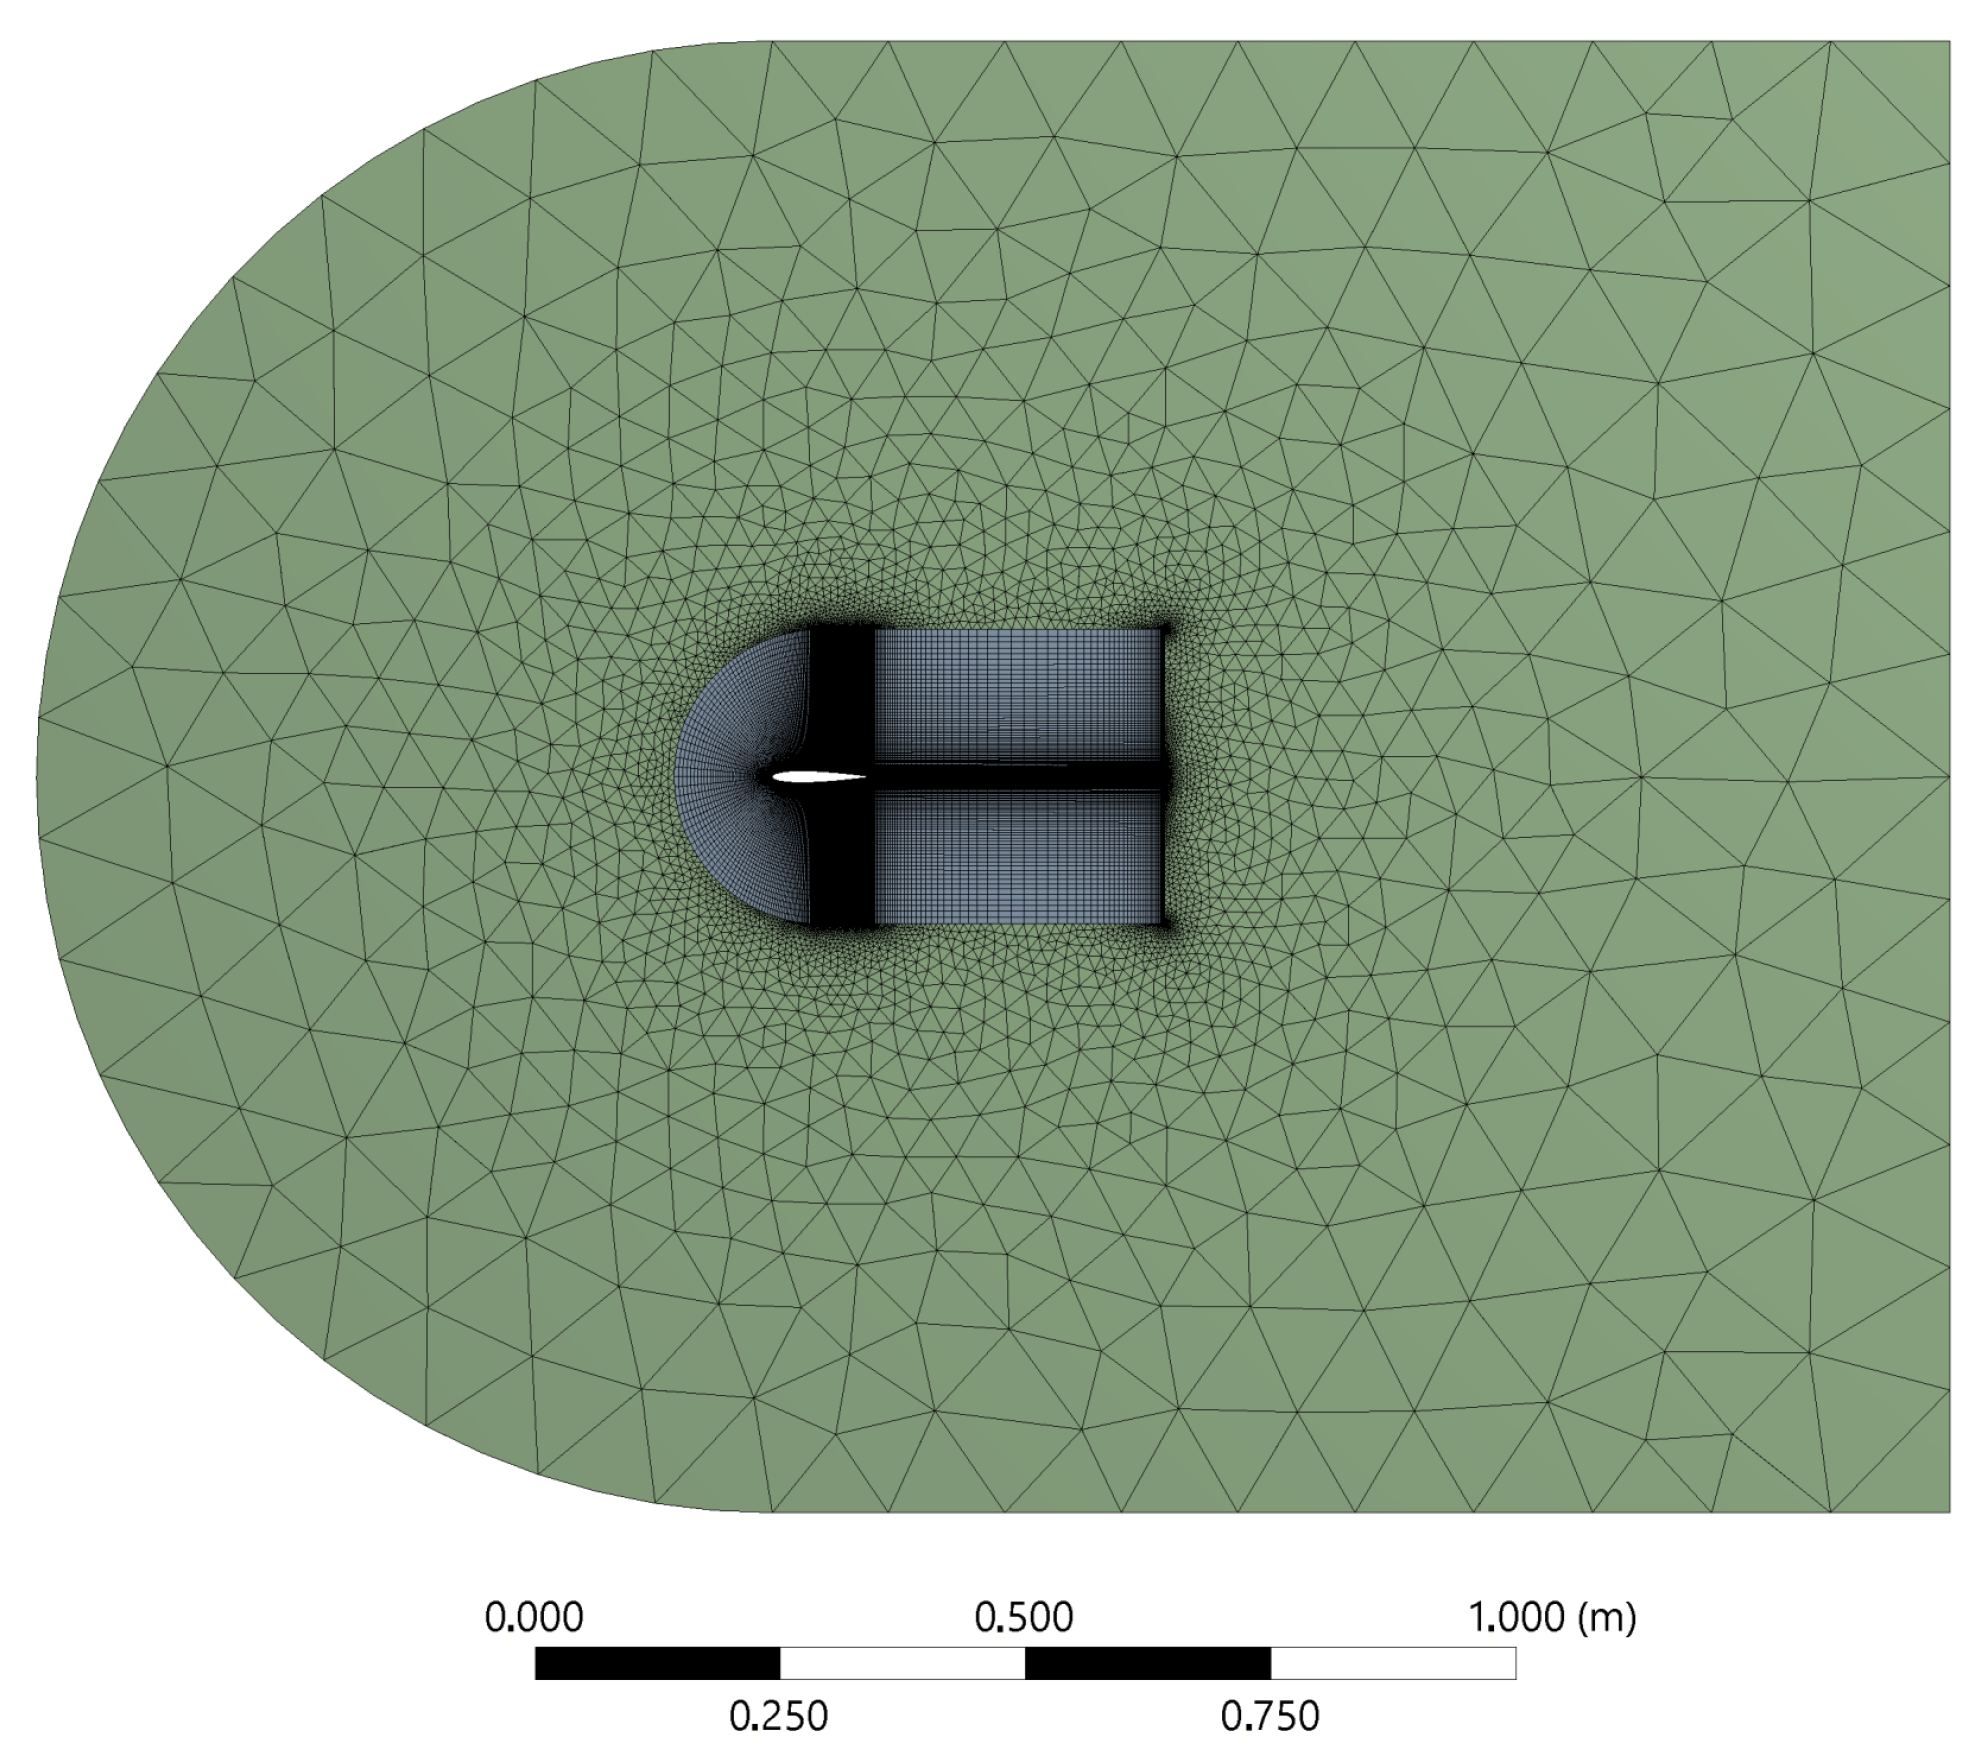
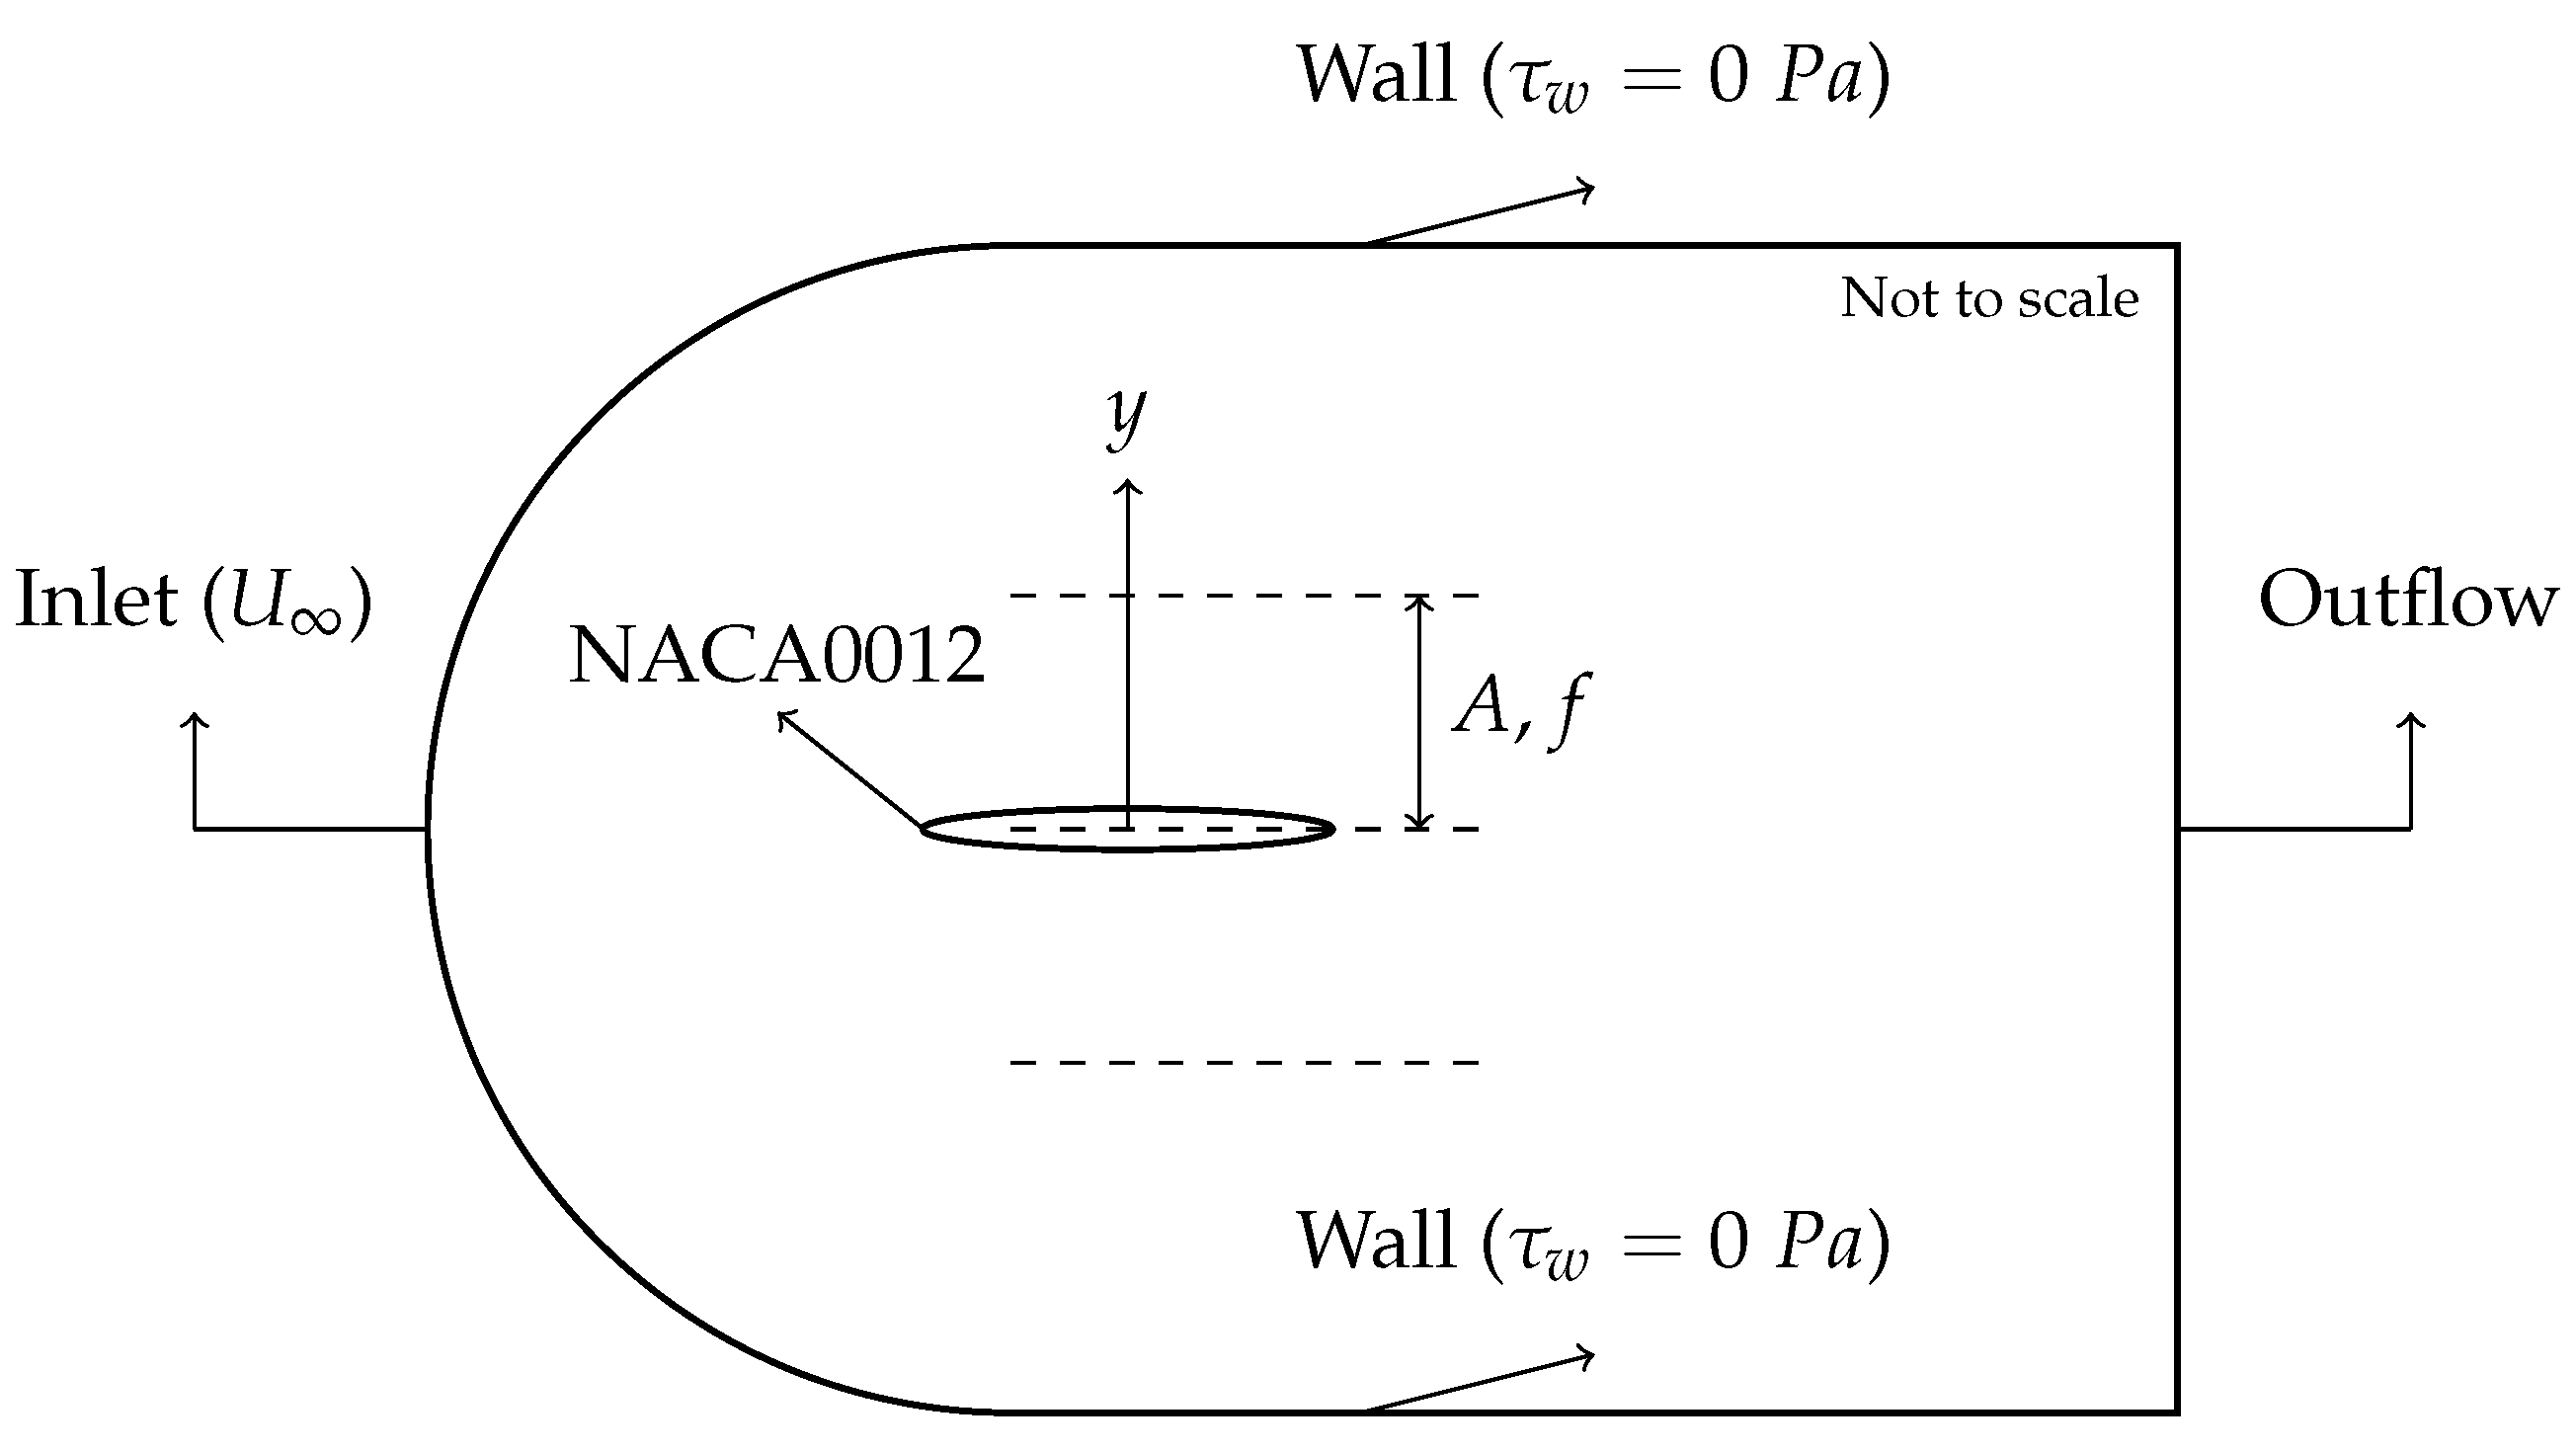
2. Methodology
3. Results and Discussion
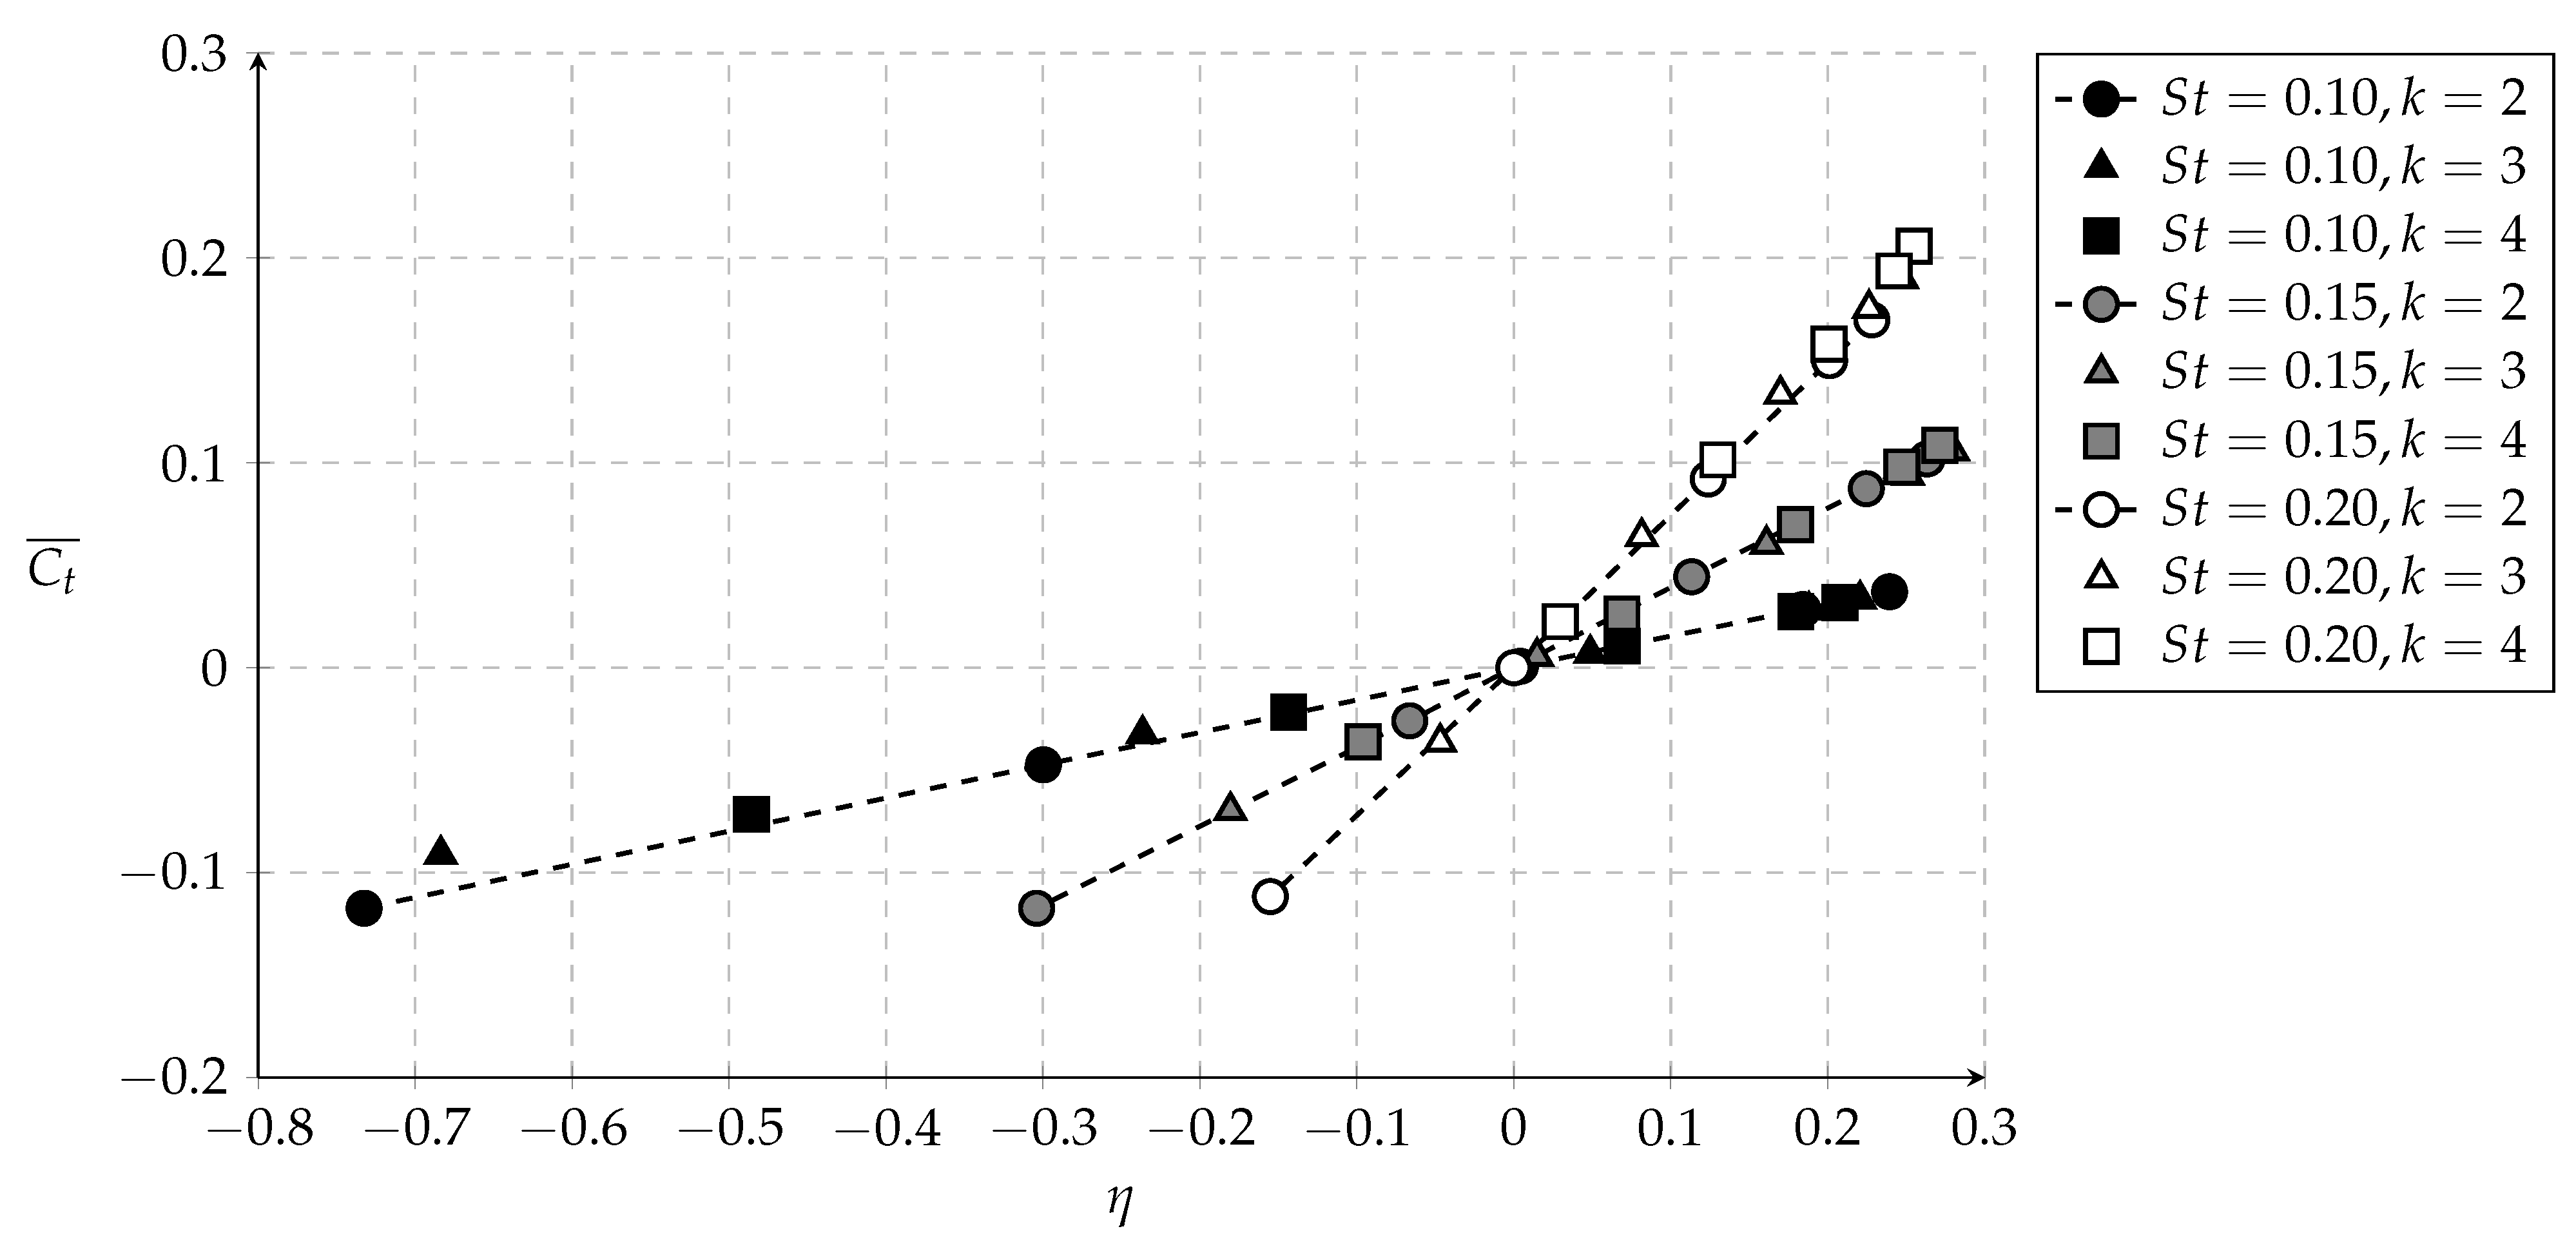
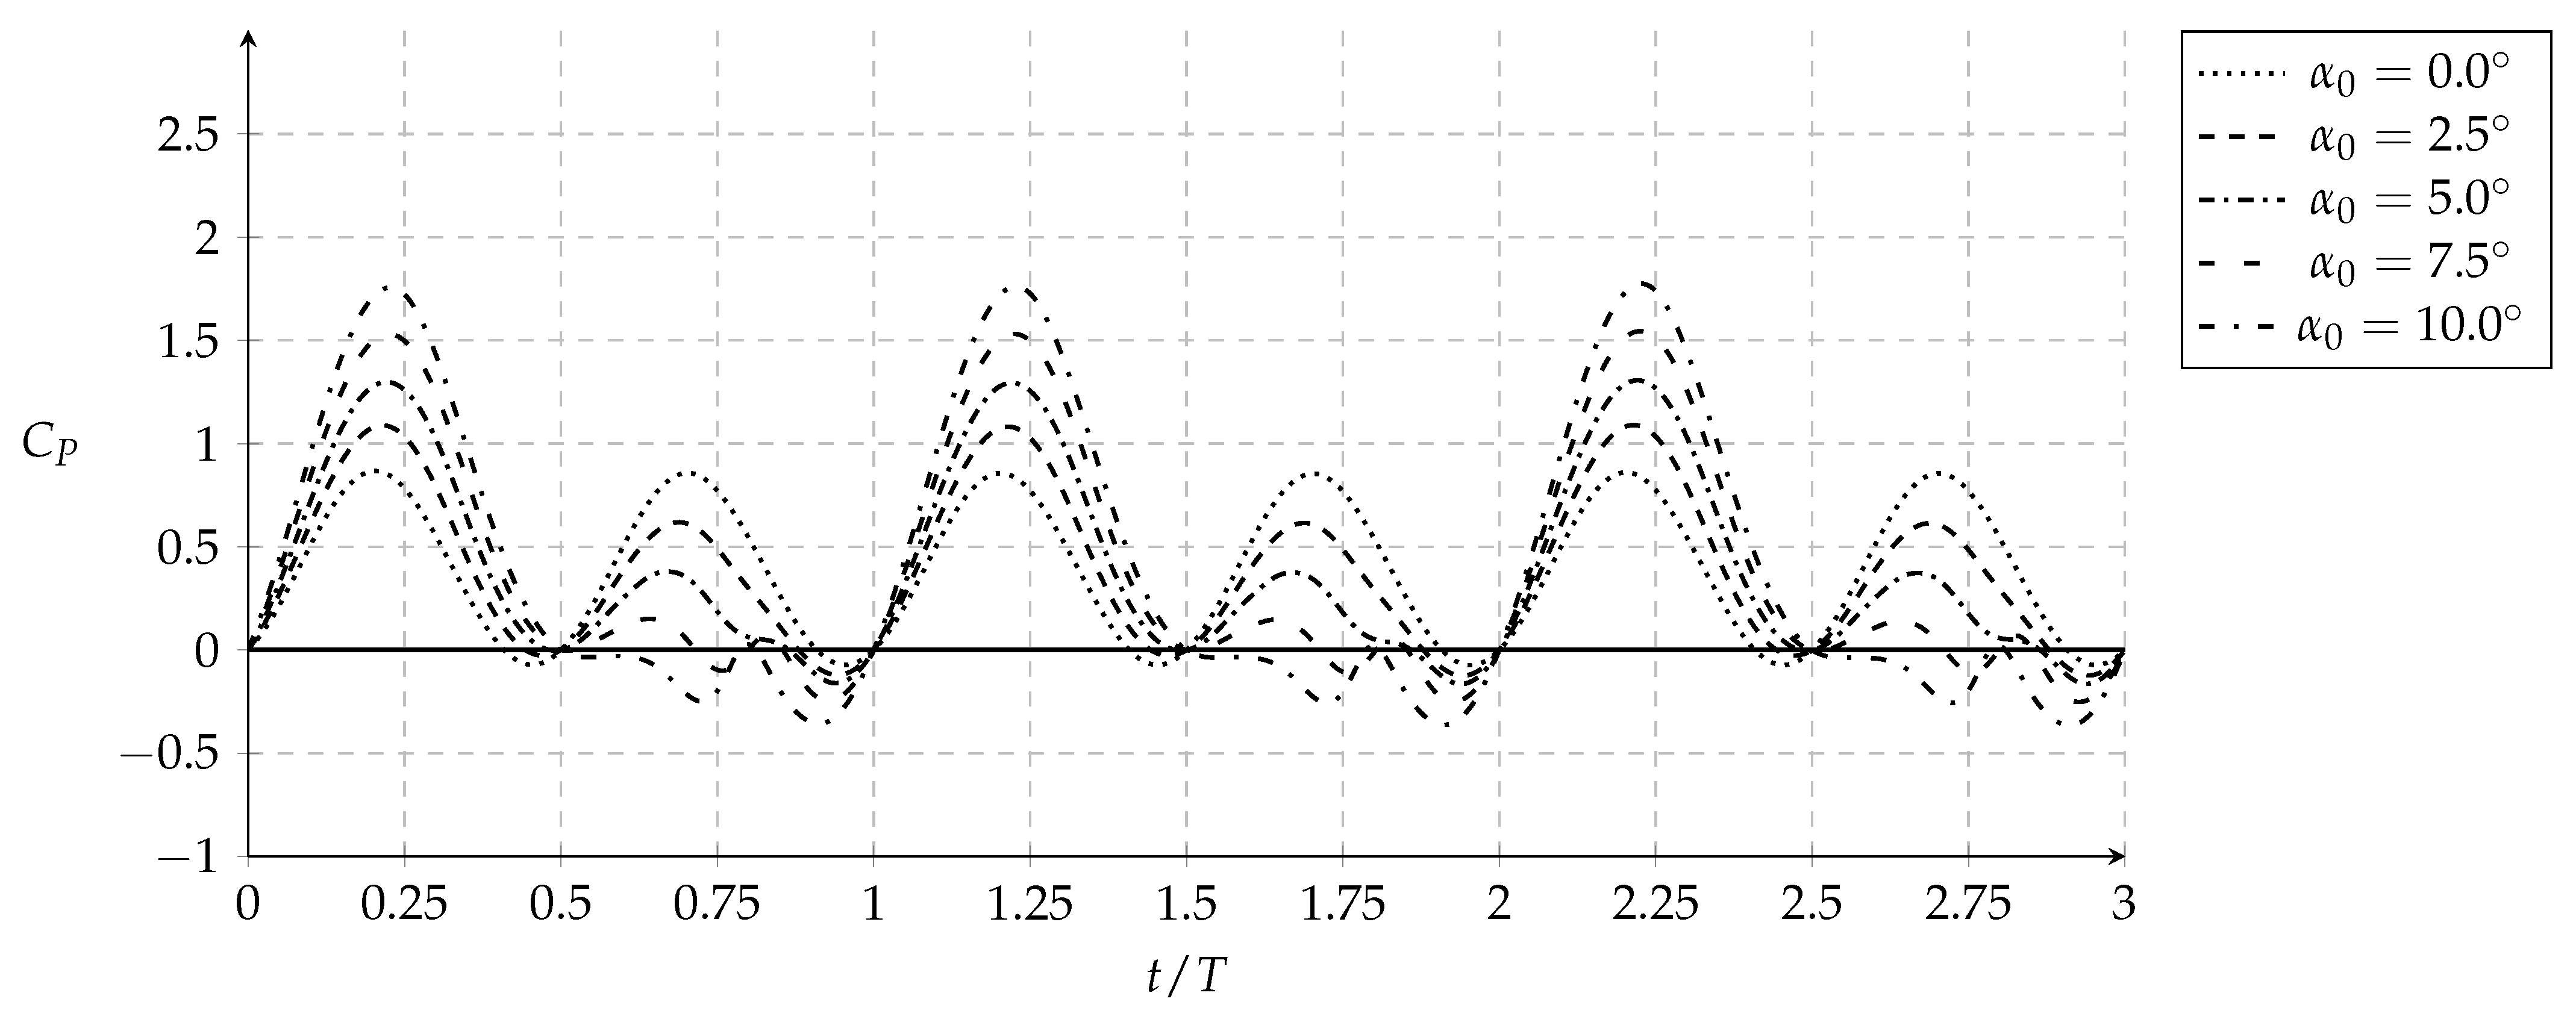
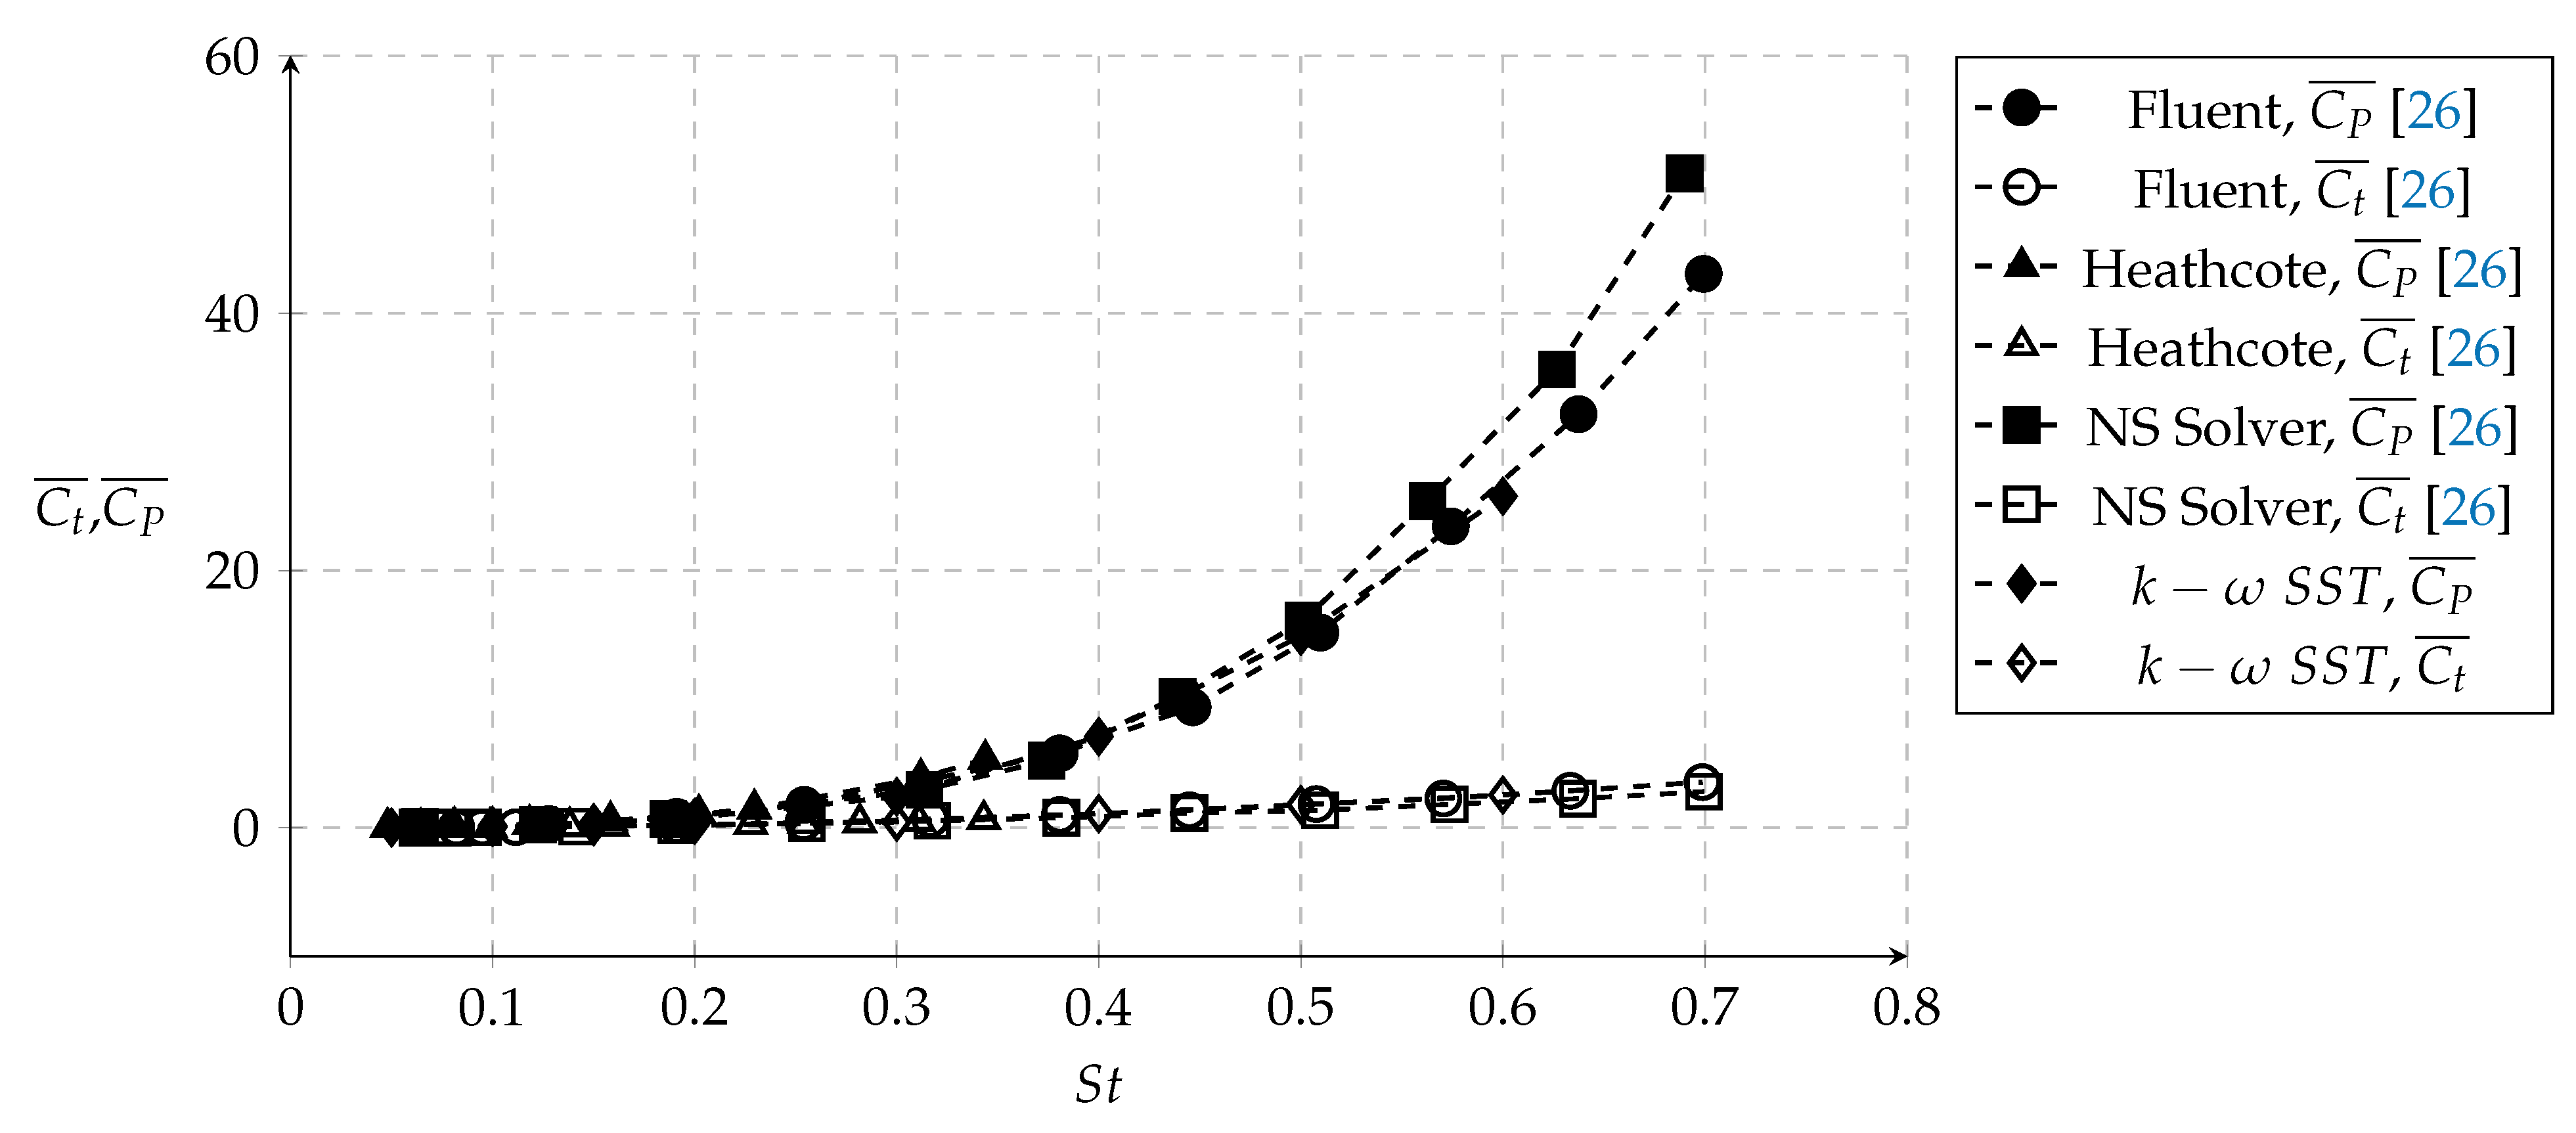
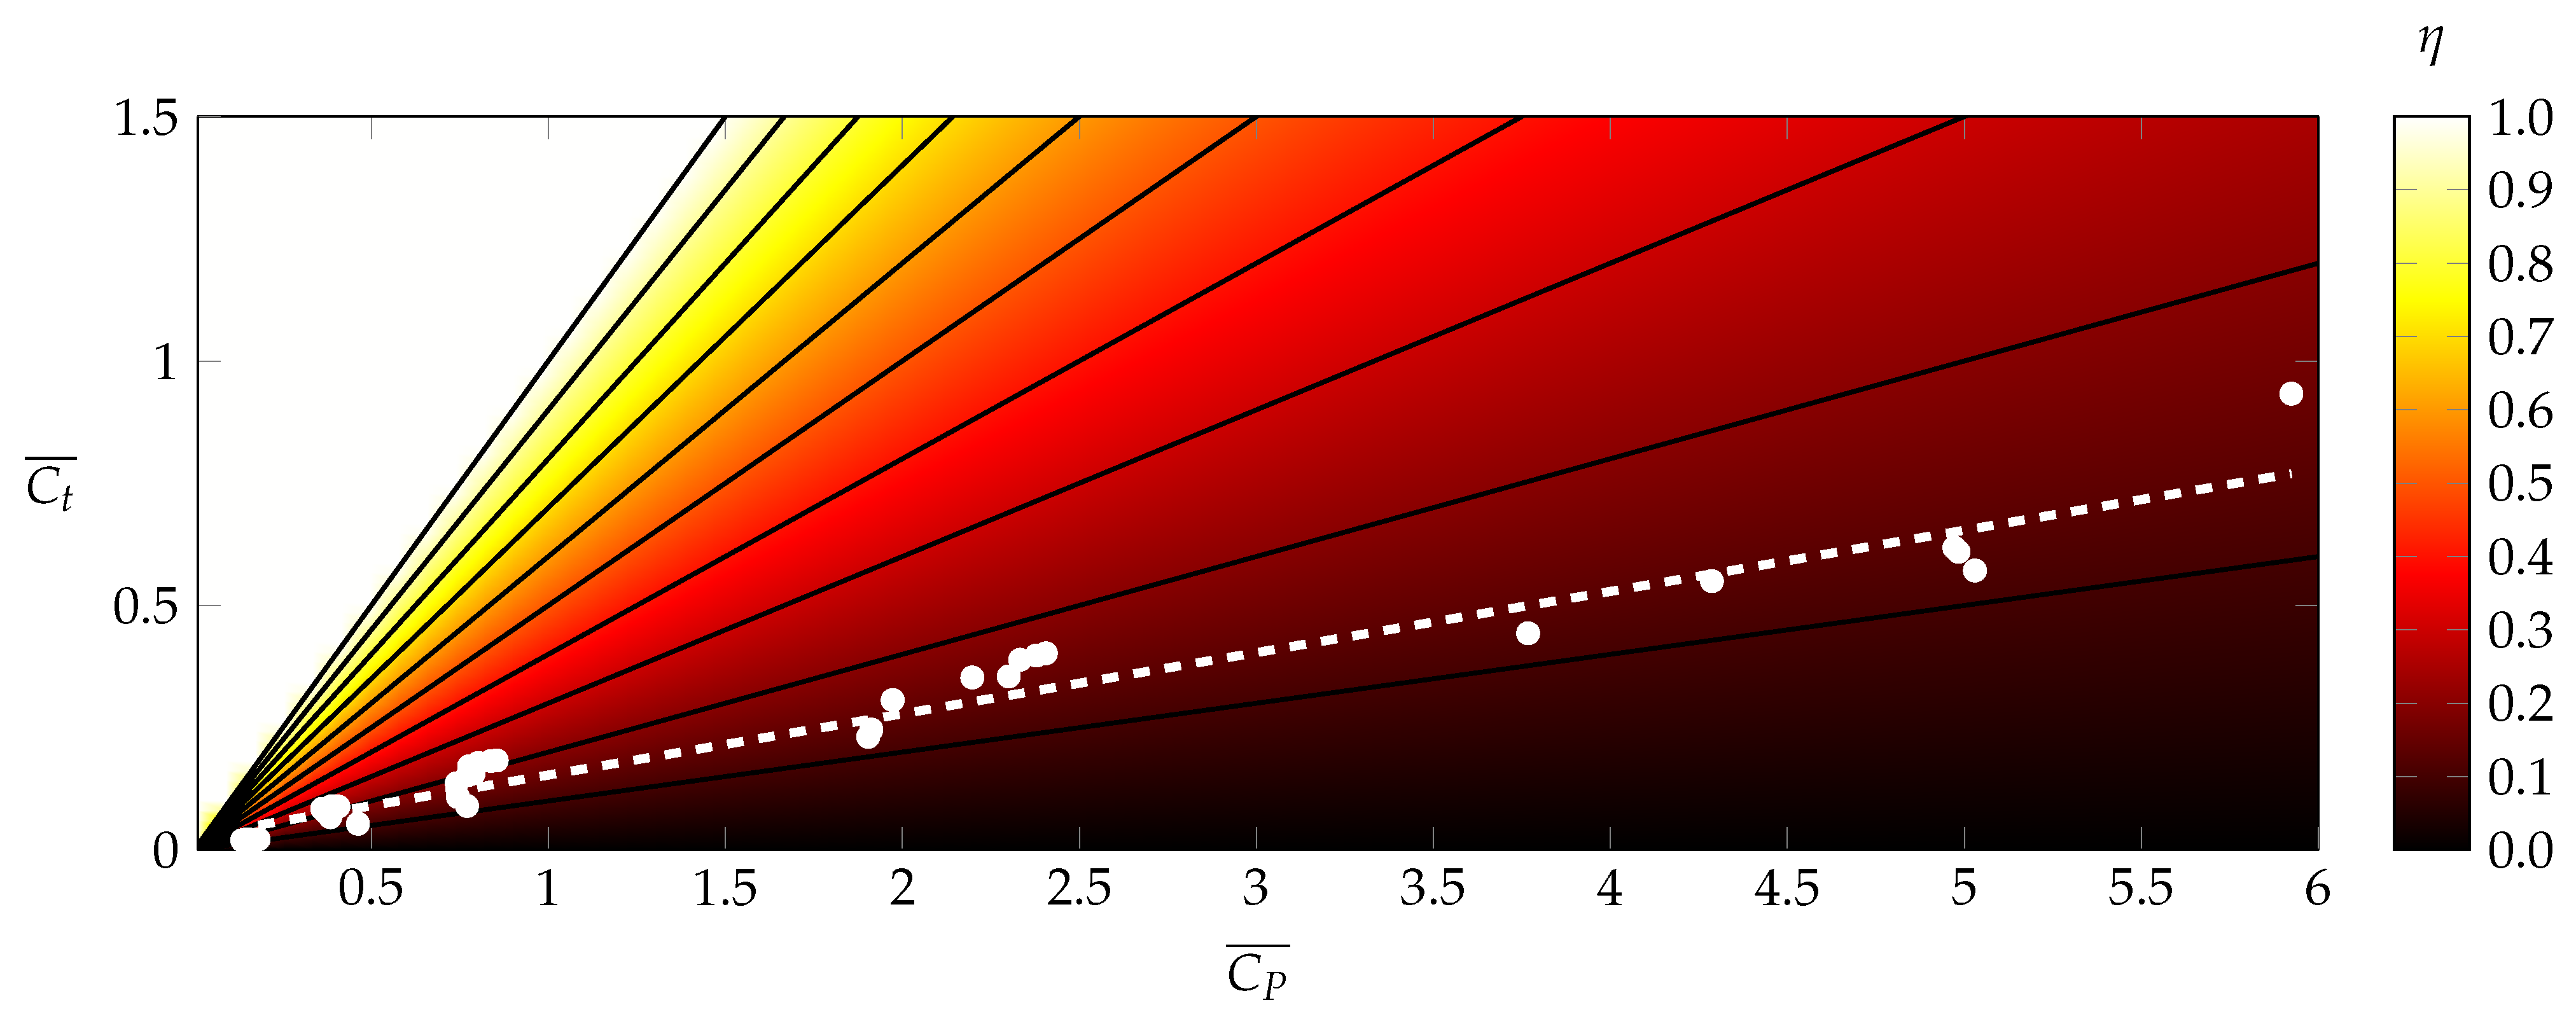
3.1. Power and Thrust Correlations
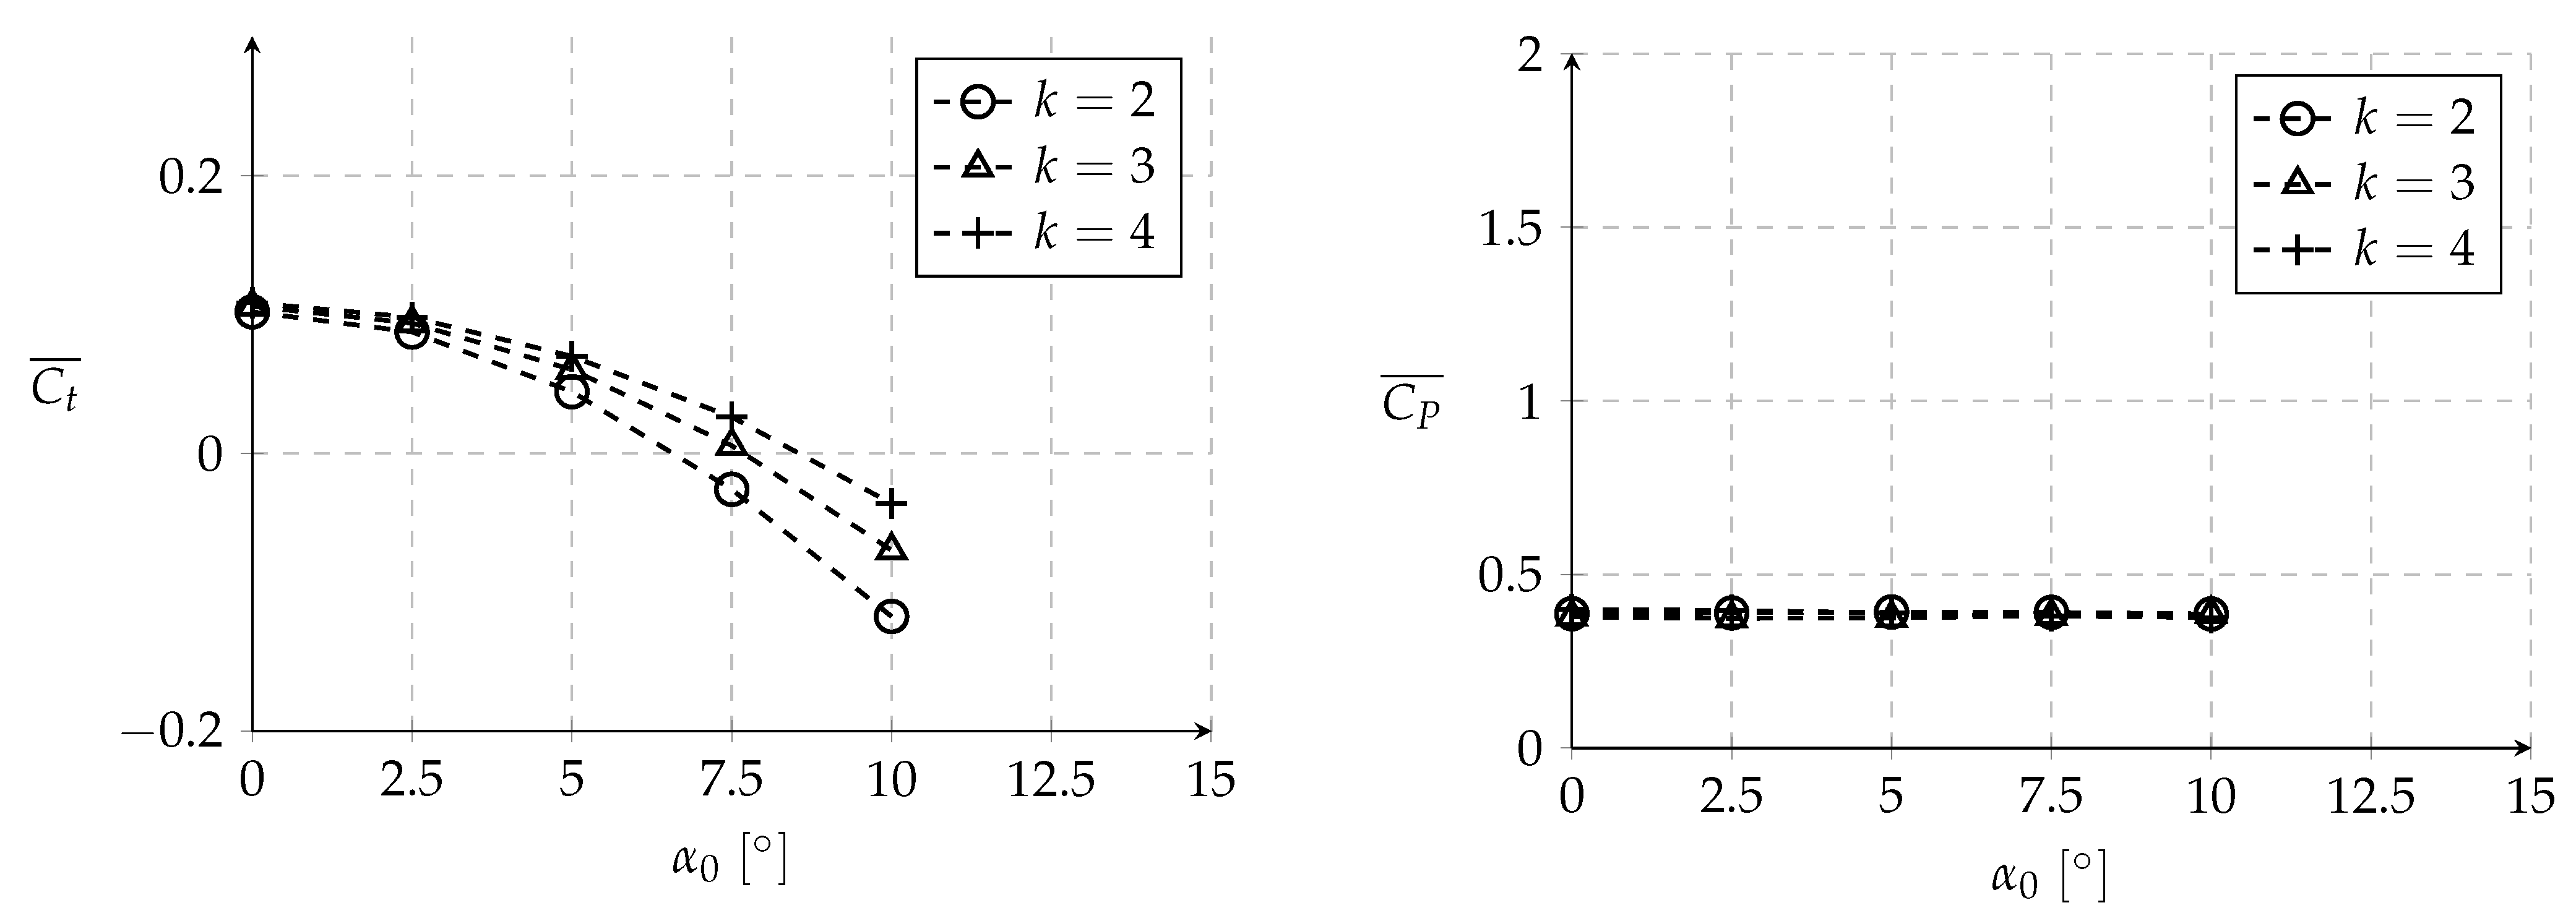
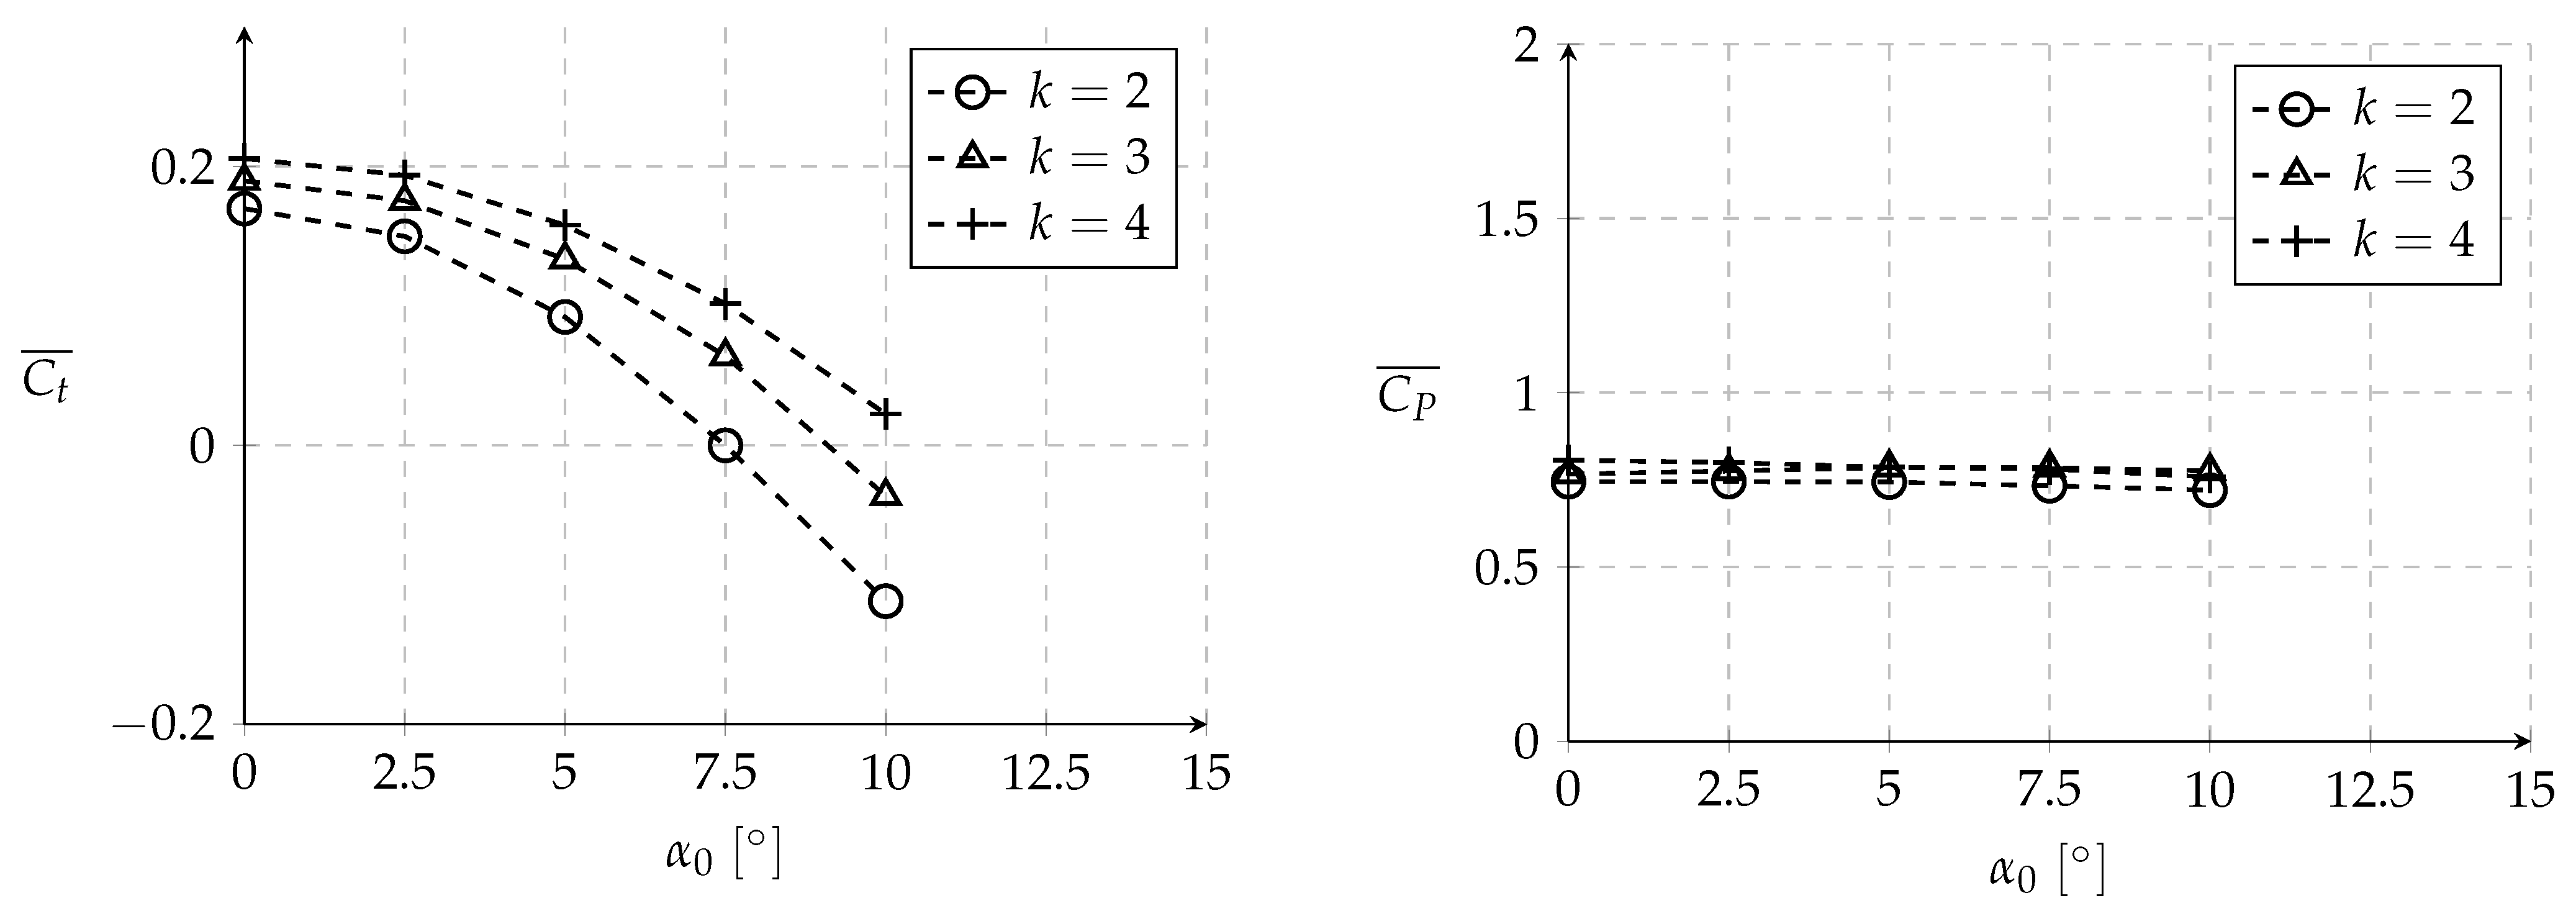
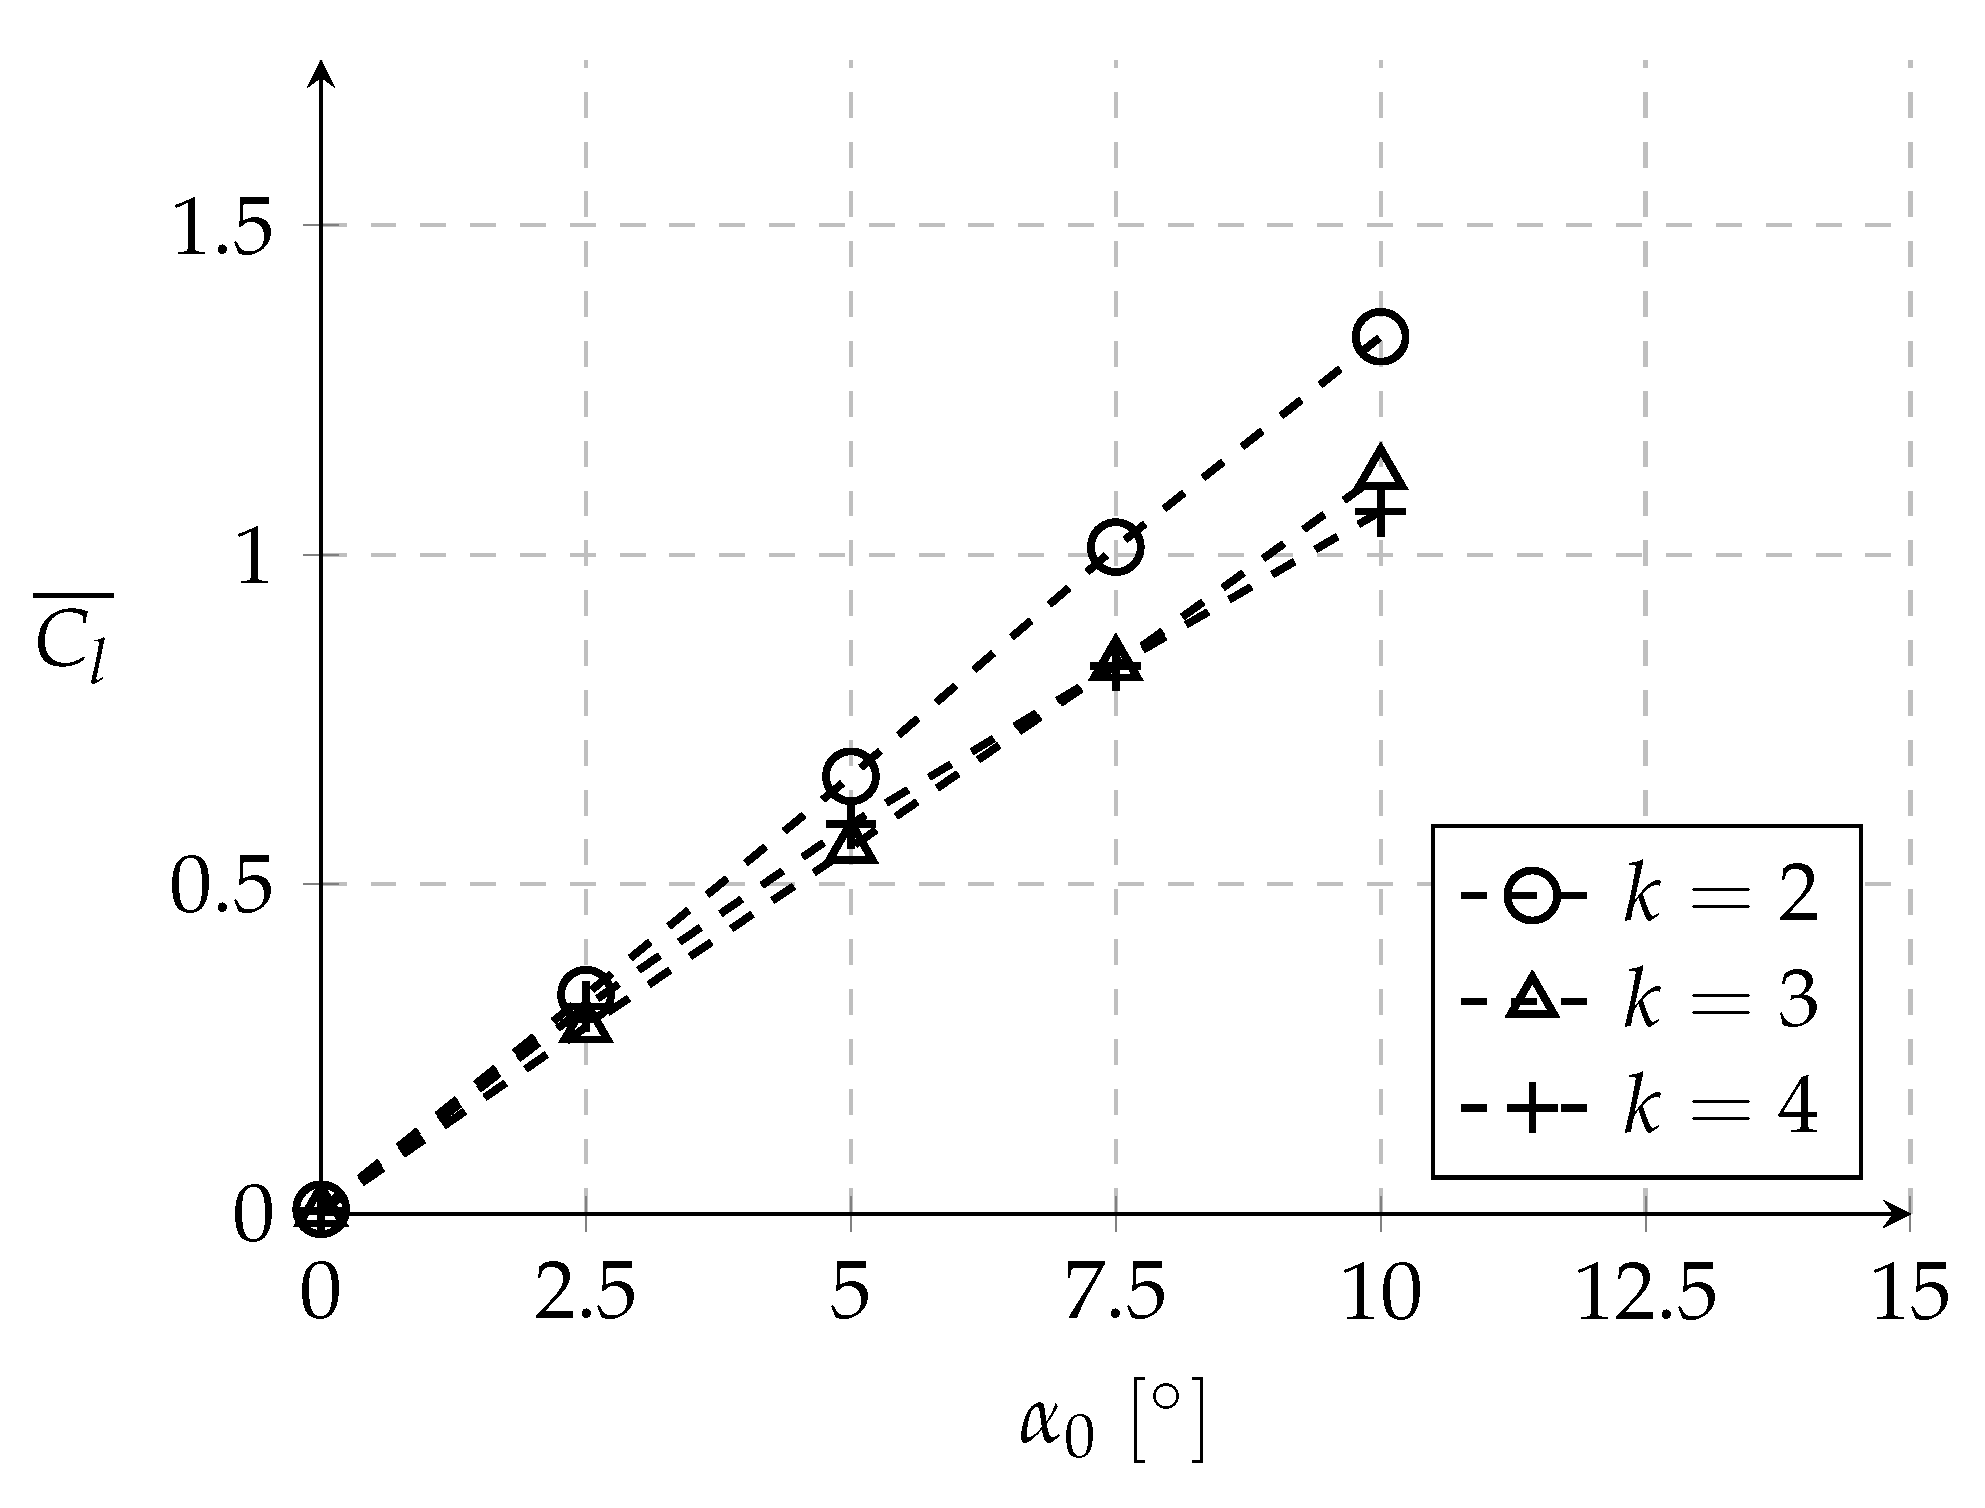
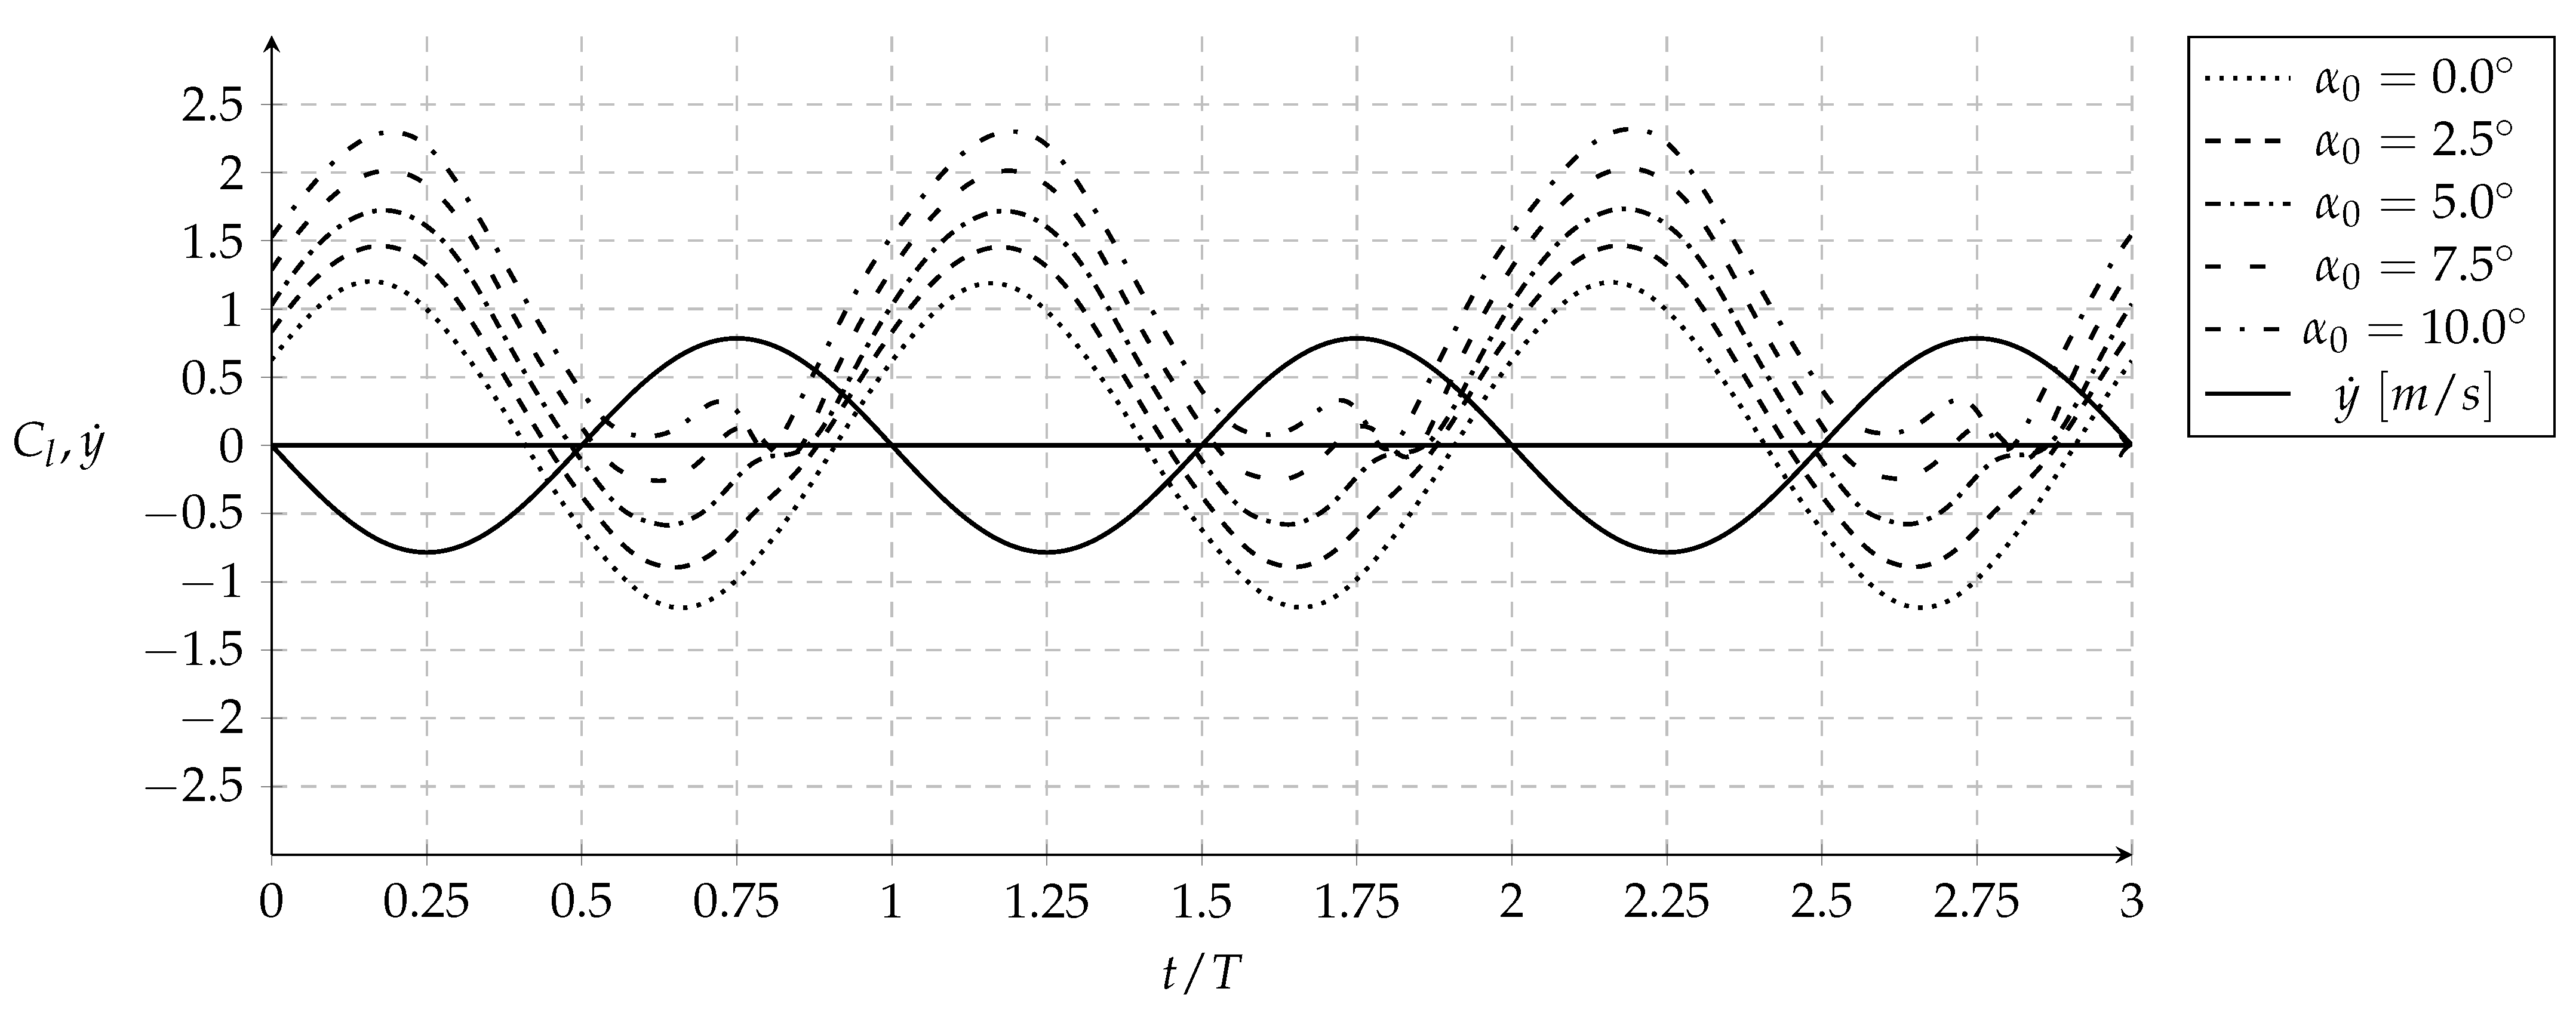
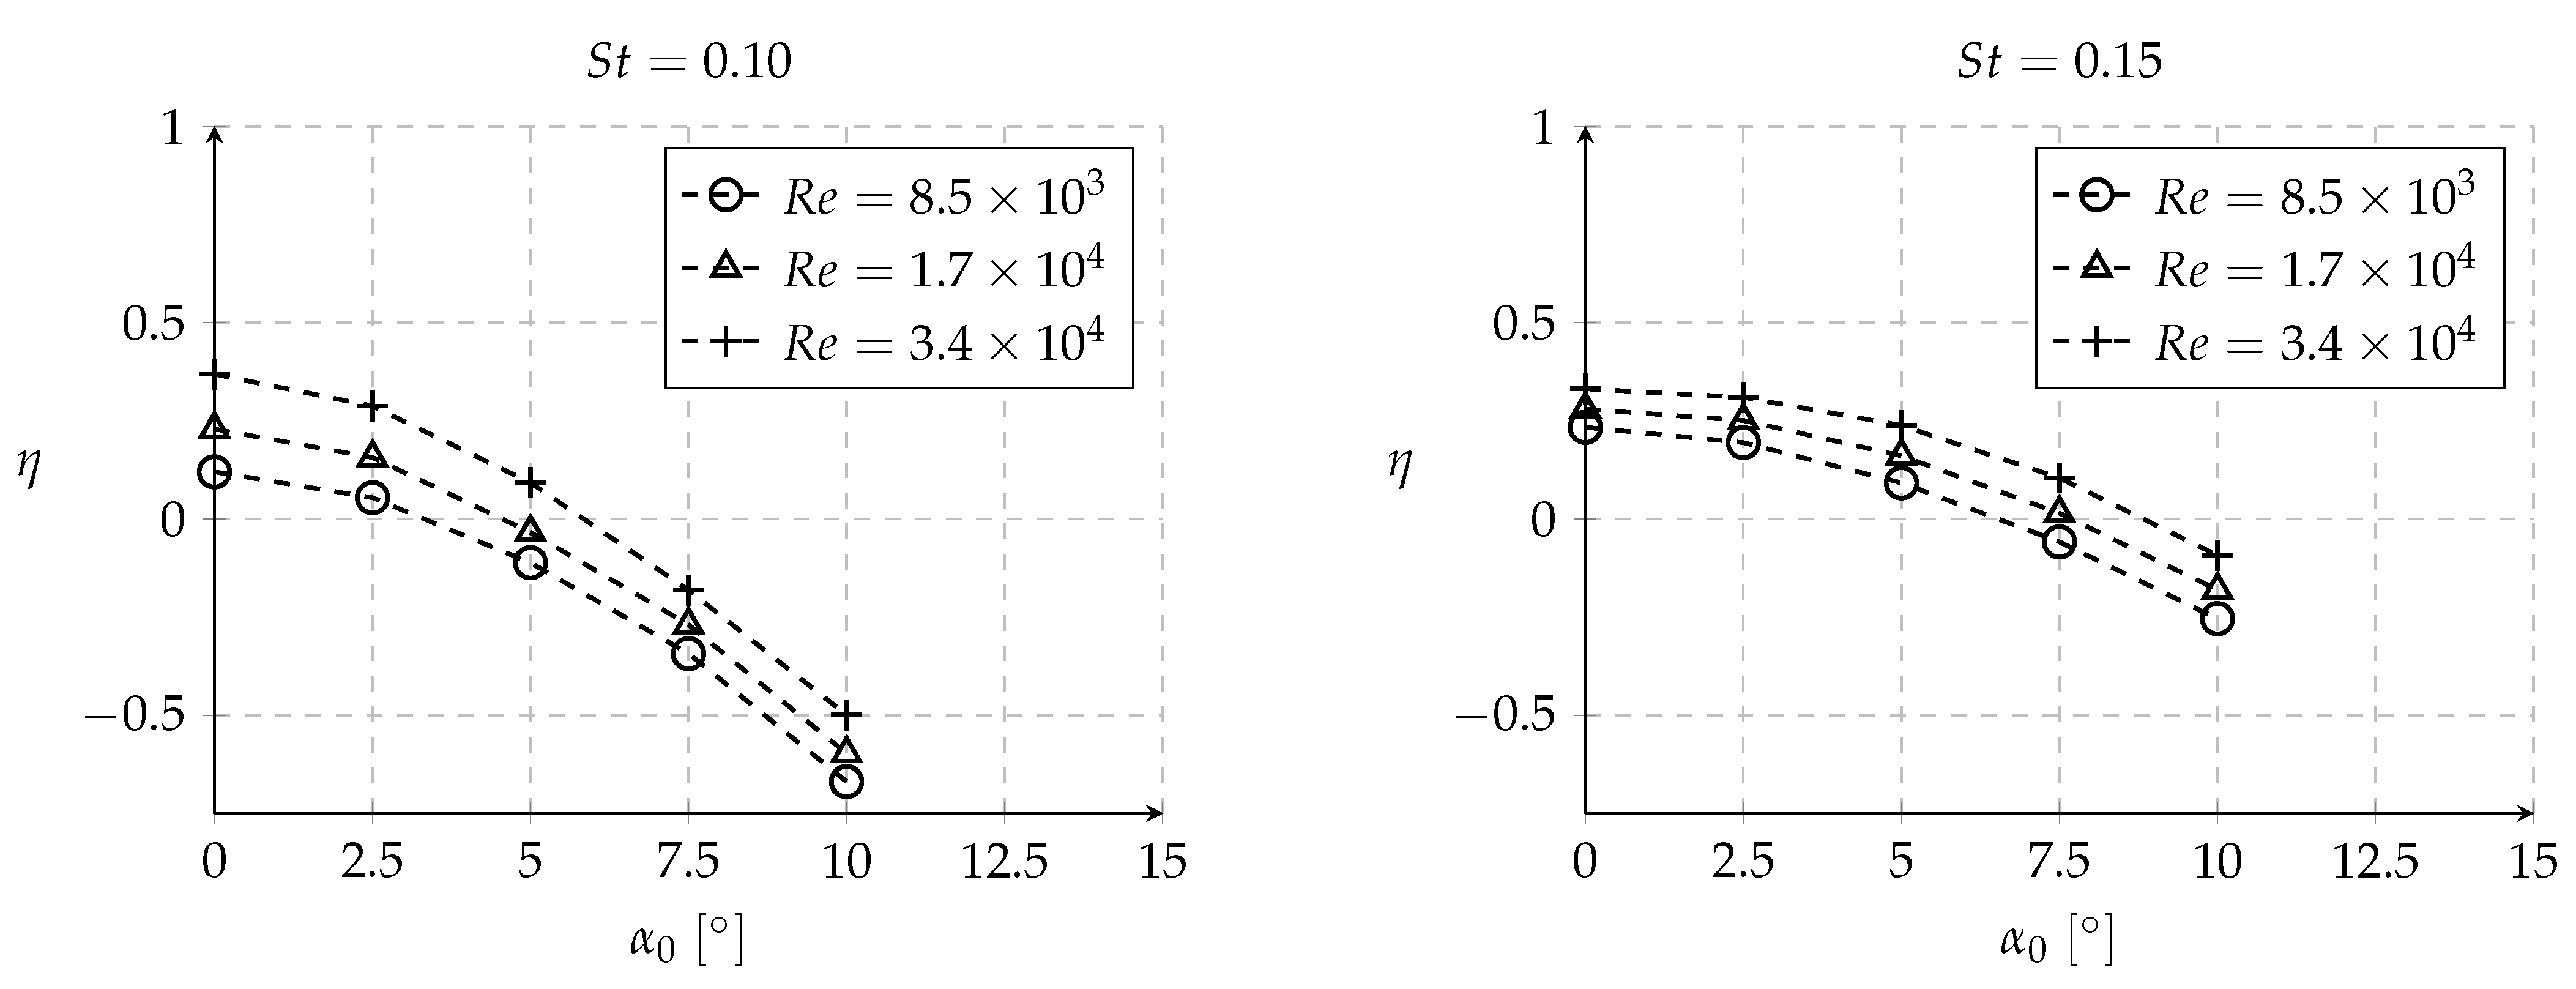
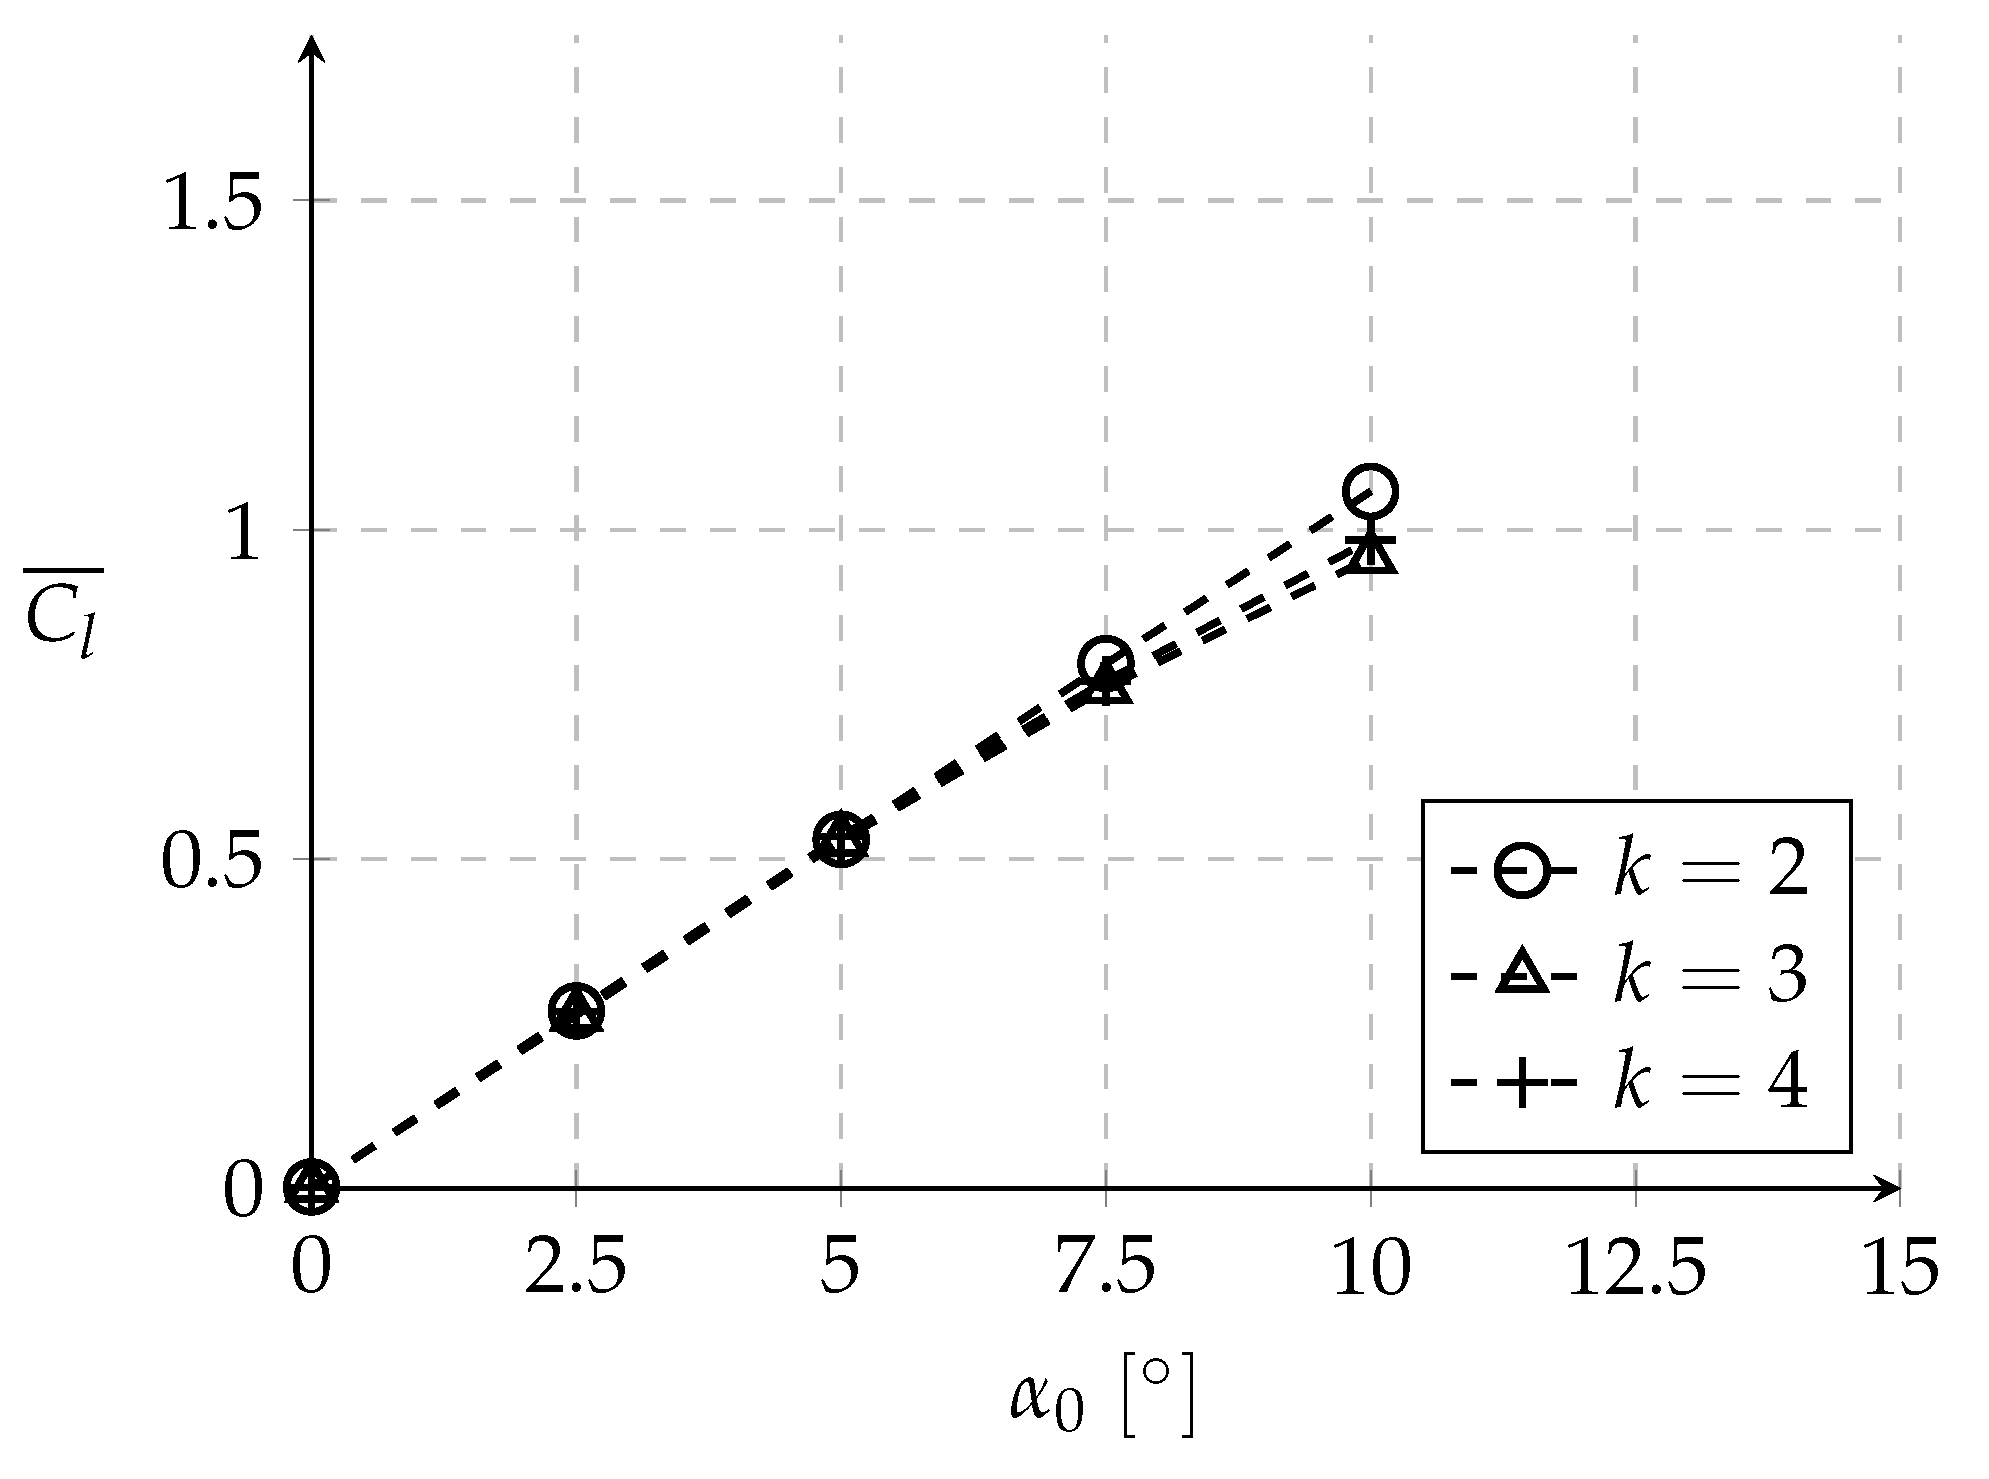
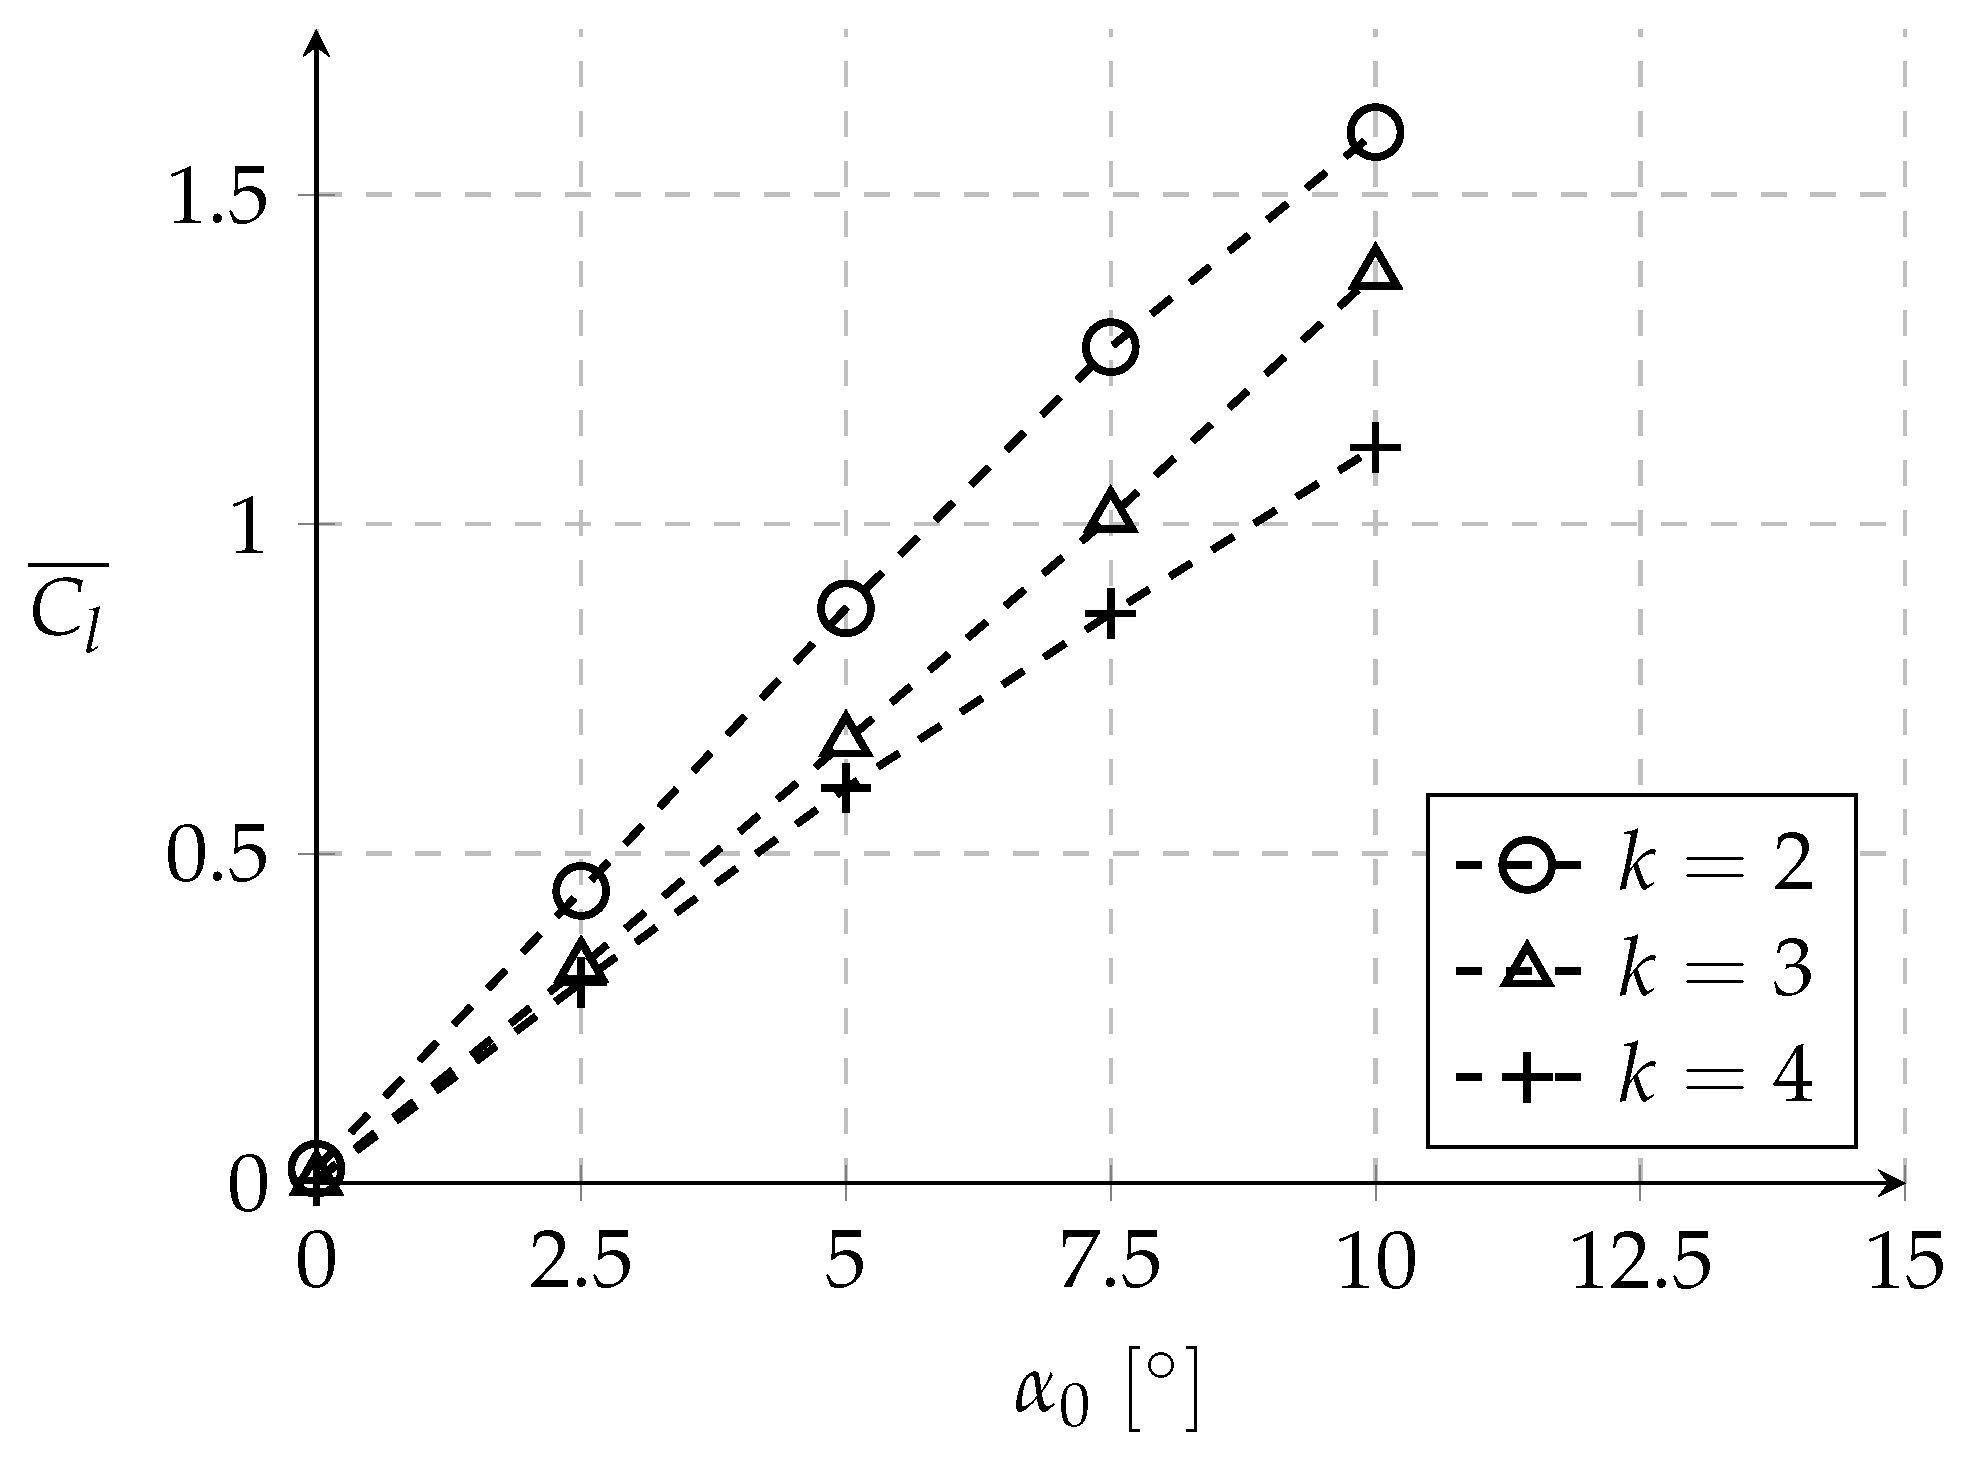
3.2. Influence of the Mean Angle of Attack
4. Conclusions
Author Contributions
Funding
Conflicts of Interest
References
- Lee, J.S.; Kim, C.; Kim, K.H. Design of Flapping Airfoil for Optimal Aerodynamic Performance in Low-Reynolds Number Flows. AIAA J. 2006, 44, 1960–1972. [Google Scholar] [CrossRef]
- Jones, K.D.; Dohring, C.M.; Platzer, M.F. Experimental and Computational Investigation of the Knoller-Betz Effect. AIAA J. 1998, 36, 1240–1246. [Google Scholar] [CrossRef]
- Koochesfahani, M.M. Vortical Patterns in the Wake of an Oscillating Airfoil. AIAA J. 1989, 27, 1200–1205. [Google Scholar] [CrossRef]
- Tuncer, I.H.; Platzer, M.F. Computational Study of Flapping Airfoil Aerodynamics. AIAA J. Aircr. 2000, 37, 514–520. [Google Scholar] [CrossRef] [Green Version]
- Camacho, E.; Neves, F.; Silva, A.; Barata, J. Numerical Investigation of Frequency and Amplitude Influence on a Plunging NACA0012. Energies 2020, 13, 1861. [Google Scholar] [CrossRef] [Green Version]
- Barata, J.M.M.; Silva, T.A.J.; Neves, F.M.S.P.; Silva, A.R.R. Experimental Analysis of Forces During Take-Off of Birds. In Proceedings of the AIAA Information Systems—AIAA Infotech Aerospace, Grapevine, TX, USA, 9–13 January 2017; pp. 1196–1203. [Google Scholar]
- Barata, J.M.M.; Neves, F.M.S.P.; Manquinho, P.A.R. Comparative Study of Wing’s Motion Patterns on Various Types of Insects on Resemblant Flight Stages. In Proceedings of the AIAA Atmospheric Flight Mechanics Conference, Dallas, TX, USA, 22–26 June 2015; pp. 828–848. [Google Scholar]
- Taylor, G.K.; Nudds, R.L.; Thomas, A.L.R. Flying and Swimming Animals Cruise at a Strouhal Number Tuned for High Power Efficiency. Nature 2003, 425, 707–711. [Google Scholar] [CrossRef] [PubMed]
- Vuruskan, A.; Fenercioglu, I.; Cetiner, O. A study on forces acting on a flapping wing. EPJ Web Conf. 2013, 45, 01028. [Google Scholar] [CrossRef]
- Barata, J.M.M.; Neves, F.M.S.P.; Manquinho, P.A.R.; Silva, T.A.J. Propulsion for Biological Inspired Micro-Air Vehicles (MAVs). Open J. Appl. Sci. 2016, 6, 7–15. [Google Scholar] [CrossRef] [Green Version]
- Knoller, R. Die Gesetze des Luftwiderstandes; Verlag des Österreichischer Flugtechnischen Vereines: Wien, Austria, 1909; pp. 1–14. [Google Scholar]
- Betz, A. Ein Beitrag zur Erklärung des Segelfluges. Zeitschrift Flugtechnik für Motorluftschiffahrt 1912, 3, 269–272. [Google Scholar]
- von Kármán, T.; Burguers, J. Aerodynamic Theory: General Aerodynamic Theory: Perfect Fluids; Division, E., Ed.; Julius Springer Publisher: Berlin, Germany, 1935; Volume II, pp. 293–310. [Google Scholar]
- Garrick, I. Propulsion of a Flapping and Oscillating Aerofoil. In NACA Report No. 567; National Advisory Committee for Aeronautics: Washington, DC, USA, 1936. [Google Scholar]
- Theodorsen, T. General Theory of Aerodynamic Instability and the Mechanism of Flutter. In NACA Report R-496; National Advisory Committee for Aeronautics: Washington, DC, USA, 1935; pp. 291–311. [Google Scholar]
- Platzer, M.F.; Jones, K.D.; Young, J.; Lai, J.C.S. Flapping Wing Aerodynamics-Progress and Challenges. AIAA J. 2008, 46, 2136–2149. [Google Scholar] [CrossRef]
- Lewin, G.C.; Haj-Hariri, H. Modelling Thrust Generation of a Two-Dimensional Heaving Airfoil in a Viscous Flow. J. Fluid Mech. 2003, 492, 339–362. [Google Scholar] [CrossRef]
- Lai, J.C.S.; Platzer, M.F. Jet Characteristics of a Plunging Airfoil. AIAA J. 1999, 37, 1529–1537. [Google Scholar] [CrossRef]
- Young, J. Numerical Simulation of the Unsteady Aerodynamics of Flapping Airfoils. Ph.D. Thesis, The University of New South Wales, Sydney, Australia, 2005. [Google Scholar]
- Young, J.; Lai, J.C.S. Vortex Lock-in Phenomenon in the Wake of a Plunging Airfoil. AIAA J. 2007, 45, 485–490. [Google Scholar] [CrossRef]
- Tuncer, I.H.; Platzer, M.F. Thrust Generation due to Airfoil Flapping. AIAA J. 1996, 34, 324–331. [Google Scholar] [CrossRef]
- Camacho, E.A.R.; Neves, F.M.S.P.; Silva, A.R.R.; Barata, J.M.M. Parametric Study of a Plunging NACA0012 Airfoil. KnE Eng. 2020, 5, 424–437. [Google Scholar]
- Jones, K.D.; Platzer, M.F. Numerical Computation of Flapping-Wing Propulsion and Power Extraction. In Proceedings of the 35th Aerospace Sciences Meeting & Exhibit, Reno, NV, USA, 6–10 January 1997. [Google Scholar]
- Tuncer, I.H.; Walz, R.; Platzer, M. A Computational Study on the Dynamic Stall of a Flapping Airfoil. In Proceedings of the 16th Applied Aerodynamics Conference, Technical Papers, Albuquerque, NM, USA, 15–18 June 1998. [Google Scholar]
- Young, J.; Lai, J.C.S. Oscillation Frequency and Amplitude Effects on the Wake of a Plunging Airfoil. AIAA J. 2004, 42, 2042–2052. [Google Scholar] [CrossRef]
- Young, J.; Lai, J.C.S. Mechanisms Influencing the Efficiency of Oscillating Airfoil Propulsion. AIAA J. 2007, 45, 1695–1702. [Google Scholar] [CrossRef]
- Chiereghin, N.; Cleaver, D.J.; Gursul, I. Unsteady Lift and Moment of a Periodically Plunging Airfoil. AIAA J. 2019, 57, 208–222. [Google Scholar] [CrossRef] [Green Version]
- Gursul, I.; Cleaver, D. Plunging oscillations of airfoils and wings: Progress, opportunities, and challenges. AIAA J. 2019, 57, 3648–3665. [Google Scholar] [CrossRef]
- ANSYS Fluent. ANSYS Fluent Theory Guide (Release 15.0); ANSYS, Inc.: Canonsburg, PA, USA, 2013. [Google Scholar]
- Wu, X.; Zhang, X.; Tian, X.; Li, X.; Lu, W. A review on fluid dynamics of flapping foils. Ocean Eng. 2020, 195, 106712. [Google Scholar] [CrossRef]
- Rogowski, K.; Królak, G.; Bangga, G. Numerical Study on the Aerodynamic Characteristics of the NACA 0018 Airfoil at Low Reynolds Number for Darrieus Wind Turbines Using the Transition SST Model. Processes 2021, 9, 477. [Google Scholar] [CrossRef]
- Ashraf, M.; Young, J.; Lai, J. Effect of airfoil thickness, camber and reynolds number on plunging airfoil propulsion. In Proceedings of the 47th AIAA Aerospace Sciences Meeting Including the New Horizons Forum and Aerospace Exposition, Orlando, FL, USA, 5–8 January 2009; pp. 1274–1283. [Google Scholar]
- Heathcote, S.; Wang, Z.; Gursul, I. Effect of spanwise flexibility on flapping wing propulsion. J. Fluids Struct. 2008, 24, 183–199. [Google Scholar] [CrossRef]
- Tay, W.B.; Lim, K.B. Analysis of non-symmetrical flapping airfoils. Acta Mech. Sin. 2009, 25, 433–450. [Google Scholar] [CrossRef]


Publisher’s Note: MDPI stays neutral with regard to jurisdictional claims in published maps and institutional affiliations. |
© 2021 by the authors. Licensee MDPI, Basel, Switzerland. This article is an open access article distributed under the terms and conditions of the Creative Commons Attribution (CC BY) license (https://creativecommons.org/licenses/by/4.0/).
Share and Cite
Camacho, E.A.R.; Neves, F.M.S.P.; Silva, A.R.R.; Barata, J.M.M. Plunging Airfoil: Reynolds Number and Angle of Attack Effects. Aerospace 2021, 8, 216. https://doi.org/10.3390/aerospace8080216
Camacho EAR, Neves FMSP, Silva ARR, Barata JMM. Plunging Airfoil: Reynolds Number and Angle of Attack Effects. Aerospace. 2021; 8(8):216. https://doi.org/10.3390/aerospace8080216
Chicago/Turabian StyleCamacho, Emanuel A. R., Fernando M. S. P. Neves, André R. R. Silva, and Jorge M. M. Barata. 2021. "Plunging Airfoil: Reynolds Number and Angle of Attack Effects" Aerospace 8, no. 8: 216. https://doi.org/10.3390/aerospace8080216
APA StyleCamacho, E. A. R., Neves, F. M. S. P., Silva, A. R. R., & Barata, J. M. M. (2021). Plunging Airfoil: Reynolds Number and Angle of Attack Effects. Aerospace, 8(8), 216. https://doi.org/10.3390/aerospace8080216