7.1. Experiments Set Up
In this section we apply the fourth step of the methodology to a set of potential new situations given by the traffic recovery scenarios and increasing ground side capacity. In order to achieve that, we have set up different scenarios for testing. These scenarios are related to different traffic situations and are based on the current state of the European traffic network [
1]. We took as reference the flight schedule of one day in 2016 (19 February 2019), where the air traffic was at its peak and which was similar to the one in 2019 (pre-COVID-19) [
39]. These data come from airspace surveillance data, and they include relevant information such as aircraft speed, altitude, entry time in the TMA, aircraft type, and aircraft in-block and off-block times. We started by testing a scenario where only 35% (S1) of that traffic is active. We consider additional scenarios where we assume a short (medium)-term traffic recovery, boosted by the current vaccination programs in Europe, testing 45% (S2) and 55% (S3) of active traffic compared to the reference flight schedule. The first row of
Table 3 shows the amount of flights of the reference flight schedule, while the rest of the rows show the amount of flights for the three scenarios, 35% (S1), 45% (S2) and 55% (S3), respectively.
Another set of experiments was conducted by gradually increasing the terminal capacity (number of stands available), as it would make sense that once the traffic increased, new stands would also be made available. We have tested, in the case of 45% (S4) traffic recovery, an additional scenario where the capacity of the terminal is set to 60. In the other two scenarios the terminal capacity was set to 70 and the traffic recovery as 45% (S5) and 55% (S6).
Table 4 shows these additional scenarios.
Finally, we wanted to test the effect on the airspace and ground performance by focusing on the ground delay strategy, by increasing the range of the delay assigned to the departing aircraft. This is tested for the three traffic recovery scenarios, by allowing a maximum ground delay of 30 min (see
Table 5).
The performance evaluated can be classified into two groups: capacity performance and ATM performance. They are summarized in
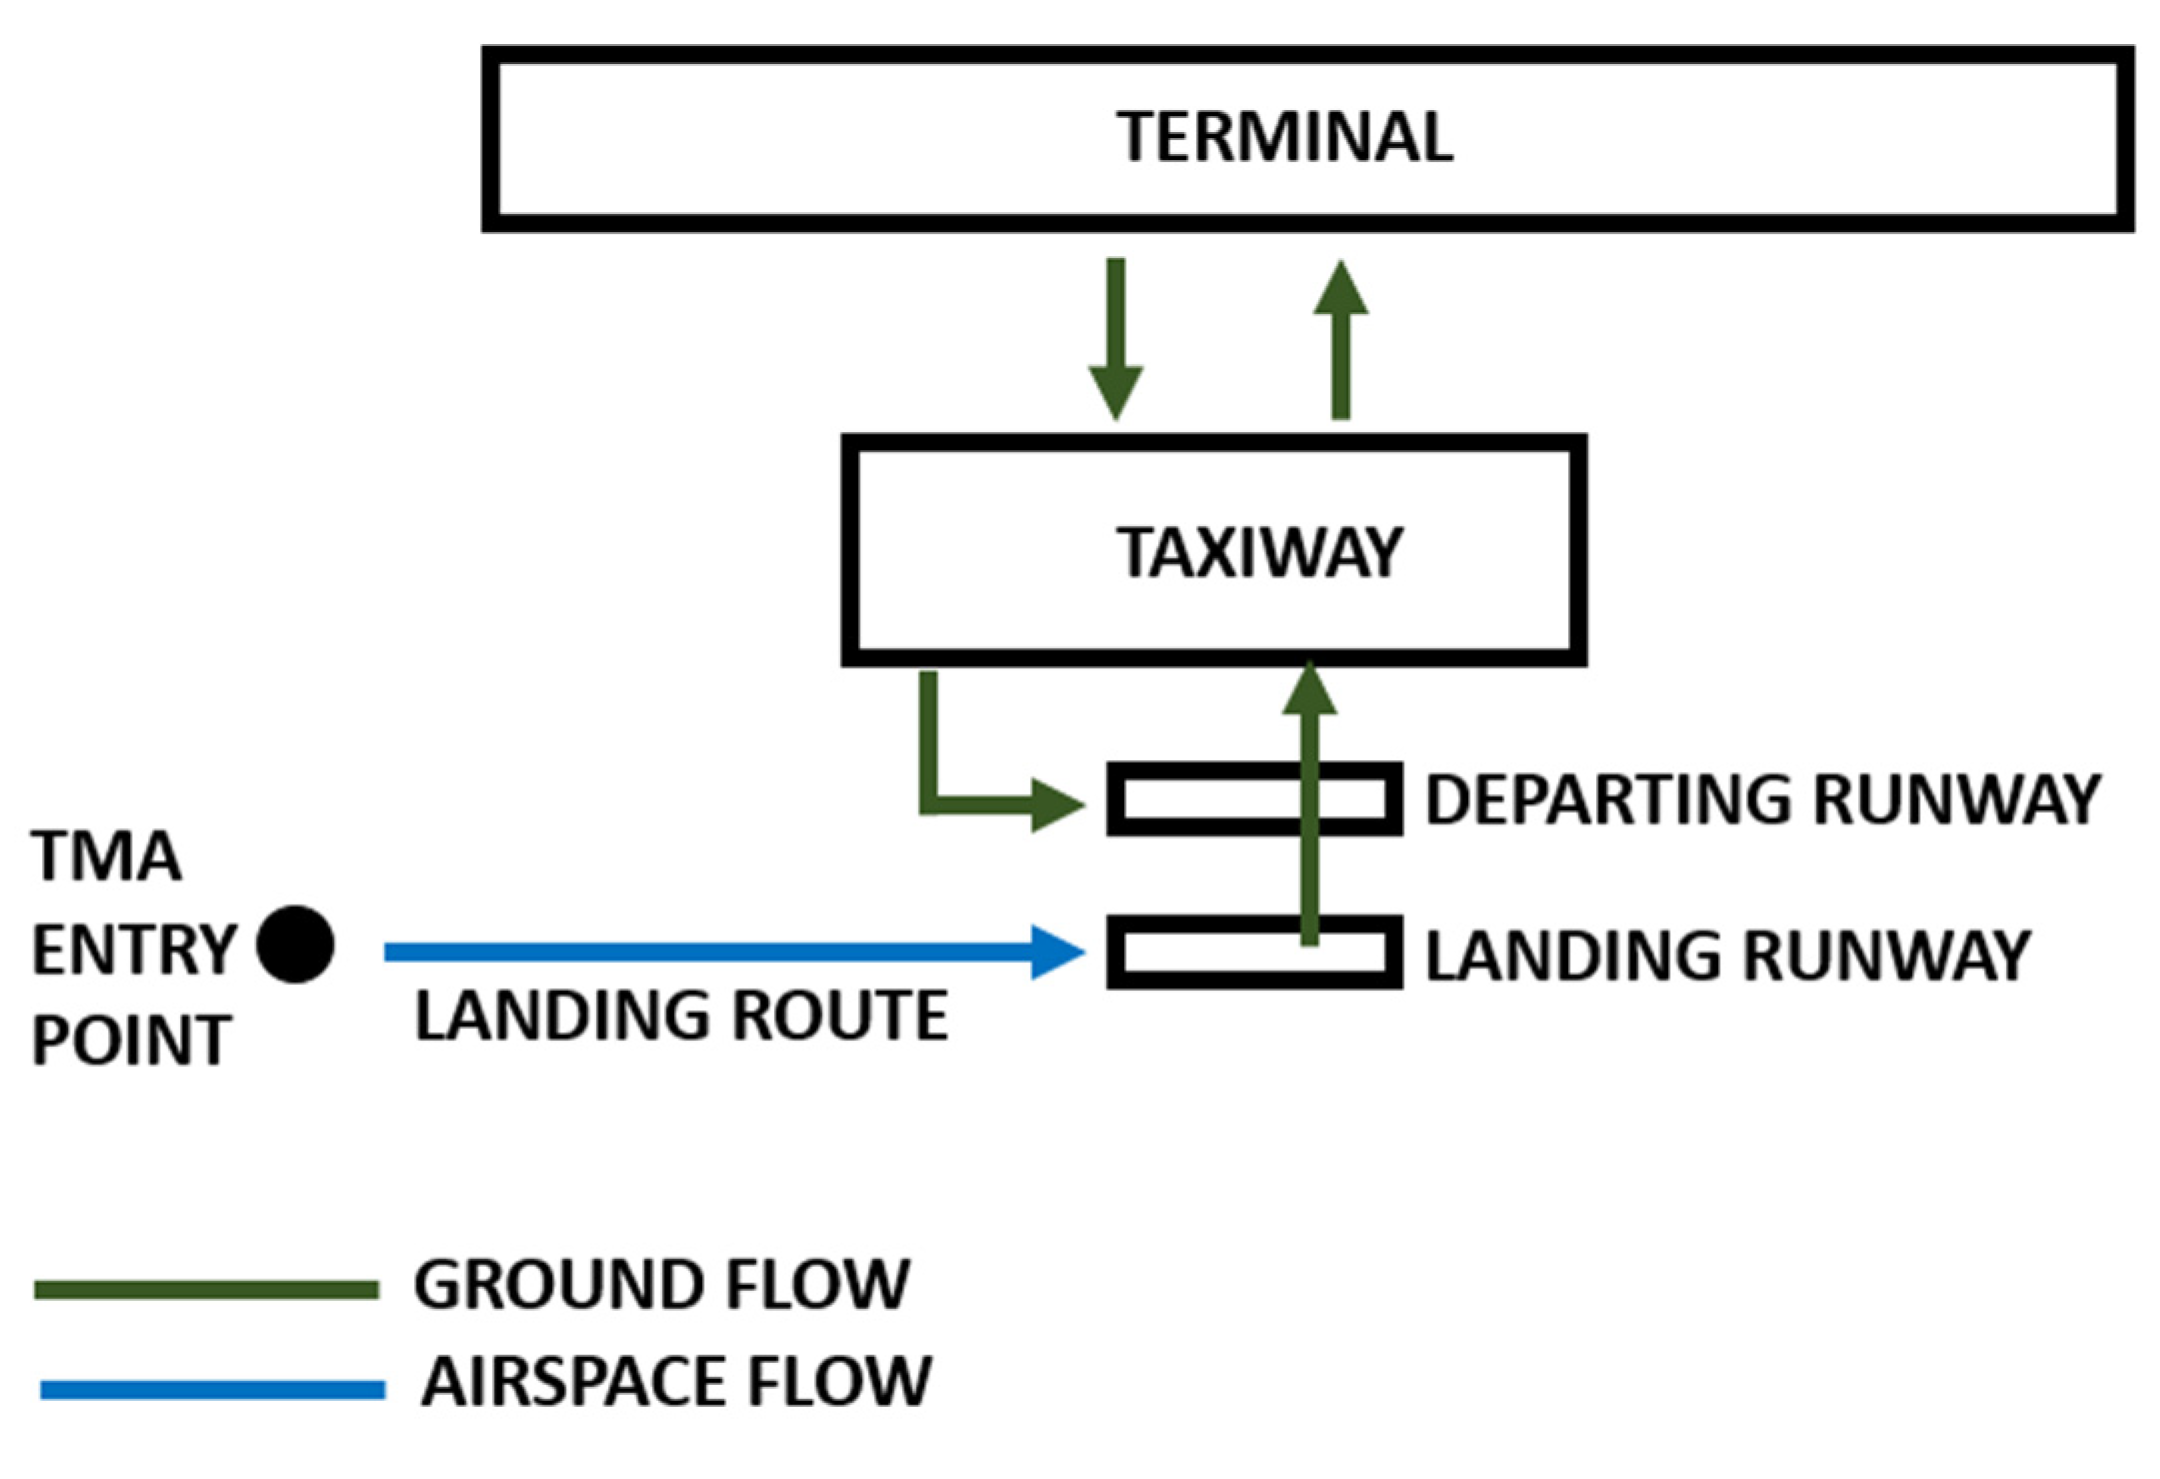
Table 6. The capacity performance gives us insights about potential congestion and bottlenecks either in the airspace or on the ground, while ATM performance gives us an idea on the changes in the flight schedule to be made by the ATCOs decisions. Within the capacity performance we have three subcategories: Airspace performance; runway performance; ground side performance. These values are obtained from the optimization model. By post-processing the optimization model results, we could obtain even more specific results regarding each single component. In this way we could evaluate the airspace performance by using three indicators: total airspace conflicts, aircraft involved in the airspace conflicts and average conflicts per aircraft. While the first indicator is a general one, the second and the third give an idea of the congestion of the airspace TMA. Runway performance is evaluated by three indicators: arrival, departure and crossing conflicts. The first two are evaluated on the dedicated runway for arrivals and departures operations, while the third represents the conflicts occurring when the departure runway is crossed by an arriving aircraft. As in the layout of CDG airport, the arrival and departure runway are placed one next to each other in a parallel position, and since the arrival runway is placed in an outer position with respect to the departure runway, the aircraft need to cross the inner (departure) runway after having landed. Ground side performance is evaluated by using two indicators: max taxiway overload; max terminal overload. The ATM performance is obtained by analyzing the decision variables of the optimization model which represent ATM strategies for managing the traffic. We have airspace delay (advance), ground delay and entry speed in the TMA changes.
7.2. Results and Discussion
In this section we present the results in terms of capacity and ATM performance for each of the scenarios described in the previous section. We start from the scenarios S1, S2 and S3, where the facilities considered are the ones described in the
Section 4 and in
Table 4.
As is shown in
Table 7, S3 presents the worst performance. In this scenario we find in total 94 airspace conflicts, which reveals that the arrival flow in the TMA is very congested. It can be seen that 15.13% of the arrival aircraft (46) are involved in these 94 conflicts, having on average 2.04 conflicts per flight. This scenario shows congestion also in the runway system, with 68 conflicts spread among the departure runway, the arrival runway and the runway crossing. We notice that the crossing conflicts have the highest value, suggesting that the arrival/departure sequence must be improved. Looking at the ground side performance, we notice that all three scenarios suffer from capacity overload, especially in the terminal. By looking at
Figure 7,
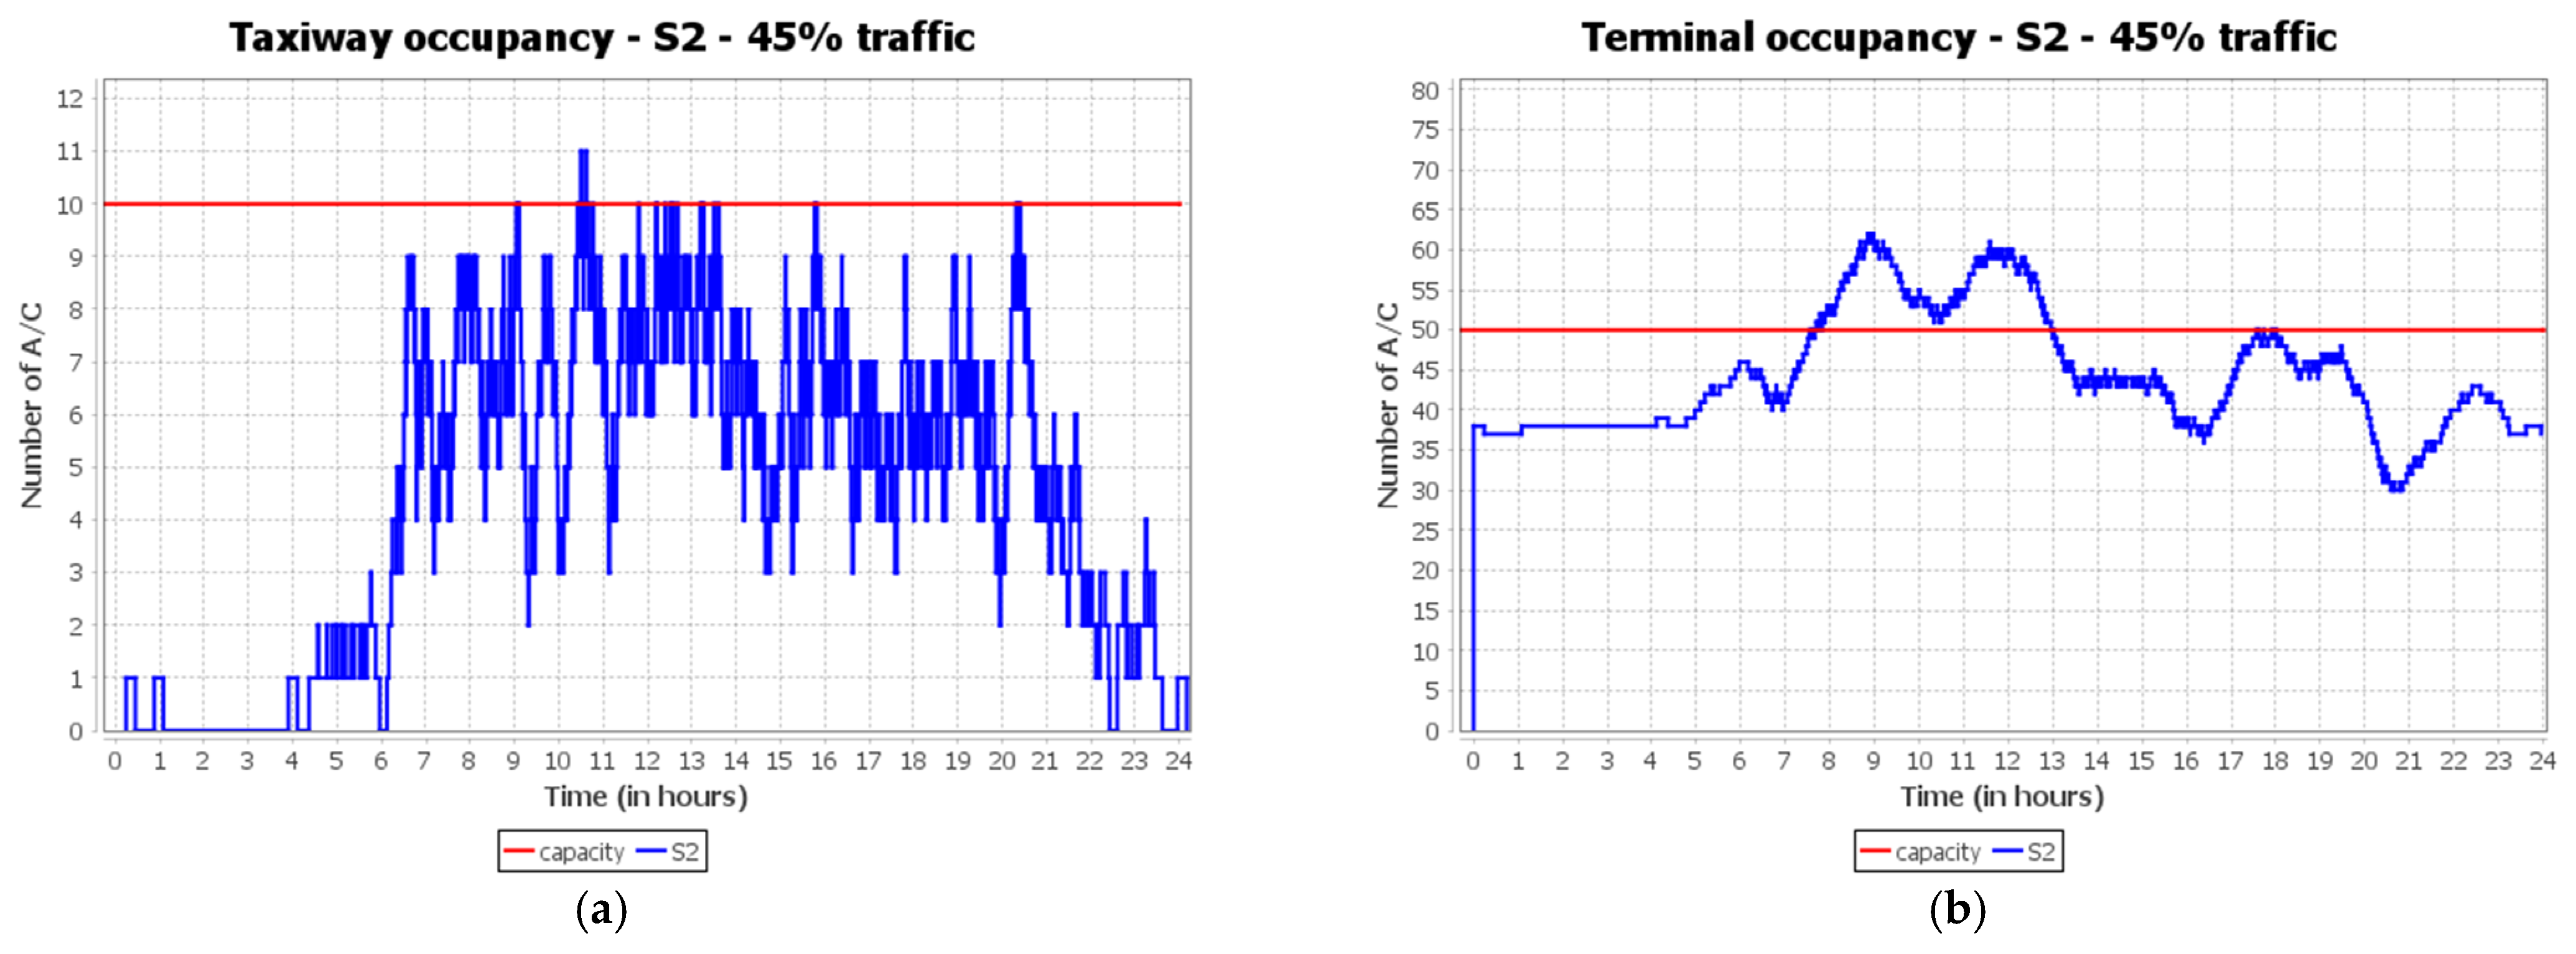
Figure 8 and
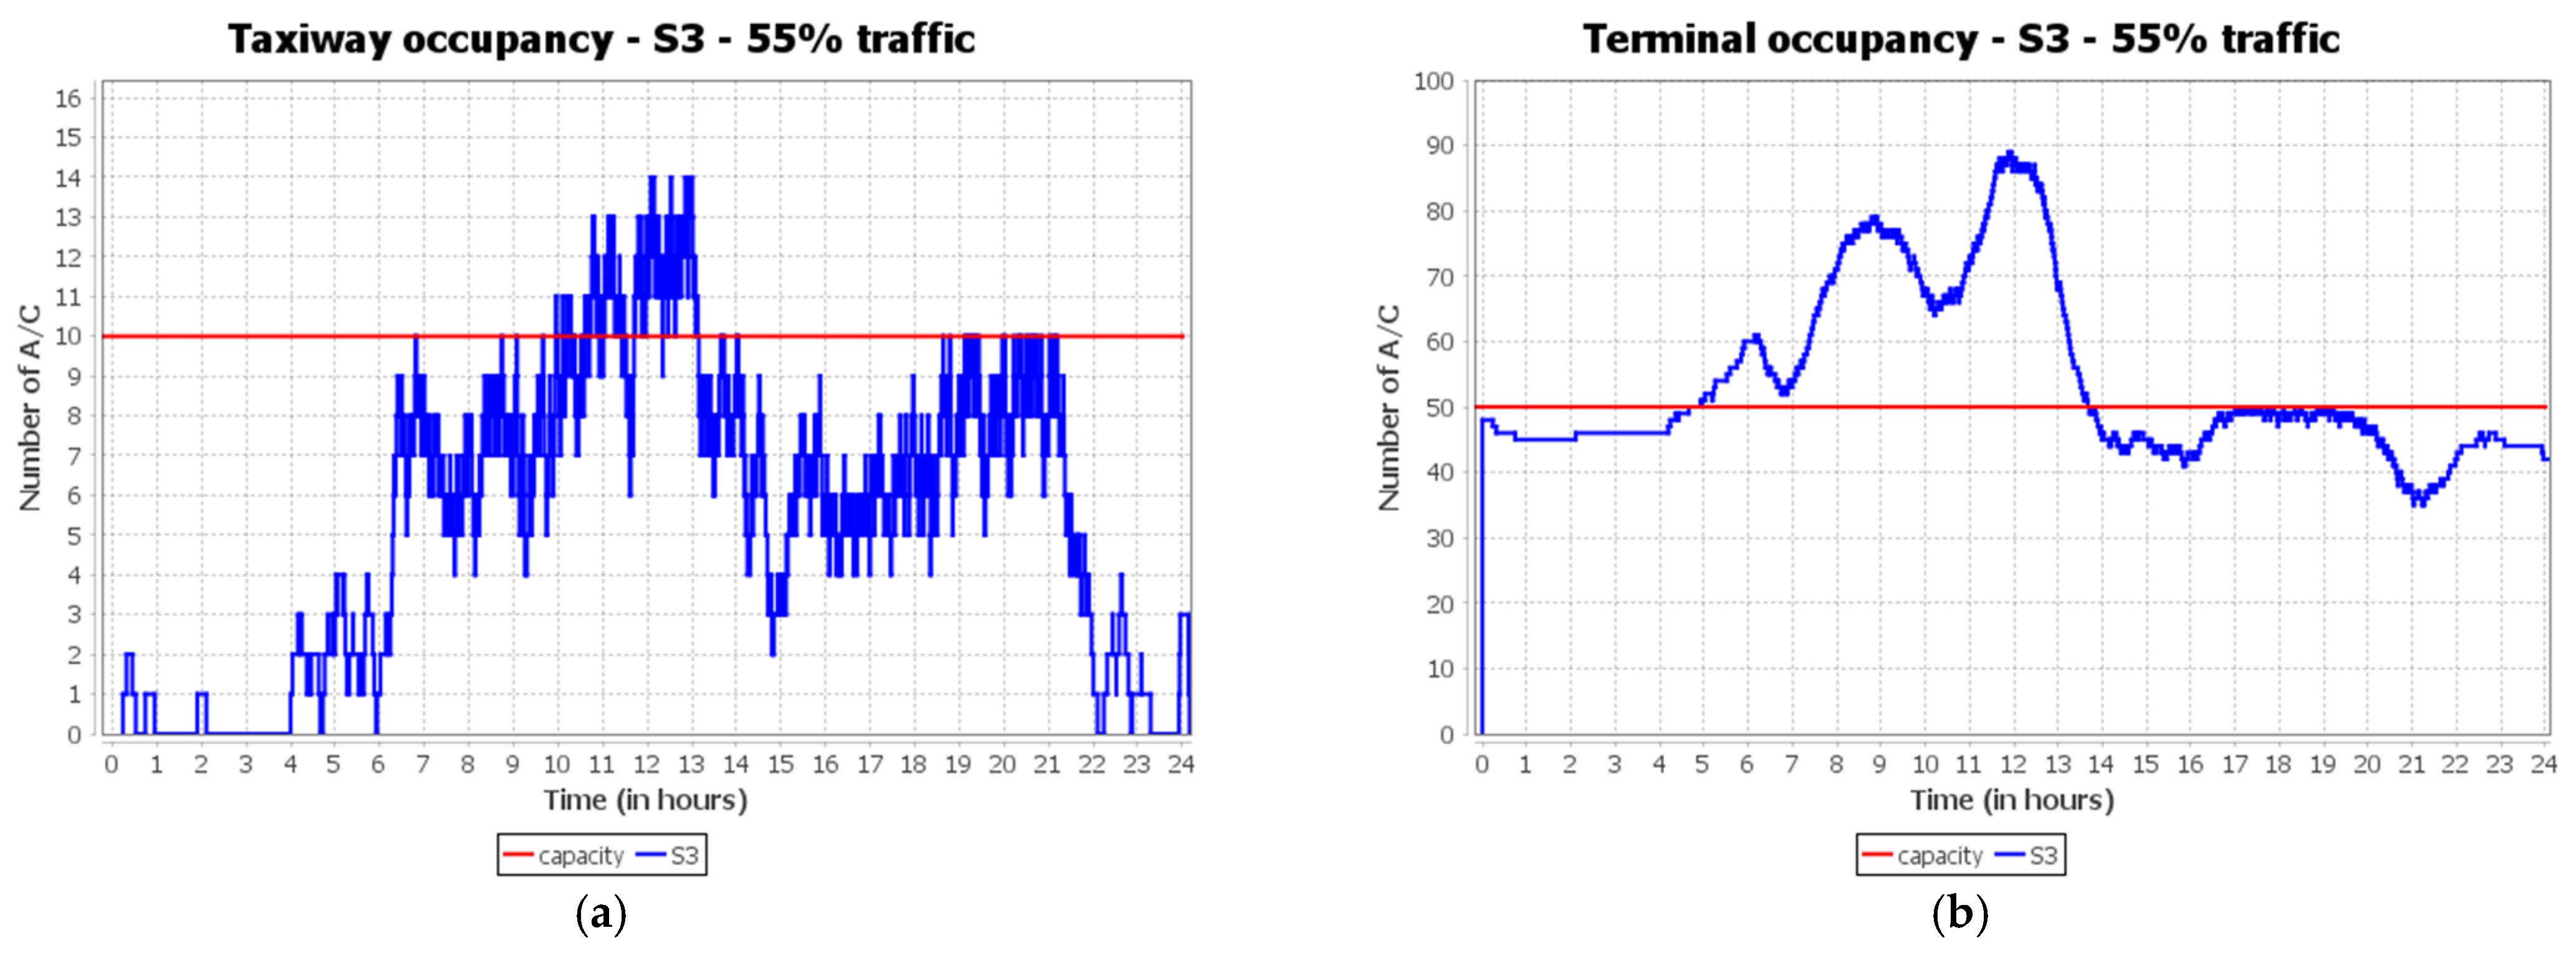
Figure 9, we can appreciate the daily occupancy of the taxiway and terminal for scenarios S1, S2, and S3, respectively.
Figure 7b, related to S1, shows that there is an overload of 24, which is concentrated on a main peak around 9.00.
Figure 8b, related to S2, shows a lower max overload (12) than S1; however, there are two peaks around 9:00 and 12:00.
Figure 8b shows the presence of three peaks of capacity overload, at 6:00, 9:00 and 12:00, in which the maximum among them is 39.
Figure 7a,
Figure 8a and
Figure 9a, show that the taxiway occupancy is kept under the capacity threshold in S1, while in S2 we have a max overload of 1, and in S3 a max overload of 4. It is worth noting that the taxiway overload in S3, even if it is not big, lasts for almost 3 h from 10:00 to 13:00. It matches when the second main peak of terminal overload decreases and the third main peak starts to increase (see
Figure 9b), suggesting that in these hours the taxiway occupancy is affected by a departure wave (terminal occupancy decreases) and right afterwards by an arrival wave (terminal occupancy increases).
Analyzing the ATM performance in
Table 8, we notice that on average we have similar values on the decision making about airspace delay (advance), entry speed in the TMA changes and ground delay. For the first two indicators we have similar standard deviation among the three scenarios, suggesting that they have similar dispersion from the average as well. Ground delay, on the other hand, shows a higher average value and a lower standard deviation for S1 compared to S2 and S3. This effect explains that for S1 a ground delay strategy is effective as, by shifting departures later in time, empty time slots for departure can be filled. On the other hand, as S2 and S3 have more traffic to handle (two and three overload peaks, respectively), a ground delay strategy might not necessarily work, as the busier schedule would mean having fewer time slots available for departure. Therefore, shifting aircraft later in time might generate further overloads. Moreover, less dispersion would mean that the decision variable has not been tweaked using its full potential range, while for S2 and S3 the opposite phenomena occur. This means that, in S2 and S3, the optimization model found it harder to obtain a suboptimal solution, and it needed to use the ground delay decision variable considering a bigger range.
In the scenarios S4, S5 and S6, we consider the effect of increasing the terminal capacity, by adding either contact or remote stands, as the terminal capacity has been revealed to be the most critical in the previous scenarios.
Table 9 summarizes the capacity performance of S4, S5 and S6. It is straightforward to see that in S4 and S5, when the traffic is at 45%, the terminal capacity does not particularly suffer from congestion. Especially in S5, the terminal can accommodate all the traffic without overload.
Figure 10 and
Figure 11 show the taxiway and terminal occupancy for S4 and S6. In S6, when the traffic is increased up to 55%, even though the terminal capacity is increased to 70, overloads appear at both the taxiway and terminal. As can be seen in
Figure 11b, there are two overload peaks, one between 8:00 and 10:00 of 10 aircraft and another between 11:00 and 13:00 of 20 aircraft. Regarding the airspace performance, we obtain few airspace conflicts (6) while the runway system is free from conflicts. S6 shows fewer airspace conflicts (80) compared to S3 (94), with fewer aircraft involved in conflicts (40 in S6 against 56 in S3), leading to an average of two conflicts per aircraft. Regarding the runway conflicts, we notice that although arrival runway and departure runway show similar numbers of conflicts, the number of crossing conflicts is reduced from 50 to 42 in S3 and S6, respectively. The major improvement regards the terminal overload (20) which is almost halved compared to S3 (39).
The results of the ATM performance, displayed in
Table 10, show that the delay in the airspace on average is higher in S6 than in S4 and S5, thus the optimization must tweak this decision variable more to find a suboptimal possible solution. This is given by the fact that in S6 the traffic is higher than in S4 and S5, therefore, the optimization finds it more difficult to reach a suboptimal solution. The entry speed in the TMA turns out to be a factor not impacting the system, as their values are similar in all scenarios so far. Regarding the ground delay, we notice that S4 and S5 have bigger average and standard deviation values than S6. Similar to S3, by delaying too many of the aircraft on the ground the optimization model finds it difficult to generate a better solution. In this scenario, a ground delay strategy could be counterproductive due to the high traffic.
In scenarios S7, S8 and S9, we have kept the values of the facilities as the original ones described in the
Section 4 and we have focused on the reinforcement of the ground delay strategy. By applying this strategy, we expect a better the departure sequence, reducing taxiway and terminal overloads, departure and crossing runway conflicts. The results are summarized in
Table 11 and
Table 12 and in
Figure 12,
Figure 13 and
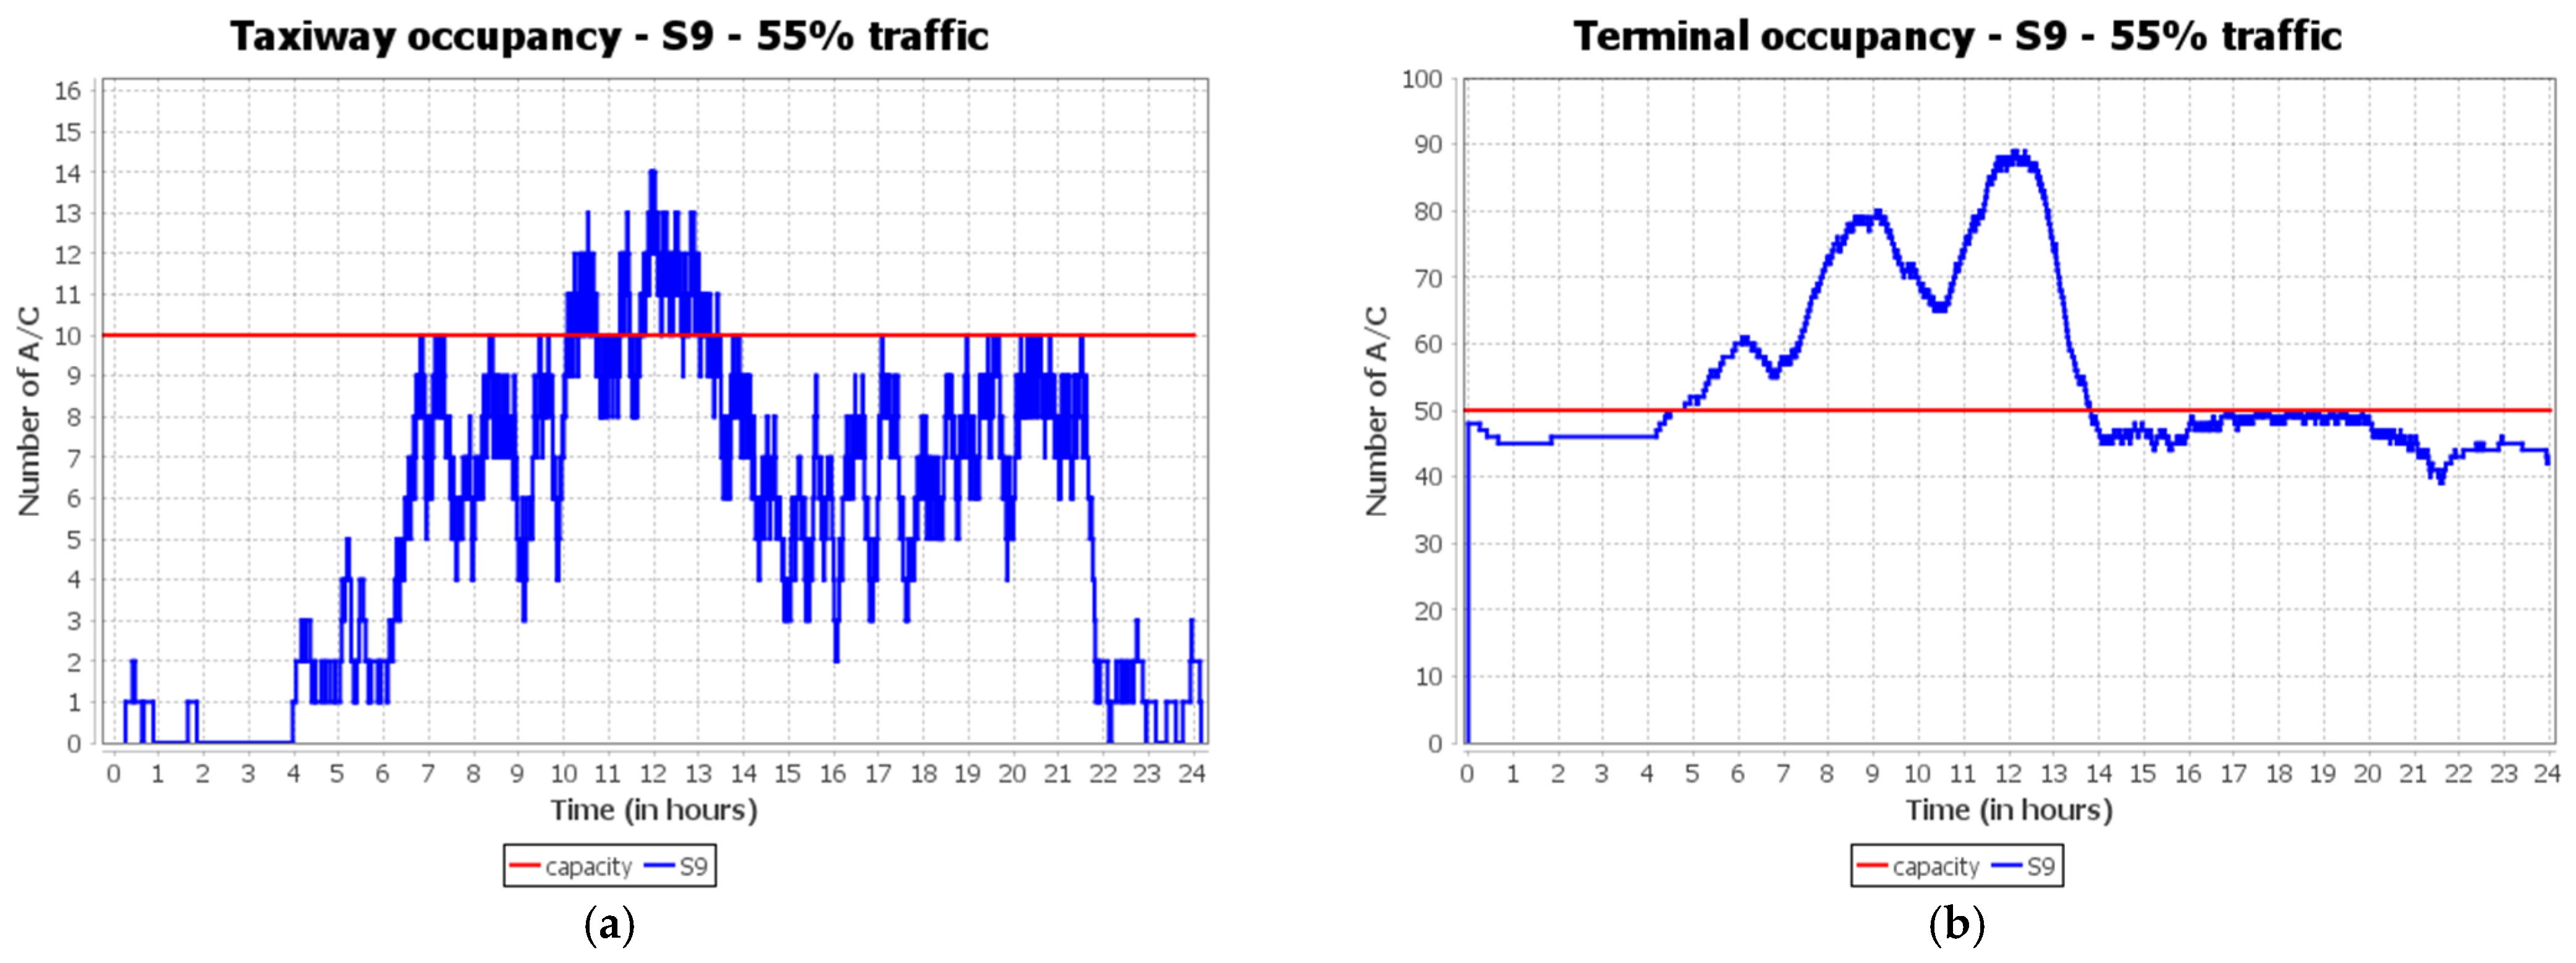
Figure 14. By comparing S7 with S1, we notice only a small improvement concerning the terminal overload, which has improved by one unit. In Scenario S8 this strategy was not effective, as when compared to S2, the only improvement is in the taxiway (0 in S8 against 1 in S2), while the terminal overload has even worsened, going from 12 in S2 to 14 in S8. Moreover, crossing conflicts (2) have been found in S8, when in S2 there were none. The scenario which has benefitted the most from the ground delay strategy appears to be S9. By comparing S9 with S3, we note that airspace conflicts have been lowered from 94 to 82 (−12.7%), and although there are more aircraft involved in conflicts (50), the average conflicts per aircraft have been reduced from 2.04 to 1.64. Regarding the runway conflicts, the main reduction was obtained for crossings (−8) and departure runway conflicts (−2). These results suggest that a better departure sequence was generated by the optimization model. In this scenario, there are no improvements in the taxiway and terminal overload, as the values remain the same as the ones in S3.
Regarding the ATM performance, it is interesting to look at the ground delay, as it is the factor that characterizes these scenarios. As expected, the average values of ground delay for these three scenarios have increased compared to the ones of the other previous scenarios. We notice that scenario S7 has a lower value of standard deviation compared to S8 and S9. Similar to S1, due to the lower traffic, the optimization model was able to find a suboptimal solution without being forced to tweak this variable a lot. S8 and S9, on the other hand, dealt with more congested traffic, therefore, the ground delay variable is assumed to be assigned more thoroughly within its range of values.


