Abstract
Paris Charles de Gaulle Airport was the second European airport in terms of traffic in 2019, having transported 76.2 million passengers. Its large infrastructures include four runways, a large taxiway network, and 298 aircraft parking stands (131 contact) among three terminals. With the current pandemic in place, the European air traffic network has declined by −65% flights when compared with 2019 traffic (pre-COVID-19), having a severe negative impact on the aviation industry. More and more often taxiways and runways are used as parking spaces for aircraft as consequence of the drastic decrease in air traffic. Furthermore, due to safety reasons, passenger terminals at many airports have been partially closed. In this work we want to study the effect of the reduction in the physical facilities at airports on airspace and airport capacity, especially in the Terminal Manoeuvring Area (TMA) airspace, and in the airport ground side. We have developed a methodology that considers rare events such as the current pandemic, and evaluates reduced access to airport facilities, considers air traffic management restrictions and evaluates the capacity of airport ground side and airspace. We built scenarios based on real public information on the current use of the airport facilities of Paris Charles de Gaulle Airport and conducted different experiments based on current and hypothetical traffic recovery scenarios. An already known optimization metaheuristic was implemented for optimizing the traffic with the aim of avoiding airspace conflicts and avoiding capacity overloads on the ground side. The results show that the main bottleneck of the system is the terminal capacity, as it starts to become congested even at low traffic (35% of 2019 traffic). When the traffic starts to increase, a ground delay strategy is effective for mitigating airspace conflicts; however, it reveals the need for additional runways.
1. Introduction
As of 2020, the entire aviation industry was facing its most difficult challenges, as the COVID-19 pandemic spread around the world. Looking at European air traffic figures from 2020 until now, we can see how the air traffic has been severely impacted. The lower peak was reached in April 2020 when the air traffic decreased by 87.1% compared to 2019. The 2020 summer season recovered some traffic, reaching a high peak of −52.9% compared to 2019. As the winter season started and more and more measures against the COVID-19 pandemic were taken by local countries, the air traffic again decreased, and it remained at −64.4% as of the third week of March [1]. EUROCONTROL’s 5-year forecast presents three scenarios considering different variables such as the availability of mass vaccination, the impact on the global economy and the potential reduction in demand (i.e., business travelers). The most optimistic scenario assumes the vaccine will be widely available for travelers by the summer of 2021—it shows a recovery of traffic to the same levels as 2019 (pre-COVID-19) in 2024. The other two scenarios assume slower or ineffective vaccination, showing a recovery of traffic to 2019 levels in 2026 and 2029, respectively.
Before the COVID-19 pandemic impacted our lives, European air traffic was following an increasing trend, putting pressure on the main nodes of the air traffic network, which are the airports. The main consequences of this increasing trend have been seen in the increase in delayed flights, canceled flights, air traffic controllers’ increased workloads and passengers’ dissatisfaction. The current situation would suggest that congestion problems would disappear, as the network has been relieved from a large amount of traffic. However, at the main European hub airports, a problem is happening that attracts the attention of researchers and practitioners in the field: as the air traffic has drastically decreased, many aircraft have been grounded at their base airports; therefore, often taxiways and runways are used as parking space for aircraft. Furthermore, due to safety reasons, passenger terminals at many airports have been partially closed [2,3]. This reduces the physical facilities at airports and sheds light on potential capacity issues that may occur.
The current COVID-19 pandemic can be defined as a rare event, as it is an event that would happen with a low probability and would cause major disruptions. Natural disasters and terrorist attacks are examples of rare events. In such events, a key aspect is the degree of recovery (resiliency) of the system affected. In the air transport sector, we have experienced rare events such as the eruption of the volcano in Eyjafjallajökull (Iceland) and the 09/11 terrorist attack. Although in the medium–long term the air traffic network has always been able to recover from these events, in the short term they have caused major problems to the main aviation stakeholders such as airlines and airport operators. The problem becomes relevant as the assets involved are very expensive and sometimes the correct strategy would mean the difference between bankruptcy (or governmental bailout) or the survival of the airport or airlines with their own resources.
In this paper we tackle the impact of such an event on ATM and airport capacity management and consider how to deal with the transition phase of recovery. The methodology is based on several steps for evaluating the impact of COVID-19 on access to airport facilities and evaluate airport capacity performance. The solution approach is based on an optimization process [4]. We conduct this analysis by testing different scenarios based on a progressive traffic recovery, different ground facility capacities, and air traffic management (ATM) control strategies. The paper will shed light on the capacity limits and on the real requirements of airports in terms of ground facilities during such a rare event.
The paper is structured as follows: in the next section a literature review is conducted about integrated airport capacity problems and about COVID-19’s impact on aviation; in Section 3, the methodology developed in this study is presented; then the case study and the airport facility evaluation are described in Section 4; Section 5 presents the problem considered in this work together with its mathematical formulation; in Section 6, the solution approach is described; in Section 7, the experiments are conducted and results are results analyzed; finally, in the Conclusions section, the main findings are discussed.
2. Literature Review
2.1. Literature Review about Airport Capacity Management
Airport capacity management (ACM), as it is defined in this study, involves airspace and ground operations in an integrated approach. In the literature there are not many studies that attempt to achieve the same scope. The authors of this article, on the other hand, have several years of experience of working on this topic, as their referenced work testify [4,5,6,7]. The work of [8] was one of the first to propose an integrated approach by considering arrival, departure and surface management. The authors of the abovementioned work implemented an optimization algorithm for solving in a sequential way the aircraft ground routing, arrival and departure sequencing, and conflict resolution problems. In [9], near-terminal airspace and ground operations were unified in a two-phase approach. First, runway configuration selection and runway sequence problems were solved, and then, ground operations were tackled by making decisions about gate holding and ground routing. Similarly, in [10,11] the problem of arrival and departure process in the airspace with ground taxiway routings was tackled. In the former, the objective was to maximize the runway throughput and to reduce the air traffic controllers’ workload, while in the latter the main objective was to reduce gate waiting time and total travel time in the airspace and on the surface. In their studies they developed mixed integer linear programing models and applied different algorithms for solving the problem. Guepet et al. [12] dealt with the departure process management integrated with the ground routing problem, with the aim of increasing runway efficiency and reducing taxi times. Their methodology was able to provide high quality results in terms of completion times and taxi times, while achieving short computational time. As already mentioned, there are already some similar works by the authors of this present article, for example in [6] airspace aircraft sequencing operations were integrated with airport ground operations at a macroscopic level. In this work, taxiways and terminals were modelled in low detail, considering them as nodes of a network characterized only by their capacity. The problem was solved by a heuristic employing a sliding window approach. The methodology was tested with a real case study and the results showed the capability of reaching a conflict-free scenario for the sequencing of arrival aircraft while mitigating the airport ground congestion. In [4,7], the same problem was solved by applying an opt-sim methodology. In these works, the objective was to obtain a more robust solution.
In the present work, the problem specification and solving approach are the same as in the three previous cited articles. The novelty of this work is that it applies the ACM problem in a scenario affected by the COVID-19 measures.
2.2. Literature about COVID-19 Impact to Airport Operations
Since the COVID-19 pandemic started, many articles have been published about the impact that it had on aviation. Among these, we can find the more high-level publication of [13] where the impact on structural aspects of aviation in the medium/long term was discussed, mentioning supply, demand, regulation and business ethics. Other authors focus on the economical aspect of the aviation industry [14] and write about airports way of operating [15]. In these articles, new sources of revenues and strategies based on passengers’ behaviors in airports during and postpandemic are discussed. The impact of COVID-19 on the air transportation network is discussed in [16,17,18]. Sun et al. [16] used complex networks techniques to assess the impact of COVID-19 on air transportation under different scales, international (country as nodes), national (primary airports as nodes) and regional (secondary airports as nodes). Hotel and Mumbower [17] analyzed the domestic US traffic, assessing the impact of COVID-19 on different categories such as: primary vs. non-primary airports, multiairport cities vs. single-airport cities. Guo et al. [18] studied the resilience and recovery of airports under different control strategies based on metrics such as aircraft movements, passenger throughput and freight throughput. Nizetic [19] studied the impact of COVID-19 on air transportation, focusing not only on mobility but also on an environmental point of view. Other authors focused on operational aspects within airport terminals, for instance, in [20] the security process at the airport terminal was studied considering how social distancing would impact security operations. Social distancing was also considered in [21], in which the focus was on the aircraft boarding problem by evaluating the COVID-19 transmission risk.
As can be seen by the previous literature review, many studies have been conducted about the impact of COVID-19 on aviation and airport operations. However, so far, there are no studies about how ATM could be impacted by the measures and restrictions put in place due to the COVID-19 pandemic. The purpose of this paper is to evaluate how restrictions on the use of ground facilities, runways, taxiways, and terminals affect the management of the air traffic in the airspace and on the ground. We achieve this by testing different scenarios based on different traffic recovery, different ground element capacity, and ATM strategies.
2.3. Contributions
This article contributes to the state of the art by considering how the disruption caused by a rare event, such as the COVID-19 pandemic, impacts on ATM and airport capacity and most importantly how to deal with the transition phase of recovery. The focus of the paper is on two aspects: ATM; and airport planning and design.
In most of the reviewed work, tactical ATM decisions include many options, such as airspace delays, speed changes, runway assignment and ground delays [4,9], while in this work we can consider only a few of them because of the consequences that the COVID-19 pandemic has had for airport operations. This limitation on ATM tactical decisions makes it hard to find optimal solutions and, on the other hand, allows us to reveal potential bottlenecks. Despite the fact that similar studies consider integrated airport operations [4,8,10,11], they do not put emphasis on how airspace or ground-related decisions affect airspace and ground performance, but only consider airport performance as a whole; how to make tactical ATM decisions under rare events. In this work, we apply an ATM, i.e., ground delay strategy, (i) to overcome the limitations of tactical ATM decisions due to rare events and (ii) to assess its impact on both airspace and ground performance.
From an airport planning and design point of view, this paper contributes by assessing the airport ground facility’s requirements in an uncertain and rare event such as the COVID-19 pandemic. The methodology employed in this paper allows us to find the bottlenecks of the system, providing airport operators with valuable insights on where additional capacity is needed. Specifically, runways’, taxiways’ and gates’ requirements are assessed under the potential traffic recovery scenarios. Although the present paper focused on a specific case study, the methodology is a generic one, so it can be extended to different airports and can be applied for dealing with disruptions generated by other rare events.
3. Methodology
The methodology applied to this study is summarized in Figure 1 and Figure 2. Figure 1 depicts a five-step methodology for a particular “situation” or state of the system. Then, based on the evolution of the rare event, we will have several “new situations” until the system reaches the normal “pre-rare event” state, as shown in Figure 2. In the first step we identify the airport facility’s availability in terms of runways, taxiways and terminals. This step considers the current state of the system. In the second step, ATM mitigation actions are evaluated. These actions are affected by the outcome of the previous step. For example, if there is only one runway available, then the runway assignment decision will be excluded from the possible ATM tactical decisions. In the third step, airspace and ground side operations are modelled by either using optimization or simulation techniques [6]. In step 4, the performance of the system is evaluated. After this step a “new setting” in the recovery can be defined and the steps are performed again for the new setting, progressively evaluating the transition settings to recovery (Figure 2). The new setting is driven by the previous one, e.g., a necessary change in the state of the system such as additional capacity available or traffic increase.
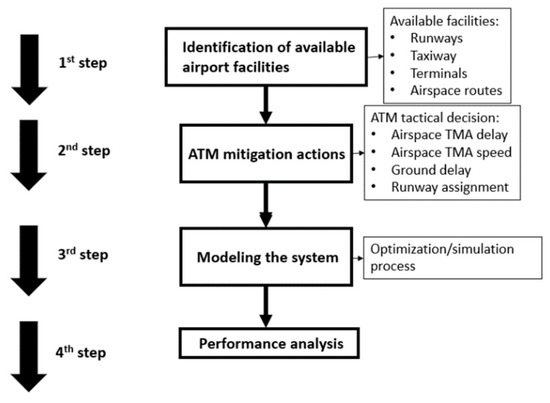
Figure 1.
Methodology diagram.
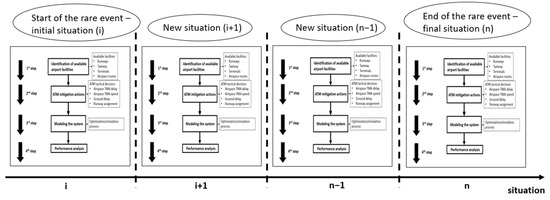
Figure 2.
Methodology applied to the evolution of the rare event.
In the following sections, the methodology is illustrated using a real case study. Particularly, in Section 4 the first step will be implemented, in Section 5 the second, in Section 6 the third and in Section 7 the fourth. Section 7 will also present a set of “new situations” that will be analyzed and discussed.
4. Airport Facilities Evaluation: Case Study Description
In this work, Paris Charles de Gaulle Airport (CDG) was taken as a case study. CDG Airport is one of the major airports in Europe, due to its size, number of passengers transported and air traffic movements. It is the hub of the French carrier Air France and in the 2019 it transported 76.2 million passengers, connecting 328 destinations in 119 countries [22]. CDG Airport has four parallel runways. They operate as independent runways, meaning that that they can simultaneously accommodate air traffic movements. In real operations two of the runways are used only for landings and the other two only for departures. Due to the COVID-19 pandemic, many aircraft had to be reallocated on the ground, and to achieve that, most of the southern airport taxiway was used. This fact led to the closure of the southern parallel runways (26L and 26R) [23]. With this new runway configuration, the airport operates with two parallel runways, one for landings (27R) and another for departures (27L) (see Table 1).

Table 1.
Characteristics of the ground side element during COVID-19.
In the TMA airspace four landing routes were identified, two coming from south and two coming from north. These routes were identified based on airspace surveillance data. Figure 3 shows the different routes in a pre-COVID-19 scenario, and with the current situation. By looking at Figure 3b, it can be noticed that the landing routes that reach runway 26L have disappeared, when compared to Figure 3a. In Figure 3a, pre-COVID-19, any of the two landing runways could have been reached by one of the four TMA entry points, having eight landing routes. Currently, with the new runway configuration, there are only four landing routes reaching only to runway 27R.

Figure 3.
Pre COVID-19 (a) and during COVID-19 (b) CDG airport airspace structure.
CDG airport is constituted by three terminals and a complex taxiway network. By applying the first step of the methodology, we have identified the ground side facilities available. Due to the COVID-19 measures, only one terminal (Terminal 2) is operating at CDG; specifically, T2 F and T2 G (see Figure 4) [24]. Table 1 shows the ground side element considered in this study. It has been assumed that the taxiway is used only partially (the northern one) and only the contact stands are used in Terminal 2 (F and G), reducing their capacity. In Table 2, the average taxi time between terminal and runways is shown. These values are derived from ground surveillance data and subsequently translated to averages.
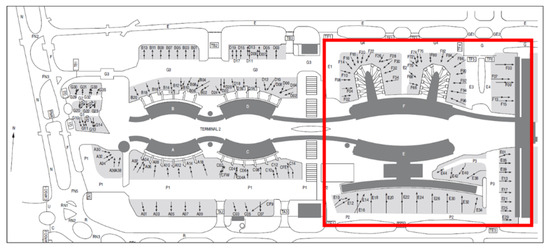
Figure 4.
Top view of CDG Terminal 2. T2F and T2G are highlighted in red.

Table 2.
Average taxi time (s).
5. ATM Tactical Decision Evaluation and Problem Formulation
In this section, we apply the second and third steps of our methodology by evaluating the consequences of the COVID-19 pandemic for ATM tactical decisions and modeling the system as an optimization model. The problem tackled in this work, the ACM, refers to the integration of the landing aircraft sequencing in the airspace near an airport and aircraft movement congestion on the ground of an airport [4,6,7]. It is relevant to see up to which traffic volume the existing reduced capacity can accommodate the traffic without any congestion. The operations involved in this problem are the following: aircraft arrival sequencing in the airspace (i.e., the Terminal Maneuvering Areas, TMA); runway operations (i.e., aircraft arrivals and departures); aircraft occupancy of the taxiway and terminal gates; and aircraft departure sequencing. Figure 5 provides a schematic overview of the problem. It is worth noting that due to the layout of the runways, when aircraft land they need to cross the departure runway to reach the taxiway—this adds extra complexity to the problem. The decisions that are to be made are: delay (advance) at the entry point of the TMA; speed modification at the entry of the TMA; ground delay. The first one refers to the time stamp given by air traffic controllers (ATCOs) at the entry point of the TMA to the aircraft. Given an already defined flight plan, aircraft could be delayed or advanced. The second decision refers to the speed that should be kept at the entry of the TMA; here, the speed could be adjusted by either decreasing or increasing it. The third decision refers to the delay that could be given to aircraft before they leave the parking stand. This last decision represents an effective strategy for sequencing the departures, which is often used at airports, such as the ground delay program developed by the FAA and similar aircraft ground holding strategies [25,26,27,28,29,30]. It can be noted that runway assignments are not considered by ATM tactical decision, as in this specific case study the airport runways are reduced to only one available landing runway. This represents a clear limitation in the ATM tactical decision making. In the next subsections the problem assumptions and the mathematical formulation of the problem are described. A detailed explanation of it can be found in [4].
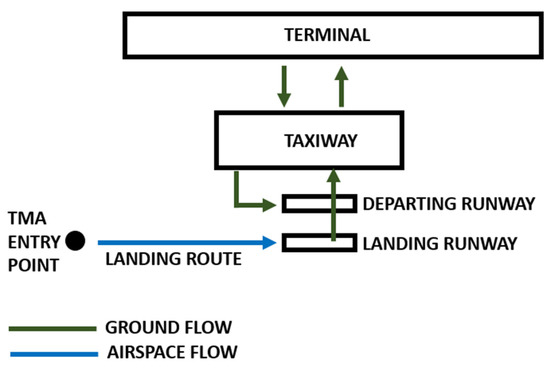
Figure 5.
Schematic representation of the operations involved in the ACM.
5.1. Problem Assumptions
The following assumptions were made for the ACM problem, as it was tackled in this work:
- Airspace standard instruments departure routes (SIDs) are not considered, as we only consider take off operations on the runway;
- Taxiway and terminals are characterized by two parameters: capacity and occupancy time. Therefore, the flow of aircraft on the ground was not modeled into detail, but it follows a macroscopic approach as defined in [4];
- The problem does not consider gate assignment, therefore, aircraft can park at the assigned terminal without having a specific gate;
- The landing routes considered are taken from public information, where separation minima are already ensured;
- Aircraft flying along landing routes are assumed to decrease their speed with a constant deceleration rate.
5.2. Mathematical Formulation
In this section the objective function, constraints and decision variables of the ACM optimization model are described.
5.2.1. Objective Function and Constraints
The objective function of the optimization model considers airspace performance and ground side performance. The objective function is represented by the weighted sum of the airspace and ground side performance (1). The weights Yairspace and Yground side are assigned to the airspace and ground side performance, respectively. These weights can be adjusted to drive the optimization process by focusing on one of the two components. It is worth noting that in this study, these weights have been left equal, so that the optimization would focus evenly on both components. The objective function aims at minimizing the airspace and ground side ground side performance, therefore, an optimal solution will lead to 0.
Objective function = Yairspace × Airspace performance + Yground side × Ground side performance
The airspace and ground side performance represent the constraints of the optimization model. Airspace performance is identified by aircraft separation conflicts and sequence order conflicts (2). Aircraft separation conflicts are defined as the violation of the separation minima between consecutive aircraft (3). Sequence order conflicts are detected in order to avoid that an aircraft overtakes another one (4).
where,
Airspace performance = Airspace conflicts + Order of sequence conflicts
- Airspace conflicts: let be A a given set of landing aircraft, i and j consecutive pair of aircraft, Sij the separation minima between the leading aircraft type i and the trailing aircraft type j and Dij the distance between aircraft type i and aircraft type j. In this way conflicts are detected and calculated as:
- Sequence order conflicts: let be , a given set of links the positions of the aircraft on the link entry and on the link exit , respectively. The sequence order conflicts are calculated as:The ground side performance is identified by the runway conflicts, max taxiway overload and max terminal overload (5). The runway conflicts are calculated in a similar way to the airspace ones—the only difference is that airspace and runways have different separation minima standards [4] (6). Max taxiway overload and max terminal overload are calculated in terms of capacity overloads (7). Specifically, a capacity overload occurs where the capacity of one of the ground side component is exceeded (8). In Equation (7), the max (taxiway/terminal) overload is calculated by taking the maximum value between the capacity overload calculated throughout the overall time horizon.where,Ground side performance = Runway conflicts + Max taxiway overload + Max terminal overload
- Runway conflicts: let be A a given set of aircraft, i and j a consecutive pair of aircraft, the separation minima between aircraft type i and aircraft type j and the detected time difference between aircraft type i and aircraft type j. In this way conflicts are formalized with the following function:It is worth noting that runway crossings are also detected on the runway. The way they are calculated is the same as for runway conflicts, and the only difference is the value of the separation minima, which is equal to the runway crossing time (40 s).
- Taxiway and terminal overloads: let be C the capacity, Ot the aircraft occupancy for each discrete time increment t∈T; and T the entire time frame considered, the max (taxiway/terminal) overload is given by:where,
5.2.2. Decision Variables
The decision variables of the optimization model are of three types:
- Delay (advance) at the entry point of the TMA;
- Entry speed in the TMA;
- Ground delay.
As these decision variables were already described in Section 5, here we only describe their mathematical formulation.
Given a set of flights F, for each flight f, where f∈F,
- Delay (advance) at the entry point of the TMA:where ∆Tmin and ∆Tmax are the minimum and maximum values that can be assigned to tf, and ∆T is a discretized time increment. In this case ∆min is −5 min, ∆Tmax is +30 min and ∆T is 5 s,
- Entry speed in the TMA:where ∆Smin and ∆Smax are the minimum and maximum values that can be assigned to sf and ∆S is a discretized increment. In this case ∆Smin is 0.9, ∆Smax is 1.1 and ∆S is 0.01,
- Ground delay:where ∆PBmax is the maximum value that can be assigned to PBf, and ∆T is a discretized time increment. In this case ∆PBmax is +15 min and ∆T is 5 s.
6. Solution Approach
The solution approach, and specifically the fourth step of our methodology, can be referred to as a metaheuristic optimization model using a sliding window approach. This methodology was first presented in [6], and then successfully applied in combination with simulation techniques in [4,7]. The optimization model is based on an adapted version of the simulated annealing metaheuristic [31]. The sliding window approach allows the optimization to work in small sized time windows and then shift them along the entire time horizon. There are two main benefits from this approach: firstly, the computational burden is relieved, as in each time window a small instance of the problem is solved by considering only the elements within the time window; secondly, the solution is constructed by dynamically considering relevant information from the past and current time windows, improving the robustness of the solution. This method has been employed in other studies with good results [32,33,34,35,36]. Figure 5 illustrates the sliding window approach. The parameters that affect this approach are two: the time window length and the shift length. If the time window is too large, the first benefit will not be achieved. On the other hand, a small time window will jeopardize the achievement of the second benefit, as not enough information from the surrounding time windows would be considered. Similarly, a large shift length will hamper the benefit of dynamically constructing a solution. On the other hand, a small shift length would increase the computational time performance. In this study, we have utilized 2 h as the time window length and 30 min as shift length. These values were empirically obtained after conducting several tests [4]. In Figure 6, it is described how decisions are made according to the relative window position within the whole time horizon. Following this approach, each entity to be optimized (each aircraft), is categorized into four different types: fixed, updated, to make or to be made.
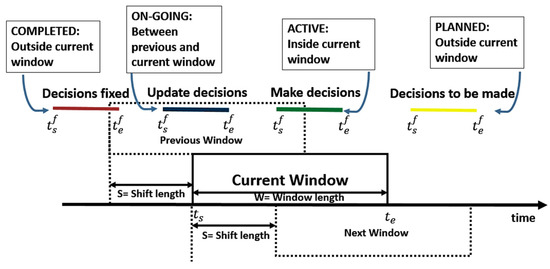
Figure 6.
Sliding window approach visualization. © 2021 IEEE. Reprinted, with permission, from [7].
- Fixed decisions are the ones that fall behind the window and it is no longer possible to take decisions for them.
- Updated decisions are the ones that fall partly before and partly inside the window—these decisions were already made in the previous window and they will be updated in the current window.
- To make decisions are the ones that are fully inside the widows and these decisions will be made for them in the current window.
- To be made are the ones that are after the windows and these decisions are not yet made for them.
As the problem under study has been proven to be NP-Hard [37], an optimization method based on a metaheuristic has been applied. The simulated annealing metaheuristics allows the optimization to search more broadly in the state space as it, at times, also accepts solutions with worse performance. By means of this, the risk of being trapped in local minima is mitigated. The simulated annealing metaheuristic algorithm is based on the analogy with the process of physical annealing with solids, which leverages the heating up of the material and the subsequent colling down, until a better crystalline configuration is achieved [38]. By following this mechanism, the initial temperature T0, the cooling process and the stopping criteria are the main elements to consider. At each temperature value during the cooling process, a solution is generated. Once a solution is found (i.e., the current one), it can be replaced by a randomly generated neighboring solution. As already mentioned, the algorithm accepts all the neighboring solutions which are better than the current solution in terms of performance, but also worse neighboring solutions based on an acceptance probability. The acceptance probability is eΔOFT, where ∆OFT is the difference in objective function between the current and the neighboring solution, and T; is the current temperature. The cooling schedule employed in this study is the geometric cooling schedule, where the temperature T0 is progressively decreased by multiplying it by a coefficient α. Therefore, the cooling schedule has a big impact in the effectiveness of the metaheuristic, as if the temperature decreases slowly enough, there will be high chance of converging to a global optimum. The stopping criteria are based on a maximum number of iterations and a minimum temperature, or when an optimal solution is obtained. For detailed information about the application of this metaheuristic to this problem, refer to [6].
7. Experiments and Results
7.1. Experiments Set Up
In this section we apply the fourth step of the methodology to a set of potential new situations given by the traffic recovery scenarios and increasing ground side capacity. In order to achieve that, we have set up different scenarios for testing. These scenarios are related to different traffic situations and are based on the current state of the European traffic network [1]. We took as reference the flight schedule of one day in 2016 (19 February 2019), where the air traffic was at its peak and which was similar to the one in 2019 (pre-COVID-19) [39]. These data come from airspace surveillance data, and they include relevant information such as aircraft speed, altitude, entry time in the TMA, aircraft type, and aircraft in-block and off-block times. We started by testing a scenario where only 35% (S1) of that traffic is active. We consider additional scenarios where we assume a short (medium)-term traffic recovery, boosted by the current vaccination programs in Europe, testing 45% (S2) and 55% (S3) of active traffic compared to the reference flight schedule. The first row of Table 3 shows the amount of flights of the reference flight schedule, while the rest of the rows show the amount of flights for the three scenarios, 35% (S1), 45% (S2) and 55% (S3), respectively.

Table 3.
Amount of flights for the reference flight schedule and for the three recovery scenarios.
Another set of experiments was conducted by gradually increasing the terminal capacity (number of stands available), as it would make sense that once the traffic increased, new stands would also be made available. We have tested, in the case of 45% (S4) traffic recovery, an additional scenario where the capacity of the terminal is set to 60. In the other two scenarios the terminal capacity was set to 70 and the traffic recovery as 45% (S5) and 55% (S6). Table 4 shows these additional scenarios.

Table 4.
Additional scenarios based on the increase of the terminal capacity.
Finally, we wanted to test the effect on the airspace and ground performance by focusing on the ground delay strategy, by increasing the range of the delay assigned to the departing aircraft. This is tested for the three traffic recovery scenarios, by allowing a maximum ground delay of 30 min (see Table 5).

Table 5.
Additional scenarios based on the increase of the ground delay range.
The performance evaluated can be classified into two groups: capacity performance and ATM performance. They are summarized in Table 6. The capacity performance gives us insights about potential congestion and bottlenecks either in the airspace or on the ground, while ATM performance gives us an idea on the changes in the flight schedule to be made by the ATCOs decisions. Within the capacity performance we have three subcategories: Airspace performance; runway performance; ground side performance. These values are obtained from the optimization model. By post-processing the optimization model results, we could obtain even more specific results regarding each single component. In this way we could evaluate the airspace performance by using three indicators: total airspace conflicts, aircraft involved in the airspace conflicts and average conflicts per aircraft. While the first indicator is a general one, the second and the third give an idea of the congestion of the airspace TMA. Runway performance is evaluated by three indicators: arrival, departure and crossing conflicts. The first two are evaluated on the dedicated runway for arrivals and departures operations, while the third represents the conflicts occurring when the departure runway is crossed by an arriving aircraft. As in the layout of CDG airport, the arrival and departure runway are placed one next to each other in a parallel position, and since the arrival runway is placed in an outer position with respect to the departure runway, the aircraft need to cross the inner (departure) runway after having landed. Ground side performance is evaluated by using two indicators: max taxiway overload; max terminal overload. The ATM performance is obtained by analyzing the decision variables of the optimization model which represent ATM strategies for managing the traffic. We have airspace delay (advance), ground delay and entry speed in the TMA changes.

Table 6.
Performance evaluated.
7.2. Results and Discussion
In this section we present the results in terms of capacity and ATM performance for each of the scenarios described in the previous section. We start from the scenarios S1, S2 and S3, where the facilities considered are the ones described in the Section 4 and in Table 4.
As is shown in Table 7, S3 presents the worst performance. In this scenario we find in total 94 airspace conflicts, which reveals that the arrival flow in the TMA is very congested. It can be seen that 15.13% of the arrival aircraft (46) are involved in these 94 conflicts, having on average 2.04 conflicts per flight. This scenario shows congestion also in the runway system, with 68 conflicts spread among the departure runway, the arrival runway and the runway crossing. We notice that the crossing conflicts have the highest value, suggesting that the arrival/departure sequence must be improved. Looking at the ground side performance, we notice that all three scenarios suffer from capacity overload, especially in the terminal. By looking at Figure 7, Figure 8 and Figure 9, we can appreciate the daily occupancy of the taxiway and terminal for scenarios S1, S2, and S3, respectively. Figure 7b, related to S1, shows that there is an overload of 24, which is concentrated on a main peak around 9.00. Figure 8b, related to S2, shows a lower max overload (12) than S1; however, there are two peaks around 9:00 and 12:00. Figure 8b shows the presence of three peaks of capacity overload, at 6:00, 9:00 and 12:00, in which the maximum among them is 39. Figure 7a, Figure 8a and Figure 9a, show that the taxiway occupancy is kept under the capacity threshold in S1, while in S2 we have a max overload of 1, and in S3 a max overload of 4. It is worth noting that the taxiway overload in S3, even if it is not big, lasts for almost 3 h from 10:00 to 13:00. It matches when the second main peak of terminal overload decreases and the third main peak starts to increase (see Figure 9b), suggesting that in these hours the taxiway occupancy is affected by a departure wave (terminal occupancy decreases) and right afterwards by an arrival wave (terminal occupancy increases).

Table 7.
Capacity performance for Scenarios S1, S2 and S3.
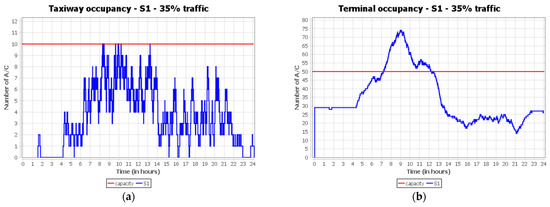
Figure 7.
Taxiway (a) and terminal (b) occupancy scenario S1.
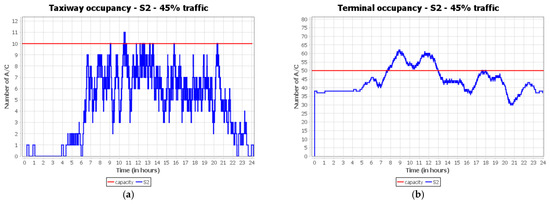
Figure 8.
Taxiway (a) and terminal (b) occupancy scenario S2.
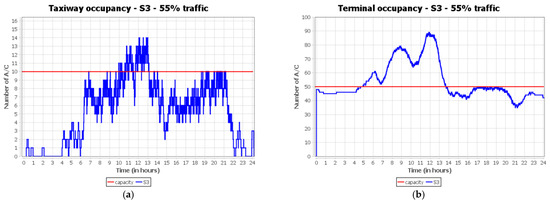
Figure 9.
Taxiway (a) and terminal (b) occupancy scenario S3.
Analyzing the ATM performance in Table 8, we notice that on average we have similar values on the decision making about airspace delay (advance), entry speed in the TMA changes and ground delay. For the first two indicators we have similar standard deviation among the three scenarios, suggesting that they have similar dispersion from the average as well. Ground delay, on the other hand, shows a higher average value and a lower standard deviation for S1 compared to S2 and S3. This effect explains that for S1 a ground delay strategy is effective as, by shifting departures later in time, empty time slots for departure can be filled. On the other hand, as S2 and S3 have more traffic to handle (two and three overload peaks, respectively), a ground delay strategy might not necessarily work, as the busier schedule would mean having fewer time slots available for departure. Therefore, shifting aircraft later in time might generate further overloads. Moreover, less dispersion would mean that the decision variable has not been tweaked using its full potential range, while for S2 and S3 the opposite phenomena occur. This means that, in S2 and S3, the optimization model found it harder to obtain a suboptimal solution, and it needed to use the ground delay decision variable considering a bigger range.

Table 8.
ATM performance for scenarios S1, S2 and S3.
In the scenarios S4, S5 and S6, we consider the effect of increasing the terminal capacity, by adding either contact or remote stands, as the terminal capacity has been revealed to be the most critical in the previous scenarios.
Table 9 summarizes the capacity performance of S4, S5 and S6. It is straightforward to see that in S4 and S5, when the traffic is at 45%, the terminal capacity does not particularly suffer from congestion. Especially in S5, the terminal can accommodate all the traffic without overload. Figure 10 and Figure 11 show the taxiway and terminal occupancy for S4 and S6. In S6, when the traffic is increased up to 55%, even though the terminal capacity is increased to 70, overloads appear at both the taxiway and terminal. As can be seen in Figure 11b, there are two overload peaks, one between 8:00 and 10:00 of 10 aircraft and another between 11:00 and 13:00 of 20 aircraft. Regarding the airspace performance, we obtain few airspace conflicts (6) while the runway system is free from conflicts. S6 shows fewer airspace conflicts (80) compared to S3 (94), with fewer aircraft involved in conflicts (40 in S6 against 56 in S3), leading to an average of two conflicts per aircraft. Regarding the runway conflicts, we notice that although arrival runway and departure runway show similar numbers of conflicts, the number of crossing conflicts is reduced from 50 to 42 in S3 and S6, respectively. The major improvement regards the terminal overload (20) which is almost halved compared to S3 (39).

Table 9.
Capacity performance for scenarios S4, S5 and S6.
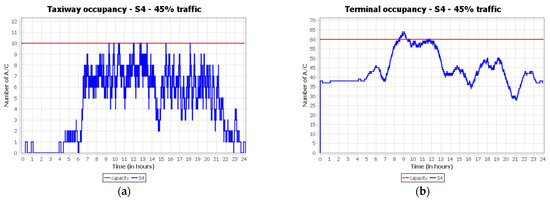
Figure 10.
Taxiway (a) and terminal (b) occupancy scenario S4.
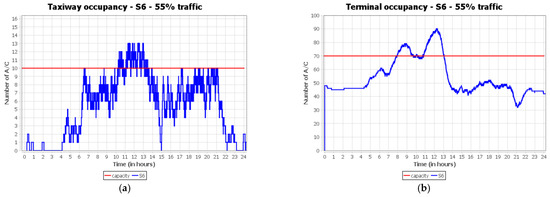
Figure 11.
Taxiway (a) and terminal (b) occupancy scenario S6.
The results of the ATM performance, displayed in Table 10, show that the delay in the airspace on average is higher in S6 than in S4 and S5, thus the optimization must tweak this decision variable more to find a suboptimal possible solution. This is given by the fact that in S6 the traffic is higher than in S4 and S5, therefore, the optimization finds it more difficult to reach a suboptimal solution. The entry speed in the TMA turns out to be a factor not impacting the system, as their values are similar in all scenarios so far. Regarding the ground delay, we notice that S4 and S5 have bigger average and standard deviation values than S6. Similar to S3, by delaying too many of the aircraft on the ground the optimization model finds it difficult to generate a better solution. In this scenario, a ground delay strategy could be counterproductive due to the high traffic.

Table 10.
ATM performance for scenarios S4, S5 and S6.
In scenarios S7, S8 and S9, we have kept the values of the facilities as the original ones described in the Section 4 and we have focused on the reinforcement of the ground delay strategy. By applying this strategy, we expect a better the departure sequence, reducing taxiway and terminal overloads, departure and crossing runway conflicts. The results are summarized in Table 11 and Table 12 and in Figure 12, Figure 13 and Figure 14. By comparing S7 with S1, we notice only a small improvement concerning the terminal overload, which has improved by one unit. In Scenario S8 this strategy was not effective, as when compared to S2, the only improvement is in the taxiway (0 in S8 against 1 in S2), while the terminal overload has even worsened, going from 12 in S2 to 14 in S8. Moreover, crossing conflicts (2) have been found in S8, when in S2 there were none. The scenario which has benefitted the most from the ground delay strategy appears to be S9. By comparing S9 with S3, we note that airspace conflicts have been lowered from 94 to 82 (−12.7%), and although there are more aircraft involved in conflicts (50), the average conflicts per aircraft have been reduced from 2.04 to 1.64. Regarding the runway conflicts, the main reduction was obtained for crossings (−8) and departure runway conflicts (−2). These results suggest that a better departure sequence was generated by the optimization model. In this scenario, there are no improvements in the taxiway and terminal overload, as the values remain the same as the ones in S3.

Table 11.
Capacity performance for scenarios S7, S8 and S9.

Table 12.
ATM performance for Scenarios S7, S8 and S9.
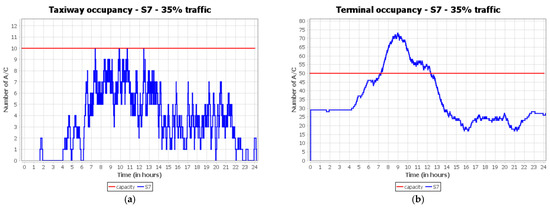
Figure 12.
Taxiway (a) and terminal (b) occupancy scenario S7.
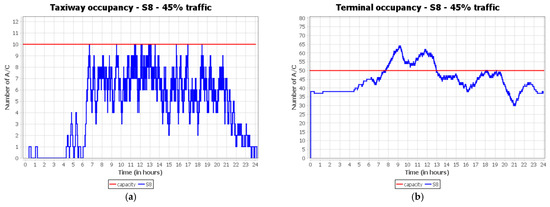
Figure 13.
Taxiway (a) and Terminal (b) occupancy scenario S8.
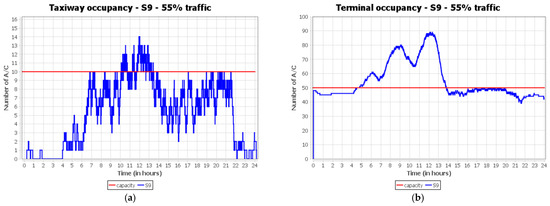
Figure 14.
Taxiway (a) and terminal (b) occupancy scenario S9.
Regarding the ATM performance, it is interesting to look at the ground delay, as it is the factor that characterizes these scenarios. As expected, the average values of ground delay for these three scenarios have increased compared to the ones of the other previous scenarios. We notice that scenario S7 has a lower value of standard deviation compared to S8 and S9. Similar to S1, due to the lower traffic, the optimization model was able to find a suboptimal solution without being forced to tweak this variable a lot. S8 and S9, on the other hand, dealt with more congested traffic, therefore, the ground delay variable is assumed to be assigned more thoroughly within its range of values.
8. Conclusions
In this paper we have evaluated the effect of rare events such as the COVID-19 pandemic on ATM and airport capacity following a step-by-step methodology whose heart is based on an optimization process. This methodology was applied to a set of different “new situations” that follow the evolution of the system based on the influence that COVID-19 will still have on airport facilities utilization. The different scenarios which were tested, revealed the saturation point of the airport, at which the airport started suffering from congestion.
The main bottleneck of the system has been identified as the terminal system (number of stands). Even for the low traffic scenario (35%), the terminal system was under pressure, highlighting the need for more stands (contact/remote), especially when the traffic reached 55%, at which point more than 70 stands are required.
Under an ATM point of view, we have found that airspace delay (advance) and ground delay are on average higher for the scenario with higher traffic (55%) than in the other two scenarios (35%, 45%). This suggests that ATCO’s intervention is required when the (55%) traffic is present. On the other hand, the analysis shows that ground delay is effective for scenarios where the traffic has increased (55%) by reducing runway and airspace conflicts. Therefore, this mitigation strategy can be followed by air traffic control under this situation.
From a planning and design point of view, we can conclude that the system needed to make another runway and more than 70 stands operational when the traffic recovery reached 55% of the pre-COVID-19 schedule. The taxiway proved to be sufficient for the tested traffic demands.
The main limitation of this work lies in the lack of actual data, as we had to adapt a schedule taken from 2016. Due to that we had to assume that the daily peak hours would be the same as the ones in 2016. Using more recent data would have helped the validity of the results. The same applies to the ground facilities, as we made assumptions on potential capacity reductions by using public data. However, airport operators could follow the same methodology for driving their transition phase to recovery using actual data.
As future work, we could test additional scenarios by implementing different ATM strategies. Moreover, we could extend the study to other airports and even to a network of airports. Simulation techniques could be included in combination with optimization techniques for improving the reliability of the system performance. Finally, this work could be extended to test air traffic disruption due to different rare events.
Author Contributions
Conceptualization, P.S. and M.M.M.; methodology P.S. and M.M and D.D.; software P.S.; validation P.S.; formal analysis P.S.; investigation P.S.; resources P.S. and M.M.M. and D.D.; data curation P.S.; writing—original draft preparation P.S.; writing—review and editing P.S. and M.M.M.; visualization P.S.; supervision M.M.M. and D.D.; project administration M.M.M. and D.D.; funding acquisition M.M.M. and D.D. All authors have read and agreed to the published version of the manuscript.
Funding
This research received no external funding.
Institutional Review Board Statement
Not applicable.
Informed Consent Statement
Not applicable.
Conflicts of Interest
The authors declare no conflict of interest.
References
- EUROCONTROL Comprehensive Assessment of COVID-19’s Impact on European Air Traffic. Available online: https://www.eurocontrol.int/publication/eurocontrol-comprehensive-assessment-covid-19s-impact-european-air-traffic (accessed on 15 March 2021).
- Adrienne, N.; Budd, L.; Ison, S. Grounded aircraft: An airfield operations perspective of the challenges of resuming flights post COVID. J. Air Transp. Manag. 2020, 89, 101921. [Google Scholar] [CrossRef]
- Schiphol Group. Available online: https://www.schiphol.nl/en/you-and-schiphol/news/Aalsmeerbaan-runway-becomes-aircraft-parking/ (accessed on 15 March 2021).
- Scala, P.; Mujica, M.; Wu, C.-L.; Delahaye, D. An optimization-simulation closed-loop feedback framework for modeling the airport capacity management problem under uncertainty. Transp. Res. Part C Emerg. Technol. 2021, 124, 102937. [Google Scholar] [CrossRef]
- Scala, P.; Mujica, M.; de Bock, N. A divide and conquer approach for simulating an airport system. Int. J. Simul. Process Model. 2016, 12, 470–484. [Google Scholar] [CrossRef]
- Ma, J.; Delahaye, D.; Sbihi, M.; Scala, P.; Mujica, M. Integrated optimization of terminal maneuvering area and airport at the macroscopic level. Transp. Res. Part C 2019, 98, 338–357. [Google Scholar] [CrossRef]
- Scala, P.; Mujica, M.; Ma, J.; Delahaye, D. Tackling uncertainty for the development of efficient decision support system in air traffic management. IEEE Trans. Intell. Transp. Syst. 2020, 21, 3233–3246. [Google Scholar] [CrossRef]
- Kjenstad, D.; Mannino, C.; Nordlander, T.C.; Schittekat, P.; Smedsrud, M. Optimizing AMAN-SMAN-DMAN at Hamburg and Arlanda Airport. In Proceedings of the SESAR Innovation Days, Stockholm, Sweden, 26–28 November 2013. [Google Scholar]
- Bertsimas, D.; Frankovich, M. Unified optimization of traffic flows through airports. Transp. Sci. 2015, 50, 77–93. [Google Scholar] [CrossRef]
- Bosson, C.S.; Xue, M.; Zelinski, M. Optimizing integrated arrival, departure and surface operations under uncertainty. In Proceedings of the 10th USA/Europe ATM R&D Seminar, Lisbon, Portugal, 23–26 June 2015. [Google Scholar]
- Sama, M.; D’Ariano, A.; Pacciarelli, D. Rolling horizon approach for aircraft scheduling in the terminal control area of busy airports. Transp. Res. Part E 2013, 60, 140–155. [Google Scholar] [CrossRef]
- Guepet, J.; Briant, O.; Gayon, J.; Acuna-Agost, R. Integration of aircraft ground movements and runway operations. Transp. Res. Part E 2017, 104, 131–149. [Google Scholar] [CrossRef]
- Suau-Sanchez, P.; Voltes-Dorta, A.; Cuguero-Escofet, N. An early assessment of the impact of COVID-19 on air transport: Just another crisis or the end of aviation as we know it? J. Transp. Geogr. 2020, 86, 102749. [Google Scholar] [CrossRef]
- Serrano, F.; Kazda, A. The future of airport post COVID-19. J. Air Transp. Manag. 2020, 89, 101900. [Google Scholar] [CrossRef] [PubMed]
- Choi, J.H. Changes in airport operating procedures and implications for airport strategies post-COVID-19. J. Air Transp. Manag. 2021, 94, 102065. [Google Scholar] [CrossRef]
- Sun, X.; Wandelt, S.; Zhang, A. How did COVID-19 impact air transportation? A first peek through the lens of complex networks. J. Air Transp. Manag. 2020, 89, 101928. [Google Scholar] [CrossRef]
- Hotle, S.; Mumbower, S. The impact of COVID-19 on domestic U.S. air travel operations and commercial airport service. Transp. Res. Interdiscip. Perspect. 2021, 9, 100277. [Google Scholar] [CrossRef]
- Guo, J.; Zhu, X.; Liu, X.; Ge, S. Resilience modeling method of airport network affected by global public health events. Math. Probl. Eng. 2021. [Google Scholar] [CrossRef]
- Nizetic, S. Impact of coronavirus (COVID-19) pandemic on air transport mobility, energy, and environment: A case study. Int. J. Energy Res. Short Commun. 2020, 44, 10953–10961. [Google Scholar] [CrossRef]
- Kierzkowski, A.; Kisiel, T. Simulation model of security control lane operation in the state of the COVID-19 epidemic. Sournal Air Transp. Manag. 2020, 88, 101868. [Google Scholar] [CrossRef] [PubMed]
- Schultz, M.; Soolaki, M. Analytical approach to solve the problem of aircraft passenger boarding during the coronavirus pandemic. Transp. Res. Part C 2021, 124, 102931. [Google Scholar] [CrossRef]
- Groupe ADP. Available online: https://www.parisaeroport.fr/en/group/group-strategy/our-strategy/in-brief/platforms/paris-charles-de-gaulle (accessed on 15 March 2021).
- Simple Flying. Available online: https://simpleflying.com/paris-runway-plane-parking/ (accessed on 15 March 2021).
- Paris Aeroport. Available online: https://www.parisaeroport.fr/en/passengers/flights/covid-19-informations-to-passengers (accessed on 15 March 2021).
- Hanowsky, M.; Sussman, J. Design of Ground Delay Programs to Consider the Stakeholder’s Perspective. Transp. Res. Rec. 2009, 2106, 109–117. [Google Scholar] [CrossRef]
- Clark, D.A. Investigating a new ground delay program strategy for coping with SFO stratus. In Proceedings of the 89th AMS Annual Meeting, ARAM Special Symp. on Weather—Air Traffic Management Integration, Phoenix, AZ, USA, 11–15 January 2009. [Google Scholar]
- Durand, N.; Allignol, C.; Barnier, N. A ground holding model for aircraft deconfliction. In Proceedings of the 29th Digital Avionics Systems Conference, Salt Lake City, UT, USA, 3–7 October 2010. [Google Scholar] [CrossRef]
- Delgado, L.; Prats, X.; Sridhar, B. Cruise speed reduction for ground delay programs: A case study for San Francisco International Airport arrivals. Transp. Res. Part C Emerg. Technol. 2013, 36, 83–96. [Google Scholar] [CrossRef]
- Liu j Li, K.; Yin, M.; Zhu, X.; Han, K. Optimizing Key Parameters of Ground Delay Program with Uncertain Airport Capacity. J. Adv. Transp. 2017, 17. [Google Scholar] [CrossRef]
- Taylor, C.; Tien, S.L.; Vargo, E.; Wanke, C. Strategic Flight Cancellation under Ground Delay Program Uncertainty. J. Air Transp. 2020, 29, 5–15. [Google Scholar] [CrossRef]
- Kirkpatrick, S.; Gelatt, C.D.; Vecchi, M.P. Optimization by simulated annealing. Science 1983, 220, 671–680. [Google Scholar] [CrossRef]
- Hu, X.; Chen, W. Receding horizon control for aircraft arrival sequencing and scheduling. IEEE Trans. Intell. Transp. Syst. 2005, 6, 189–197. [Google Scholar] [CrossRef]
- Zhan, Z.; Zhang, J.; Li, Y.; Liu, O.; Kwok, S.K.; Ip, W.H.; Kaynak, O. An efficient ant colony system based on receding horizon control for the aircraft arrival sequencing and scheduling problem. IEEE Trans. Intell. Transp. Syst. 2010, 11, 299–312. [Google Scholar] [CrossRef]
- Furini, F.; Kidd, M.P.; Persiani, C.A.; Toth, P. Improved rolling approaches to the aircraft sequencing problem. J. Sched. 2015, 18, 435–447. [Google Scholar] [CrossRef]
- Toratani, D.; Ueno, S.; Higuchi, T. Simultaneous optimization method for trajectory and sequence for receding horizon guidance in terminal area. SICE J. Control Meas. Syst. Integr. 2015, 8, 144–153. [Google Scholar] [CrossRef]
- Liang, M.; Delahaye, D.; Marechal, P. Conflict-free arrival and departure trajectory planning for parallel runway with advanced point-merge system. Transp. Res. Part C Emerg. Technol. 2018, 95, 207–227. [Google Scholar] [CrossRef]
- Beasley, J.E.; Krishnamoorthy, M.; Sharaiha, Y.M.; Abramson, D. Scheduling aircraft landings: The static case. Transp. Sci. 2000, 34, 190–197. [Google Scholar] [CrossRef]
- Henderson, D.; Jacobson, S.H.; Johnson, A.W. The Theory and Practice of Simulated Annealing. In Handbook of Metaheuristics; International Series in Operations Research & Management Science; Glover, F., Kochenberger, G.A., Eds.; Springer: Boston, MA, USA, 2003; Volume 57. [Google Scholar] [CrossRef]
- Groupe ADP. Available online: https://www.parisaeroport.fr/en/group/finance/investor-relations/traffic (accessed on 20 May 2021).
Publisher’s Note: MDPI stays neutral with regard to jurisdictional claims in published maps and institutional affiliations. |
© 2021 by the authors. Licensee MDPI, Basel, Switzerland. This article is an open access article distributed under the terms and conditions of the Creative Commons Attribution (CC BY) license (https://creativecommons.org/licenses/by/4.0/).