Article

Exemplification of Detecting Gas Turbine Blade Structure Defects Using the X-ray Computed Tomography Method

1
Instytut Techniczny Wojsk Lotniczych—Air Force Institute of Technology, 6 Księcia Bolesława Str., 01-494 Warszawa, Poland
2
Faculty of New Technologies and Chemistry, Military University of Technology, 2 Kaliskiego Str., 00-908 Warszawa, Poland
*
Author to whom correspondence should be addressed.
Aerospace 2021, 8(4), 119; https://doi.org/10.3390/aerospace8040119
Submission received: 23 February 2021 / Revised: 12 April 2021 / Accepted: 16 April 2021 / Published: 20 April 2021

Abstract

:
X-ray computed tomography is more often applied in non-destructive testing the quality of construction elements significantly crucial for reliability and safety of device elements, machines and complex industrial systems. This article describes the computed tomography (CT) system used to inspect the technical condition of turbine blades of the aircraft engine. The impact of the experimental conditions on the correctness of the obtained results was determined. The appropriate selection of parameters for the experiment was given, and the correct test results of gas turbine blades were presented. Failures, manufacturing defects, material deviations of nickel-cobalt alloyed blades were identified. The thickness of walls was measured in the selected cross-sections with the accuracy of 0.01 mm, and selected manufacturing defects of cooling passages were diagnosed. It was demonstrated that the application of the CT system allows for detailed non-destructive inspection of the technical condition of machine parts. The test results proved that the X-ray computed tomography could be applied in the production and repairs of machines.

1. Introduction

The turbine blade is one of the most important components of a turbine engine due to the reliability of operation and safety of not only the engine but also the aircraft.
The reliability and service life of the blade is significantly influenced by internal defects of various origin and type, such as structure thinning, micro-cracks, the incorrect shape of the interior, thermal barrier coating (TBC) delamination, etc.
Sources of defects can be:
  • defective manufacturing;
  • operating process;
  • faulty repair.
A categorization of defects and their causes is presented in [1].
Frequent causes of failure are unfavorable changes in the structure of blades, induced by excessive temperature and operation time as well as the chemical impact of exhaust gases:
  • an increased temperature [2];
  • an unevenness and instability of flue gas temperature [3]; and
  • the degradation of the gas turbine blade coating [4].
The health of the turbine blade should be inspected during non-destructive testing to avoid a disastrous breakdown of an aircraft engine. Blade interior defect (Figure 1), can be spotted after disassembling it from the engine.
This situation forced the designers and researchers of the turbine engine to implement the appropriate non-destructive methods of assessing their technical condition
  • visual inspection systems [1,5];
  • the optoelectronic and thermographic methods [6];
  • non-destructive computed tomography method [7];
  • gas-path diagnostics system [8]; and
  • expert diagnostic system of turbine blades to ensure a high level of reliability and safety in aviation [9,10].
Optical/visual method is applied using optoelectronic devices [1,6,11] to diagnose the external conditions of turbine blades without disassembling them from the engine. The minimal size of the detectable defect is limited by the resolution of the optoelectronic device.
The rules of detecting a defect to turbine blades are specified by the manufacturer’s requirements [12]. The previous experience from diagnosing the technical condition of turbine blades shows [7,9,10,13] that it is necessary to identify defects to blades of a size less than 0.5 mm (specified by the manufacturer).
Due to the above, such a non-destructive method is searched for, which will enable to detect failures with required accuracy corresponding to the ISO and ASTM E requirements.
Among the available non-destructive methods of detecting failures, the X-ray computed tomography (XCT) method should be taken into consideration. It is used in diagnosing internal and external failures of the object and is characterized by the reliability of the results.
This paper is devoted to the application of non-destructive XCT method in the diagnostics of turbine blades. However, it is worth paying attention to the possibility of mutual complementation of non-destructive and destructive methods used in different fields, e.g.,
  • an ultrasonic tomographic imaging technique [14];
  • quality analyses of dissimilar materials joint [15];
  • laser cladding parameters optimization in blisk-type part manufacturing [16];
  • FIB–SEM electron tomography to characterize the microstructure of super alloy [17]; and
  • polychromatic X-ray radiography with a single image [18].

1.1. CT—Requirements and Limitations

Test results of the XCT method are impacted by many factors.
It is important to properly place the sample. In [19], the method of the sample optimum location searching is presented. The method uses the three-dimensional geometrical model of the sample and Radon space representation. Potential sample placement maps are presented in visual manner.
In some work limitations of the XCT method are analyzed.
The authors [20] presented the experimental illustration of the spatially varying inspection performance problem using the reconfigurable artifact and described the algorithm of determining the efficiency of inspection, which provides the results that strictly correspond to experimental results.
The paper [18] presents the results of a study on the detection limits of defects in components made of Hastelloy X. A broad-spectrum polychromatic X-ray radiography method was used.
One of the more important issues is obtaining reliable data for turbine blade measurements from a limited number of scans [21].

1.2. CT—Examples of Use

The XCT method is successfully used in detecting voids and porosity in polymer elements [22,23], from stainless steel [24], aluminum and its alloys [25,26,27].
An industrial computed tomography (ICT) system for large-scale aero structure components is presented in [27]. Some examples of turbine blades evaluated using computed tomography are presented in [28].
A precise porosity measurement with the use of X-ray computed micro-tomography was applied in [24].
Failure and deformation in thermal barrier coatings using computed X-ray tomography were investigated in [29].
Computed tomography also finds its application in detecting wear and thermal cracks as well as structure delamination [30].
The works [31,32] deal with the applications of XCT scanners in the production lines of components with complex shapes [31] and in line food inspection [32]. The developed algorithms enable the reconstruction of the studied objects with the required accuracy.

1.3. Purpose of the Work

As it results from the above considerations, computed tomography and various computed tomography techniques are frequently employed in diagnosing changes in the structure, and in detecting voids and manufacturing defects.
In this article, an experimental methodology for determining the optimum values of tomograph’s adjustable parameters and options of software for acquisition and processing of measurement data is applied. The utilitarian goal is to use the results of the experiment when introducing the XCT method into the turbine blade repair process.

2. Materials and Methods

2.1. Materials

The high-pressure turbine rotor blades of an RD-33 jet engine [12] were used in this research. These blades are internally air-cooled and made from a nickel-cobalt alloy ŻS-32 (manufactured in Russia).
In the manufacturing process, they were made with a monocrystalline structure and covered with a heat-resistant coating. The feature of a nickel-cobalt superalloy is a parent phase in the form of the alloyed austenite with the face-centered cubic (A1) lattice. High reliability is achieved mainly by solid solution and precipitation hardening [17]. Nickle-based superalloys are distinguished by very complex chemical composition and chemically dynamical structures. The phases included in the alloys react with each other during the operation of a given element. The above-mentioned alloyed additives, which modify the properties of the superalloy, play an important role.
In the tests, we used gas turbine blades under different conditions and service life—four (4) new blades and eighty (80) decommissioned blades.
The purpose of innovative research is to estimate the efficiency of the XCT method in diagnosing internal defects in gas turbine blades (made from a nickel-cobalt alloy) with the accuracy specified by the ISO and ASTM E rather than by the manufacturer.
In the utilitarian aspect of the work, it is necessary to adapt the XCT computed tomography method to inspect turbine blades of the aircraft engine in the repair process.

2.2. Methods

2.2.1. Test Analysis Using the XCT Method

XCT (X-ray computed tomography) allows for three-dimensional visualization of multiple layers of materials with different thickness. The object body is divided into small cells called voxels, wherein the linear absorption coefficient is the same. The reconstructed cross-sectional image is a quantitative map of an X-ray linear absorption coefficient in voxels that make up the scanned layer. Calculating the distribution of the X-ray absorption coefficient is done with the use of ‘Datos’ [33] computer software.
X-radiation is attenuated by passing through the matter, which is a function of many variables, e.g., radiation energy, material type and geometrical dimensions of the tested material. The change in the radiation intensity of the parallel beam with a similar energy, by passing through the object, is described as follows:
I = I 0 e μ g
where: I—radiation intensity after passing through the object I0—initial radiation intensity, μ—X-ray linear absorption coefficient indicative of a given material and a particular radiation wavelength X, g—thickness of the tested material.
X-ray linear attenuation coefficient depends on the atomic number and density of the object’s material, described by Bragg-Pierce law:
μ = k λ 3 Z 3
where: k—the factor of proportionality, λ—radiation wavelength, Z—atomic number of the material.
By using a spatial X-ray beam, matrix detector and after the object has made a full 360-degree rotation, one cross-section of the entire object is obtained. The accuracy of the final reconstruction is dependent on the number of projections made for the entire rotation of the component (minimum four times for each rotation degree). In this way, by having the projection images for many element cross-sections, reconstruction of the image is done for the entire element using the Radon transform. It enables the recreation of a three-dimensional image of the object from many projections of this object. Creating a tomographic image is based on the measurement on the amount of the absorbed radiation energy passing through the object. The reconstructed cross-sectional image is a quantitative map of an X-ray linear absorption coefficient in voxels that make up the scanned layer. The voxel size can be characterized in analogy to the pixel P and magnification M as a quotient V = P/M, where M = FDD/FOD.

2.2.2. Test Methodology of Turbine Blades

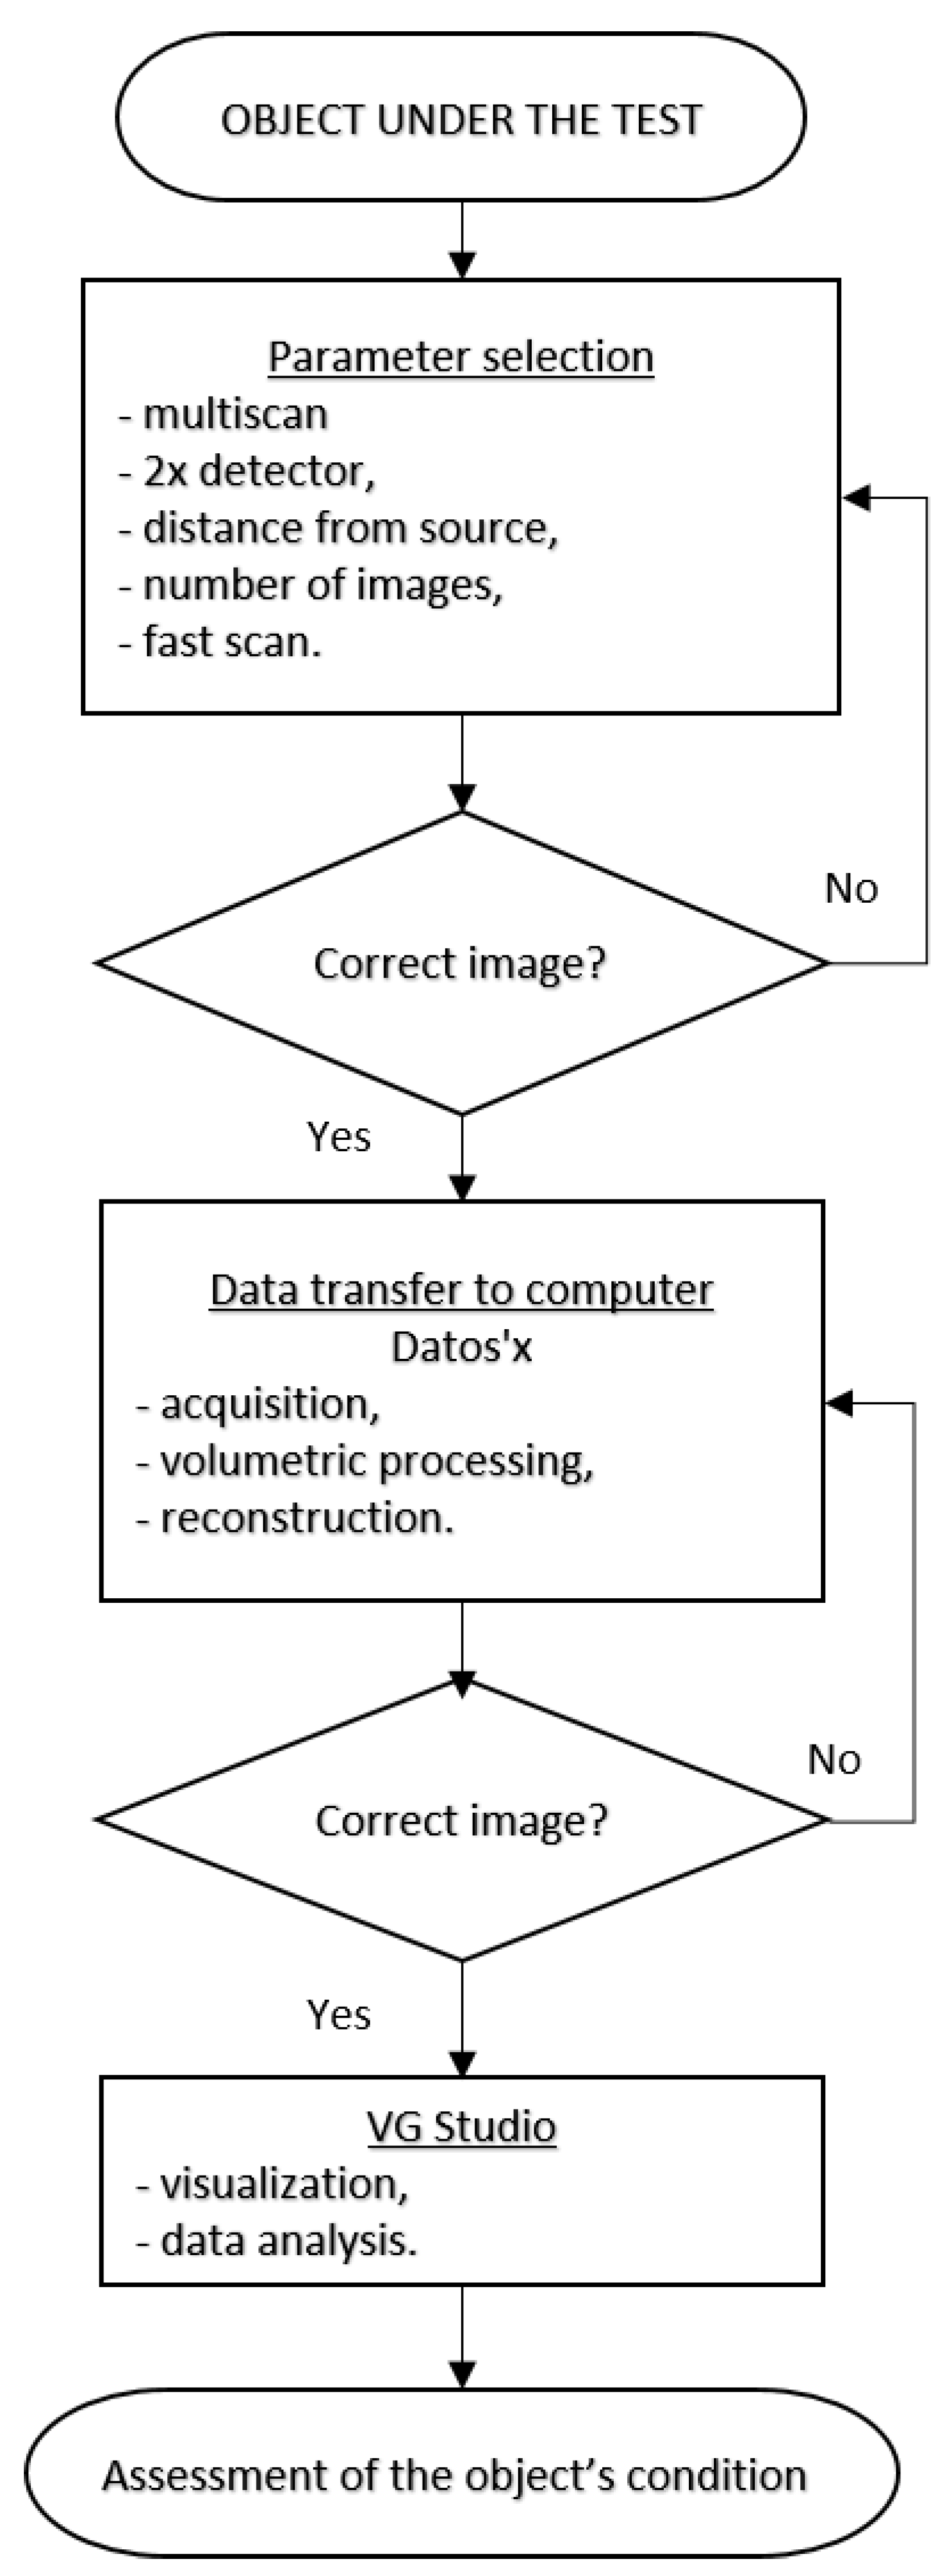
Research works were conducted according to the methodology presented in the Figure 2.
The research was carried out in two phases:
  • preliminary study; and
  • main research.
The first purpose of the preliminary study was to determine the effect of experiment parameters setting on the quality of the results.
For each test object, most of the test parameters such as lamp power, number of shots, time of single projection, type of filter, place and type of mounting, should be selected. These parameters depend on the properties of the object, i.e., variation of its shape (long and short edges), type of material, presence of elements made of different materials.
The second objective was to determine the values of the experiment parameters at which a correct image of the tested turbine blade is obtained. An image is considered correct if (ideal case):
  • it does not contain artifacts—apparent defects that in reality do not occur in the object; and
  • the defects have clear contours that make it possible to determine their shape and dimensions.
During the preliminary study four new blades, and 10 randomly selected decommissioned blades were tested.
Decommissioned turbine rotor blades, operated under different conditions and after different periods of use and service (80 pieces in total) were examined in the main study.
The experiment parameters determined in the preliminary study were used. The objective of the main research was to identify the damage and internal defects of the blades.

2.2.3. The Testing Device

Tests were carried out with the use of a cone-beam computed tomography (CT). V/TOME/X M 300 X-ray (GE Sensing & Inspection Technologies GmbH, Niels-Bohr-Str. 7, 31515 Wunstorf, Germany) control system was used for the test. It is equipped with an X-ray tube with the voltage of 180 kV, power of 15 W, and an X-ray tube with the voltage of 300 kV and power of 500 W. Objects with the mass up to 50 kg and maximum dimensions of 500 × 500 × 500 mm can be tested.
  • General parameters of V/TOME/X M 300 system are as follows:
    • Connection parameters: Voltage 230 V, frequency 50/60 Hz, max. power consumption 2300 VA;
    • Power parameters: high voltage 10–300 kV, current of the X-ray tube 5–3000 µA;
    • Thickness of the beam exit window 0.5 mm, thickness of the useful beam approx. 25°;
    • Recognizability of details <1 µm; and
    • X-ray tube radiation parameters: high voltage 10–180 kV, current of X-ray tube by 15 isowatts 5–880 µA, beam cone approx. 180°.
  • Software:
    • X-ray control system—xs/control; and
    • for image analysis—quality/assurances.

2.2.4. Measurement Functions and Software

The full software packet for metrological tasks, i.e., with the exception of control systems, includes the following four basic groups of operations:
  • standard geometry of dimensions;
  • comparing the results with CAD models;
  • flaw detection; and
  • reverse engineering.
Complementary programs, such as, e.g., VG Studio Max [34] and VG Metrology [35] are included in the analysis process. Building upon on the standard geometry of dimensions, distances between measurement points, the required cross-sections and projections are determined based on which the dimensional analysis of the examined object is conducted. Comparing the results with CAD models is carried out by plotting the obtained point cloud and the object selected from it on a known CAD model, which enables a quick comparison of the obtained results with the reference base, which is the model with nominal dimensions. During the measurement of tested object, the so-called point cloud is obtained, from which 3D model is achieved as a result of conducted computations. By using reverse engineering, curvatures and nodes are generated. Due to this, at the end of the process, a CAD model is obtained that is detected by the majority of standard programs. The software uses detector/shift function. The essence of the detector/shift function is based on changing the location of detector before each projection within ±10 pixels. It results in decreasing disturbances of the image of the tested element during the reconstruction—reduction of ring artifacts.

3. Results

3.1. The Impact of the Important Experiment Parameters on the Quality of Test Results

During diagnosing of blades, the results of tomographic examinations from various sources are used. One of the essential issues is the quality assessment of the results in view of the occurrence of the so-called artifacts. Below, the influence of the selected experimental conditions on the quality of test results is described:
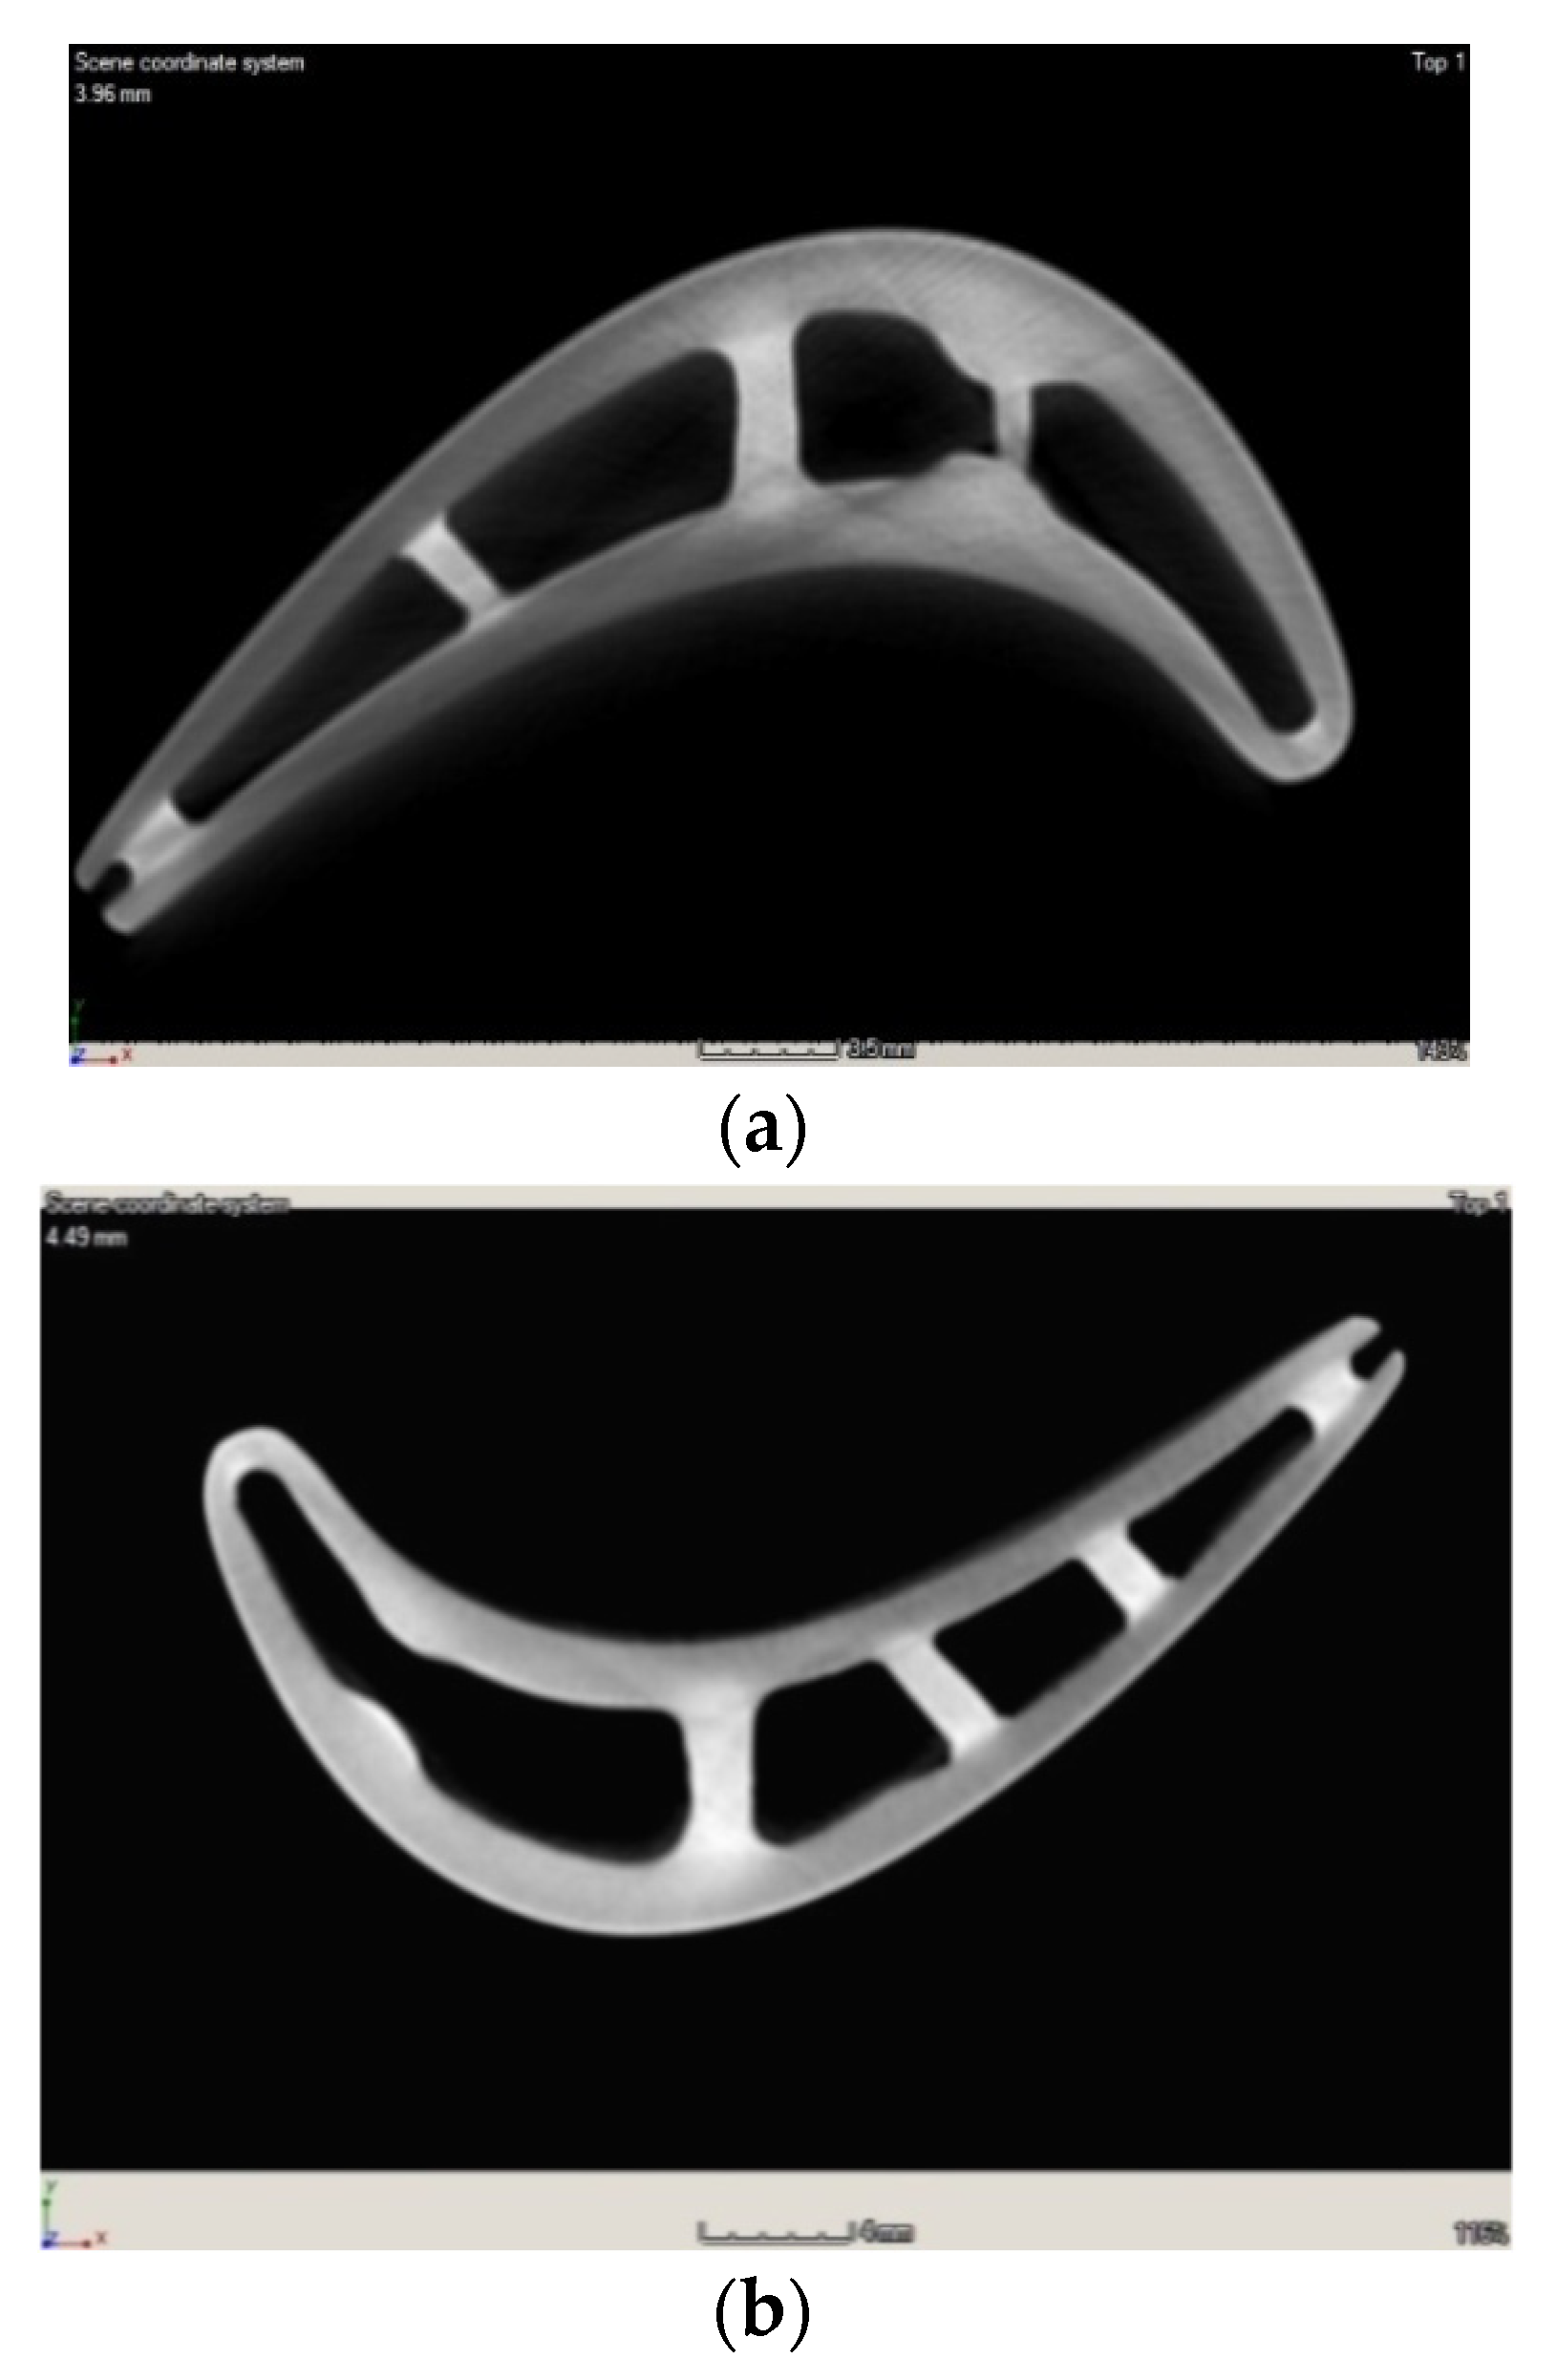
  • Number of projections—Figure 3a,b;
  • X-ray tube parameters (power consumption, current) and exposure time (the so-called timing)—Figure 4a,b;
  • Calibration of image background—Figure 5a,b;
  • Usage of “detector|shift” function—Figure 6a,b;
  • Usage of “auto/sco” function—Figure 7a,b.
Examination with too few projections—360 per revolution results in missing data during reconstruction because the angular resolution is one degree. However, examination with a correct number of projections which is 1440 per revolution results in the angular resolution being 0.25 degree. Thus, clearer contours were obtained and lack of artifacts.
Too low power of X-ray tube (Figure 4a) leads to the incomplete X-ray penetration of the material, especially in long, full surfaces. Due to the lack of the possibility to define the component edges, noises and artifacts are produced. By applying the correct test parameters (Figure 4b), a clear image of the object is observed.
The absence of background calibration (Figure 5a) causes a reduction of quality of the obtained image and image contours to become blurry. The correct calibration (Figure 5b) enables us to use the entire greyscale to the presented component. When the calibration is performed, the detector redefines the darkest and the brightest point (grey range) for the given parameters.
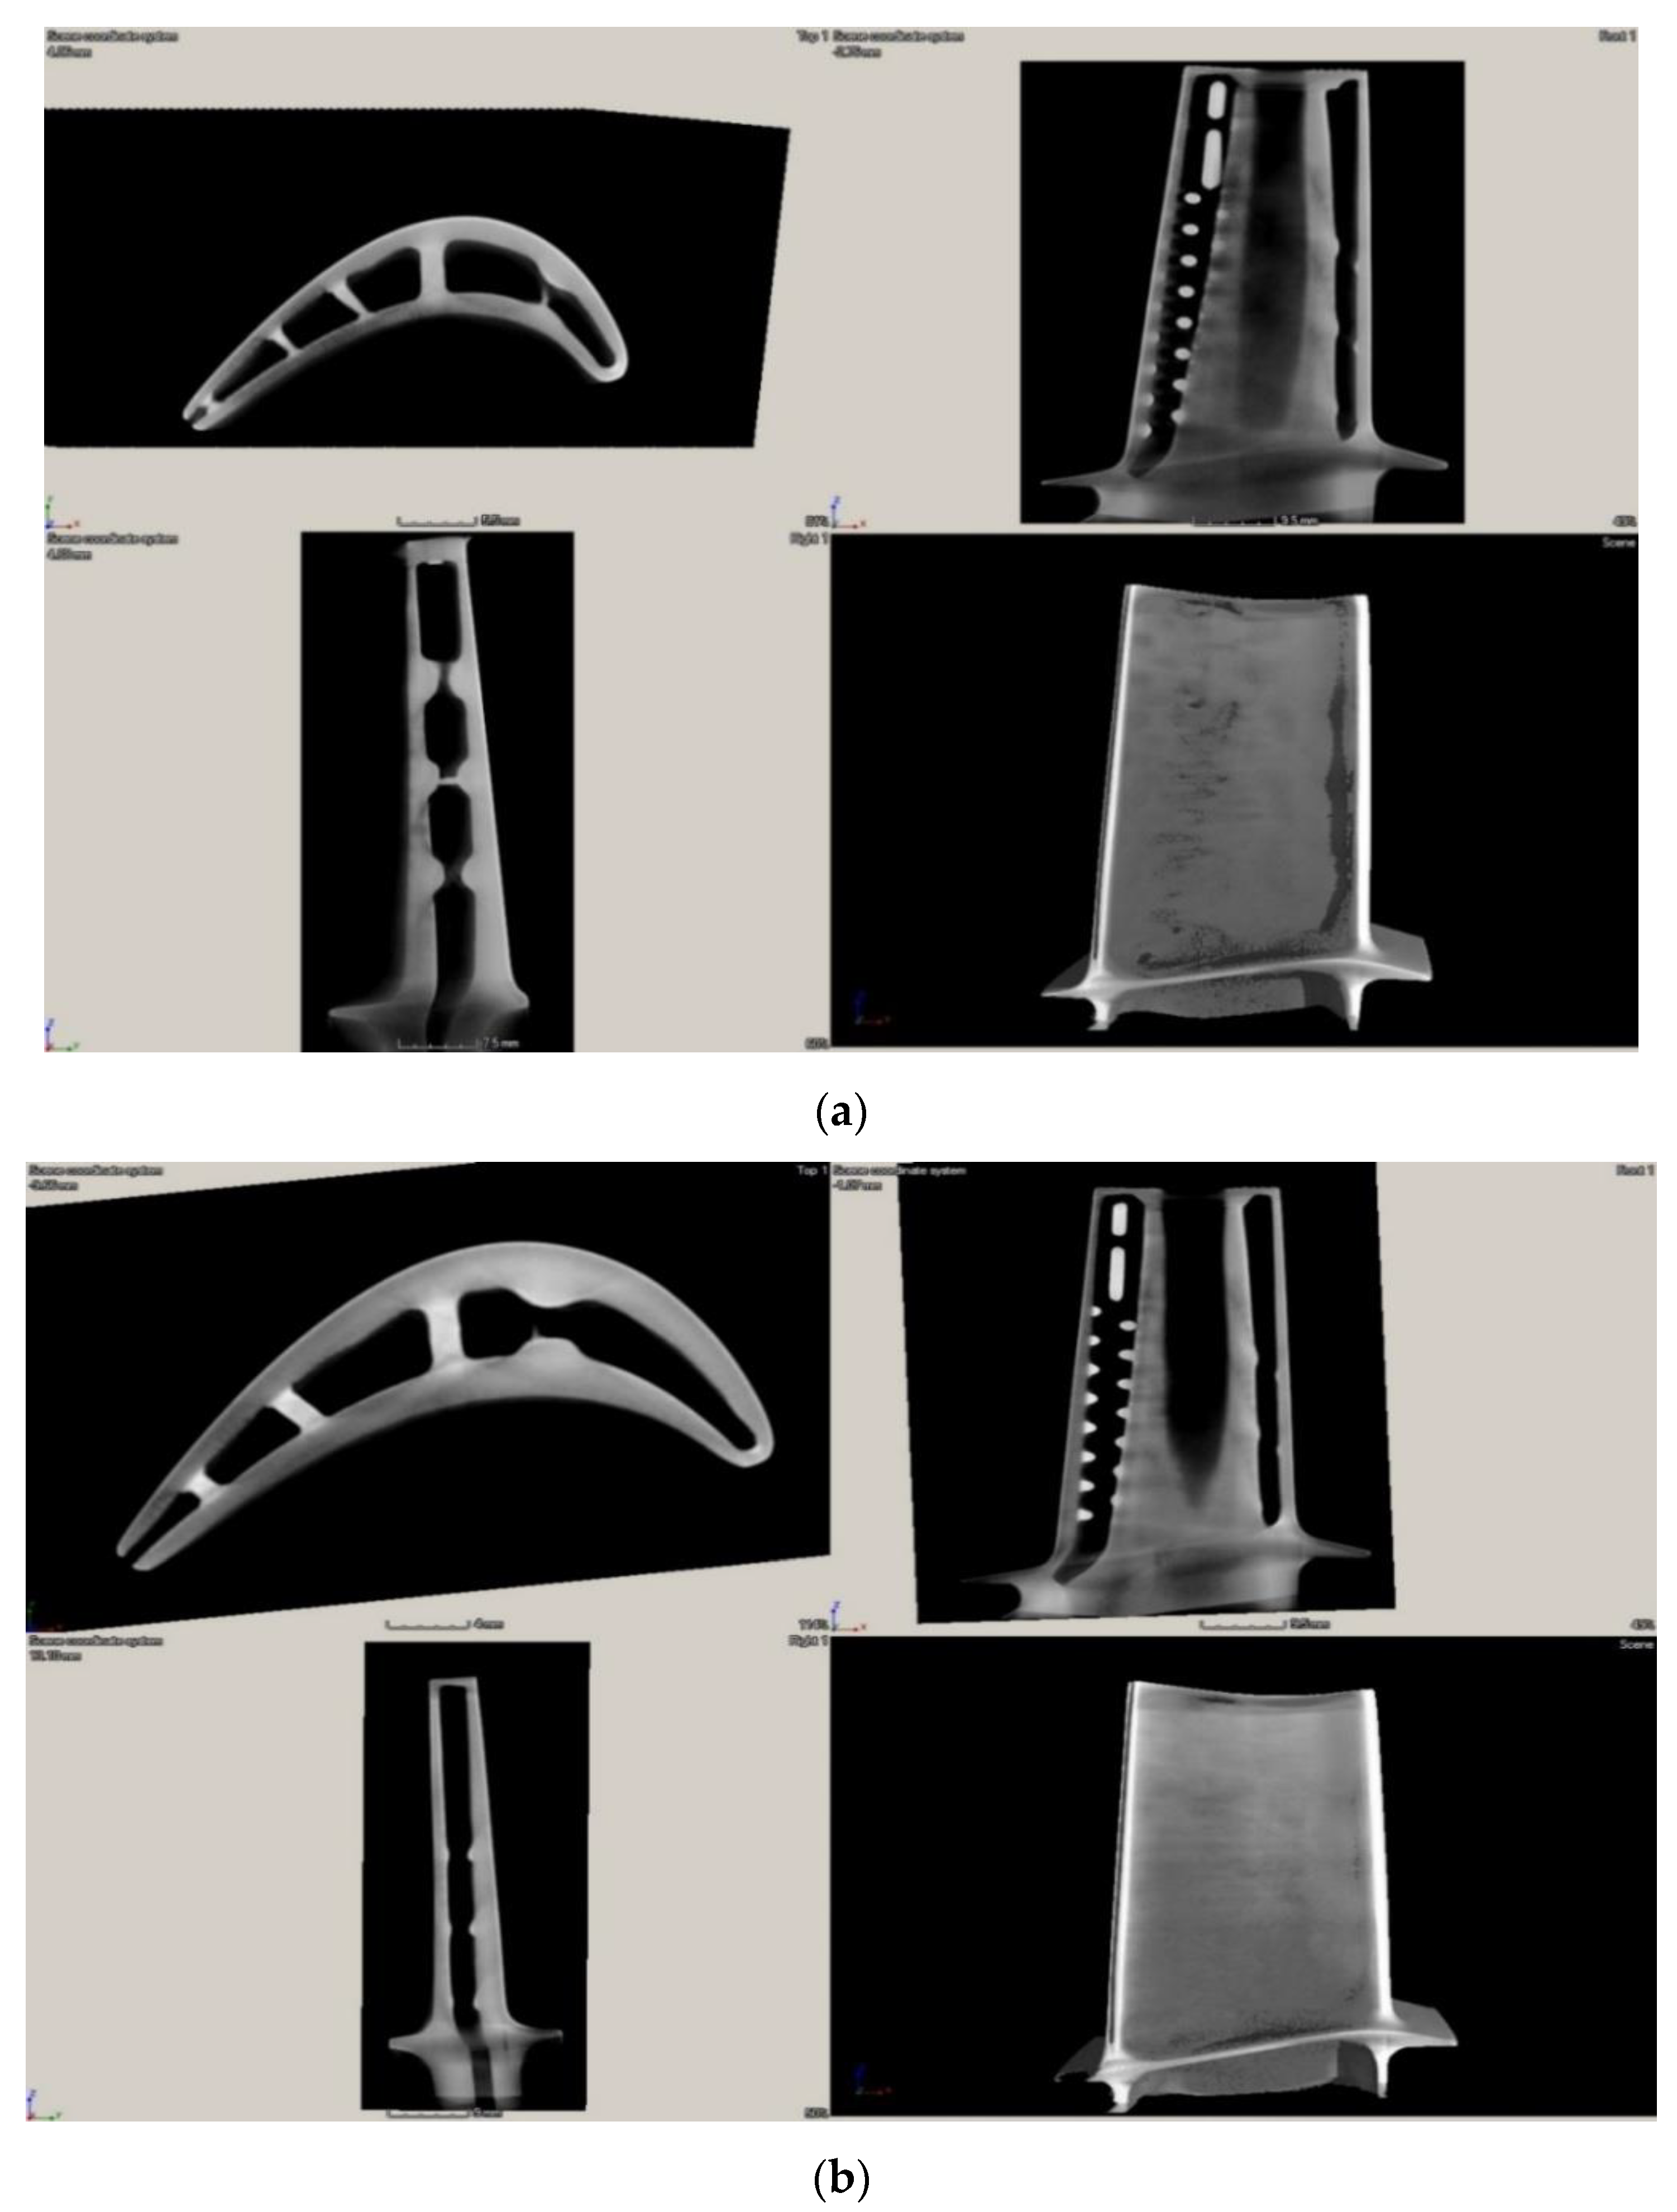
The essence of auto/sco function is based on initial scanning of the examined object in several selected locations—from two (0°, 360°) up to nine (0°, 45°, 90°, 135°, 180°, 225°, 270°, 315°, 360°). Comparing the images between successive positions allows you to determine the correction factors for moving and scaling an image of an element. These coefficients are used during 3D image reconstruction. The quality of the reconstructed image using the auto/sco function (Figure 7b) is much higher than without it (Figure 7a).

3.2. Detecting Defects in Gas Turbine Blades

In the experiment, optimized test parameters were applied. Due to this, correct test results were obtained that enabled to detect defects and carry out their qualitative and quantitative analysis. The exemplary possibilities of the XCT method to assess the technical conditions of blades were shown.
Figure 8 shows an image of a properly performed turbine blade examination without defects.
The following images show defects that can be detected by tomography.
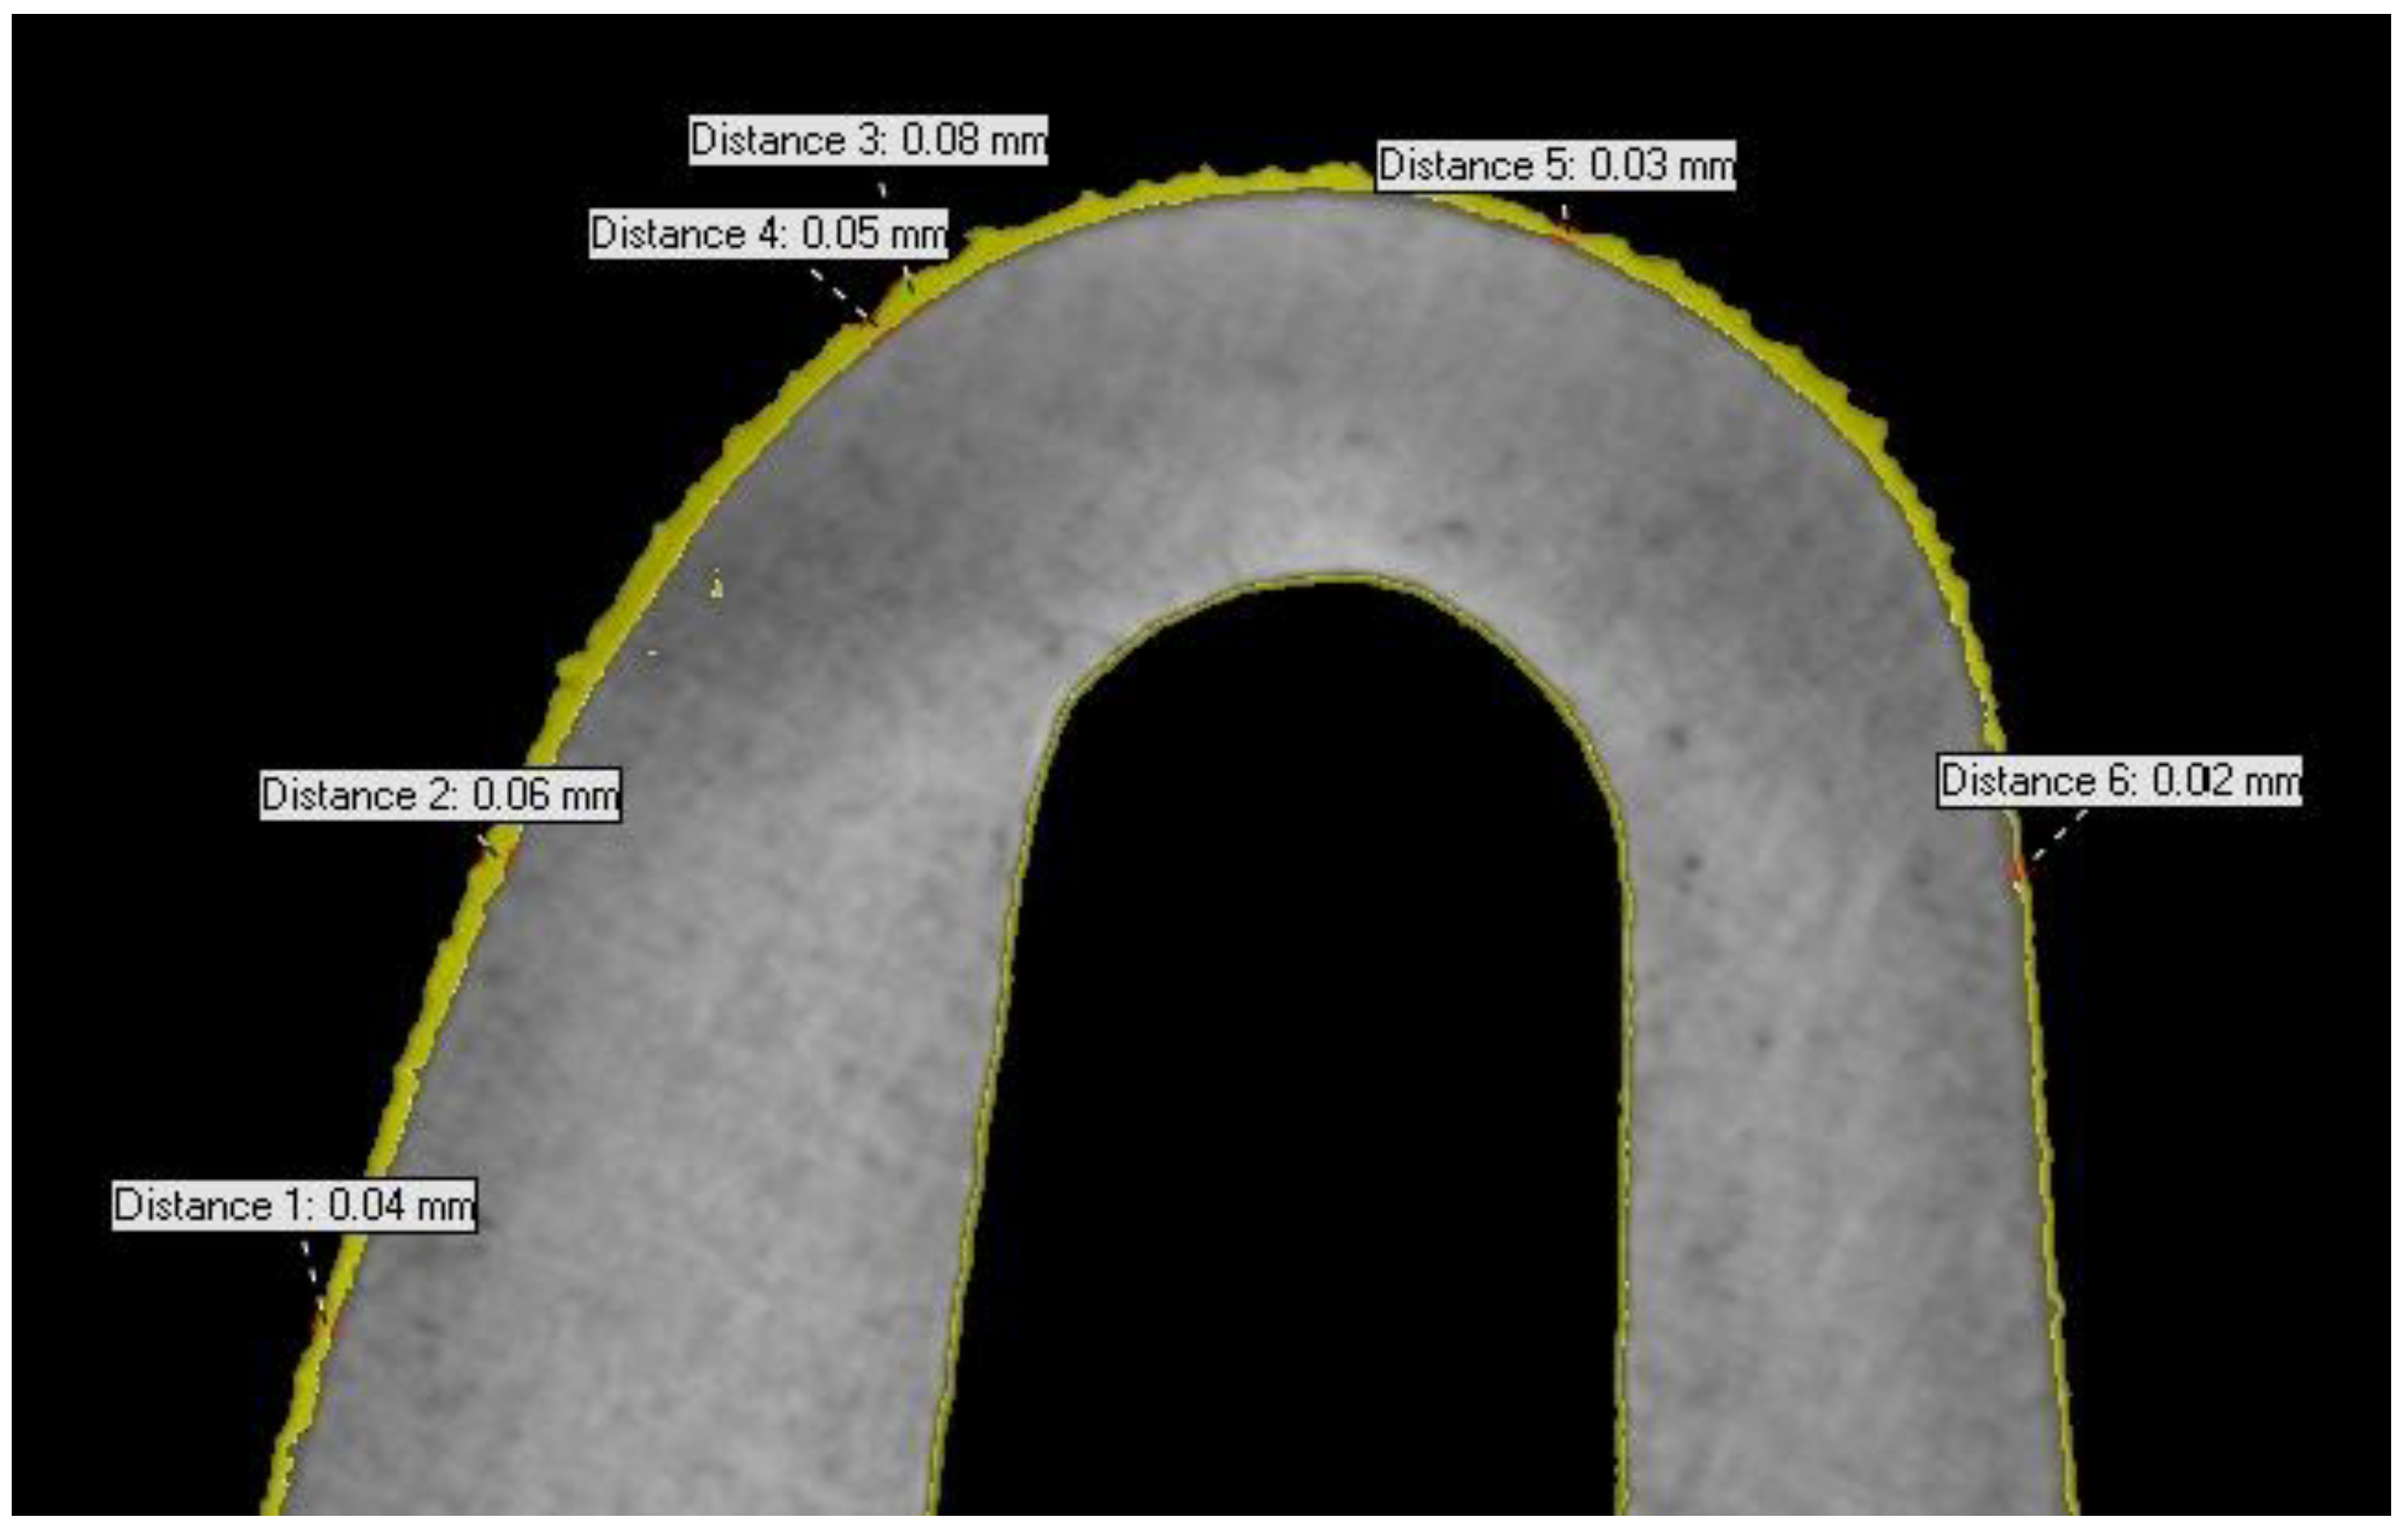
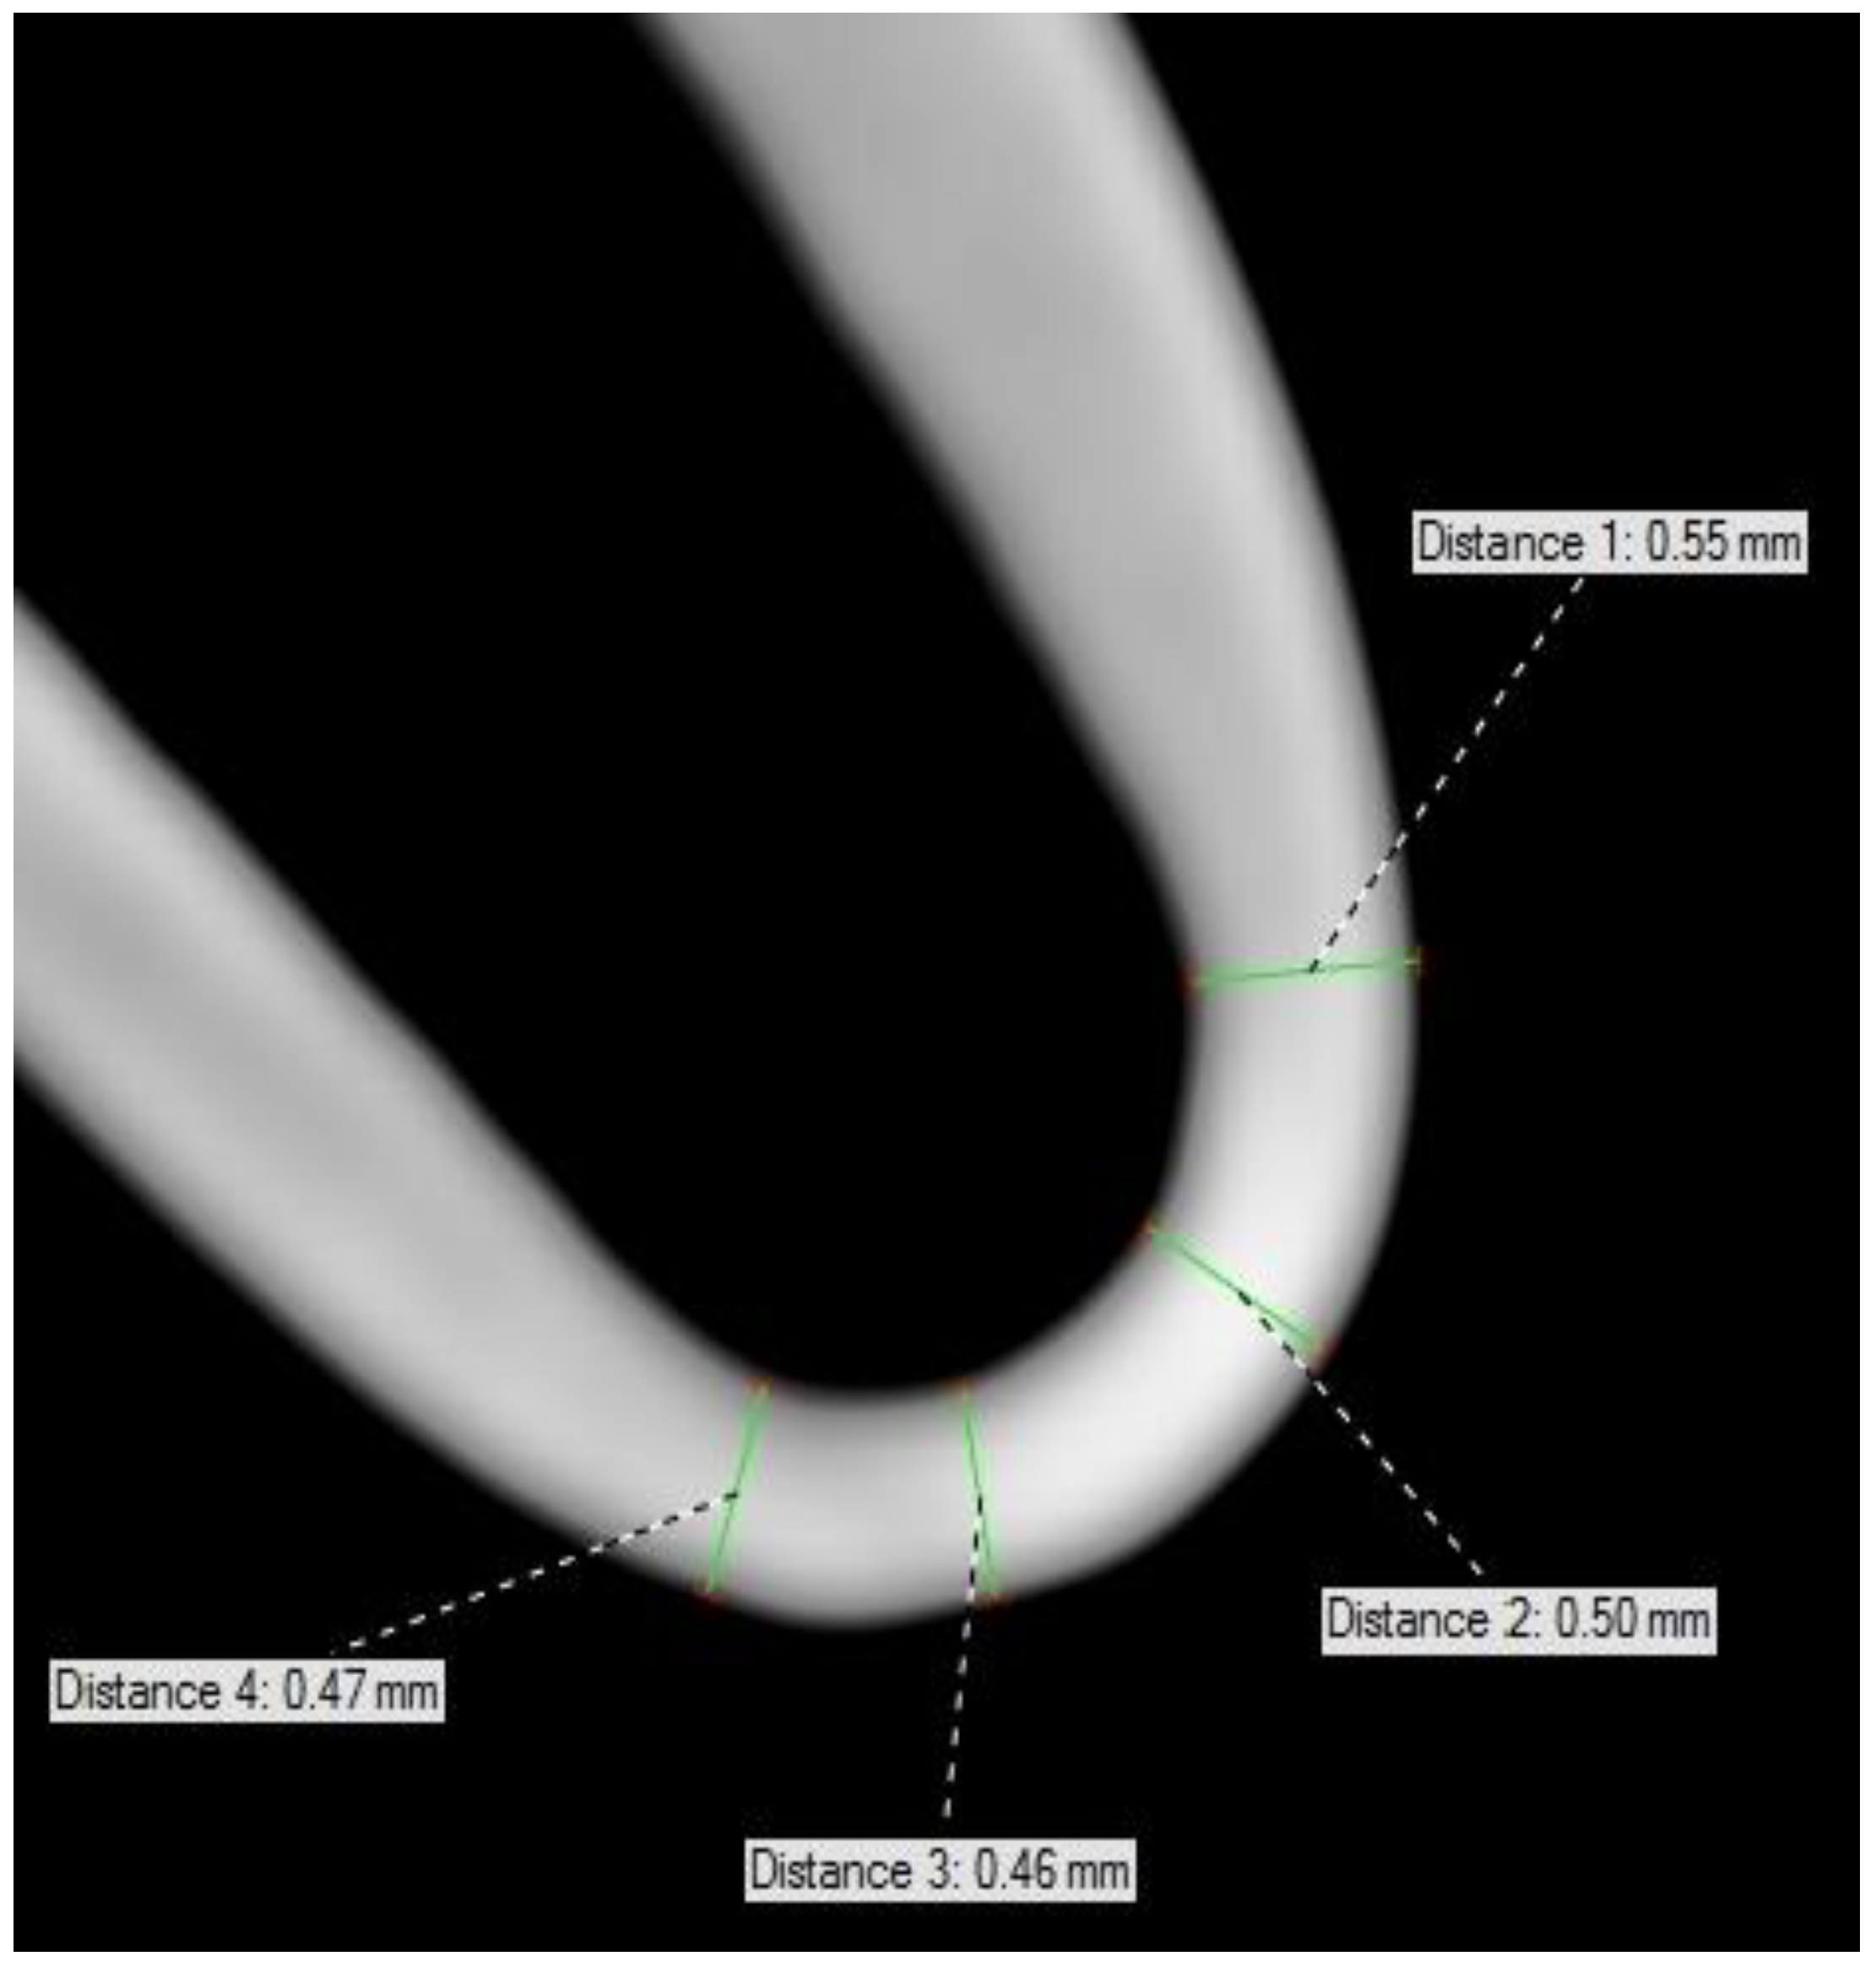
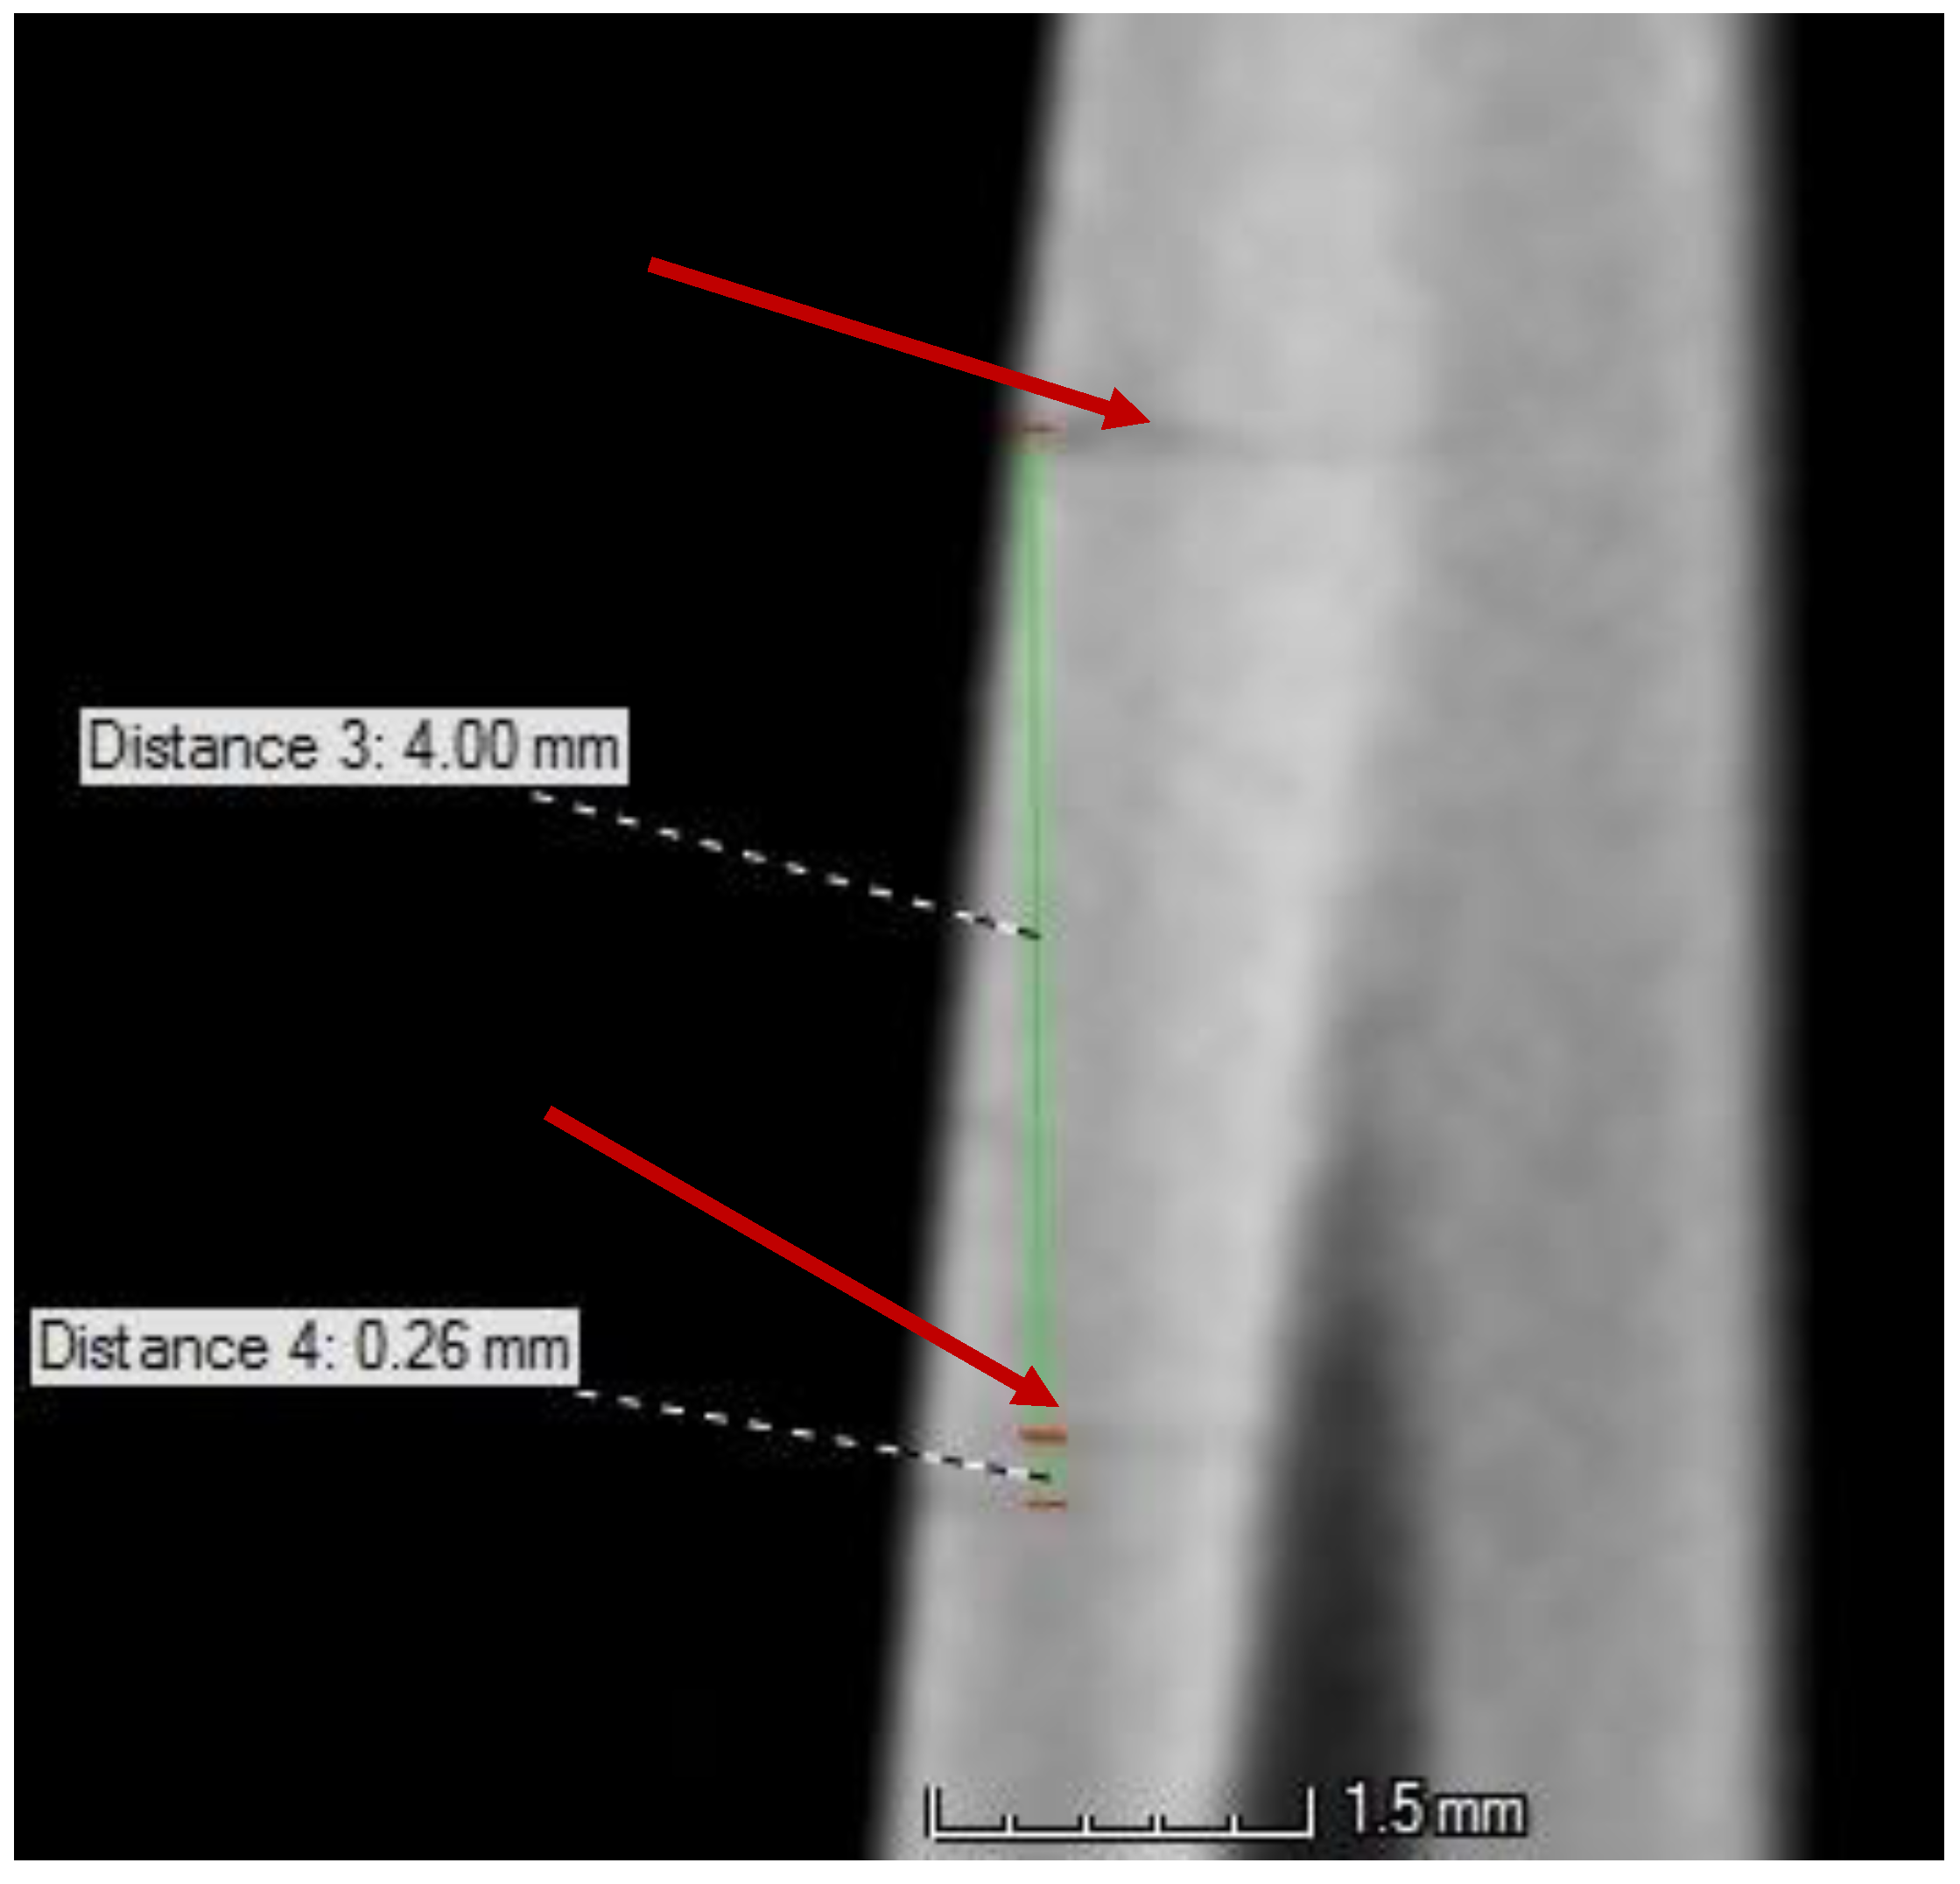
Figure 9 shows micro voids inside the native material. The measurement capabilities of the outer layer thickness, and the wall thickness (leading edge) are shown in Figure 10 and Figure 11.
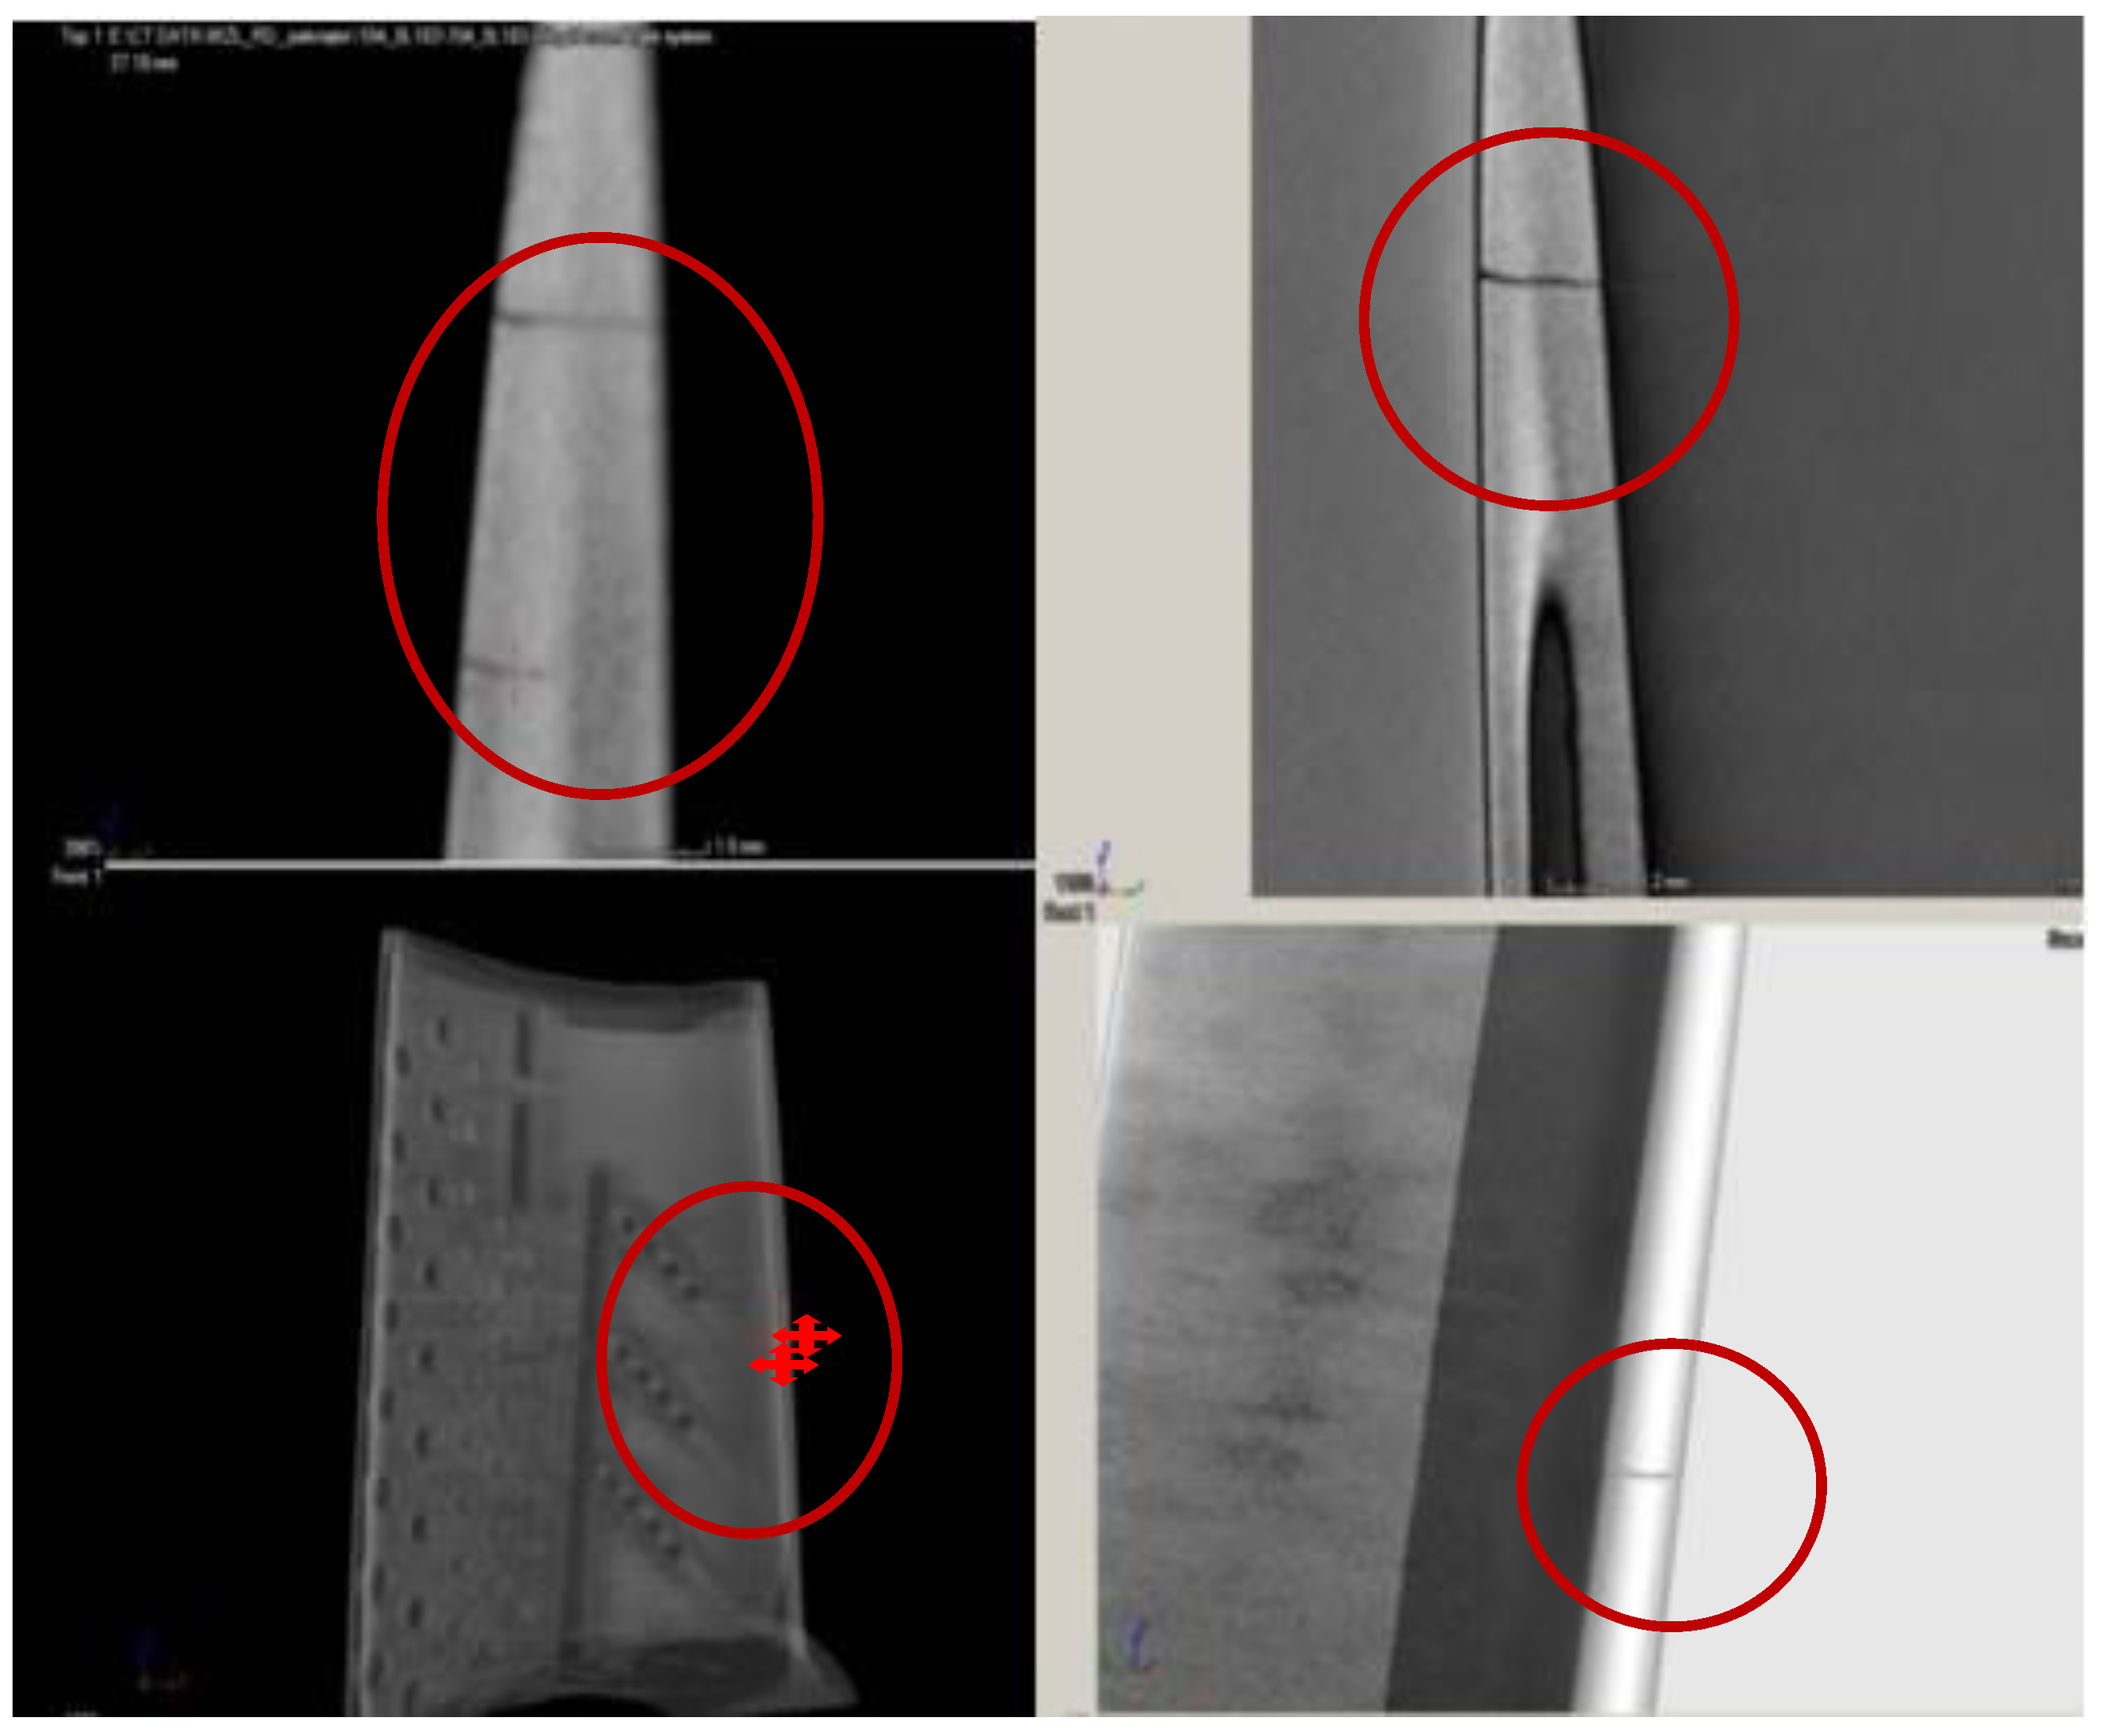
A critical defect in turbine blades is leading edge cracks. Such defects are illustrated in Figure 12 and Figure 13.

4. Discussion on Test Results

In CT inspection, different kinds of errors are observed, both during project creation and image reconstruction in a graphical software. Based on the conducted inspections, the main reasons for the occurrence of these errors are as follows:
  • incorrect setting of CT system operation parameters—X-ray intensity, Equation (1), X-ray linear attenuation coefficient, Equation (2);
  • incorrect number of images;
  • too low power of X-ray tube—initial radiation intensity, Equation (1);
  • incorrect background calibration;
  • incorrect fitting of the component on the rotary table;
  • incorrect component positioning;
  • too big dimensions of the tested object, as a result of which less than the test area is contained in the X-ray cone beam;
  • insufficient image resolution resulting from the incorrect distance of the component from the radiation source; and
  • too high power of the X-ray tube as compared to the voxel size.
When the test was carried out, and data were sent to the graphical station for reconstruction, the results may also include errors related to the computer data processing and concern the following issues:
  • determining the edge boundary based on the shades of grey;
  • averaging the area based on filters, e.g., Gauss;
  • incorrect optimization of calibration images; and
  • determining the incorrect axis using the sector scan.
The reconstruction algorithm is applied to calculate the values of data corresponding to the effective X-ray attenuation coefficient in each spatial position of the reconstructed volume from the scanned projection images. The main critical aspects of using the XCT of a cone beam with polychromatic X-ray sources are as follows: The limited X-ray penetration length, limited geometric accuracy and resolution, as well as not taking into consideration the data obtained. Due to this, artificial structures (artifacts) appear in the reconstructed dataset, which does not relate to real features of the tested object. The artifacts contribute to the problems with contrast, noise, interpretation of measurements, and accuracy of dimensions. Determining the optimum location of a sample is the next key quality issue of the final result. The appropriately selected location can enable us to improve the accuracy of measurements by reducing the artifacts in the dataset. The parameters that have to be considered by choosing a good location are as follows: penetration range of X-rays passing through the sample and orientation of the sample surface in relation to the X-rays. Penetration range of X-rays is defined as the distance between the point, where the ray enters the sample and exit point. A greater penetration range of X-rays results in greater beam hardening and, therefore, stronger beam amplification artifacts due to the interaction with the sample. On the other hand, a smaller penetration range decreases beam hardening and results in more uniform grey values of the sample in the reconstructed volume. Thus, it is essential to reduce the penetration length of the location in order to decrease deviations and improve the measurement accuracy. Planar areas or surfaces of a sample that are nearly parallel to the middle plane (the plane containing all trajectory points) and that are situated away from the middle plane cannot be properly reconstructed due to the incompleteness of the geometry of the cone beam acquisition. Due to this, such planar surfaces will blur in the reconstructed volume. When the orientation of the sample is changed, the orientation of the planar surfaces is altered as well. Changing the orientation of the critical planar surfaces has a large impact on the quality of the reconstruction in this area. For this reason, sample deviation is calculated during testing.
For every tested object, the majority of parameters have to be selected such as the power of X-ray tube, the number of images, single projection time, type of filter, place and type of fitting, etc. These parameters depend on the properties of the object, i.e., diversification of its shape (long and short edges), material type, presence of elements made from different materials.

5. Conclusions

Diagnosing the technical condition of gas turbine blades during production and operation is essential and expensive.
Implementing the 3D computed tomography allows obtaining very good inspection results of the internal cooling passages of blades.
XCT system allows for precise imaging in three-dimensional space of multiple layers of material with different thickness, good contrast and resolution of test results.
It was stated that the implementation of XCT method ensures quick and precise detection of failures, manufacturing defects and material deviations of blades made from a nickel-cobalt alloy.
It is possible to adapt and implement the XCT method to inspect turbine blades during the repair process with the accuracy meeting ISO and ASTM E requirements.
The adopted methodological approach to the optimum selection of adjustable parameters in the testing device enabled to achieve the innovative goal of research. It contributed to improving the efficiency of X-ray computed tomography method in detecting internal defects with dimensions that are less than those specified in the manufacturer’s requirements.
In the utilitarian scope, test results contribute to applying the XCT method to inspect turbine blades of an aircraft engine in the repair process.
Utilization of the XCT method, in combination with other non-destructive and destructive methods, will significantly increase the probability of detecting aircraft engine defects with complicated shapes.

Author Contributions

Conceptualization: J.B., M.C., A.K., H.B. and D.Z.; investigation: M.C., A.K. and D.Z.; visualization: M.C. and A.K.; writing—original draft: J.B. and M.C.; writing—review and editing: J.B. and H.B. All authors have read and agreed to the published version of the manuscript.

Funding

This research was funded by the Ministry of Sciences and Higher Education of the Republic of Poland, the scientific and research task no. 6879/2020—Air Force Institute of Technology. The APC was funded by Instytut Techniczny Wojsk Lotniczych—Air Force Institute of Technology, Warsaw, Poland.

Institutional Review Board Statement

Not applicable.

Informed Consent Statement

Not Applicable.

Data Availability Statement

Data sharing is not applicable to this article.

Conflicts of Interest

The authors declare no conflict of interest. The funders had no role in the design of the study; in the collection, analyses, or interpretation of data; in the writing of the manuscript; or in the decision to publish the results.

References

  1. Aust, J.; Pons, D. Taxonomy of Gas Turbine Blade Defects. Aerospace 2019, 6, 58. [Google Scholar] [CrossRef] [Green Version]
  2. Błachnio, J.; Bogdan, M.; Zasada, D. Increased temperature impact on durability of gas turbine blades. Eksploat. I Niezawodn. Maint. Reliab. 2017, 19, 48–53. [Google Scholar] [CrossRef]
  3. Błachnio, J.; Kułaszka, A.; Perczyński, J. The impact of unevenness and instability of flue gas temperature on the technical condition of gas turbine blades. J. Kones Powertrain Transport. 2018, 25. [Google Scholar] [CrossRef]
  4. Błachnio, J.; Kułaszka, A.; Zasada, D. Degradation of the gas turbine blade coating and its influence on the microstructure state of the superalloy. J. Kones 2015, 22. [Google Scholar] [CrossRef]
  5. Aust, J.; Shankland, S.; Pons, D.; Mukundan, R.; Mitrovic, A. Automated Defect Detection and Decision-Support in Gas Turbine Blade Inspection. Aerospace 2021, 8, 30. [Google Scholar] [CrossRef]
  6. Bogdan, M.; Błachnio, J.; Kułaszka, A.; Derlatka, M. Assessing the condition of gas turbine rotor blades with the optoelectronic and thermographic methods. Metals 2019, 9, 31. [Google Scholar] [CrossRef] [Green Version]
  7. Błachnio, J.; Spychała, J.; Chalimoniuk, M. Non-destructive computed tomography method for assessing the condition of gas turbine blades. In Problems of Aeronautical Research and Operation, Wyd; ITWL: Warszawa, Poland, 2012; Volume 8, pp. 1–10. [Google Scholar]
  8. Fentaye, A.D.; Baheta, A.T.; Gilani, S.I.; Kyprianidis, K.G. A Review on Gas Turbine Gas-Path Diagnostics: State-of-the-Art Methods, Challenges and Opportunities. Aerospace 2019, 6, 83. [Google Scholar] [CrossRef] [Green Version]
  9. Borowczyk, H.; Błachnio, J. Database of Expert Diagnostic System in the Field of Turbine Blades Non-Destructive Testing. J. Kones 2018, 25, 25. [Google Scholar] [CrossRef]
  10. Database of Air Force Institute of Technology Warszawa; (AFIT Intranet—for AFIT Staff only); AFIT Intranet: Warszawa, Poland, 2020.
  11. Bogdan, M.; Derlatka, M.; Błachnio, J. Concept of Computer-Aided Assessment of the Technical Condition of Operated Gas Turbine Vanes. Pol. Marit. Res. 2018, 25, 9. [Google Scholar] [CrossRef] [Green Version]
  12. RD-33 Aircraft Engine Technical Operation Manual 088.00.1700RE, Part 2, Air Force Headquarters: Warsaw, Poland, 2001.
  13. Przysowa, R.; Chalimoniuk, M.; Grzelka-Gajek, D.; Shakalo, R.; Karpenko, A. CT Inspection of Cooled Turbine Blades. J. Konbin 2020, 50, 307–331. [Google Scholar] [CrossRef]
  14. Ratassepp, M.; Rao, J.; Fan, Z. Quantitative imaging of Young’s modulus in plates using guided wave tomography. NDT E Int. 2018, 94, 22–30. [Google Scholar] [CrossRef]
  15. Urbikain, G.; Perez, J.M.; López de Lacalle, L.N.; Andueza, A. Combination of friction drilling and form tapping processes on dissimilar materials for making nutless joints. Proc. Inst. Mech. Eng. Part. B J. Eng. Manuf. 2018, 232, 1007–1020. [Google Scholar] [CrossRef]
  16. Calleja, A.; Tabernero, I.; Ealo, J.A.; Campa, F.J.; Lamikiz, A.; de Lacalle, L.N.L. Feed rate calculation algorithm for the homogeneous material deposition of blisk blades by 5-axis laser cladding. Int. J. Adv. Manuf. Technol. 2014, 74, 1219–1228. [Google Scholar] [CrossRef]
  17. Ziętara, M.; Kruk, A.; Gruszczyński, A.; Czyrska-Filemonowicz, A. FIB–SEM tomography of 4th generation PWA 1497 superalloy. Mater. Charact. 2014, 87, 143–148. [Google Scholar] [CrossRef]
  18. Rometsch, P.A.; Pelliccia, D.; Tomus, D.; Wu, X. Evaluation of polychromatic X-ray radiography defect detection limits in a sample fabricated from Hastelloy X by selective laser melting. NDT E Int. 2014, 62, 184–192. [Google Scholar] [CrossRef]
  19. Heinzl, C.; Kastner, J.; Amirkhamov, A.; Gröller, E.; Gusenbauer, C. Optimal specimen placement in cone beam X-ray computed tomography. NDT E Int. 2012, 50, 42–49. [Google Scholar] [CrossRef]
  20. Brierley, N.; Nye, B.; McGuinness, J. Mapping the Spatial Performance Variability of an X-ray Computed Tomography Inspection. NDT E Int. 2019, 107. [Google Scholar] [CrossRef]
  21. Jones, G.A.; Huthwaite, P. Limited view X-ray tomography for dimensional measurements. NDT E Int. 2018, 93, 98–109. [Google Scholar] [CrossRef]
  22. Prade, F.; Schaff, F.; Senck, S.; Meyer, P.; Mohr, J.; Kastner, J.; Pfeiffer, F. Nondestructive characterization of fiber orientation in short fiber reinforced polymer composites with X-ray vector radiography. NDT E Int. 2017, 86, 65–72. [Google Scholar] [CrossRef]
  23. De Pascalis, F.; Nacucchi, M.; Scatto, M.; Albertoni, R. Quantitative characterisation of low-density, high performance polymeric foams using high resolution X-ray computed tomography and laser confocal microscopy. NDT E Int. 2016, 83, 123–133. [Google Scholar] [CrossRef]
  24. Ziółkowski, G.; Chlebus, E.; Szymczyk, P.; Kurzac, J. Application of X-ray CT method for discontinuity and porosity detection in 316L stainless steel parts produced with SLM technology. Arch. Civ. Mech. Eng. 2014, 14, 608–614. [Google Scholar] [CrossRef]
  25. Zheng, S.; Vanderstelt, J.; McDermid, J.R.; Kish, J.R. Non-destructive investigation of aluminum alloy hemmed joints using neutron radiography and X-ray computed tomography. NDT E Int. 2017, 91, 32–35. [Google Scholar] [CrossRef]
  26. Kolkoori, S.; Wrobel, N.; Zscherpel, U.; Ewert, U. A new X-ray backscatter imaging technique for non-destructive testing of aerospace materials. NDT E Int. 2015, 70, 41–52. [Google Scholar] [CrossRef]
  27. Reddy, M.V.; Lukose, S.N.; Subramanian, M.P.; Rao, G.V.S.; Muralidhar, C.; Balasubramaniam, K. Industrial computed tomography system for aerospace applications: Development and characterisation. Insight Non-Destr. Test. Cond. Monit. 2011, 53, 307–311. [Google Scholar] [CrossRef]
  28. Muralidhar, C.; Lukose, S.; Subramanian, M. Evaluation of turbine blades using computed tomography. In Proceedings of the National Seminar on Non-Destructive Evaluation, Hyderabad, India, 1–4 December 2006. [Google Scholar]
  29. Asadizanjani, N. 3D Imaging and Investigation of Failure and Deformation in Thermal Barrier Coatings Using Computed X-ray Tomography. Ph.D. Thesis, University of Connecticut, Mansfield, CT, USA, 2014. [Google Scholar]
  30. Chalimoniuk, M.; Szczepanik, R.; Błachnio, J. The rate of decohesion of a gas turbine blade as assessed with the X-ray computed tomography (CT). J. Kones 2013, 20, 89–96. [Google Scholar]
  31. Kageyama, M.; Okajima, K.; Maesawa, M.; Nonoguchi, M.; Koike, T.; Noguchi, M.; Yamada, A.; Morita, E.; Kawase, S.; Kuribayashi, M.; et al. X-ray phase-imaging scanner with tiled bent gratings for large-field-of-view nondestructive testing. NDT E Int. 2019, 105, 19–24. [Google Scholar] [CrossRef]
  32. De Schryver, T.; Dhaene, J.; Dierick, M.; Boone, M.N.; Janssens, E.; Sijbers, J.; van Dael, M.; Verboven, P.; Nicolai, B.; Van Hoorebeke, L. In-line NDT with X-Ray CT combining sample rotation and translation. NDT E Int. 2016, 84, 89–98. [Google Scholar] [CrossRef] [Green Version]
  33. Datos|x Reconstruction. CT Data Optimisation and Reconstruction Software, Manual; GE Sensing & Inspection Technologies GmbH Phoenix|X-ray: Wunstorf, Germany, 2011; Electronic Document Created 2011.
  34. VGSTUDIO MAX, Version 2.2, Volume Graphics GmbH, Wieblinger Weg 92a, 69123 Heidelberg, Germany. (Version 2021). Available online: https://www.volumegraphics.com/en/products/vgstudio-max.html (accessed on 19 April 2021).
  35. VGMETROLOGY, Version 2.2, Volume Graphics GmbH, Wieblinger Weg 92a, 69123 Heidelberg, Germany. (Version 2021). Available online: https://www.volumegraphics.com/en/products/vgmetrology.html (accessed on 19 April 2021).
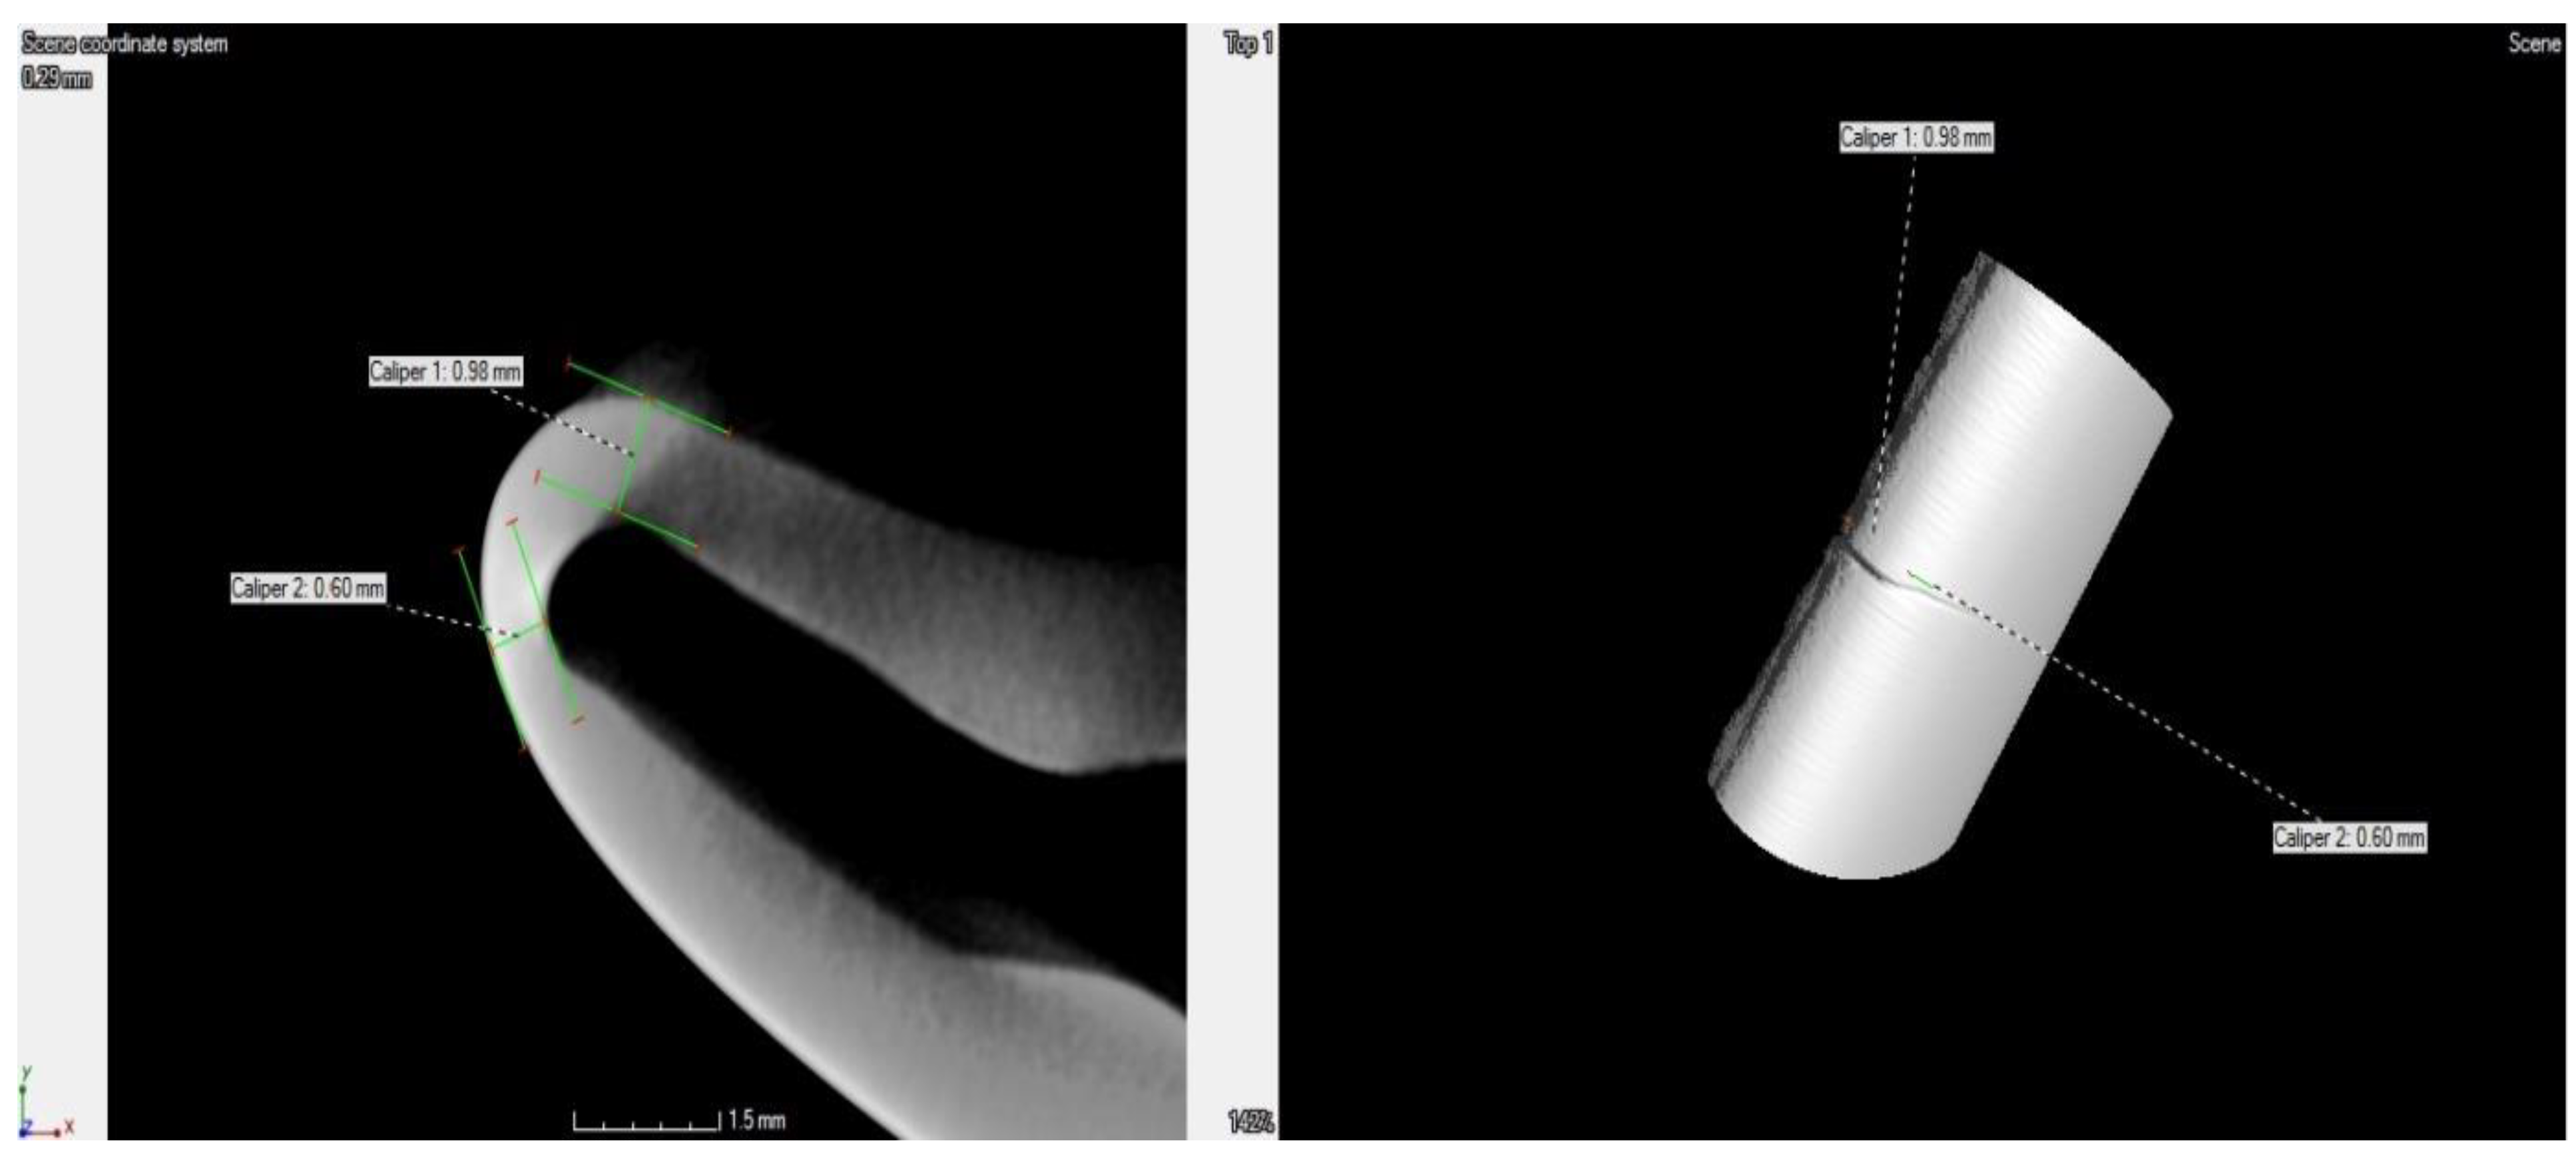
Figure 1. Thickness shape failure of turbine blade leading edge resulting in a crack.
Aerospace 08 00119 g001
Figure 2. Test methodology of turbine blades.
Aerospace 08 00119 g002
Figure 3. The impact of the number of projections per revolution: (a) 360 projections per revolution; (b) 1440 projections per revolution.
Aerospace 08 00119 g003
Figure 4. The influence of X-ray tube parameters and exposure time: (a) X-ray tube power consumption = 200 kV, current = 200 µA, timing = 333 ms; (b) X-ray tube power consumption = 260 kV, current = 260 µA, timing = 1000 ms.
Aerospace 08 00119 g004
Figure 5. The impact of background calibration: (a) Lack of background calibration; (b) correct background calibration.
Aerospace 08 00119 g005
Figure 6. The influence of using detector/shift function: (a) Examination without using detector/shift function; (b) examination with using detector/shift function.
Aerospace 08 00119 g006
Figure 7. The influence of using auto/sco function (auto scan optimizer): (a) Examination without using auto/sco function; (b) examination with using auto/sco function.
Aerospace 08 00119 g007
Figure 8. The correct blade images and its internal structure (without defects).
Aerospace 08 00119 g008
Figure 9. Shrinkages of the structure in the form of micro-voids at the turbine blade leading edge.
Aerospace 08 00119 g009
Figure 10. Erosive wear and overheating of the heat-resistant coating on the external surface of the turbine blade leading edge.
Aerospace 08 00119 g010
Figure 11. A variable thickness of the turbine blade leading edge.
Aerospace 08 00119 g011
Figure 12. Airfoil cracks on the turbine blade leading edge.
Aerospace 08 00119 g012
Figure 13. Airfoil cracks on the turbine blade leading edge.
Aerospace 08 00119 g013
Publisher’s Note: MDPI stays neutral with regard to jurisdictional claims in published maps and institutional affiliations.