Article

Optimal Sizing and Operation of Airport Infrastructures in Support of Electric-Powered Aviation

Department of Aerospace Science and Technology, Politecnico di Milano, 20156 Milano, Italy
*
Author to whom correspondence should be addressed.
Aerospace 2021, 8(2), 40; https://doi.org/10.3390/aerospace8020040
Submission received: 31 December 2020 / Revised: 25 January 2021 / Accepted: 26 January 2021 / Published: 3 February 2021

Abstract

:
The adoption of hybrid-electric aircraft is expected to have a considerable impact on airport operations, with the need of new infrastructural requirements to support electric-powered fleets. In particular, battery-charging requirements shall play a decisive role. Preliminary investigations useful to perform scenario studies for the future implementation of electric-powered aviation can take advantage of the ARES methodology presented here, which provides the optimal solution to the sizing of airport battery recharging infrastructures. Based on the flight schedule and on the specifications of the aircraft fleet and the charging equipment, the solution assesses the number and type of charging points, the related electrical consumption in terms of energy and power, and further information needed to guarantee the required operational level while minimizing the procurement and operating costs. The method allows considering and comparing two charging strategies: plug-in recharge and battery swapping. Energy price variation in time is also taken into account and a full description of the optimal time scheduling of recharging operations is provided. Application studies to the reconfiguration of two existing aerodromes, a General Aviation airport and a large regional hub, are discussed, showing the potential of the proposed approach.

1. Introduction

In recent years, the much-felt need to mitigate global climate change has been driving aeronautical institutions and stakeholders to formulate aspirational programmes, such as the Flightpath 2050 by ACARE (Advisory Council for Aeronautics Research in Europe) [1] and similar actions that have been announced by ICAO, IATA, and NASA [2,3,4]. To fulfil these long-term reduction emission goals, new electrically-powered aircraft propulsion systems are being investigated, according to multiple architectures [5,6]. For propeller-driven aircraft, application of Pure-Electric (PE) or Hybrid-Electric (HE) propulsion systems are considered. Typically, PE propulsion is considered to be based on a battery pack as the only energy source on board, while in HE propulsion another energy source is included. In serial HE architectures, the second energy source is some kind of fuel processed by a Power Generation System (PGS) that typically consists either in a thermal engine coupled with an electric generator (burning hydrocarbon fuel) or a fuel cell module (oxidizing hydrogen) [7,8,9,10].
The EU-funded H2020 project MAHEPA (Modular Approach to Hybrid-Electric Propulsion Architecture) is a peculiar example of an ambitious effort in which both variants of the serial HE architecture described above are developed to a high level of maturity, achieving the flight testing of both propulsion systems. This is being carried out at the moment of writing the present paper on two four-seat airplanes, the Pipistrel Panthera Hybrid and the Pipistrel/DLR Hy4, the latter being a new incarnation of the Green Flight Challenge winner Pipistrel Taurus G4 [11]. In the frame of MAHEPA, a great deal of research is carried out in providing estimations on the scalability of the developed technologies for application to the upper end of FAR-23/CS-23, and even FAR-25/CS-25 aircraft. This may lead regional air transportation to be the next application scenario for HE propulsion after the current activities targeting the General Aviation (GA) segment. In this regard, recent studies provide promising predictions for fuel reduction for commuter aircraft and narrow body liners [12]. Market studies concerned with the estimation of the potential passenger demand for short-haul air transportation have been recently carried out, up to providing the definition of optimal route networks aimed at capturing at best future opportunities arising by the enhancement of citizen mobility [13,14].
Despite the large amount of ongoing research related in HE propulsion and its applications, little information is available regarding the necessary infrastructure on the ground for the operation of electric-powered aircraft. Indeed, the existing airport framework was not designed for supporting the operations of this new type of aircraft and setting up an adequate ground infrastructure is necessary in view of a massive penetration of HE-based regional transportation [15]. Particularly, battery charging infrastructures will play a paramount role, given the need to support the timely recharge of large aircraft battery packs. This entails a need for an increased electric power supply in the reconfiguration of an existing airport. Therefore, the price of electric energy will represent a major cost to be taken into account, in addition to the acquisition and mantainance costs of the chargers. As the price at which energy is purchased is typically a function of time, often widely changing over a daily or weekly period, a smart scheduling of the recharging activities should be pursued to limit the energy supply cost.
These operations are clearly connected with the technological constraints inherent to available on-board systems and ground recharging facilities [16,17]. The latter can be reduced to two basic types [18]: Battery Plug-in Charger (BPCs) and Battery Swapping Station (BSSs). BPCs are conceptually similar to fuel-refilling stations. The large-scale diffusion of land Electric Vehicle (EVs) has pushed a capillary spread of fast or semi-fast BPCs. Many standards and connectors have been designed for the automotive field, such as SAEJ1772 (SAE International, Warrendale, PA, USA), CCS (Verein Deutscher Ingenieure, Düsseldorf, Germany), CHAdeMo (CHAdeMO Association, Tokyo, Japan) and Tesla Superchargers (Tesla Inc., Palo Alto, CA, USA). On the other hand, examples of aircraft charging operations for propulsive purposes are confined to a few models, such as the Pipistrel Alpha Electro and Velis Electro (Pipistrel Vertical Solutions, Ajdovščina, Slovenia) the latter being the first PE airplane ever type-certified [19]. The recharge happens through an external 60 kW Direct Current (DC) charger, that is able to recharge the battery in 15 min.
A major shortcoming associated with BPCs is the fact that heavier and higher-performing aircraft, such as today’s liners, would need amounts of battery energy in the order of some MWh (from 3.5 to 7 MWh are considered in [20] for an aircraft the weight of a B737-800, depending on the mission). This would translate into an unacceptably long recharging time, incompatible with the usual turnaround of a liner. The usual 90 kVA power lines and connectors currently deployed to supply aircraft systems on ground could be multiplied to increase power supply, but besides procurement cost for the hardware, this would impact on the peak power required from the grid. This is responsible for a significant part of the energy supply cost, together with the consumed energy amount. For example, in the current Italian energy supply scenario, the cost of allowed peak power for a typical user amounts to 20% of the overall electric energy cost.
An alternative to BPCs are BSSs, which allow recharging batteries while unplugged from the vehicle [21,22,23]. Provided a matching number of unplugged batteries is available, a smart scheduling of the recharge, simultaneously compatible with air operations and such to minimize power acquisition cost, can be envisaged. Clearly, batteries in excess with respect to the number of operating aircraft add to acquisition cost and to an increased logistic effort, since the batteries need to be transported from and to the aircraft, as well as safely stored after recharge and before being plugged in. Furthermore, similar to BPC, recharging power is limited for a single BSS, hence a high number of simultaneous battery recharges would imply a large number of BSSs, with an ensuing effect on acquisition cost. In the automotive market, the current trend is favoring the application of BPCs, disregarding BSSs, an important factor being the similar life span of vehicle and battery pack. However, the future development of a transport aviation market may take advantage by the possibility of swapping batteries, providing pre-charged packs to HE liners in compliance with turnaround time requirements. An early example of considering swappable battery packs in the design of a transport aircraft is found in [24]. Naturally, in case the design solution involves a radical depart from classical architectures such as when using structural batteries (i.e., parts of the airframe load-bearing structure that are able to store electric energy), as proposed in [25], employing BPCs becomes necessary.
In this paper, a comprehensive approach for optimally sizing the battery recharging infrastructure at an airport is illustrated. The methodology is termed ARES (Airport Recharging Equipment Sizing) and, to the best or the authors’ knowledge, is the first such attempt in the literature [26]. The method starts from the knowledge of the airport flight scheduling and the composition and specifications of the aircraft fleet, to provide a complete solution in terms of number of batteries, chargers, and aircraft necessary to fulfil the required operations. The solution is derived from the minimization of the total expenditure, including procurement, mantainance, and electric energy costs, and provides a detailed description of the time scheduling of the recharging operations and the corresponding power and energy time histories for each charger involved.
After the detailed illustration of the ARES mathematical formulation, application studies to the reconfiguration of existing airports are provided. First, a GA airport is considered, as a representative of cases where a single company is simultaneously acting as ground operator and fleet owner. In such cases, most of the company activities consist of a flying school and the operations of the related fleet make for the major part of all operations at the airport. For such scenario, the study of fleet switching to innovative propulsion should take into account the procurement cost of new aircraft in the cost function, to grant the same operational level of a conventional fuel-burning fleet. Finally, a large airport hosting a sizeable regional traffic is considered. The fleet switching of propeller-driven regional fleets in the range from 40 to 70 passengers to HE aircraft represents a possible scenario for the next decades, investigated in the MAHEPA project as well as in other initiatives in Europe and worldwide. The interest in a serial HE propulsion for these future liners lies in the ability of this architecture to allow a PE flight mode, for example during terminal maneuvers, thus greatly reducing the acoustic footprint of departure and arrival operations [27,28], in addition to low-altitude chemical impact.

2. Materials and Methods

2.1. General

The ability of sizing the charging infrastructures for a given scheduling of aircraft movements at a given airport will represent a fundamental element in drafting future operational scenarios for future PE and HE air transportation. The problem involves a large number of variables and parameters, related to the type, cost, usage, and life duration of aircraft, batteries, charging devices, as well as to the characteristics of the electricity supply.
A feasible and reliable solution is sought here by casting this question as an optimization problem, by establishing an appropriate objective function to be minimized under all relevant constraints. The objective function is represented by the total cost related to battery charging operations. The constraints reflect aircraft, airport, and electric grid operational models, as well as technology limitations. The formulation is cast as a Mixed Integer Linear Programming (MILP) problem, where Boolean, integer and real variables are involved. This is applied to a given duration in time for which a detailed flight scheduling is known. The solution is provided as the optimal values of the number of needed charging devices, the number of necessary batteries, and the detailed time scheduling of the charging process.
The present formulation is inspired by the approach described in [21], where an optimization framework is set for automotive applications. However, as a result of the fundamentally different modes of operations of aircraft on scheduled flights when compared to land EV, the extension of the cited approach to airport operations implied a major reformulation involving almost all the ingredients of the MILP problem, from the definition of the cost function, to a large part of the necessary constraints. As an example of the numerous differences that naturally arise from the widely diverse fields of application, we remark that in [21], the operation of a BSS to support a fleet of ground vehicles is considered, according to a day-ahead scheduling process, including possible uncertainties in battery demand and in electricity price. The procurement cost of the BSS is not considered, as well as that of the EVs. In the present case, we consider both BSSs and BPCs as alternative to one another or in a mixed setting, including their procurement cost. Indeed, given the current uncertainty about the convenience of providing either plug-in recharge or battery swap, especially for larger aircraft models, we introduced the possibility to rely on both type of devices. The procurement cost of the airplanes is also included in the present formulation, as it may be of interest whenever the fleet is operated by the same company that manages the airport recharging infrastructures (as it may be for GA airports). Also, here the battery demand is known a priori, as it depends strictly on the flight schedule, which—contrary to private cars—is known ahead in detail. Therefore, we did not consider uncertainties in battery demand and, as all battery requests must be satisfied, a penalty for the inability to satisfy such demand is not necessary. Also, we did not consider uncertainties in electricity price.
Recently, an approach that shares many elements with the present one has been published [29]. Instead of using a MILP formulation, scheduling theory is employed to solve a similar problem. However, some differences in the framework can be seen: the solution is allowed to divert from the predetermined flight scheduling, only battery swapping is considered, only one type of battery is considered, some battery-related and aircraft-related constraints are relaxed, and the price of electricity is constant in time, so that minimizing the electricity cost equates to minimizing the peak-power draw.

2.2. Preliminary Definitions

In seeking for the minimum of the cost function J as a function of an array of optimization variables x , the dynamics of the recharging operations are integrated over a time duration L, subdivided in a number of slots of length l t , providing a discrete time grid for the problem. The set of all time slots is denoted by T and each time slot is identified by the index t T . Therefore, L = Σ t T l t . The set of all batteries is denoted by I and each battery is identified by the index i I . We consider that, in relation to the propulsive system, a single type of battery is embarked on each aircraft type and that for each battery type a specific charger type is needed. Therefore the set of all aircraft types is in a one-to-one relationship with battery types and charger types and is denoted by G, while each aircraft type/battery type/charger type is identified by the index g G .
The battery demand over time is defined by the flight scheduling at the airport, with the request for a fully charged battery pack before each take-off. It is conservatively assumed that the state of charge of depleted batteries after each flight amounts to the minimal admissible value. The cost function and constraint equations will be described in the following, together with the necessary provisions to set the problem in a MILP framework.

2.3. Cost Function

From the standpoint of an airport operator, the goal is to grant an assigned operational capability, to satisfy a given flight schedule, while minimizing procurement and operational costs. Therefore, the cost function J is defined as the sum of all involved costs over the time duration L as
J = C e + C p + C BSS + C BPC + C b + C a
where C e represents the cost of the electric energy purchased from the grid, C p the cost of the corresponding peak power, C BSS and C BPC the procurement costs of the BSSs and BPCs, C b the cost of the batteries, and C a the cost of the airplanes. The latter may or may not be included, according to the application, as it will be seen in the following application studies. Each cost component in Equation (1) is discussed below.
The cost of the energy supply C e is bound to the energy amount E t purchased from the grid in the time slot t and to the corresponding monetary value per energy unit λ t . Due to the very low frequencies in the evolution of both quantities as functions of time (compared to a daytime scale), providing definitions in discrete time is more typical to this type of problem. Therefore, it is possible to write
C e = t T λ t E t ,
where the value of E t represents the energy acquired in the current time slot t.
The cost of peak power can be expressed as
C p = max t T E t l t c p d 30
where the ratio E t / l t represents required power in the time slot t, while c p represents the cost per unit peak-power per month, and d the number of days in the considered analysis. This is simply the time duration expressed in days, so that d = L / 1440 , when L is given in minutes.
The procurement cost of the BSS can be written as
C BSS = g G N g BSS c g BSS d d g BSS ,
where c g BSS is the acquisition cost per unit of the BSS and d g BSS the expected lifespan of the device, measured in days. Therefore, d / d g BSS represents the relative extension of the analysis over the expected lifespan of the device. The unit cost of the BSS can be defined, based on a technological regression, as a function of the BSS rated charging power p g BSS :
c g BSS = a 1 ln p g BSS a 0 1 + χ g BSS ,
where the suggested values for the coefficients are a 1 = 14601 and a 0 = 19968 [30], while the coefficient χ g BSS 0 takes charger maintenance costs into account.
In a similar fashion, the procurement cost of the BPC can be written as
C BPC = g G N g BPC c g BPC d d g BPC ,
where c g BPC is the acquisition cost per unit of the BPC and d g BPC the expected lifespan of the device, measured in days. The unit cost of the BPC can be defined in the same way as seen for the BSS, as a function of the BPC rated charging power p g BPC .
The cost model for batteries provides the expression
C b = g G N g b c ¯ g b
where c ¯ g b is a weighted cost per battery. It should be noted that, theoretically, when considering a sufficiently long time frame for the cost computation, driving the number of total batteries to a minimum would not imply a lower overall battery cost, but only a lower initial procurement cost. A lower number of batteries would imply that each of them should sustain more charge and discharge cycles. This in turn would decrease their life more rapidly, implying that more batteries would be needed in the long run, with an ensuing higher overall cost. On the other hand, a higher number of spare batteries would entail a higher initial procurement cost and their efficient use would be associated in turn to a higher number of charges. Therefore, the C b term makes sense only on a time frame sufficiently limited with respect to the battery lifespan. With this in mind, c ¯ g b was written as
c ¯ g b = c g b d d g b
where c g b is the cost per battery. The term d / d g b represents the ratio between the length of the simulation and the expected battery life. The value of d g b will influence the weight that the battery cost will have compared to the other terms of the cost function. The reasoning above does not take into account the problem of cell aging, in case the usage of the batteries is very prolonged in time. This does not happen in the application cases studied so far, as shown by the examples provided in Section 3, where the average battery replacement time is always well below two years. However, different approaches may be easily considered in case cell aging is of interest, such as changing the value of d g b , in order to drive the solution to an initial acquisition of less batteries to be replaced quickly as as result of a very frequent usage.
Finally, the aircraft procurement cost C a , whenever necessary for the analysis, can be arranged similarly to Equations (4) and (6), that is proportional to the number of aircraft N g a needed for the scheduled operations, yielding
C a = g G N g a c g a d d g a
where c g a is the aircraft procurement cost per unit and d g a the expected lifespan of the aircraft.

2.4. Constraints

The parameters influencing the components of the cost function need to satisfy an array of constraints, which reflect both technological limits and models of the recharging processes. As seen in the following, these constraints can be formalized as a set of 23 relations: 7 equations and 16 inequalities.

2.4.1. Battery State of Charge

The State Of Charge (SOC) S i , t of the i-th battery at time index t should always range between a minimum S g m i n and a maximum S g m a x , as required by the device own technology limitations. This is expressed by
g G s i , g 1 x i , t o x i , t b S g m i n S i , t g G s i , g 1 x i , t o x i , t b S g m a x ,
where s i , g is a binary parameter indicating if the i-th battery is of type g:
s i , g = 1 , if battery i is of type g , 0 , otherwise . .
This allows to handle different types of battery technologies, represented by the G set, each one employed—in principle—on a different type of airplane. The binary variable x i , t o is active when a battery is currently in use on a flying airplane, while x i , t b models other types of unavailability, such as when a battery is disembarked from an airplane and transferred to a BSS:
x i , t o = 1 , if battery i is in use on an aircraft at time t , 0 , otherwise ,
x i , t b = 1 , if battery i is unavailable at time t , 0 , otherwise . .
Equation (10) shows that S i , t = 0 when x i , t o or x i , t b are equal to one. Indeed, an unavailable battery can be seen as a battery with a zero SOC that cannot be recharged.

2.4.2. Battery Availability

The variables x i , t o and x i , t b are linked to a third binary variable x i , t , that becomes unitary when the i-th battery is requested at time t:
x i , t = 1 , if battery i is requested at time t , 0 , otherwise . .
All flights are supposed to last m time slots. When the i-th battery is not available because it is engaged in a flying aircraft, x i , t o must be equal to one for the entire length of the flight:
x i , t o = x i , t m + x i , t ( m 1 ) + + x i , t .
The battery becomes newly available for recharge when the flight mission ends, and the next equation is needed:
x i , t + m b = x i , t .
In order to better illustrate the application of x i , t o , x i , t b and x i , t , an example is provided in Table 1, in the case of battery swapping. This refers to the case when the i-th battery is requested in the time slot t = 1 and a flight mission lasts m = 3 time slots.

2.4.3. Battery Readiness for Use

Naturally, every battery must be fully charged before being employed on an aircraft. Hence, the following equation is needed:
S i , t 1 g G s i , g x i , t S g m a x .

2.4.4. Battery State of Charge Congruence

Congruence must be imposed between every battery’s state of charge at the beginning and at the end of the simulation:
S i , t = 0 = S i , t = t f .

2.4.5. Battery Charging Power

The battery charging rate cannot exceed a technological limit expressed by a nominal P g max value. This yields the conditions below, for both BPC and BSSs:
0 P i , t B P C g G s i , g ( 1 x i , t o ) P g max ,
0 P i , t B S S g G s i , g ( 1 x i , t o x i , t b ) P g max .

2.4.6. Exclusive Recharging

Two further binary variables y i , t BPC and y i , t BSS are added to exclude simultaneous recharging of the same battery from a BPC and a BSS:
y i , t BPC = 1 , if battery i is recharging at a BPC at time t , 0 , otherwise ,
y i , t BSS = 1 , if battery i is recharging at a BSS at time t , 0 , otherwise . .
Their sum is constrained to be unitary at most;
y i , t BPC + y i , t BSS 1 .
Using these variables, the following equations, mimicking Equations (19) and (20), must be considered:
y i , t BPC P min P i , t B P C y i , t BPC g G s i , g P g max ,
y i , t BSS P min P i , t B S S y i , t BSS g G s i , g P g max ,
so that the recharging power of a BPC or BSS charger may be non-zero and not higher than the maximum allowed only if the corresponding binary variable states that the charger is active. Note that P min may assume an arbitrary small positive value.

2.4.7. Recharge Continuity

For evident practical reasons, battery charging is required to happen in a single operation, where the battery is brought from its initial SOC to full charge. This means that the involved time slots must be consecutive. To enforce this, the following relations are added:
y i , t BPC y i , t 1 BPC S i , t 1 g G s i , g S g m a x ,
y i , t BSS y i , t 1 BSS S i , t 1 g G s i , g S g m a x .
The term to which the floor symbol is applied in the right-hand side of the previous equations is always null whenever the battery SOC is less than the maximum allowed for that battery type. This means that y i , t BPC or y i , t BSS must equal unity until the battery is fully charged. Of course, the charging power can assume any value allowed by Equations (24) and (25).

2.4.8. Flight Schedule

To satisfy the flight schedule requirements, the following equation is enforced:
i I s i , g x i , t = b g , t ,
where the b g , t represents the battery demand for a battery type g at time t, as derived from the flight schedule, while the minimum number of necessary batteries is given by
N g b = i I s i , g z i .
The new binary variable z i is such that
z i = 1 , if battery i is at least used once , 0 , if battery i is never used . .
Therefore, to take into account the usage of the batteries, the following equation is needed:
t T x i , t | T | z i ,
where | T | represents the cardinality of T. When z i = 0 , the battery i cannot be used, as x i , t is forced to vanish. If battery i is required, the algorithm sets z i = 1 . When this happens, x i , t can assume an arbitrary value, otherwise it is forced to zero. This prevents that batteries that are never used remain in the set I (which is initialized by a guess value).

2.4.9. Number of Chargers and Aircraft

Finally, the minimum number of BSSs, BPCs and aircraft are related to the the binary variables y i , t BPC and y i , t BSS through the following inequalities:
N g BSS t T i I s i , g y i , t BSS ,
N g BPC t T i I s i , g y i , t BPC ,
N g a t T i I s i , g ( x i , t o + x i , t b + y i , t BPC ) ,
relating the integer variables N g BSS , N g BPC , and N g a to the binary variables that describe the usage of all batteries on aircraft, their unavailability, and their being recharged for all time slots in the simulation.
In addition, the total number of batteries can exceed or be lower than the number of aircraft only if at least one BSS is used. Therefore, an equation is needed that matches the number of airplanes N g a and the number of batteries N g b , taking into account the number of spare batteries that can be present when using BSSs:
M N g BSS N g b N g a M N g BSS ,
where M is a large, user-defined integer.

2.4.10. Global Energy Balance

The energy amount acquired from the grid in a time slot must correspond to the integral of the recharge power, so that
E t = l t i I P i , t B P C + P i , t B S S ,
where the sum is carried out on the number of active chargers.

2.4.11. Battery Energy Balance

A further constraining equation is represented by the energy balance for the i-th battery, yielding
S i , t = 1 x i , t o x i , t b S i , t 1 + η c l t P i , t B S S + P i , t B P C E g B + x i , t b S m i n ,
where η c is the efficiency of the recharging process.

2.5. Linearization

The problem described above is nonlinear due to the battery energy balance, Equation (37). The nonlinear character arises because the continuous variables S i , t , P i , t B S S , and P i , t B P C are multiplied by the combination of binary variables 1 x i , t o x i , t b . In order to cast the problem within a MILP setting, a series of actions is taken, obtaining a convenient linearization of the such balance.
First, considering Equations (19) and (20), P i , t B P C and P i , t B S S are set to zero if the battery is in use or unavailable. Therefore, there is no need to multiply them again for 1 x i , t o x i , t b . Hence, Equation (37) can be rewritten as
S i , t = 1 x i , t o x i , t b S i , t 1 + η c l t P i , t B P C + P i , t B S S E g B + x i , t b S m i n ,
which is still nonlinear. The next step is to reformulate the latter equation, at the price of increasing the total number of constraints. To do so, the first term in the right-hand side is substituted by an auxiliary variable q i , t such that
0 q i , t ( 1 x i , t o x i , t b ) S g m a x
and
q i , t S i , t 1 .
Hence, the new auxiliary variable is equal to S i , t 1 if the battery is available, and zero otherwise. Therefore, making use of q i , t , Equation (38) can be efficiently replaced by the combination of Equations (39) and (40) together with
S i , t = q i , t + η c l t P i , t B P C + P i , t B S S E g B + x i , t b S m i n .

2.6. Problem Statement

For the mathematical formalization of the problem described above, the optimization variables are represented by 15 arrays grouped in the global array x defined as
x = S i , t , P i , t B P C , P i , t B S S , E t , x i , t , x i , t b , x i , t o , y i , t BPC , y i , t BSS , z i , q i , t , N g b , N g BSS , N g BPC , N g a ,
and are detailed in Table 2. Through the derivations detailed in Section 2.3, it is seen that the cost function J depends on x . The problem statement is then
minimize x J ( x ) subject to Equations ( 10 , 15 20 , 23 29 , 31 36 , 39 41 ) ,
with the constraints holding t T , i I , and g G . Table 3 shows the ARES input parameters, while Table 4 lists the output data (in addition to the values of the optimization variables). The MILP problem was implemented in MATLAB® (MATLAB R2019b, 9.7, MathWorks, Natick, MA, USA) and solved using the GUROBI solver (Gurobi Optimizer, 9.1, Gurobi Optimization LLC, Beaverton, OR, USA).

3. Results

The methodology described above was tested on two case studies. The first concerns the reconfiguration of a GA aerodrome, the Milano–Bresso airport, home of an historical flying school. The second focuses on the the adaptation of a large regional hub, the Athens international airport, which currently hosts a massive traffic of turboprop flights.
The Milano–Bresso study addresses a case that is likely to be among the first to be implemented in the future, given the relative maturity of PE and HE technologies for smaller airplanes in the GA segment. The Athens study addresses a case of high interest on a longer time horizon, should the current research on the scalability of HE technologies allow to assume that large turboprop aircraft may be conveniently replaced by new, environmentally-friendly models carrying the same payload. Further results for the Athens case, involving different assumptions on some input parameters, are reported in [31].

3.1. Milano–Bresso Airport

The Milano–Bresso airport “Franco Bordoni-Bisleri” (ICAO code: LIMB), built in 1912, is located in the Milan metropolitan area, Italy. It features a 1080 m × 30 m asphalt runway and is the site of Aero Club Milano (ACM) since 1960. The ACM fleet, providing flying school, leisure flight and air taxi services, is currently composed of 21 aircraft, 20 of which are single-engine propeller-driven models. In the current analysis, it has been hypothesized to switch from the current aircraft models, mainly Cessna C172 (Cessna Aircraft Company, Wichita, KS, USA) and Piper PA-28 (Piper Aircraft, Inc., Vero Beach, FL, USA) four-seaters, to a homogeneous fleet of HE aircraft inspired by the Pipistrel Panthera Hybrid (Pipistrel Vertical Solutions, Ajdovščina, Slovenia). This four-seater is the HE version of the conventionally-powered Panthera, featuring a serial HE power-train. It is being created under the auspices of project MAHEPA and is currently in an advanced state of development, with the maiden flight expected in early 2021. The basic features of the aircraft and its battery pack are reported in Table 5. Among them, minimum battery life is provided for two reference values of the Depth Of Discharge (DOD). As for the aircraft cost, considering that it is not yet marketed, we assumed a value of 450,000, which appeared representative for a stock purchase. Although not used here, a possible approach to estimate such cost has been recently proposed in [32].
In order to analytically set up the sizing problem, the recharge power values p g B S S and p g B P C of the ground recharging devices have been defined at the nominal recharge power of the aircraft, i.e., 60 kW. Similarly, the maximum battery SOC, the recharge efficiency η c , and the unit cost c g B have been defined based on the data in Table 5. The unit cost of the recharging devices c g BSS and c g BPC has been fixed at 39.8 k€, with χ g BSS = χ g BPC = 0.1 (10% overhead for maintenance), based on Equation (5) for the considered recharge power [30].
The average electric energy price for the first quarter of 2018 in Italy was considered for the present analysis. The Italian electricity pricing is very complex and includes fixed, transport and system fees. Since 2007, the pricing scheme has been based on three time-dependent fares: F1–Peak, F2–Mid-level, and F3–Off-peak. The scheme is summarized in Figure 1, where the rows represent the days of the week and the columns the hours of the day. The electricity consumption is billed according to a different consumption charge depending on the time slot during which it is used. Therefore, the energy-related cost of electricity λ t changes according to the time of the day and day of the week. According to Figure 1, the three fares do not apply to Saturdays, when only F2 and F3 are adopted, and to Sundays, when only F3 is employed. Numerical values of λ t and c p for LIMB are reported in Table 6.
LIMB is open to Visual Flight Rules (VFR) traffic only, and operations take place from 08:00 local time to 30 min past sunset. Due to these reasons, the number of departures varies during the year. For the present sizing purposes, movements occurred in November 2017 have been considered, since it turned out that this is the most demanding month of the year. In fact, because of fewer daylight hours available, operations are packed in eight hours only and consequently the number of take-offs per hour increases. In addition, the number of flights increases during the weekend, since there are more people willing to fly in those days. The average hourly flight schedule in November 2017 is reported in Table 7. This schedule has been employed as the variable b g , t , which represents the number of departures in each time slot. We assumed that every flight takes one hour, as this is a typical value for ACM flight school activities. This schedule has been expanded by reducing the length of each time step l t to 15 min, in order to increase accuracy.
Initially, the ARES procedure was applied to the case of the Most Demanding Day (MDD) only, which is usually Saturday; subsequently, it has been extended to the entire week. The first case examined is restricted to the use of BPCs only, without the possibility to resort to BSSs. This is due to the fact that the Panthera Hybrid, in its present configuration, does not support battery swapping. Table 8 reports the main results of the sizing exercise: the number of recharges corresponds to the input provided by the flight schedule, while all other parameters represent outputs of the procedure. As seen in the left column reporting the values for the MDD in this case, two BPCs are needed. The number of aircraft to fulfil the flight schedule is 11 and it necessarily coincides with the number of batteries. The value of the cost function amounts to 596 for the MDD. This can be ameliorated if the optimizer is left free to choose the best combination of BPCs and BSSs. Indeed, by looking at the center column reporting the values for this enhanced case, a value for the cost function of 570 is achieved, with a saving of 4.3%. In this case, the optimizer provides a solution using two BSSs and, as a result, a different trade-off is obtained, where the number of aircraft necessary for fulfilling the flight schedule is lowered to 10, while the number of batteries is risen to 12, implying two spare batteries. Clearly, the additional cost of this added equipment is more than balanced by the need of one aircraft less in the fleet.
Table 8 also reports the values for the solution extended to the entire week that encompasses the MDD, again with the optimizer free to choose any combination of BPCs and BSSs. It is remarked that the number of aircraft necessary for fulfilling the flight schedule in both cases (39 and 136 flights) is ten, or half of the current fleet size. Also, the number of batteries and BSSs in both cases is the same. The average battery life is less than seven months in the MDD case, while it raises to 28 months when considering the entire week, a case in which battery usage is more evenly distributed. No difference is observed also with regard to the peak value of the electric power drawn from the grid. Looking at the value of the cost function, the MDD amounts to less than 15% of the entire week.
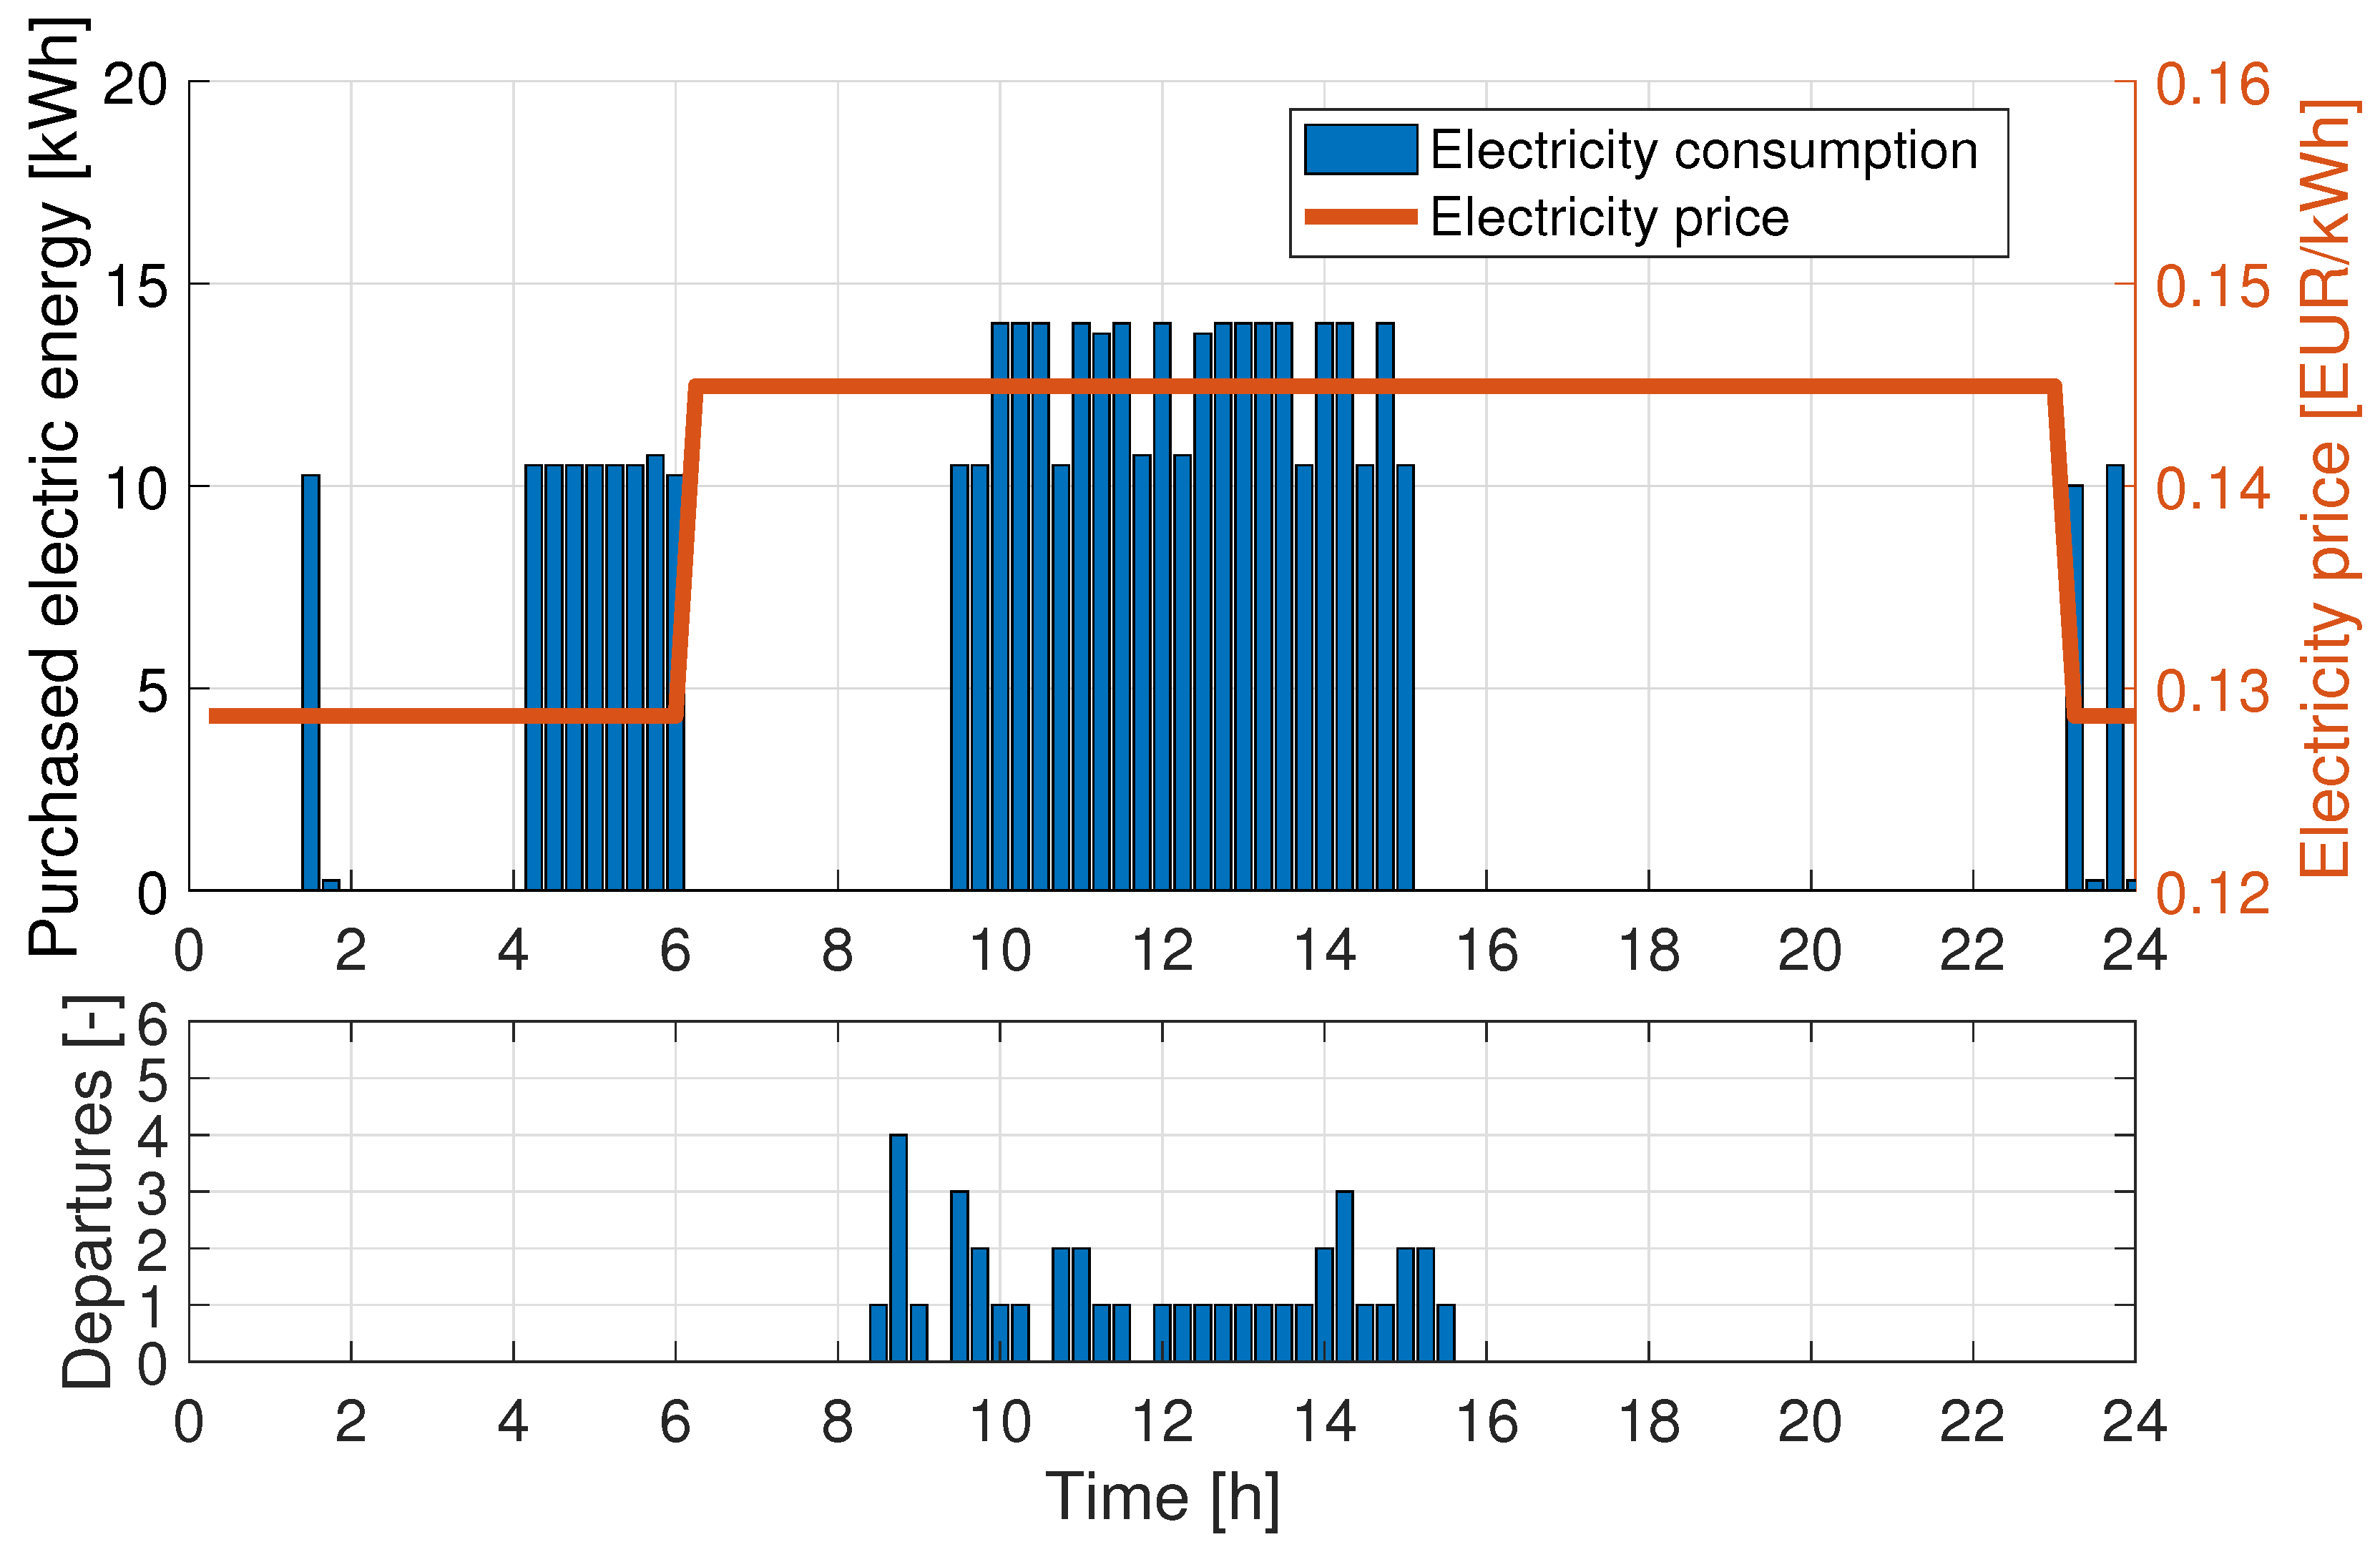
For the MDD case with BPCs only, the outcome in terms of the time history of electricity consumption E t is displayed in Figure 2. In the lower plot, bars show the daily flight schedule, in terms of departures every 15-minute time slot. In the upper plot, blue bars represent the purchased electric energy necessary to recharge the batteries for all time slots, while the orange line indicates the electricity price variation during the day. It is possible to note that night hours, when energy price is lower, are exploited to charge all the batteries before the first flight session begins at 08:30. The time scheduling of the battery charging during night hours, with an accumulation before the rise in electricity fare, is not specially meaningful, as any time slot may be chosen, provided that a single battery is charged within it. The first flights are performed until there are no more fully charged ones available, so that depleted ones are recharged during the day hours up to 15:00. Once the last charged battery is delivered, and no more flights are scheduled, depleted batteries are not recharged before the electricity price decreases again, to take advantage of night-time fares.
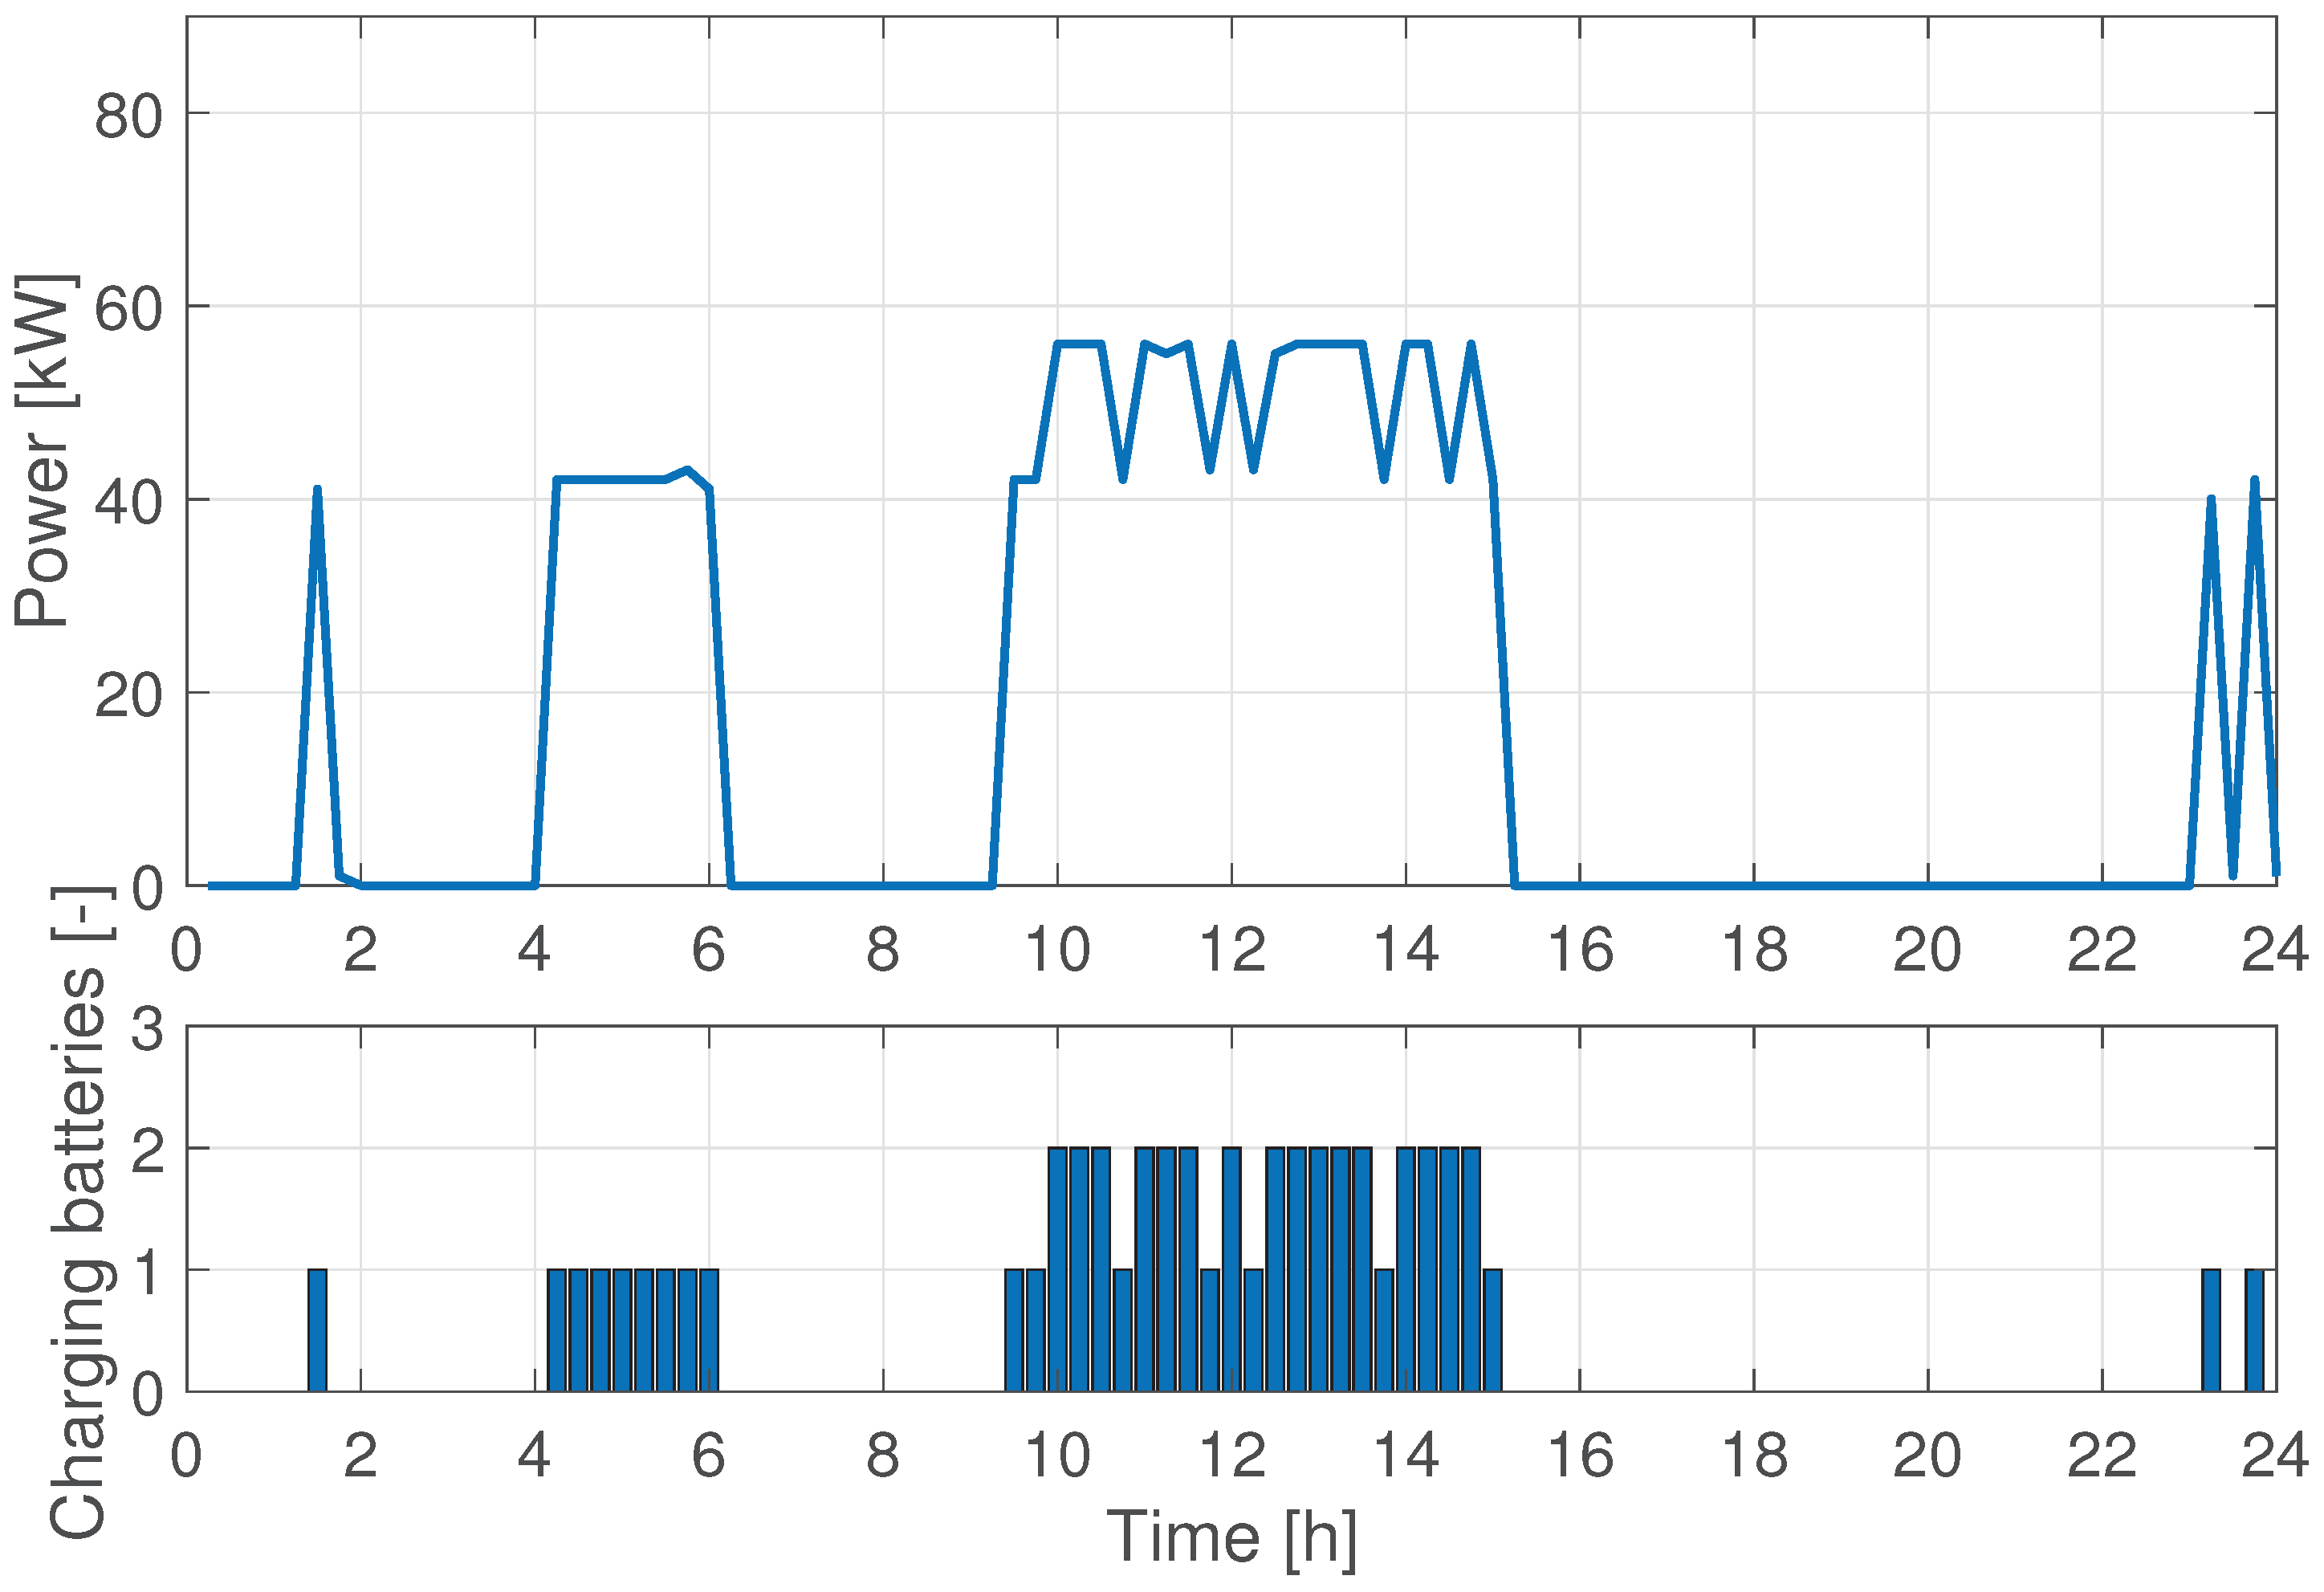
The power consumption for the same case is reported in the upper plot of Figure 3, while the lower plot displays the number of charging batteries at each time slot. As seen during daytime there are instances in which two batteries are recharged at the same time, although not at full power. The maximum requested power is clearly lower at night and peaks during the day. Finally, Figure 4 portrays the state of charge of the batteries S i , t throughout the day. Battery charging is a continuous process, with the restriction that a battery must be fully charged before the next one can be plugged in the same charger. The rows in the grid represent each battery, while the columns represent the 15-minute time slots. The cells are colored whenever the battery is plugged in a BPC (blue) or a BSS (green). The color is shaded to represent the SOC, with white corresponding to S i , t = 0 and full color with S i , t = 1 . It is seen that batteries are often fast-charged to fulfil the demand, taking a single time slot, and therefore being represented by single full-coloured squares. As seen, the solution provides three recharges for five batteries and four for six batteries in the MDD.
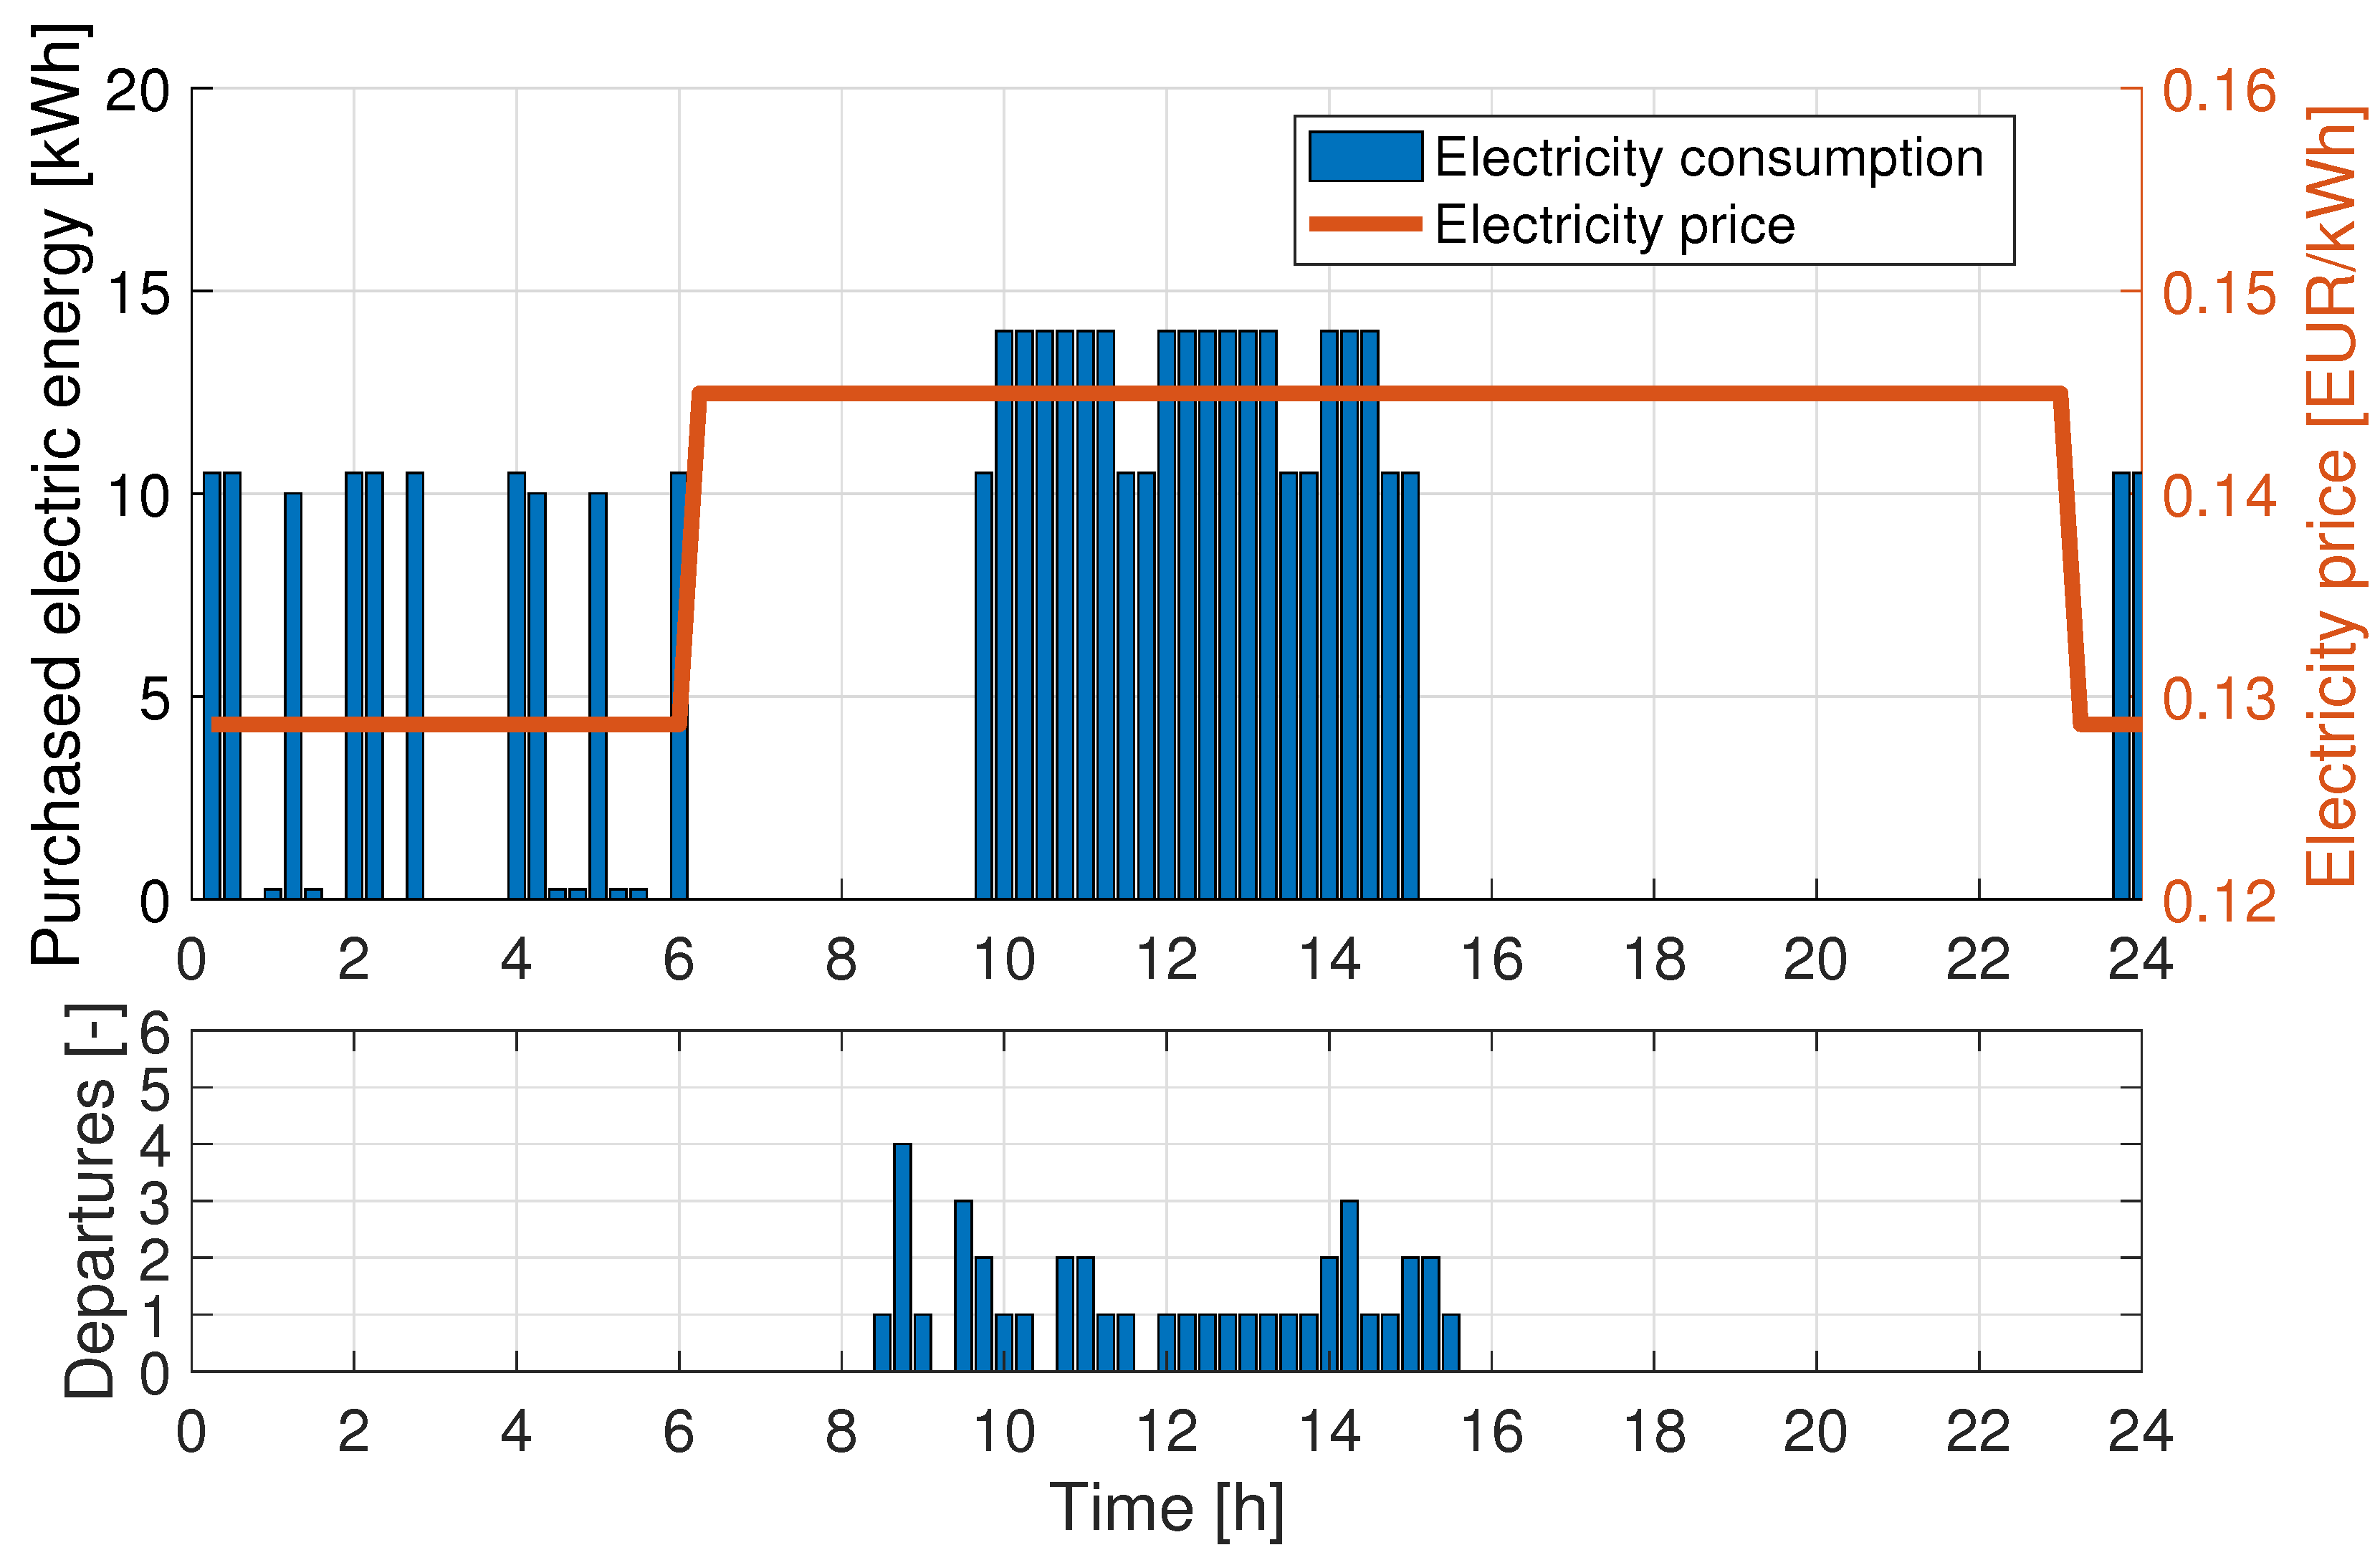
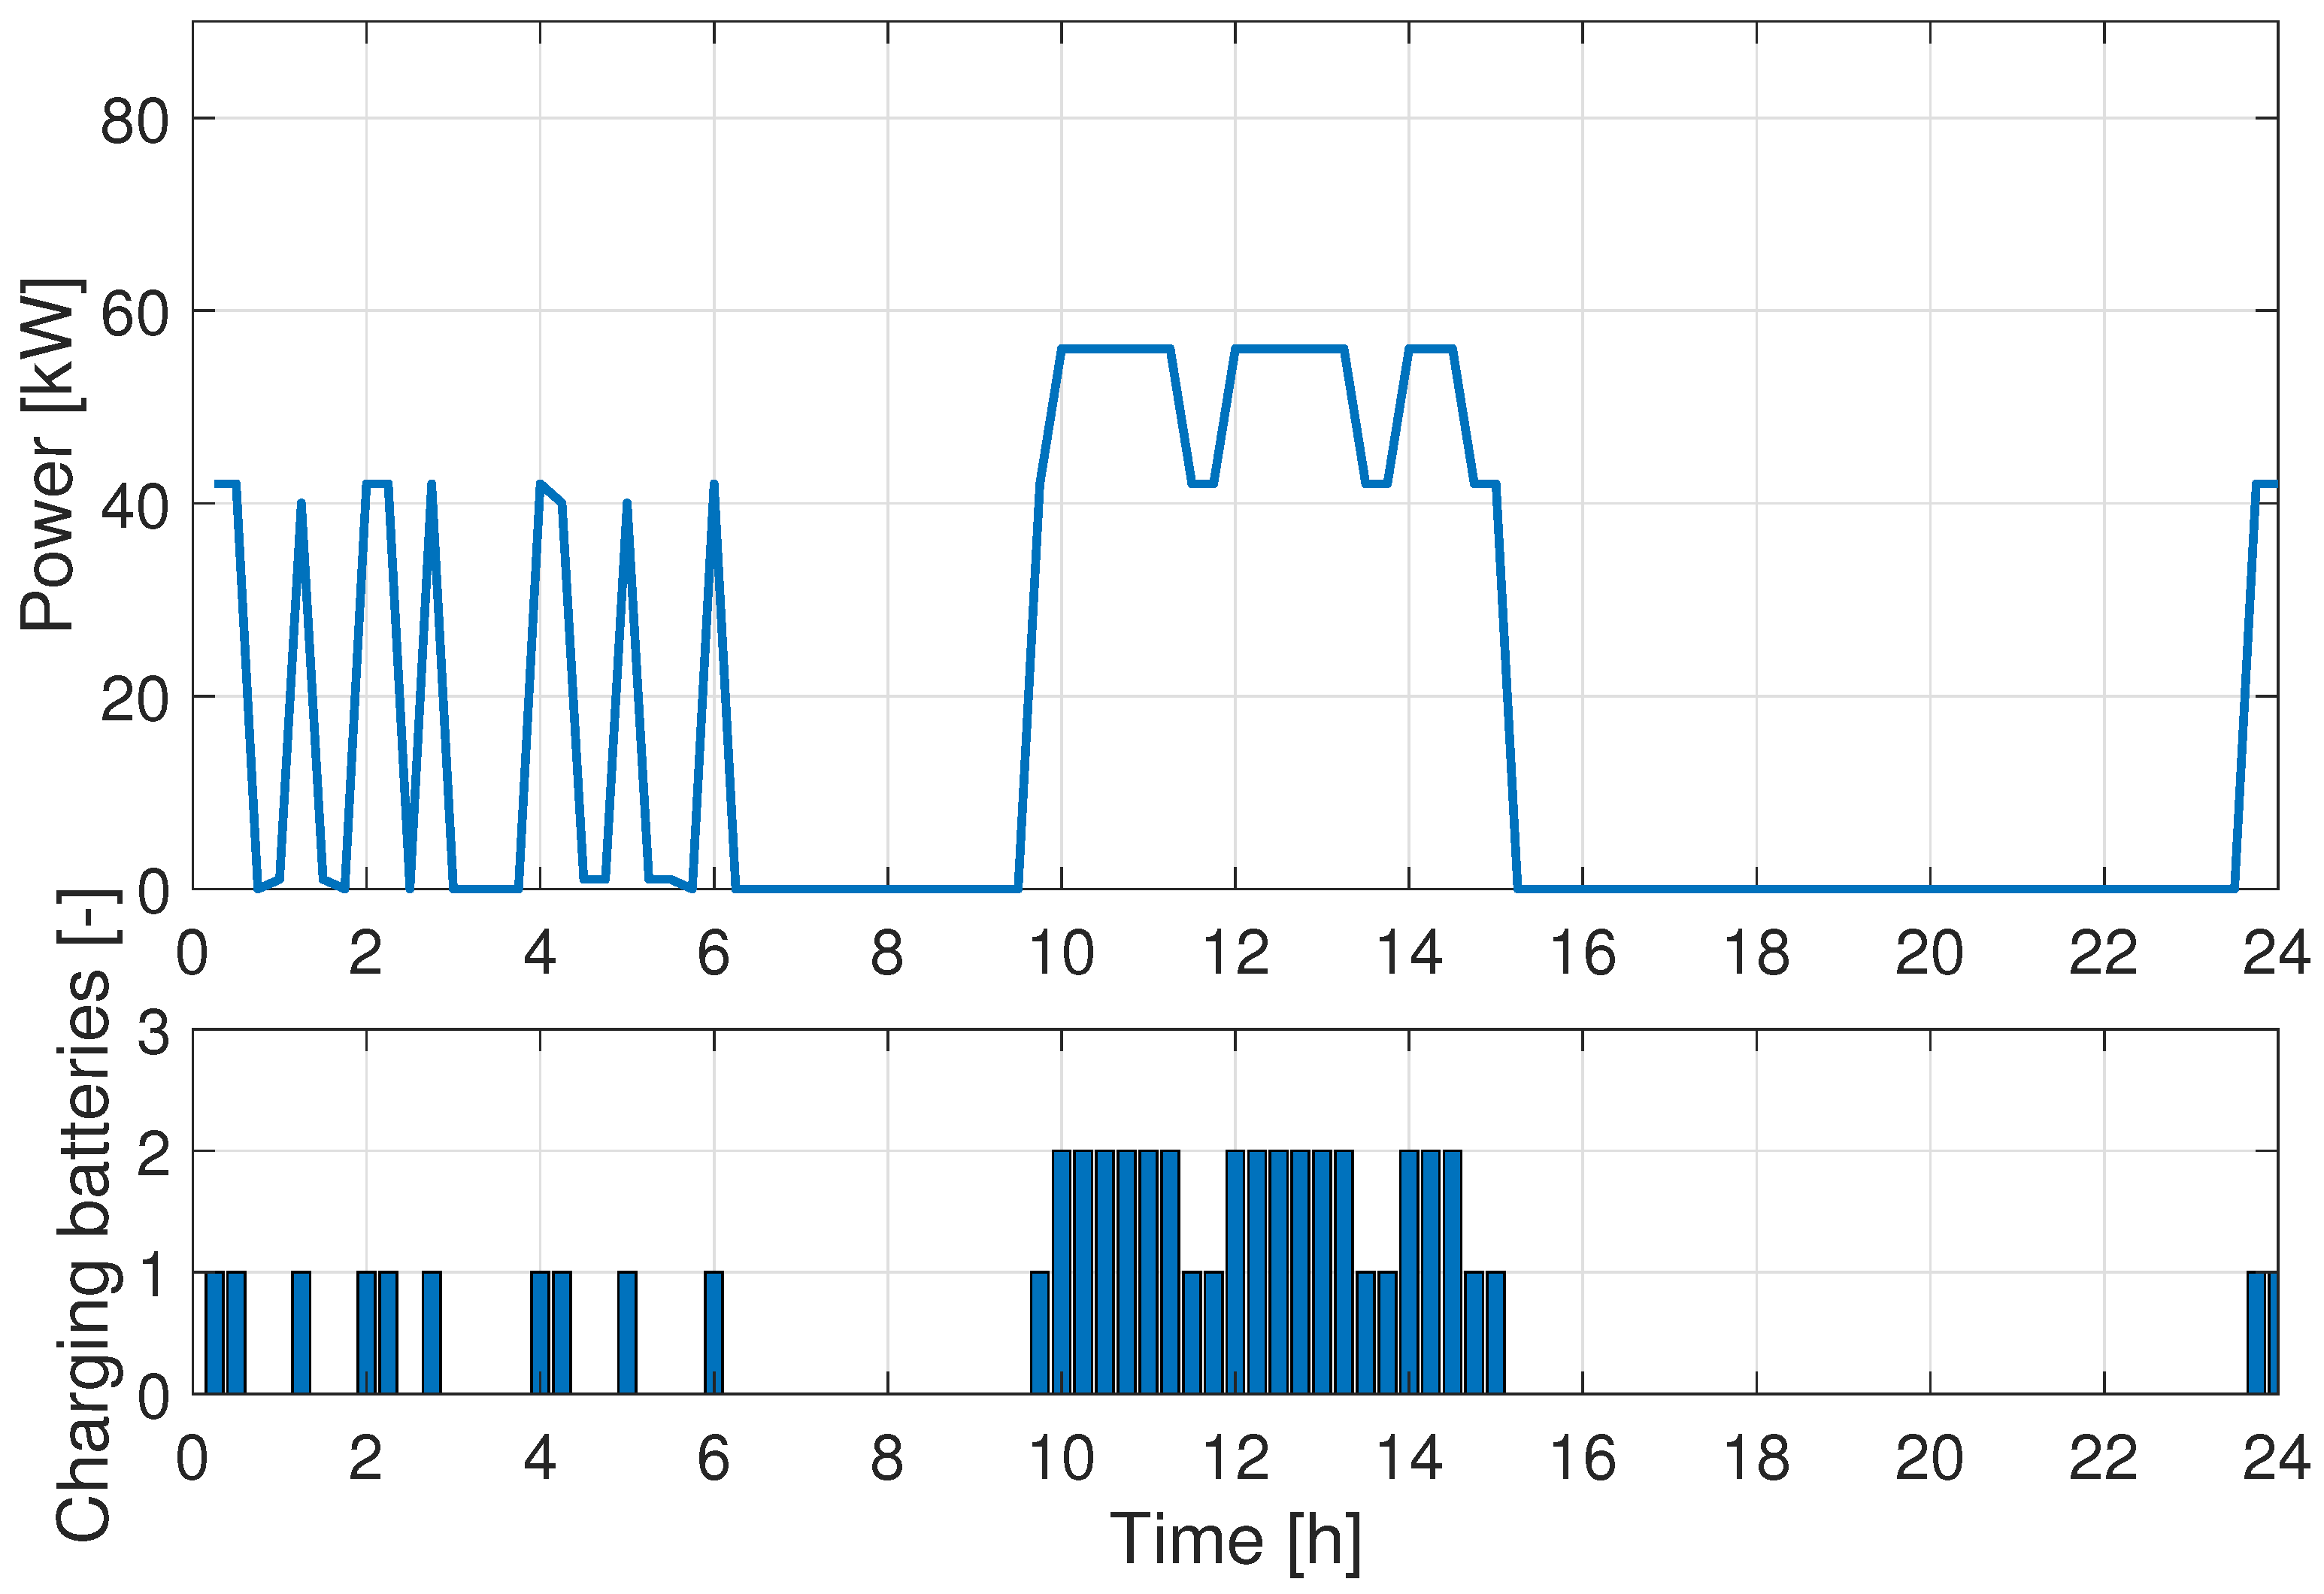
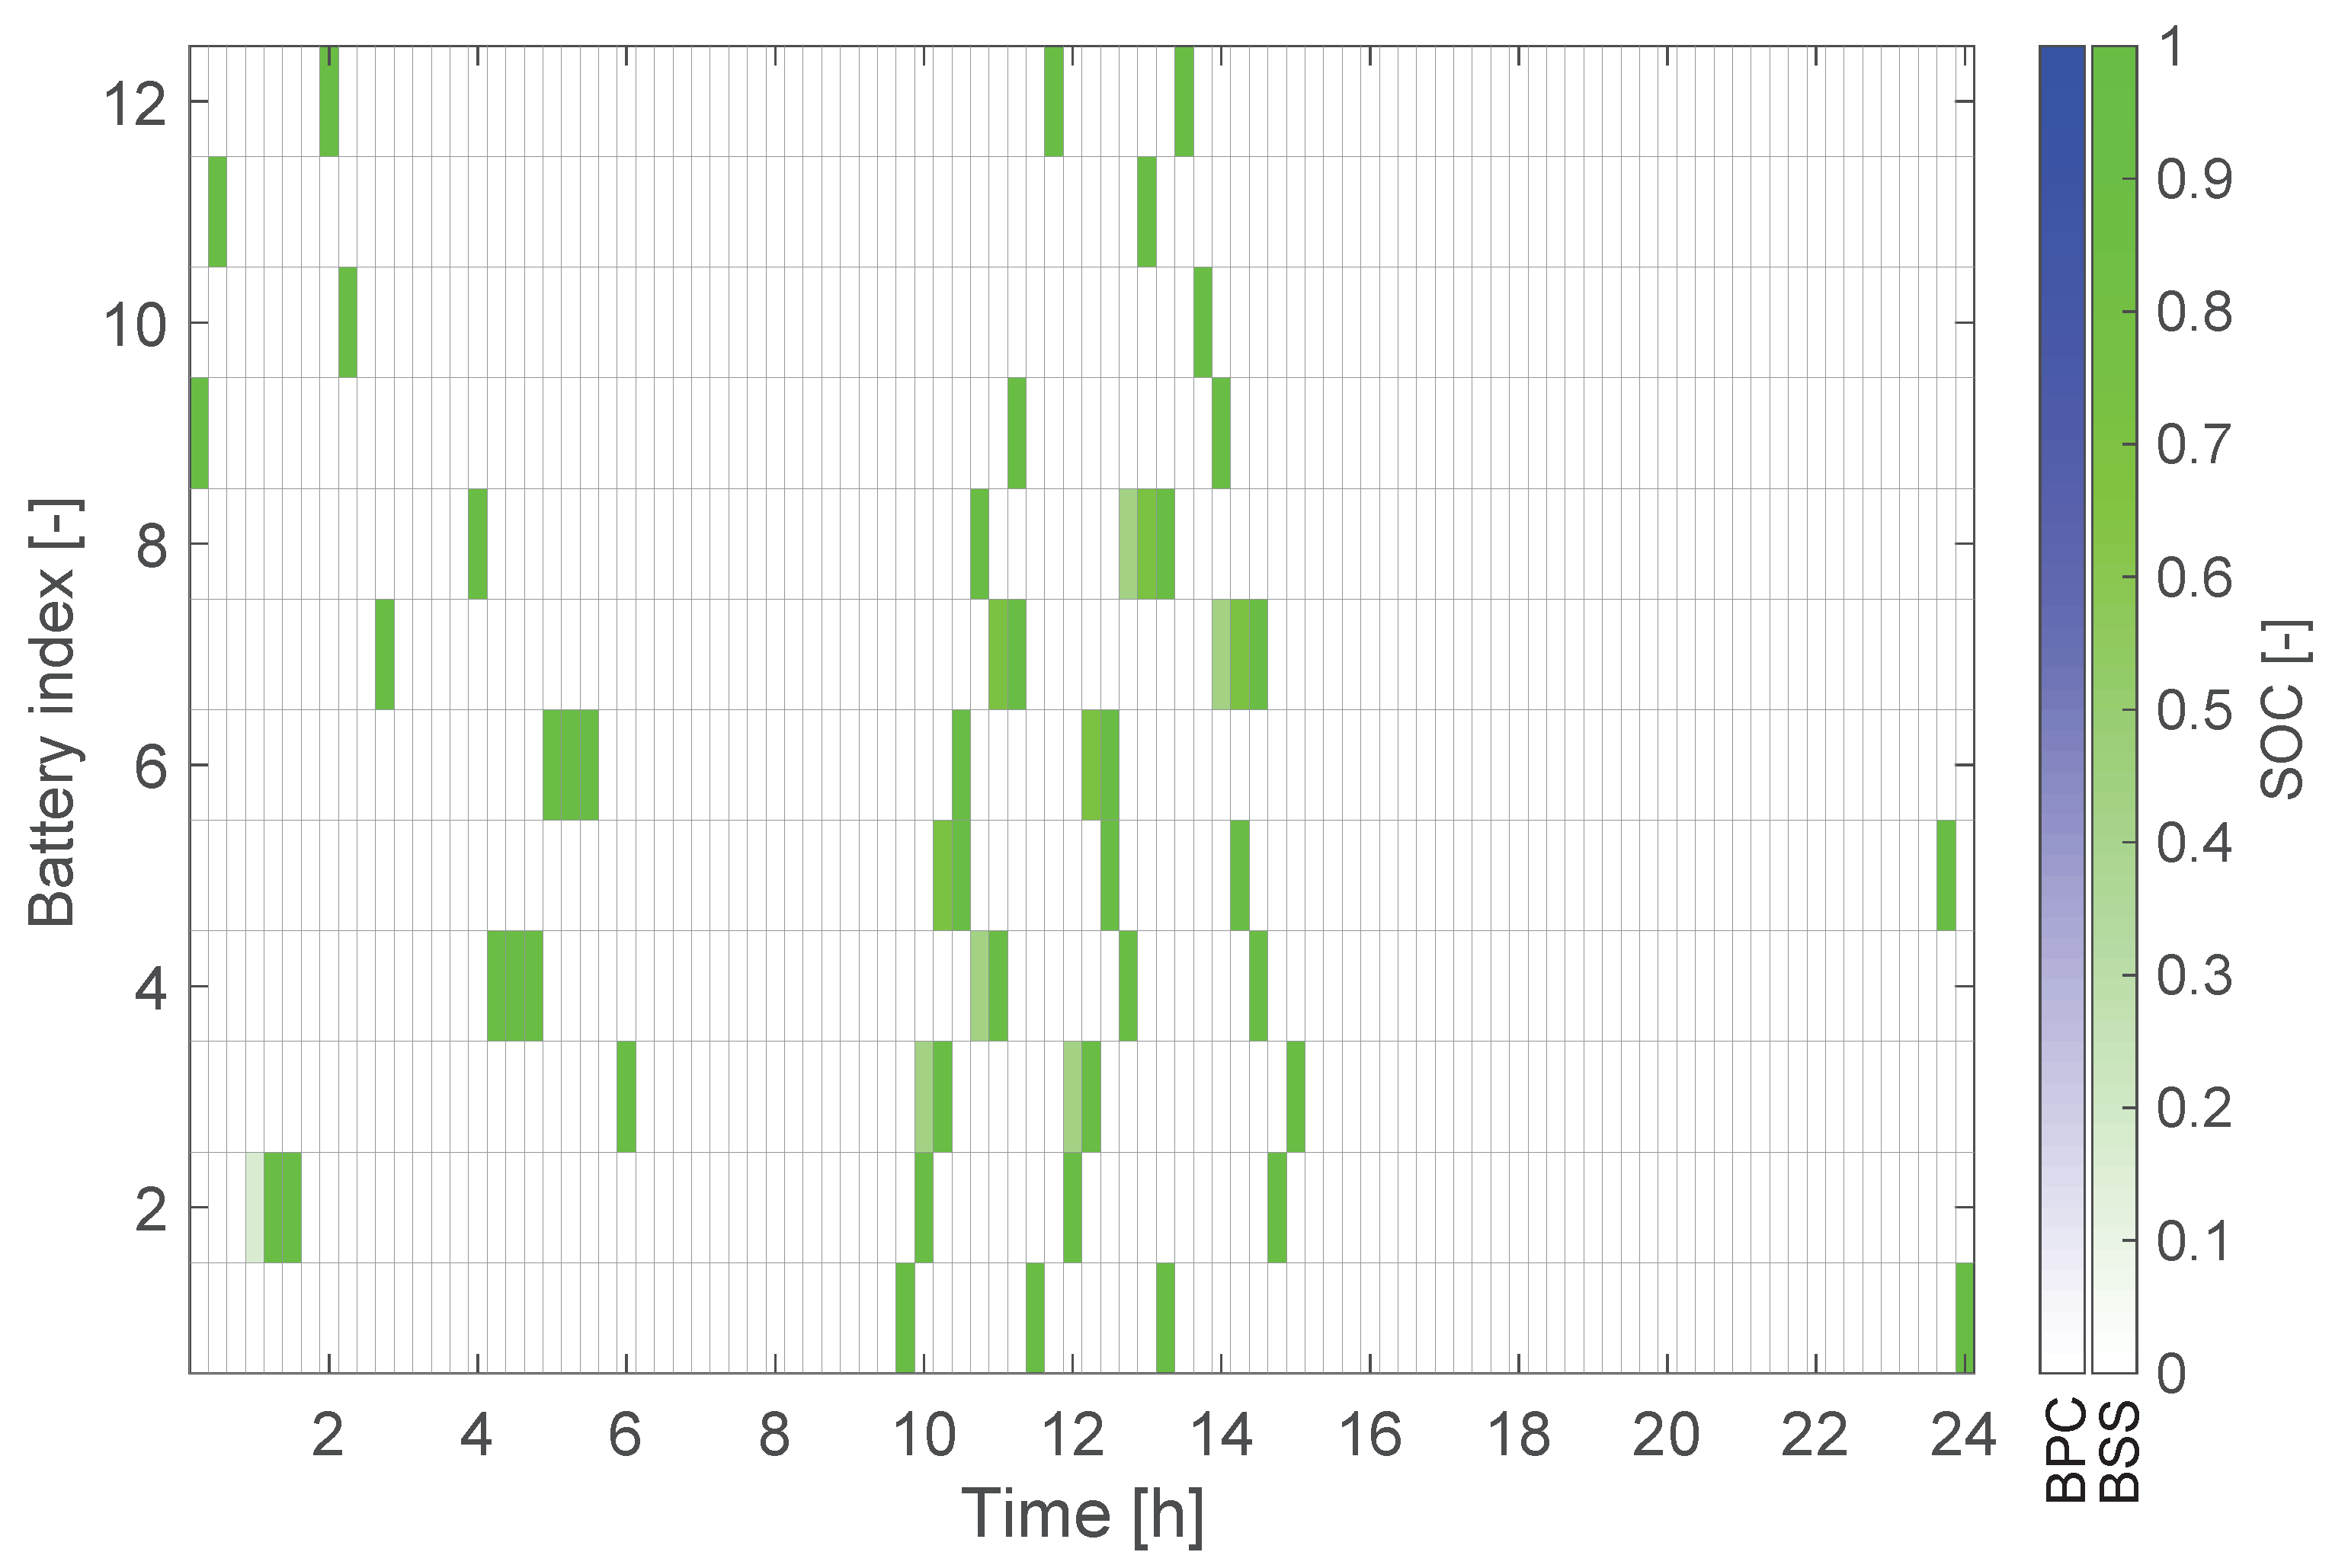
For the fully optimal MDD case, resulting in BSSs only, Figure 5 provides the time history of energy consumed and Figure 6 that of the power required. Again, the sparse pattern seen in the recharging schedule during night hours has no special value. The general behavior observed in both energy and power is similar to the case of using only BPCs, with some differences in the need to recharge two batteries at the same time (13 instances instead of 16 in the previous case). As seen in Figure 7, compared to the BPC-only solution, here batteries are more often fast-charged and the number of recharges varies from two for two batteries, to four for four batteries in the MDD. This lowers the cycles accumulated in the BSS solution, as seen in the values for the time to replace the batteries in Table 8.
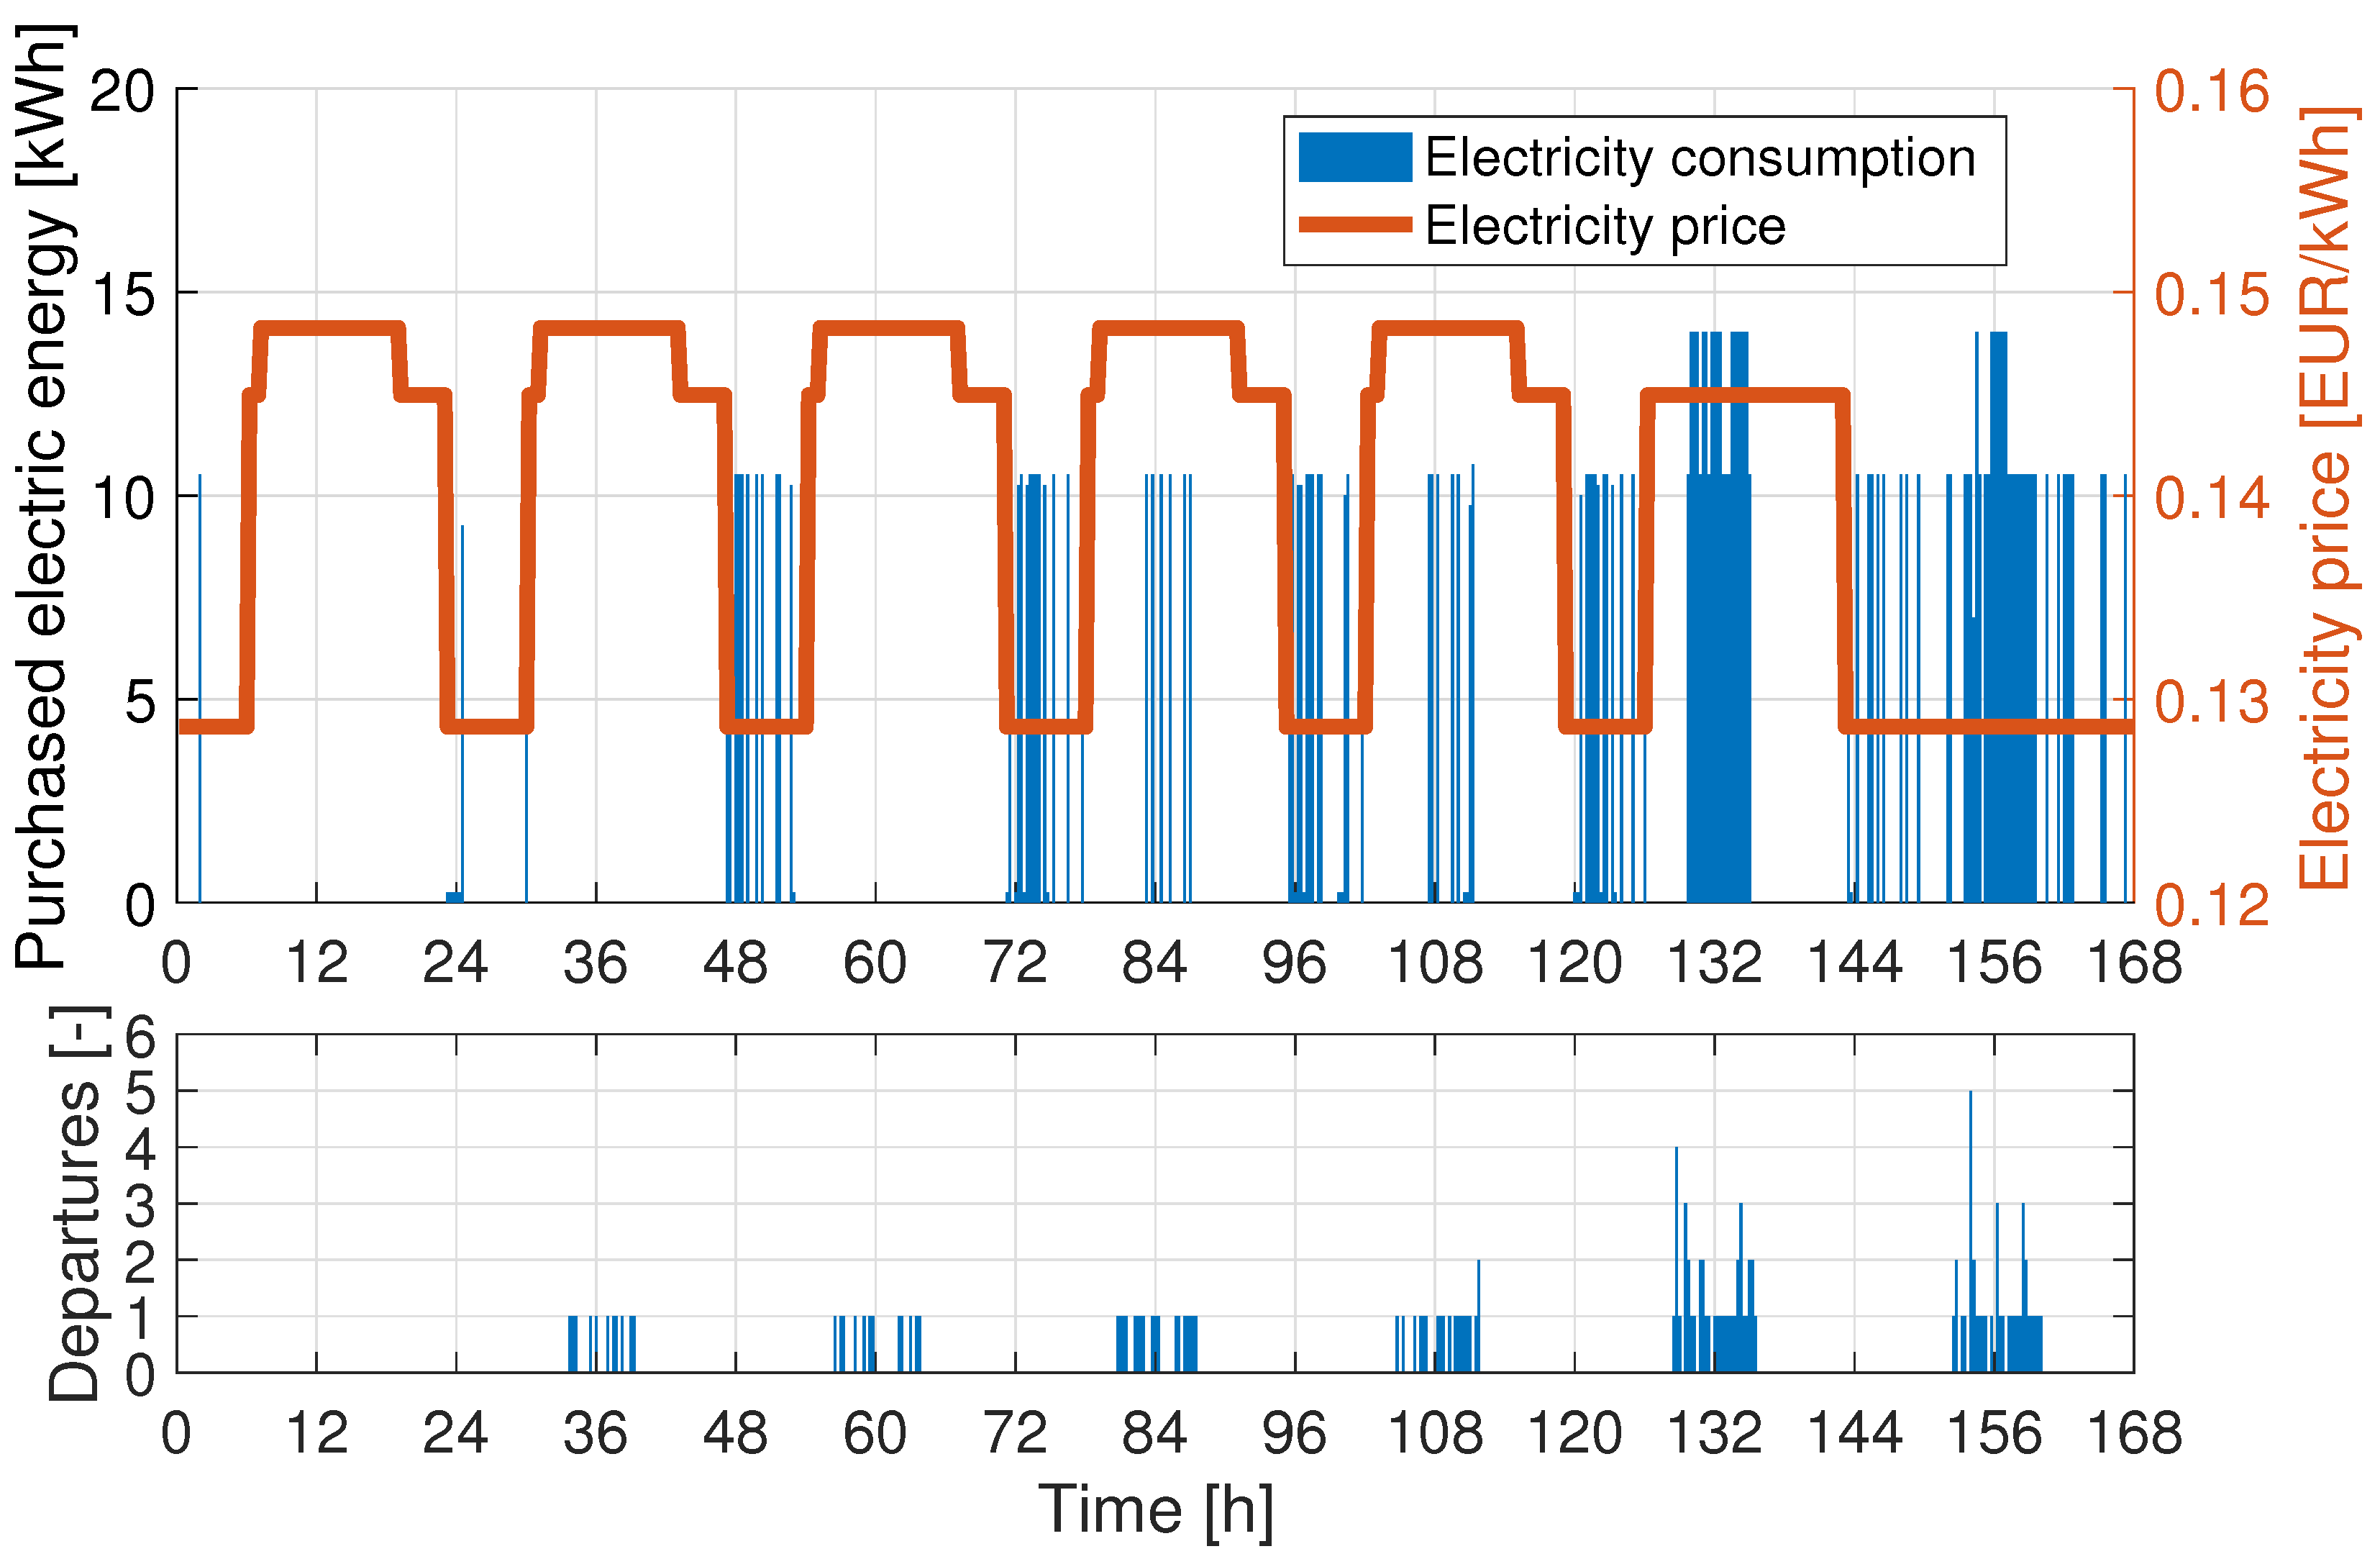
Taking the whole week into account, starting with Monday (from 0 to 24 h) and ending with Sunday (from 144 to 168 h), the results shown in Figure 8 and Figure 9 are obtained. No flights are scheduled on Monday, so almost nothing happens until Tuesday night when the batteries used during daytime hours are recharged. As seen, the batteries were charged during Sunday and Monday night. This strategy is repeated up to Thursday (from 48 to 72 h) when it becomes necessary to recharge the batteries also during the day. It clearly appears that Saturday is the most demanding day, for both energy consumption and required power, followed by Sunday, which features a widely different energy pricing and therefore allows recharging during daytime hours even if the battery is not used for a flight in that day.

3.2. Athens International Airport

Athens International Airport “Eleftherios Venizelos” (ICAO code: LGAV) is the primary airport that serves the city of Athens and the region of Attica, Greece. It is the country’s busiest airport, serving as the main hub of Aegean Airlines, the largest Greek airline by total number of passengers carried, as well as other Greek airlines. This has been selected for this study since it was the European airport with the largest number of propeller-driven regional aircraft movements in the years 2015–2019 [33]. In particular, regional flights in LGAV are still operated by turboprop aircraft, connecting the numerous Greek islands to the mainland. As propeller-driven regional liners appear interesting for the future implementation of environmentally-friendly HE models for short-haul transportation services, the LGAV study may be used to provide useful information for such an operational scenario.
The main regional airplanes operating at LGAV are the Bombardier Dash 8 Q400 (shortened as DH8 in the following), the ATR42, and the ATR72. These aircraft can carry 78, 48, and 70 passengers, respectively. In order to carry out a realistic analysis, we assumed to replace the current conventionally-powered fleet with new models featuring a serial HE power-train, such as those considered in the MAHEPA project. The sizing of the aircraft, including that of their propulsion systems, has been carried out through HYPERION, a preliminary sizing tool dedicated to PE and HE fixed-wing aircraft developed at the Department of Aerospace Science and Technology, Politecnico di Milano [9,10]. In order to obtain such sizing, it is necessary to define a specialized mission profile in which all flight operations below a defined Hybrid-Electric Transition Altitude (HETA) are performed in a zero-emission PE mode. This includes taxi-out, take-off, initial climb, final descent, approach, landing, and taxi-in. Possibly loiter may be included as well. Above the HETA, the fuel-burning PGS is turned on, for providing energy during the rest of the flight phases, as well as for recharging the batteries, if needed. This strategy allows to drastically reduce chemical and noise emissions in the vicinity of the origin and destination airports and of the related overflown communities, and is considered an important advantage provided by serial HE power-trains. For the present analysis, the HETA was set to 3000 ft.
The technical specifications of the electric-powered airplane design solutions are the result of a clean-sheet conceptual design loop starting from mission and certification requirements (i.e., they do not correspond to any ‘retrofit’ of existing models). For the sake of clarity, the serial HE airplanes sized through HYPERION are named as the mission performance corresponding model by adding an “HE-” prefix. The resulting battery capacity for each design solution is summarised in Table 9 together with the assumed corresponding budgetary price (including cells and battery pack), computed using 2018 Lithium-ion battery price values, i.e., approximately 176 €/kWh [34]. The assumed charging/discharging efficiency and battery life values are the same as seen in Table 5. The selected chargers maximum power has been raised to make a complete charge possible in a reasonable amount of time, given the sizeable increase in battery capacity with respect to the Milano–Bresso fleet. In particular, 200 kW and 400 kW rated power values for both BSS and BPC chargers were considered.
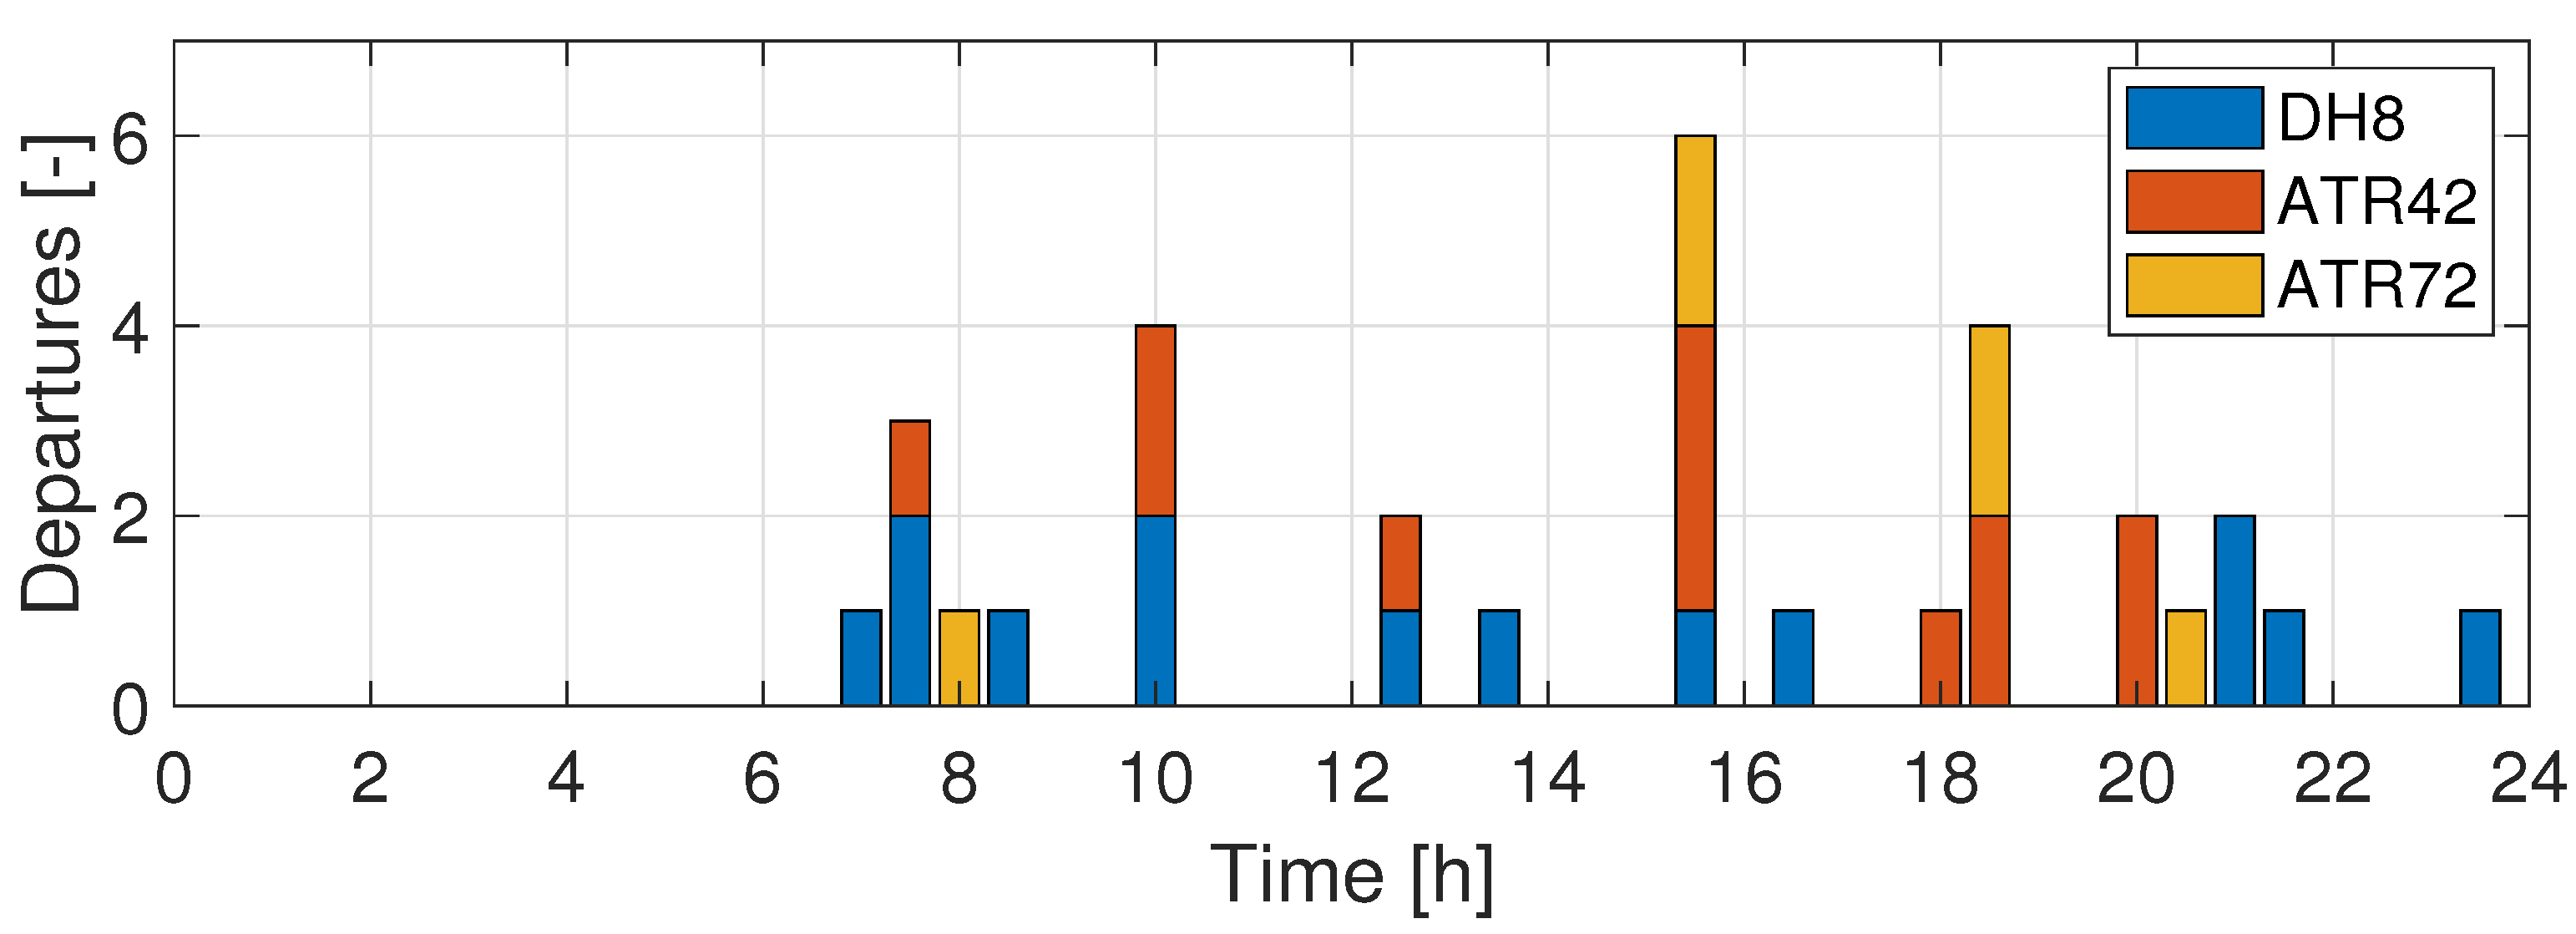
In contrast to the Milano-Bresso study, complete departure/arrival data for the full year could not be retrieved for Athens International Airport. Therefore, an average daily flight schedule for the selected airplanes was estimated using public data (the information retrieved on the Flight Radar 24 Live Air Traffic website was used [35]). While not sufficient to insure the capability to operate in the MDD, this preliminary investigation provides an illustration of the methodology and its potential in dealing with larger and more diverse case studies. During a typical day, there are approximately 30 departures that are relevant to the present analysis: 14 flights are performed with the DH8, 12 with the ATR42, and 6 with the ATR72. The flights are distributed during the day as reported in Figure 10. The length l t has been set to 30 min in this case. No operations take place before 06:00 local time. We assumed that every aircraft performs a flight to another airport and comes back in three hours. Electricity prices in Greece for the year 2018 were assumed, as reported in Table 10. Unlike the Italian case, the energy and power components both depend on the time of the day, being set at different values for Daytime (weekdays, from 07:00 to 23:00) and Nighttime (weekdays, from 23:00 to 07:00, and weekends).
The results of the ARES procedure applied to the cases of 200 kW and 400 kW chargers are shown in Table 11 in a similar fashion to Table 8, here augmented by the detail of the different aircraft and battery types. It is observed that, when using 200 kW chargers, the number of aircraft necessary to fulfil the 32-flight schedule is 14, with six HE-DH8, six HE-ATR42, and four HE-ATR72. A mix of eight BSSs and six BPCs is needed to recharge a total of 24 batteries, i.e., ten more than the number of aircraft, to be swapped. The value of the cost function amounts to 44,908. When switching to 400 kW chargers, some important changes in the solution can be remarked. While the total cost is reduced by 1.43% and the necessary fleet is unchanged, the number of batteries is lowered to 21 (only seven spare) and the number of chargers to five BSSs and five BPCs. We note that the expected battery life is worsened, from one year and eight months to one year and six months, due to more frequent recharge cycles and that–for the same amount of energy drawn from the grid–the energy cost is slightly lower, meaning that less charging is necessary during daytime as a result of the quicker recharge allowed by the higher power rating of the chargers. On the other hand, power cost is increased, hinting to a higher power drain on average.
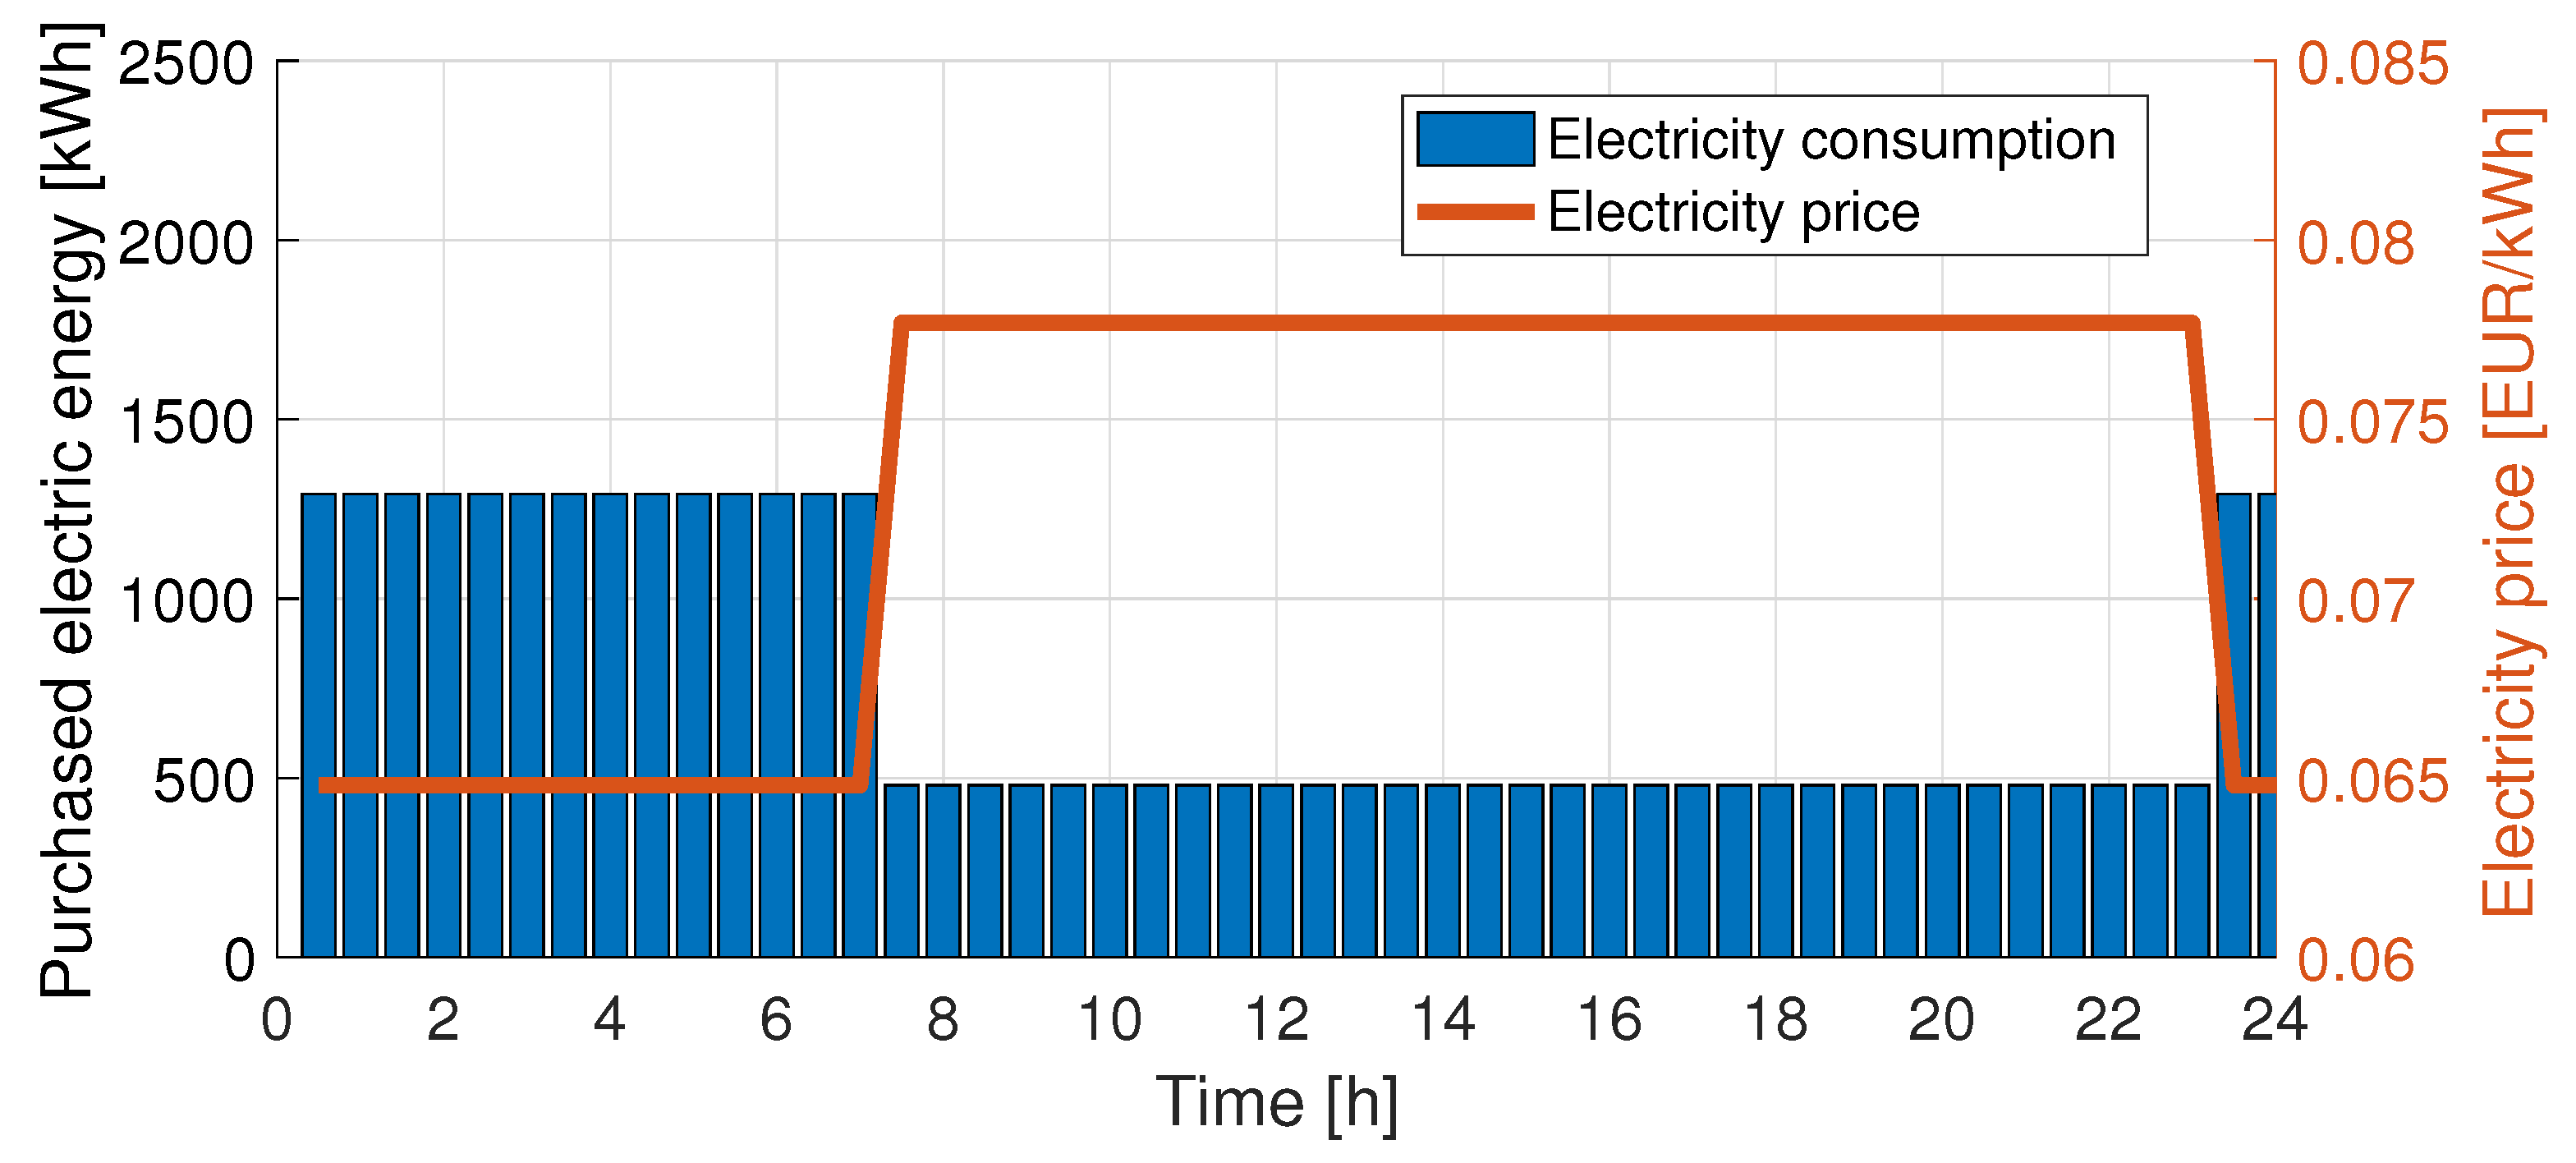
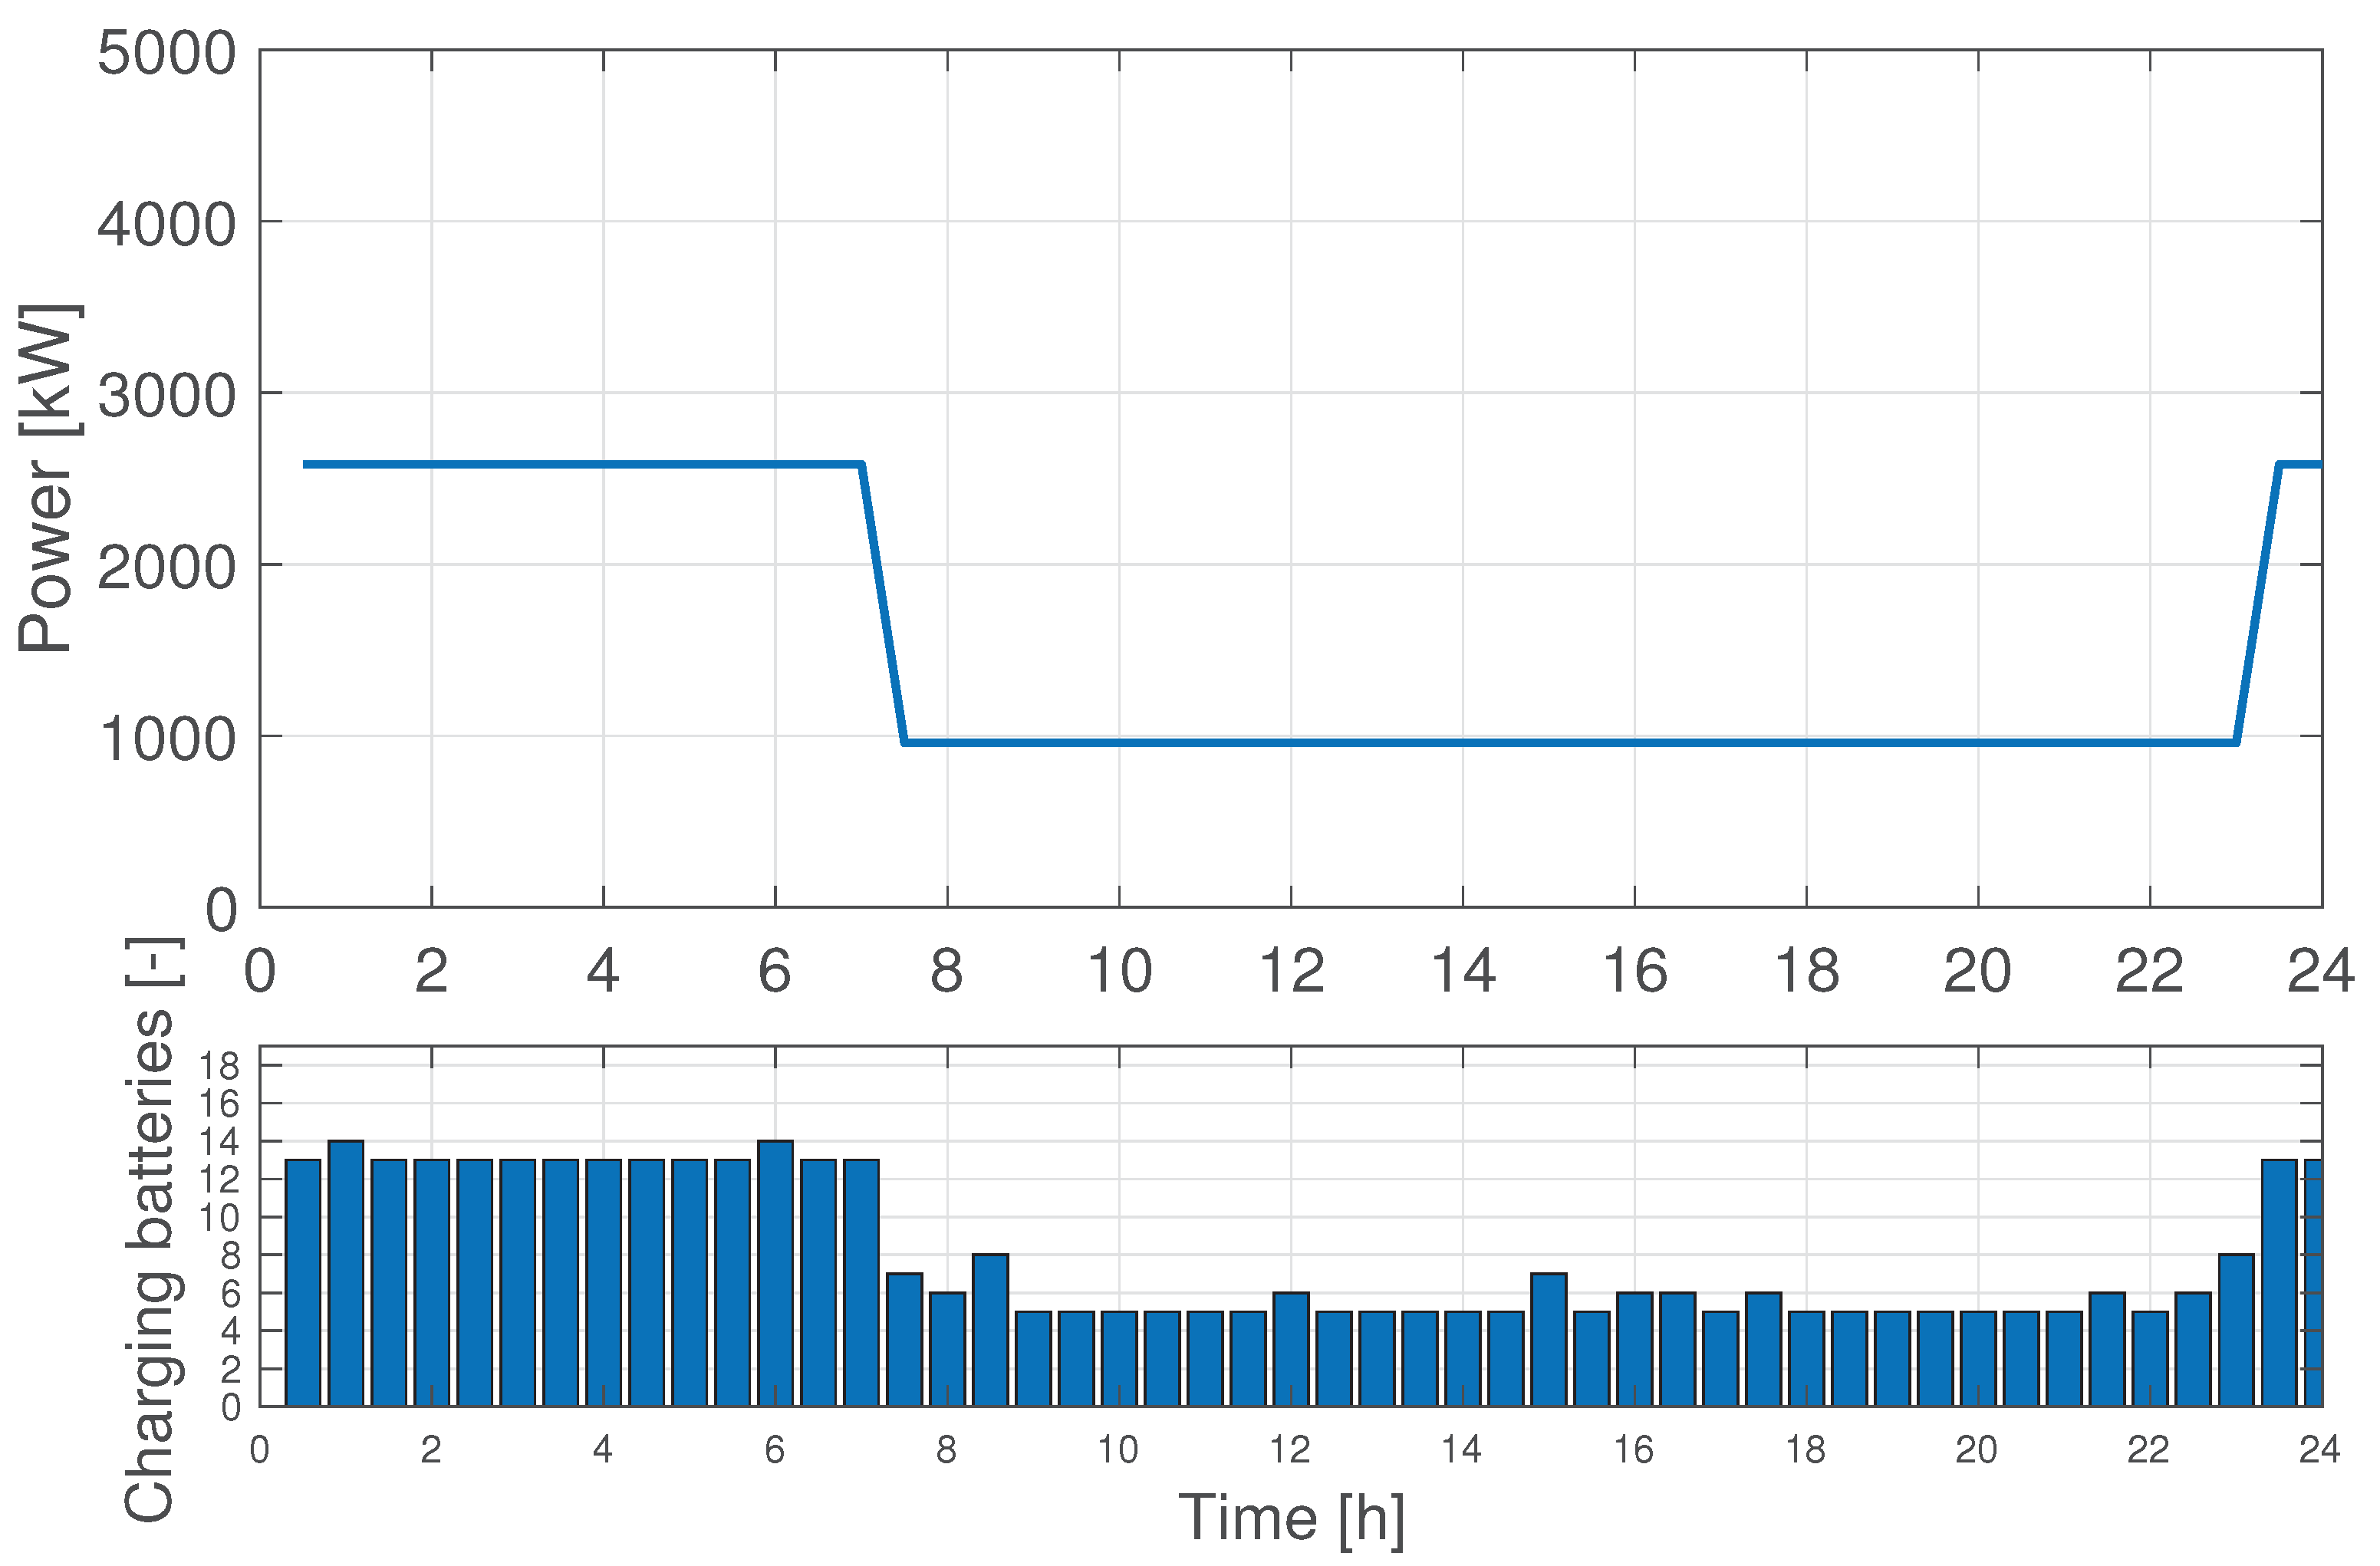
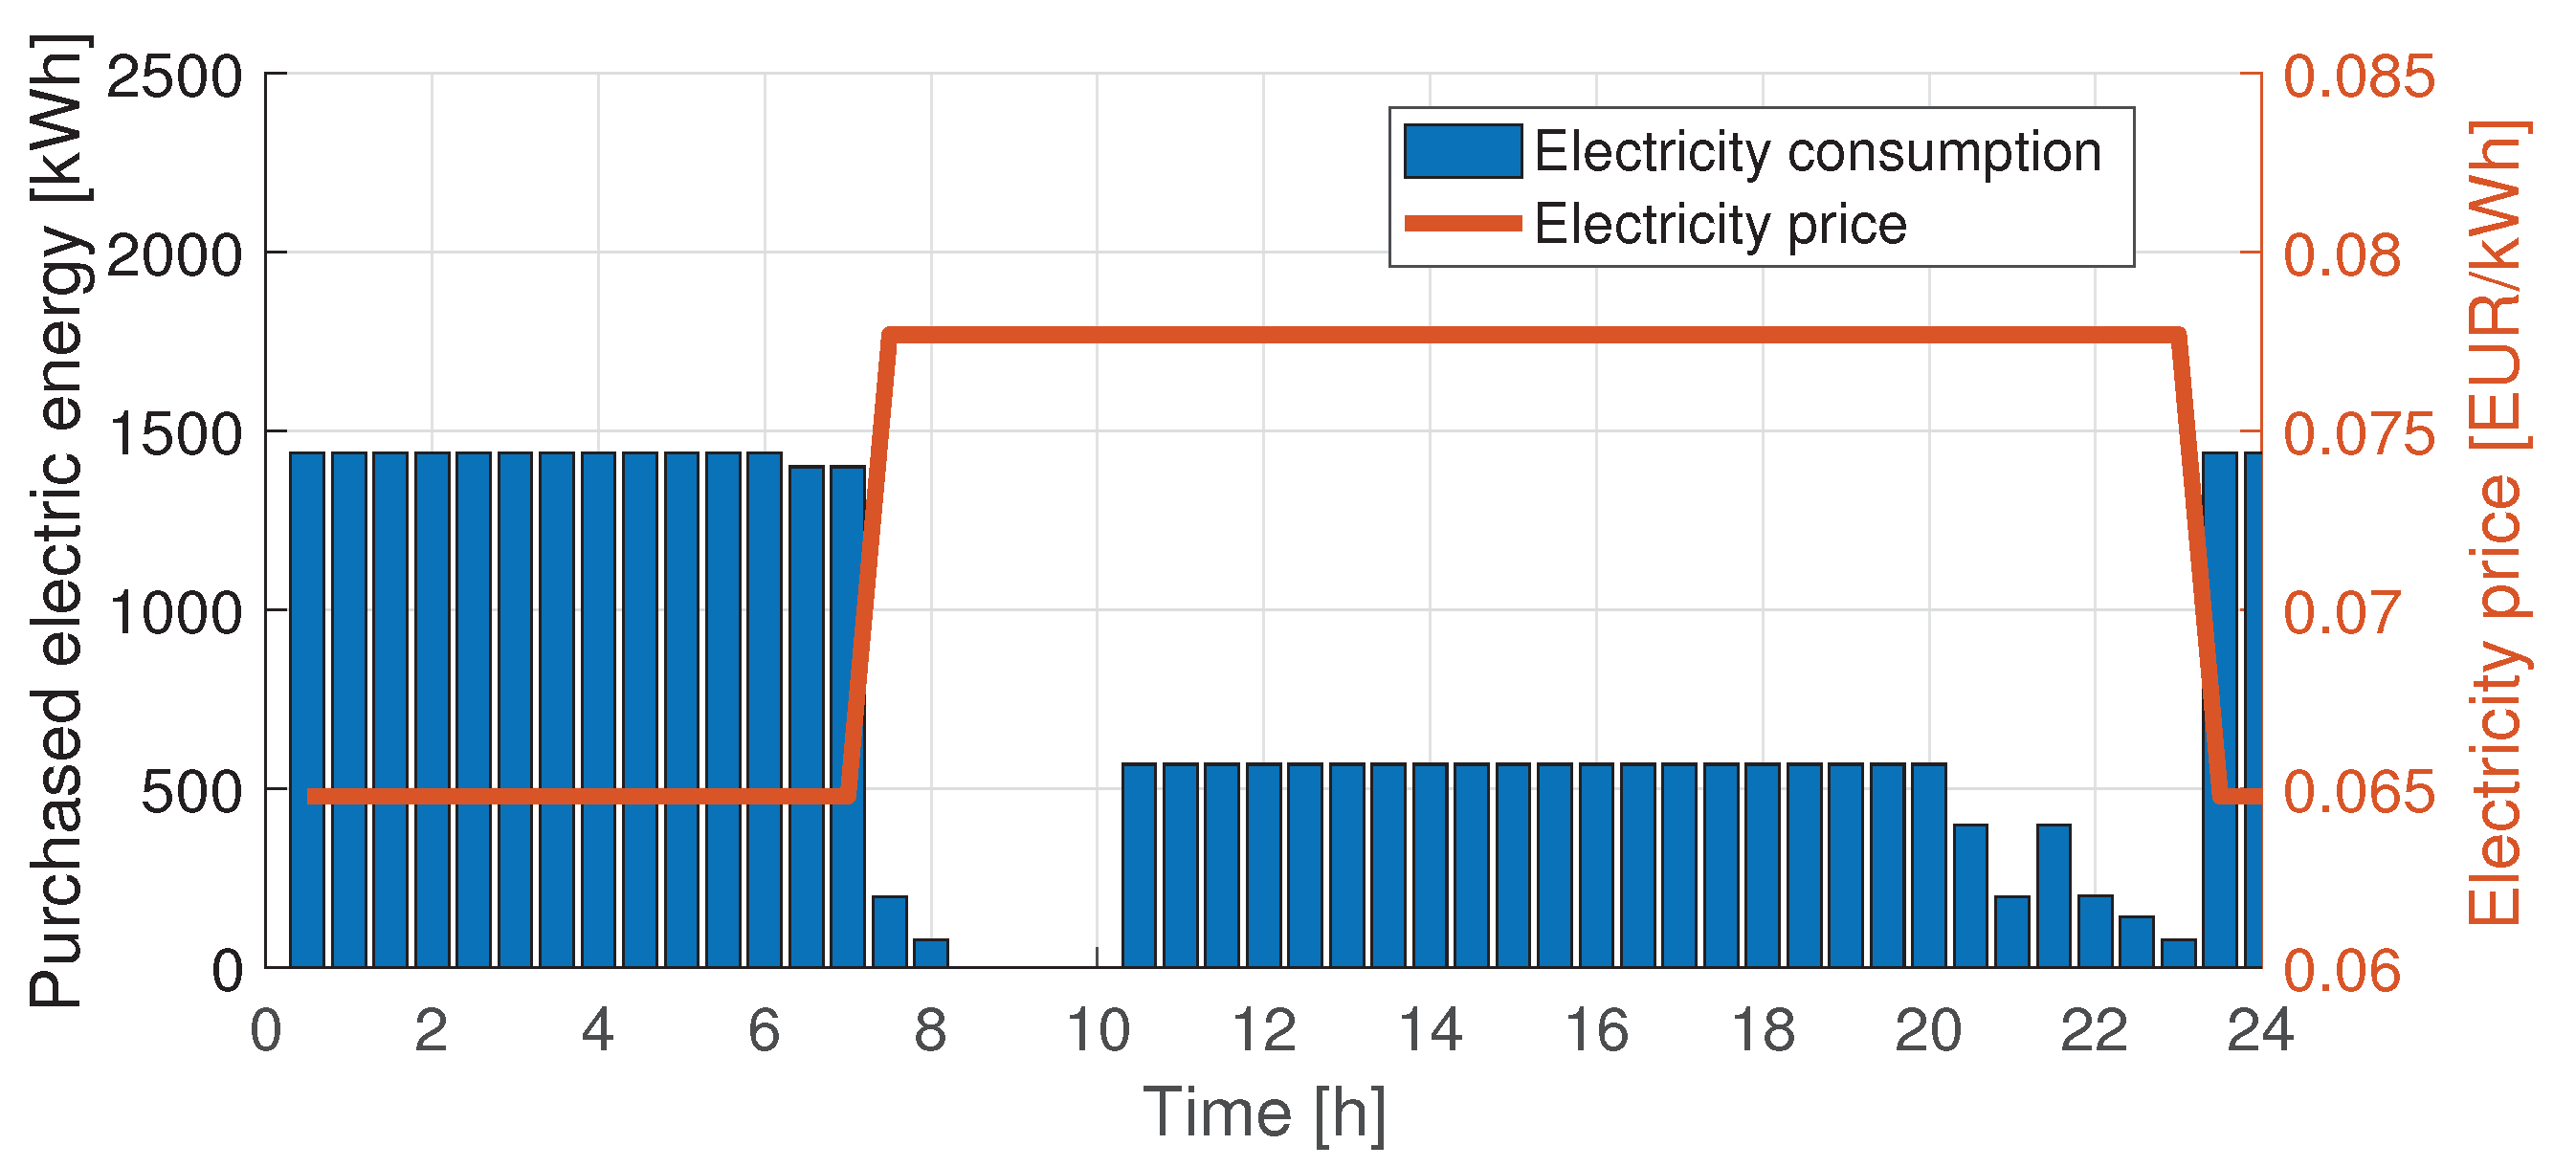
Figure 11 provides the time history of energy consumption considering 200 kW chargers. As apparent the solution provides constant nighttime and constant daytime energy drains, clearly with a much larger value for night hours when the energy and power pricing is lower. Figure 12 depicts the corresponding power consumption in the upper plot and the battery charging scheduling in the lower plot. Batteries are recharged continuously during the 24 h, from a minimum of five to a maximum of fourteen simultaneously engaged. Notwithstanding the constant power required from the grid in the two time partitions, there are small variations in the number of batteries being simultaneously charged. This is due to the tuning of the power at with each battery is recharged and is clearly visible in Figure 13 reporting the battery state of charge S i , t throughout the day. In the figure, batteries from 1 to 10 are for the HE-DH8, from 11 to 19 for the HE-ATR42, and from 20 to 24 for the HE-ATR72. Compared to the Panthera Hybrid case, the amount of energy stored in each battery is so high that even with the a nominal charger power higher than three times the minimum time to fully recharge a battery ranges from five hours for the HE-ATR42 to seven hours for the HE-DH8. By looking at the colored patterns, it is observed that in some cases, a battery of the HE-DH8 type may take up to 15 h to recharge completely, at a reduced power setting, which is more than double the duration necessary at 200 kW power.
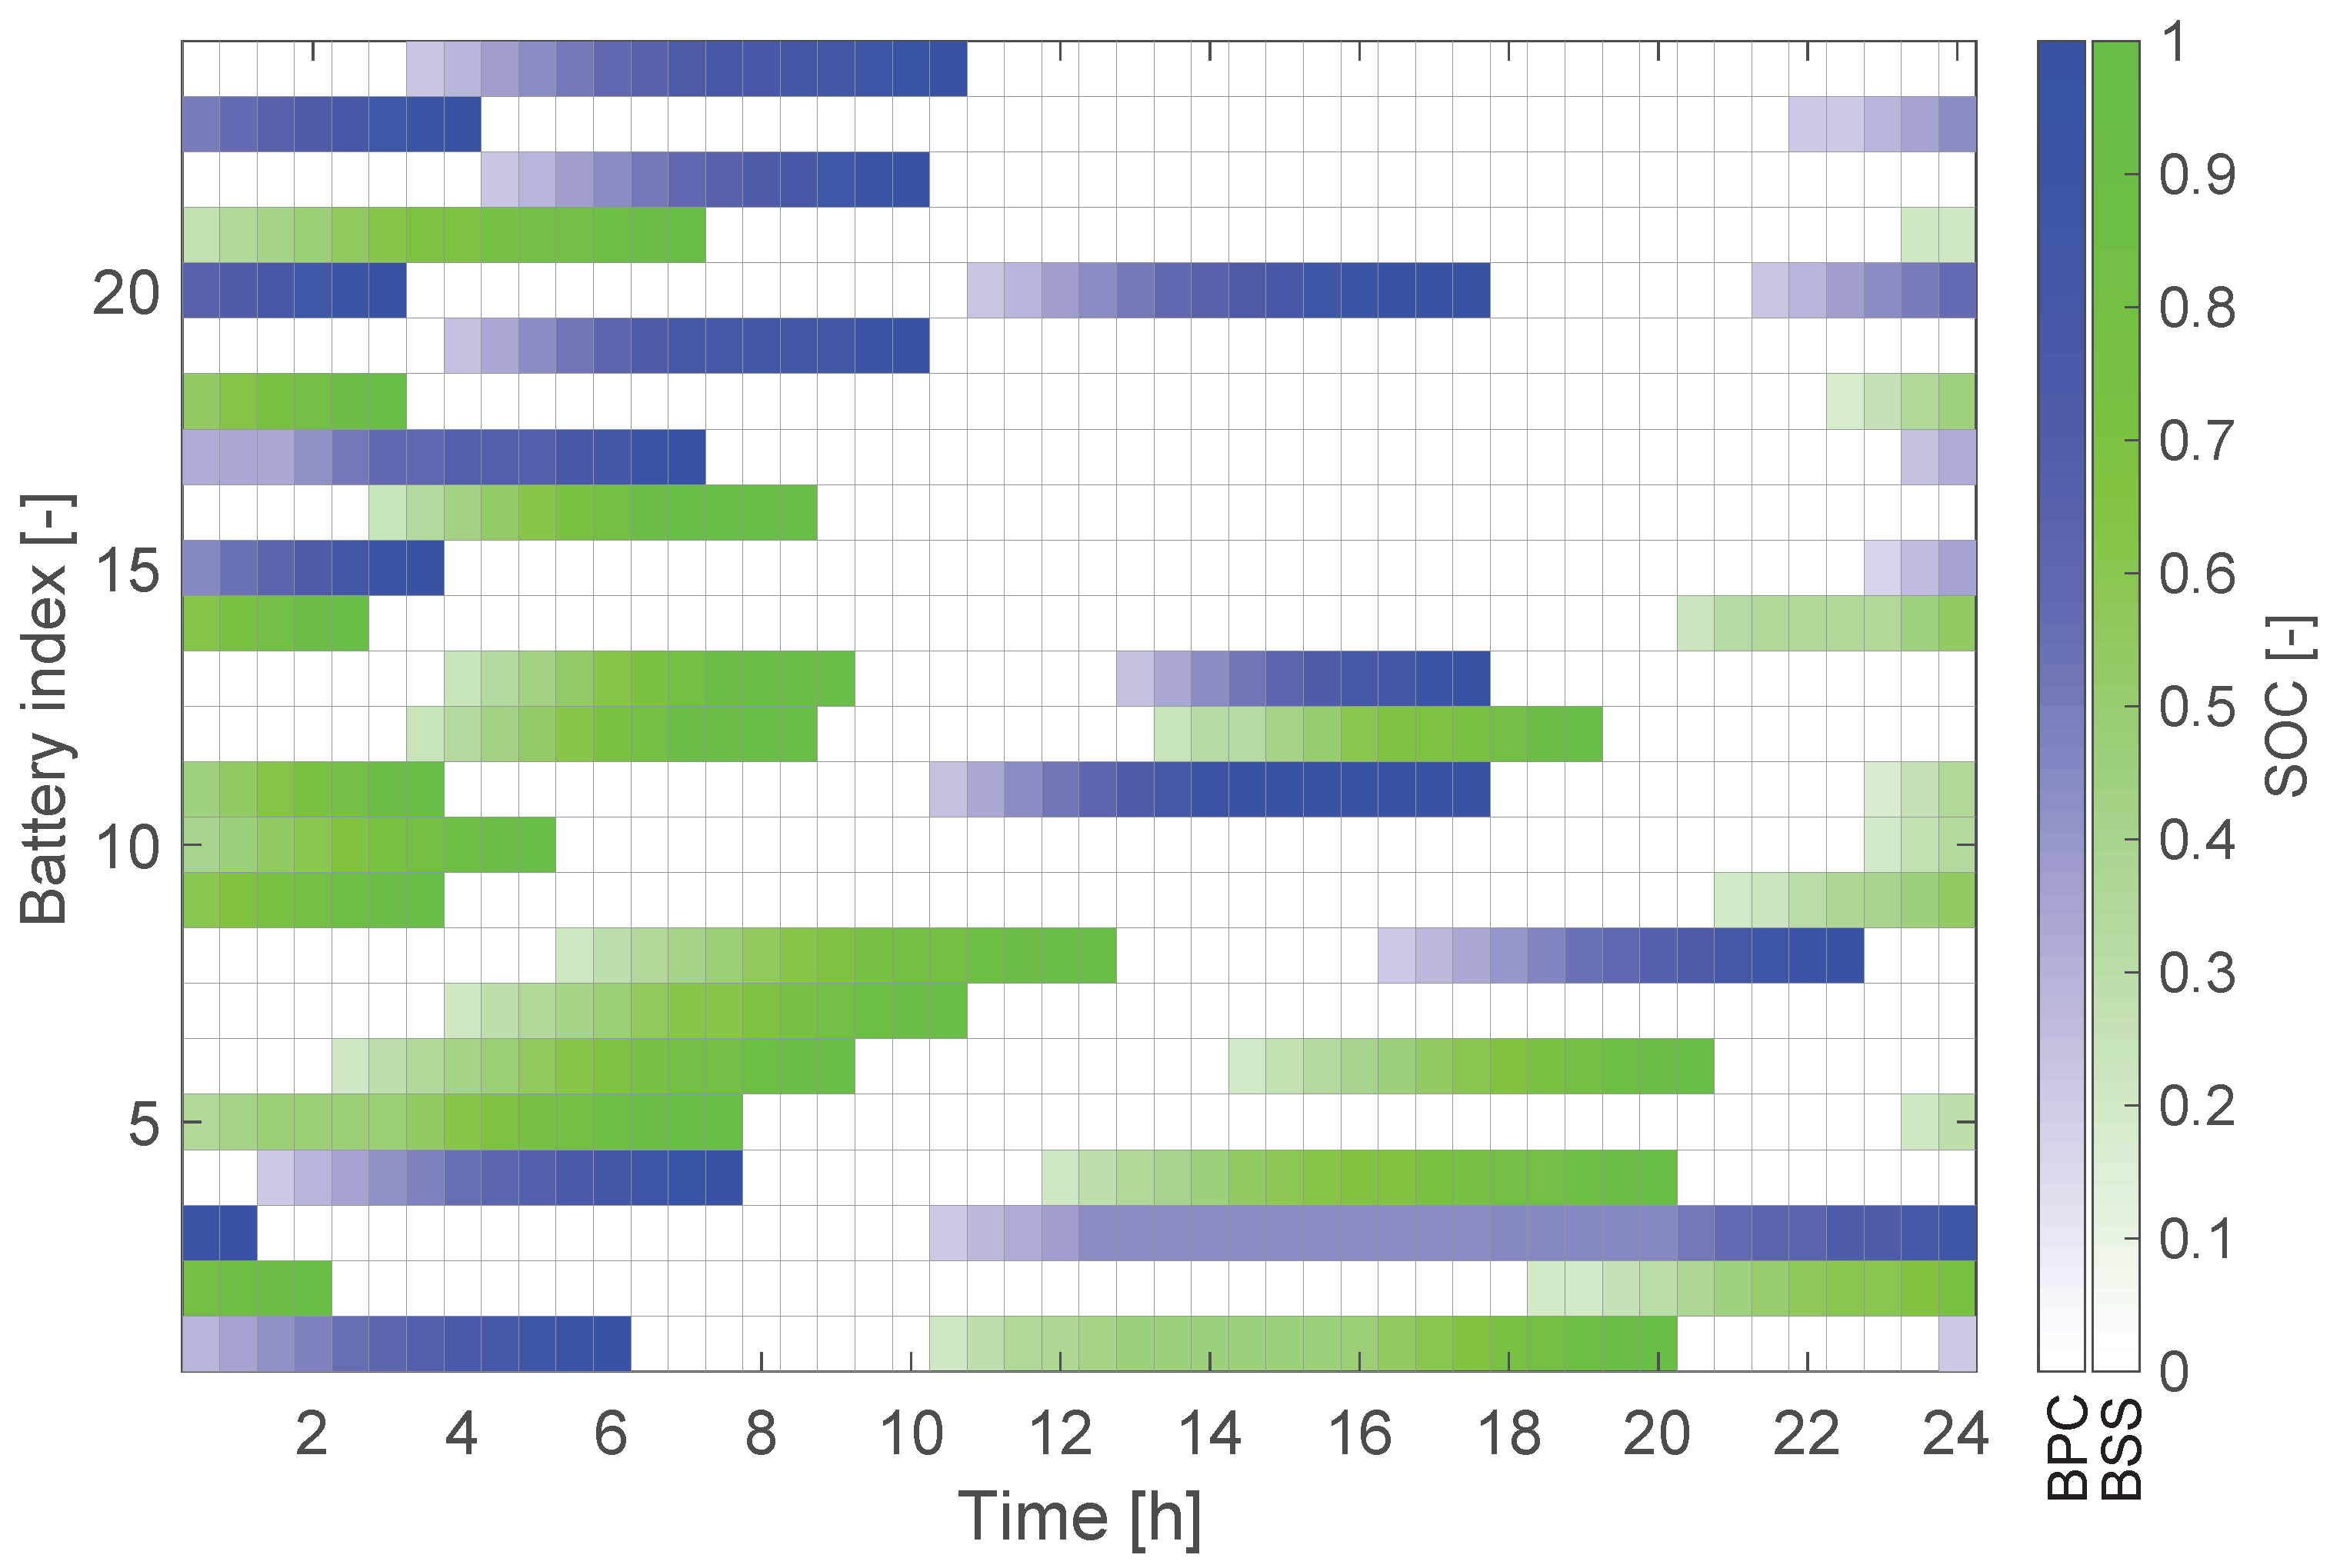
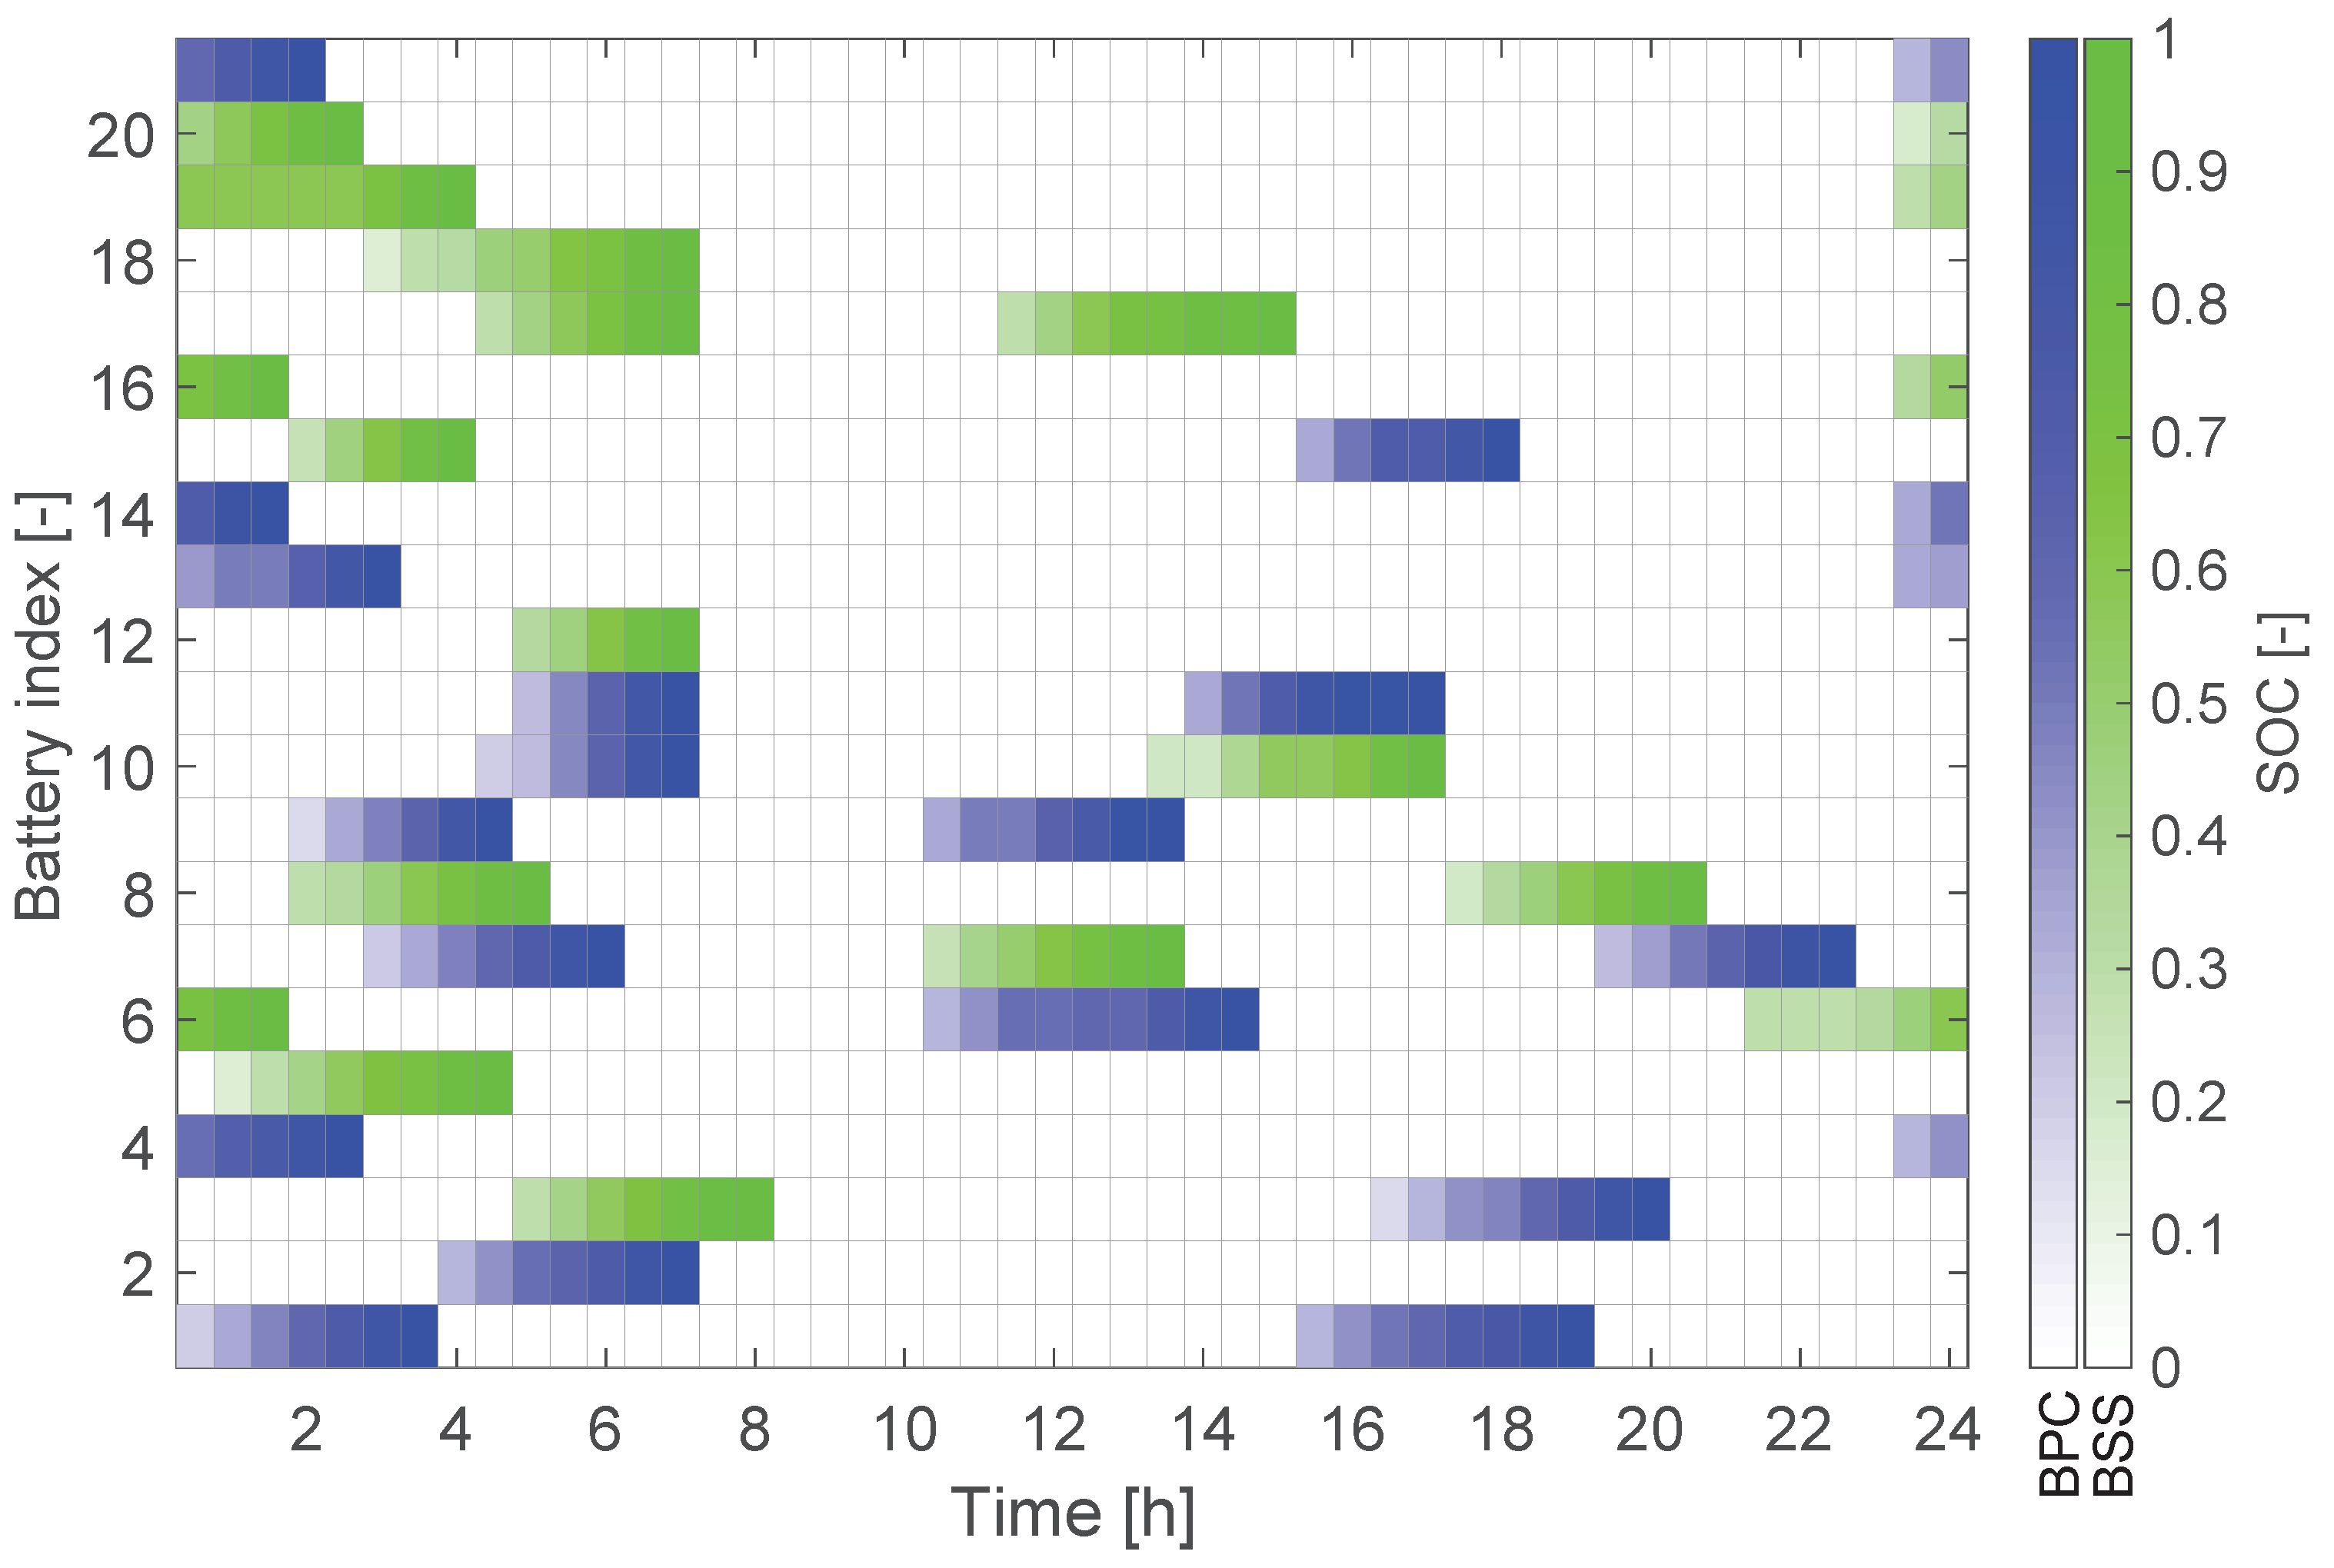
Figure 14 provides the time history of energy consumption for the more powerful 400 kW chargers. Here, the constant pattern at night is basically preserved, while a significant variation in the energy demand is seen during daytime. In fact, the chargers allow a quicker operation for each battery, so that all of them are completely recharged during nighttime and there is almost no need for continuing the process in the early daytime hours, at the rising of the energy and power pricing. Figure 15 illustrates the corresponding power consumption and the battery charging scheduling. The quicker recharging times, compared to the 200 kW case, are clearly visible, together with the power tuning that may change the recharge duration for a given battery. A maximum of nine batteries is simultaneously charged in this case. Figure 16 shows the time evolution of the battery state of charge, where now batteries from 1 to 8 are for the HE-DH8, from 9 to 16 for the HE-ATR42, and from 17 to 21 for the HE-ATR72. It is seen that the much faster recharging process (the maximum charging time is 5 h) allows more batteries to be served twice during the day when compared to the 200 kW case and even one to be charged thrice. Indeed, in the previous case, the batteries charged only once were 16 (67% of the total), while now they amount to 11 (52% of the total).

4. Conclusions

ARES, an original methodology solving the sizing of airport battery recharging infrastructure in support of an electric-powered fleet has been presented together with application studies. The underlying optimization algorithm provides the sizing solution together with the time planning of charging operations, in compliance with the predetermined flight scheduling at the airport, while minimizing procurement and operational costs. The method allows considering plug-in charging and battery swapping, either together or as alternatives. Due to the general approach in its formulation, ARES is suitable to extensive sensitivity studies on a large number of user-defined parameters. The discussed applications to a GA airport and to a large regional hub make use of real airport and aircraft data plus reasonable assumptions on the chargers’ specifications, leading to feasible solutions that may be used as examples in the study of the general impact of transitioning from conventionally-powered to electric-powered aircraft fleets in the future.
Further developments of the ARES methodology shall consider other elements that may play a role in a a real case scenario. For example, the airport charging facility may provide ancillary services to the electric grid, such as intermittent renewable energy storage (from solar- and wind-energy production), peak power supply, frequency or voltage regulation and other Battery to Grid (B2G) and even Battery to Battery (B2B) applications. These possibilities will be investigated, also considering the possibility to alleviate the costs for the airport reconfiguration using the revenues brought by such grid-integration services. Among other elements that may be useful in application studies, the possibility to include the modeling of flight missions, to take into account residual battery state of charge higher than the minimum, can be considered. In addition, given the boosting interest in hydrogen-powered propulsion in aviation, in the quest for a more environmentally-sustainable air transportation system, an extension of the ARES methodology to encompass also hydrogen production, storage, and supply at airports is currently ongoing.

Author Contributions

L.T, F.S., C.E.D.R., A.R., F.B.: conceptualization; F.S., F.B.: data curation; L.T, F.S., C.E.D.R., A.R., F.B.: formal analysis; L-T.: funding acquisition; L.T, F.S., C.E.D.R., A.R.: investigation; L.T, F.S., C.E.D.R., A.R., F.B.: methodology; L.T.: project administration; L.T.: resources; F.S., F.B.: software; L.T, C.E.D.R., A.R.: supervision; F.S: visualization; L.T, F.S., C.E.D.R., A.R.: writing—original draft; L.T, F.S., C.E.D.R., A.R.: writing—review & editing. All authors have read and agreed to the published version of the manuscript.

Funding

The research leading to the presented results has received funding from Project MAHEPA, financed by the EU H2020 Programme under Grant Agreement N. 723368.

Institutional Review Board Statement

Not applicable.

Informed Consent Statement

Not applicable.

Acknowledgments

The contribution of Alejandro Moreno-Perez in the initial stages of the formulation of the methodology is gratefully acknowledged.

Conflicts of Interest

The authors declare no conflict of interest.

Abbreviations

The following abbreviations are used in this manuscript:
Acronyms
ACMAero Club Milano
B2BBattery to Battery
B2GBattery to Grid
BPCBattery Plug-in Charger
BSSBattery Swapping Station
DCDirect Current
EMElectric Motor
EVElectric Vehicle
FCFuel Cell
HEHybrid-Electric
ICEInternal Combustion Engine
LIBLithium-ion Battery
PEPure-Electric
PGSPure-Electric
MILPMixed Integer Linear Programming
MDDMost Demanding Day
SOCState Of Charge
TEThermal Engine
VFRVisual Flight Rules
Symbols
C a Total aircraft procurement cost
C b Total battery cost
C BSS Total BSS cost
C BPC Total BPC cost
C e Electric energy cost
C p Electric power cost
E t Consumed electric energy at time t
E g B Nominal battery type g stored energy
GSet of battery types g
ISet of batteries i
JCost function
b g , t Type g battery demant at time t
N g a Number of type g aircraft
N g b Number of type g batteries
N g BSS Number of type g BSS chargers
N g BPC Number of type g BPCs
P g max Maximum type g battery charging power
p g BSS Maximum power of a type g BSS charger
p g BPC Maximum power of a type g BPC
P i , t B S S BSS charging power of battery i at time t
P i , t B P C BPC charging power of battery i at time t
TSet of time indeces t
S i , t State of charge of battery i at time t
S m i n Depleted battery state of charge
c g a Procurement cost of type g aircraft
c g BSS Cost type g BSS charger
c p Electric power monthly cost
c g BPC Cost of type g BPC
dNumber of days of the simulation
d g a Aircraft type g expected life
d g BSS BSS type g expected life
d g BPC BPC type g expected life
k i Auxiliary variable to account for battery i usage
l t Duration of one time step
q i , t Auxiliary variable for linearity of battery i at time t
s i , g Binary parameter indicating if battery i belongs to group g
tTime index
x i , t Request status of battery i at time t
x i , t b Unavailability status of battery i at time t
x i , t o Unavailability status of battery i at time t
η c Battery charging efficiency
η d Battery discharging efficiency
λ t Electric energy price at time t
y i , t BPC BPC charging status of battery i at time t
y i , t BSS BSS charging status of battery i at time t

References

  1. Kallas, S.; Geoghegan-Quinn, M.; Darecki, M.; Edelstenne, C.; Enders, T.; Fernandez, E.; Hartman, P. Flightpath 2050 Europe’s Vision for Aviation. In Report of the High Level Group on Aviation Research; European Commission: Brussels, Belgium, 2011; Volume 98. [Google Scholar]
  2. ICAO Environment. 2016 Environmental Report. Available online: https://www.icao.int/environmental-protection/pages/env2016.aspx (accessed on 18 December 2020).
  3. A Global Approach to Reducing Aviation Emissions. First Stop: Carbon-Neutral Growth by 2020. Available online: https://www.iata.org/en/pressroom/pr/2009-06-08-03/ (accessed on 18 December 2020).
  4. Drake, A. NASA environmentally responsible aviation (ERA) N+ 2 advanced vehicle study. In NASA Technical Report, NASA/CR—2013-218304; NASA: El Segundo, CA, USA, 2012. [Google Scholar]
  5. Brelje, B.J.; Martins, J.R.R.A. Electric, hybrid, and turboelectric fixed-wing aircraft: A review of concepts, models, and design approaches. Prog. Aerosp. Sci. 2019, 104, 1–19. [Google Scholar] [CrossRef]
  6. Gnadt, A.R.; Speth, R.L.; Sabnis, J.S.; Barrett, S.R.H. Technical and environmental assessment of all-electric 180-passenger commercial aircraft. Prog. Aerosp. Sci. 2019, 105, 1–30. [Google Scholar]
  7. Riboldi, C.; Gualdoni, F. An integrated approach to the preliminary weight sizing of small electric aircraft. Aerosp. Sci. Technol. 2016, 58, 134–149. [Google Scholar] [CrossRef]
  8. Riboldi, C.E. An optimal approach to the preliminary design of small hybrid-electric aircraft. Aerosp. Sci. Technol. 2018, 81, 14–31. [Google Scholar] [CrossRef]
  9. Trainelli, L.; Salucci, F.; Riboldi, C.E.D.; Rolando, A. A General Framework for the Preliminary Sizing of Serial Hybrid-Electric Aircraft; 2021; submitted for publication. [Google Scholar]
  10. Trainelli, L.; Riboldi, C.E.; Salucci, F.; Rolando, A. A General Preliminary Sizing Procedure for Pure-Electric and Hybrid-Electric Airplanes. In Proceedings of the 1st Aerospace Europe Conference (AEC 2020), Toulouse, France, 25–28 February 2020; pp. 1–10. [Google Scholar]
  11. Langelaan, J.W.; Chakrabarty, A.; Deng, A.; Miles, K.; Plevnik, V.; Tomazic, J.; Tomazic, T.; Veble, G. Green flight challenge: Aircraft design and flight planning for extreme fuel efficiency. J. Aircr. 2013, 50, 832–846. [Google Scholar] [CrossRef]
  12. Fefermann, Y.; Maury, C.; Level, C.; Zarati, K.; Salanne, J.P.; Pornet, C.; Thoraval, B.; Isikveren, A.T. Hybrid-Electric motive power systems for commuter transport applications. In Proceedings of the 30th Congress of the International Council of the Aeronautical Sciences, Daejeon, Korea, 25–30 September 2016; pp. 25–30. [Google Scholar]
  13. Trainelli, L.; Riboldi, C.E.D.; Rolando, A.; Salucci, F. Methodologies for the Initial Design Studies of an Innovative Community-Friendly Miniliner. IOP Conf. Ser. Mater. Sci. Eng. 2021. accepted (to appear). [Google Scholar] [CrossRef]
  14. Salucci, F.; Trainelli, L.; Bruglieri, M.; Riboldi, C.E.D.; Rolando, A. Capturing the Demand for an Electric-Powered Short-Haul Air Transportation Network. In AIAA SciTech 2021 Forum; AIAA Paper no. 2021-0869; American Institute of Aeronautics and Astronautics: Reston, VA, USA, 11–15 January 2021. [Google Scholar]
  15. Schmidt, M.; Paul, A.; Cole, M.; Ploetner, K.O. Challenges for ground operations arising from aircraft concepts using alternative energy. J. Air Transp. Manag. 2016, 56, 107–117. [Google Scholar] [CrossRef]
  16. Aircraft—Connectors for Ground Electrical Supplies—Part 2: Dimensions; Standard, International Organization for Standardization: Geneva, Switzerland, 1985.
  17. Sujitha, N.; Krithiga, S. RES based EV battery charging system: A review. Renew. Sustain. Energy Rev. 2017, 75, 978–988. [Google Scholar] [CrossRef]
  18. Zheng, Y.; Dong, Z.Y.; Xu, Y.; Meng, K.; Zhao, J.H.; Qiu, J. Electric vehicle battery charging/swap stations in distribution systems: Comparison study and optimal planning. IEEE Trans. Power Syst. 2014, 29, 221–229. [Google Scholar] [CrossRef]
  19. EASA Type Certificate Data Sheet for Type Virus SW 121. Available online: https://www.easa.europa.eu/document-library/type-certificates/noise/easaa573 (accessed on 18 December 2020).
  20. Friedrich, C.; Robertson, P.A. Hybrid-electric propulsion for aircraft. J. Aircr. 2014, 52, 176–189. [Google Scholar] [CrossRef]
  21. Sarker, M.R.; Pandžić, H.; Ortega-Vazquez, M.A. Optimal operation and services scheduling for an electric vehicle battery swapping station. IEEE Trans. Power Syst. 2015, 30, 901–910. [Google Scholar] [CrossRef]
  22. Bobanac, V.; Pandzic, H.; Capuder, T. Survey on electric vehicles and battery swapping stations: Expectations of existing and future EV owners. In Proceedings of the 2018 IEEE International Energy Conference (ENERGYCON), Limassol, Cyprus, 3–7 June 2018. [Google Scholar]
  23. Correa-Florez, C.A.; Gerossier, A.; Michiorri, A.; Kariniotakis, G. Stochastic operation of home energy management systems including battery cycling. Appl. Energy 2018, 225, 1205–1218. [Google Scholar] [CrossRef] [Green Version]
  24. Bona, G.E.; Bucari, M.; Castagnoli, A.; Trainelli, L. Flybrid: Envisaging the Future Hybrid-Powered Regional Aviation. In AIAA/3AF Aircraft Noise and Emissions Reduction Symposium; American Institute of Aeronautics and Astronautics: Atlanta, GA, USA, 2014. [Google Scholar] [CrossRef]
  25. Riboldi, C.E.D.; Trainelli, L.; Biondani, F. Structural Batteries in Aviation: A Preliminary Sizing Methodology. J. Aerosp. Eng. 2020, 33, 04020031. [Google Scholar] [CrossRef]
  26. Bigoni, F.; Moreno-Perez, A.; Salucci, F.; Riboldi, C.E.D.; Rolando, A.; Trainelli, L. Design of Airport Infrastructures in Support of the Transition to a Hybrid-Electric Fleet. In Proceedings of the Advanced Aircraft Efficiency in a Global Air Transport System Conference (AEGATS 2018), Toulouse, France, 23–25 October 2018. [Google Scholar]
  27. Riboldi, C.E.D.; Trainelli, L.; Mariani, L.; Rolando, A.; Salucci, F. Predicting the effect of electric and hybrid-electric aviation on acoustic pollution. Noise Mapp. 2020, 7, 35–56. [Google Scholar] [CrossRef]
  28. Salucci, F.; Riboldi, C.E.D.; Trainelli, L.; Rolando, A.; Mariani, L. A Noise Estimation Procedure for Electric and Hybrid-Electric Aircraft. In AIAA SciTech 2021 Forum; AIAA paper no. 2021-0258; American Institute of Aeronautics and Astronautics: Reston, VA, USA, 11–15 January 2021. [Google Scholar]
  29. Justin, C.Y.; Payan, A.P.; Briceno, S.I.; German, B.J.; Mavris, D.N. Power optimized battery swap and recharge strategies for electric aircraft operations. Transp. Res. Part C Emerg. Technol. 2020, 115, 102605. [Google Scholar] [CrossRef]
  30. Schroeder, A.; Traber, T. The economics of fast charging infrastructure for electric vehicles. Energy Policy 2012, 43, 136–144. [Google Scholar] [CrossRef]
  31. Salucci, F.; Trainelli, L.; Riboldi, C.E.D.; Rolando, A. Sizing of Airport Recharging Infrastructures in Support to a Hybrid-Electric Fleet. In AIAA SciTech 2021 Forum; AIAA paper no. 2021-1682; American Institute of Aeronautics and Astronautics: Reston, VA, USA, 11–15 January 2021. [Google Scholar]
  32. Finger, D.; Getten, F.; Braun, C.; Bil, C. Cost Estimation Methods for Hybrid-Electric General Aviation Aircraft. In Proceedings of the 11th Asia-Pacific International Symposium on Aerospace Technology (APISAT 2019), Gold Coast, Australia, 4–6 December 2019. [Google Scholar]
  33. Eurostat Database: Airport Traffic Data by Reporting Airport and Airlines. Available online: http://ec.europa.eu/eurostat/web/transport/data/database (accessed on 18 December 2020).
  34. A Behind the Scenes Take on Lithium-ion Battery Prices. Available online: https://about.bnef.com/blog/behind-scenes-take-lithium-ion-battery-prices/ (accessed on 18 December 2020).
  35. Flightradar24: Live Flight Tracker. Available online: https://www.flightradar24.com (accessed on 15 July 2018).
Figure 1. Italian electricity pricing policy scheme.
Aerospace 08 00040 g001
Figure 2. Energy expenditure (top) and departure schedule (bottom) at LIMB for the Most Demanding Day case (BPC only).
Aerospace 08 00040 g002
Figure 3. Power consumption (top) and battery charging schedule (bottom) at LIMB for the Most Demanding Day case (BPC only).
Aerospace 08 00040 g003
Figure 4. Battery state of charge time evolution at LIMB for the Most Demanding Day case (BPC only).
Aerospace 08 00040 g004
Figure 5. Energy expenditure (top) and departure schedule (bottom) at LIMB for the Most Demanding Day case.
Aerospace 08 00040 g005
Figure 6. Power consumption (top) and battery charging schedule (bottom) at LIMB for the Most Demanding Day case.
Aerospace 08 00040 g006
Figure 7. Battery state of charge time evolution at LIMB for the case of the Most Demanding Day case.
Aerospace 08 00040 g007
Figure 8. Energy expenditure (top) and departure schedule (bottom) at LIMB for the entire week case.
Aerospace 08 00040 g008
Figure 9. Power consumption (top) and battery charging schedule (bottom) at LIMB for the entire week case.
Aerospace 08 00040 g009
Figure 10. Departure schedule at LGAV for the average day case.
Aerospace 08 00040 g010
Figure 11. Energy expenditure at LGAV for the average day case (200 kW chargers).
Aerospace 08 00040 g011
Figure 12. Power consumption (top) and battery charging schedule (bottom) at LGAV for the average day case (200 kW chargers).
Aerospace 08 00040 g012
Figure 13. Battery state of charge time evolution at LGAV for the average day case (200 kW chargers).
Aerospace 08 00040 g013
Figure 14. Energy expenditure at LGAV for the average day case (400 kW chargers).
Aerospace 08 00040 g014
Figure 15. Power consumption (top) and battery charging schedule (bottom) at LGAV for the average day case (400 kW chargers).
Aerospace 08 00040 g015
Figure 16. Battery state of charge time evolution at LGAV for the average day case (400 kW chargers).
Aerospace 08 00040 g016
Table 1. Example application of binary variables x i , t o , x i , t b and x i , t .
Phase
t01234
x i 01000
x i o 01110
x i b 00001
Ⓐ The battery is charging in the BSS. Ⓑ The battery is requested and employed on an aircraft, the flight mission begins. Ⓒ The flight mission continues. Ⓓ The flight mission ends. Ⓔ The depleted battery is removed from the aircraft and brought to the BSS for recharging.
Table 2. ARES optimization variables.
VariableTypeDescription
x i , t binaryRequest status of battery i at time t
x i , t b binaryUnavailability status of battery i at time t (on ground)
x i , t o binaryUnavailability status of battery i at time t (in flight)
y i , t BSS binaryBSS charging status of battery i at time t
y i , t BPC binaryBPC charging status of battery i at time t
z i binaryAuxiliary variable for battery i usage
q i , t binaryAuxiliary variable for battery i state of charge at time t
N g b integerNumber of batteries of type g
N g BSS integerNumber fo BSS chargers of type g
N g BPC integerNumber of BPC chargers of type g
N g a integerNumber of aircraft of type g
S i , t realState of charge of battery i at time t
P i , t B P C realBPC charging power of battery i at time t
P i , t B S S realBSS charging power of battery i at time t
E t realConsumed electric energy at time t
Table 3. ARES input parameters.
Battery-related
ISet of batteries
GSet of airplane/battery/charger types
{ s i , g } Binary parameter indicating if battery i is of type g
{ E g B } Stored energy of a battery of type g
{ b g , t } Demand of a battery of type g at time t
{ P g max } Maximum charging power of a battery of type g
η c Battery charging efficiency
η d Battery discharging efficiency
S m i n Depleted battery state of charge
{ c g b } Procurement cost of a battery of type g
{ c ¯ g b } Weighted cost of a battery of type g
{ d g b } Expected life of a battery of type g
Charger-related
{ p g BSS } Maximum power of a BSS charger of type g
{ p g BPC } Maximum power of a BPC charger of type g
{ c g BSS } Procurement cost of a BSS charger of type g
{ c g BPC }Procurement cost of a BPC charger of type g
{ χ g BSS } Coefficient for BSS maintenance cost
{ χ g BPC } Coefficient for BPC maintenance cost
{ d g BSS } Expected life of a BSS charger of type g
{ d g BPC } Expected life of a BPC charger of type g
Aircraft-related
{ c g a } Procurement cost of an aircraft of type g
{ d g a } Expected life of an aircraft of type g
Energy supply-related
λ t Electric energy price at time t
c p Electric power cost per month
Simulation-related
TSet of time slots
L, dSimulated time duration
l t Length of a time slot
MLarge integer
Table 4. ARES output parameters.
C a Total aircraft procurement cost
C b Total battery cost
C BSS Total BSS cost
C BPC Total BPC cost
C e Electric energy cost
C p Electric power cost
{ E t } Consumed electric energy at time t
JCost function
Table 5. Panthera Hybrid main specifications.
ItemValue
No. pax4
MTOW1315 kg
Rated power200 kW
Max. cruising speed177 KTAS
Range350 nm
Battery Cost15,000
Battery nominal capacity13.8 kWh
Battery useful capacity11.0 kWh
Battery life at 100% DOD500 cycles
Battery life at 75% DOD800 cycles
Charging efficiency93%
Discharging efficiency85%
Charging Power60 kW
Table 6. Electricity prices employed for LIMB reconfiguration.
Energy charge λ t
F10.1482 €/kWh
F20.1449 €/kWh
F30.1286 €/kWh
Power charge c p
4.8104 €/kW/month
Table 7. Average weekly departure scheme at LIMB.
h567891011121314151617181920
M0000000000000000
T0000212112210000
W0002122123200000
T0002232123200000
F0001131334300000
S0006654457300000
S0003752546400000
Table 8. LIMB infrastructural sizing summary.
QuantityUnitValue
No. of recharges-3939136
No. of batteries-111212
No. of chargers-2 BPCs2 BSSs2 BSSs
No. of aircraft-111010
Average battery replacementYears0.620.671.35
Peak powerkW565656
Energy consumptionkWh4104101,430
Electric energy cost5857191
Electric power cost9963
Total cost5965703844
MDD-BPCs onlyMDDEntire Week
Table 9. Aircraft battery characteristics for LGAV reconfiguration.
NamePaxBattery Capacity
(kWh)
Battery Price
(k€)
HE-DH8781400253.4
HE-ATR42481000184.8
HE-ATR72701300237.6
Table 10. Electricity prices employed for LGAV reconfiguration.
Energy charge λ t
Daytime0.0648 €/kWh
Nighttime0.0777 €kWh
Power charge c p
Daytime10.5080 €/kW/month
Nighttime2.5080 €/kW/month
Table 11. LGAV infrastructural sizing summary (the first, second, and third in the sums between parentheses refer to HE-DH8, HE-ATR42 and HE-ATR72, respectively).
QuantityUnitValue
No. of recharges-32 (14 + 12 + 6)32 (14 + 12 + 6)
No. of batteries-24 (10 + 9 + 5)21 (8 + 8 + 5)
No. of chargers-14 (6 + 5 + 3)10 (4 + 3 + 3)
No. of BSSs-8 (4 + 3 + 1)5 (2 + 1 + 2)
No. of BPCs-6 (2 + 2 + 2)5 (2 + 2 + 1)
No. of aircraft-14 (6 + 6 + 4)14 (6 + 6 + 4)
Average Battery replacementYears1.681.51
Energy consumptionMWh3636
Peak powerMW2.62.9
Electric energy cost25312502
Electric power cost216240
Total cost44,90844,263
200 kW chargers400 kW chargers
Publisher’s Note: MDPI stays neutral with regard to jurisdictional claims in published maps and institutional affiliations.