Article

Analysis of Risk-Based Operational Bird Strike Prevention

1
Control & Simulation Department, Faculty of Aerospace Engineering, Delft University of Technology, Kluyverweg 1, 2629 HS Delft, The Netherlands
2
Institute of Flight Guidance, German Aerospace Center (DLR), Lilienthalplatz 7, 38108 Braunschweig, Germany
*
Author to whom correspondence should be addressed.
Aerospace 2021, 8(2), 32; https://doi.org/10.3390/aerospace8020032
Submission received: 18 December 2020 / Revised: 19 January 2021 / Accepted: 21 January 2021 / Published: 28 January 2021
(This article belongs to the Collection Air Transportation—Operations and Management)

Abstract

:
Bird strike prevention in civil aviation has traditionally focused on the airport perimeter. Since the risk of especially damaging bird strikes outside the airport boundaries is rising, this paper investigates the safety potential of operational bird strike prevention involving pilots and controllers. In such a concept, controllers would be equipped with a bird strike advisory system, allowing them to delay departures which are most vulnerable to the consequences of bird strikes in case of high bird strike risk. An initial study has shown the strong potential of the concept to prevent bird strikes in case of perfect bird movement prediction. This paper takes the research to the next level by taking into account the limited predictability of bird tracks. As such, the collision avoidance algorithm is extended to a bird strike risk algorithm. The risk of bird strikes is calculated for birds expected to cross the extended runway center line and to cause aircraft damage upon impact. By specifically targeting these birds and excluding birds lingering on the runway which are taken care of by the local wildlife control, capacity reductions should be limited, and the implementation remain feasible. The extrapolation of bird tracks is performed by simple linear regression based on the bird positions known at the intended take-off times. To calculate the probability of collision, uncertainties resulting from variability in bird velocity and track are included. The study demonstrates the necessity to limit alerts to potentially damaging strikes with birds crossing the extended runway center line to keep the imposed delays tolerable for airports operating at their capacity limits. It is shown that predicting bird movements based on simple linear regression without considering individual bird behavior is insufficient to achieve a safety-effect. Hence, in-depth studies of multi-year bird data to develop bird behavior models and reliable predictions are recommended for future research. This is expected to facilitate the implementation of a bird strike advisory system satisfying both safety and capacity aspects.

1. Introduction

Bird strike risk is highest at low heights and decreases with increasing heights [1,2]. Therefore, the vast majority of strikes happen below 1000 m and therefore in the low-level flight phases of take-off, initial climb, landing and approach [3,4]. The International Civil Aviation Organization (ICAO) requires airports to implement measures to decrease the risk of wildlife hazards at and in the vicinity of an airport [5]. The procedures, which are airport-specific, can be grouped in the categories habitat management, exclusion, harassment, capture, and lethal methods [6]. Research has shown that wildlife strike prevention at the airports, performed by dedicated Wildlife Control Units (WCUs), has led to a strong reduction in number of bird strikes at the airports themselves. However, there is an increasing trend of bird strikes outside the airport environment, which lies beyond the reach of the performed measures [3,7].
Therefore, additional measures for this area are required. This study addresses the concept of operational bird strike prevention, actively including pilots and controllers in the loop [3,8]. Currently, these parties are only marginally involved. For example, if high bird abundance is observed at an airport, the controllers can provide this information to the pilots via radio or, if the abundance is expected for longer periods such as during migration, in Notice to Airmens (NOTAMs) [9,10]. In the concept of operational bird strike prevention, which is considered here, controllers can support the pilots with dedicated real-time information of current bird strike risk. For this purpose, a bird strike advisory system would be implemented at the working position of the tower controller. Based on real-time sensor data, the bird strike prevention system continuously calculates the current bird strike risk. If required, the system alerts the controller who can directly adjust clearances. Introducing such a concept as an addition to currently implemented wildlife strike prevention measures is expected to enhance aviation and avian safety, especially outside the airport perimeter.
Surveillance technology such as avian radars tailored to locate and track birds are enablers for this operational bird strike prevention process [11]. An increasing number of airports have been installing avian radars over recent years. The majority of these radars serves to provide the local bird strike prevention units with information to identify hot spots of bird activity [3]. Air Traffic Control (ATC) usually has no link to the radar’s output. A promising exception is the King Shaka International Airport in Durban, South Africa. ATC can be advised to delay departing traffic in case of a high bird strike risk determined by a system based on radar observations [12]. The situation at this airport is special in the sense that the risk which is warned of occurs twice a day when millions of wintering swallows cross the extended runway center line to move between resting and feeding areas. Hence, the timing and duration of these warnings are very predictable, and can therefore be effectively used by ATC.
The introduction of such a concept of operational bird strike prevention at airports with less predictable presence of birds faces multiple challenges. First, methods to predict local bird movement at the airport and in the surrounding area up to 1000 m as reliably as possible must be established. Second, a suitable level of support for the controller must be developed and evaluated. Potential levels of support range from visualizing the current and predicted bird tracks up to a system advising the controller when it is safe to use the runway [13].
On the airport level, it is vital to research the influence of such a concept on the air traffic flows. The number of issued alerts and thus the number and duration of imposed delays as well as the effect on runway capacity depend on the predictability of the bird movement and the defined warning levels. Furthermore, the question to what extent bird strikes can be prevented at all, remains to be analyzed. The evaluation of these factors is the scope of this study. It builds on a previous analysis which researched the influence on traffic flows and the hypothetical maximum safety potential of such a system, independent of the effectiveness of any predicting algorithm [8]. For this purpose, perfect predictability of bird movement was assumed. The results of that study also serve as a benchmark for more realistic implementations that do consider the limited predictability of bird behavior. In the idealized setting of the study, over 99% of strikes were prevented in the performed Monte Carlo simulations. Runway capacity could be maintained and the delays resulting from the preventive actions lay within reasonable limits for most scenarios [
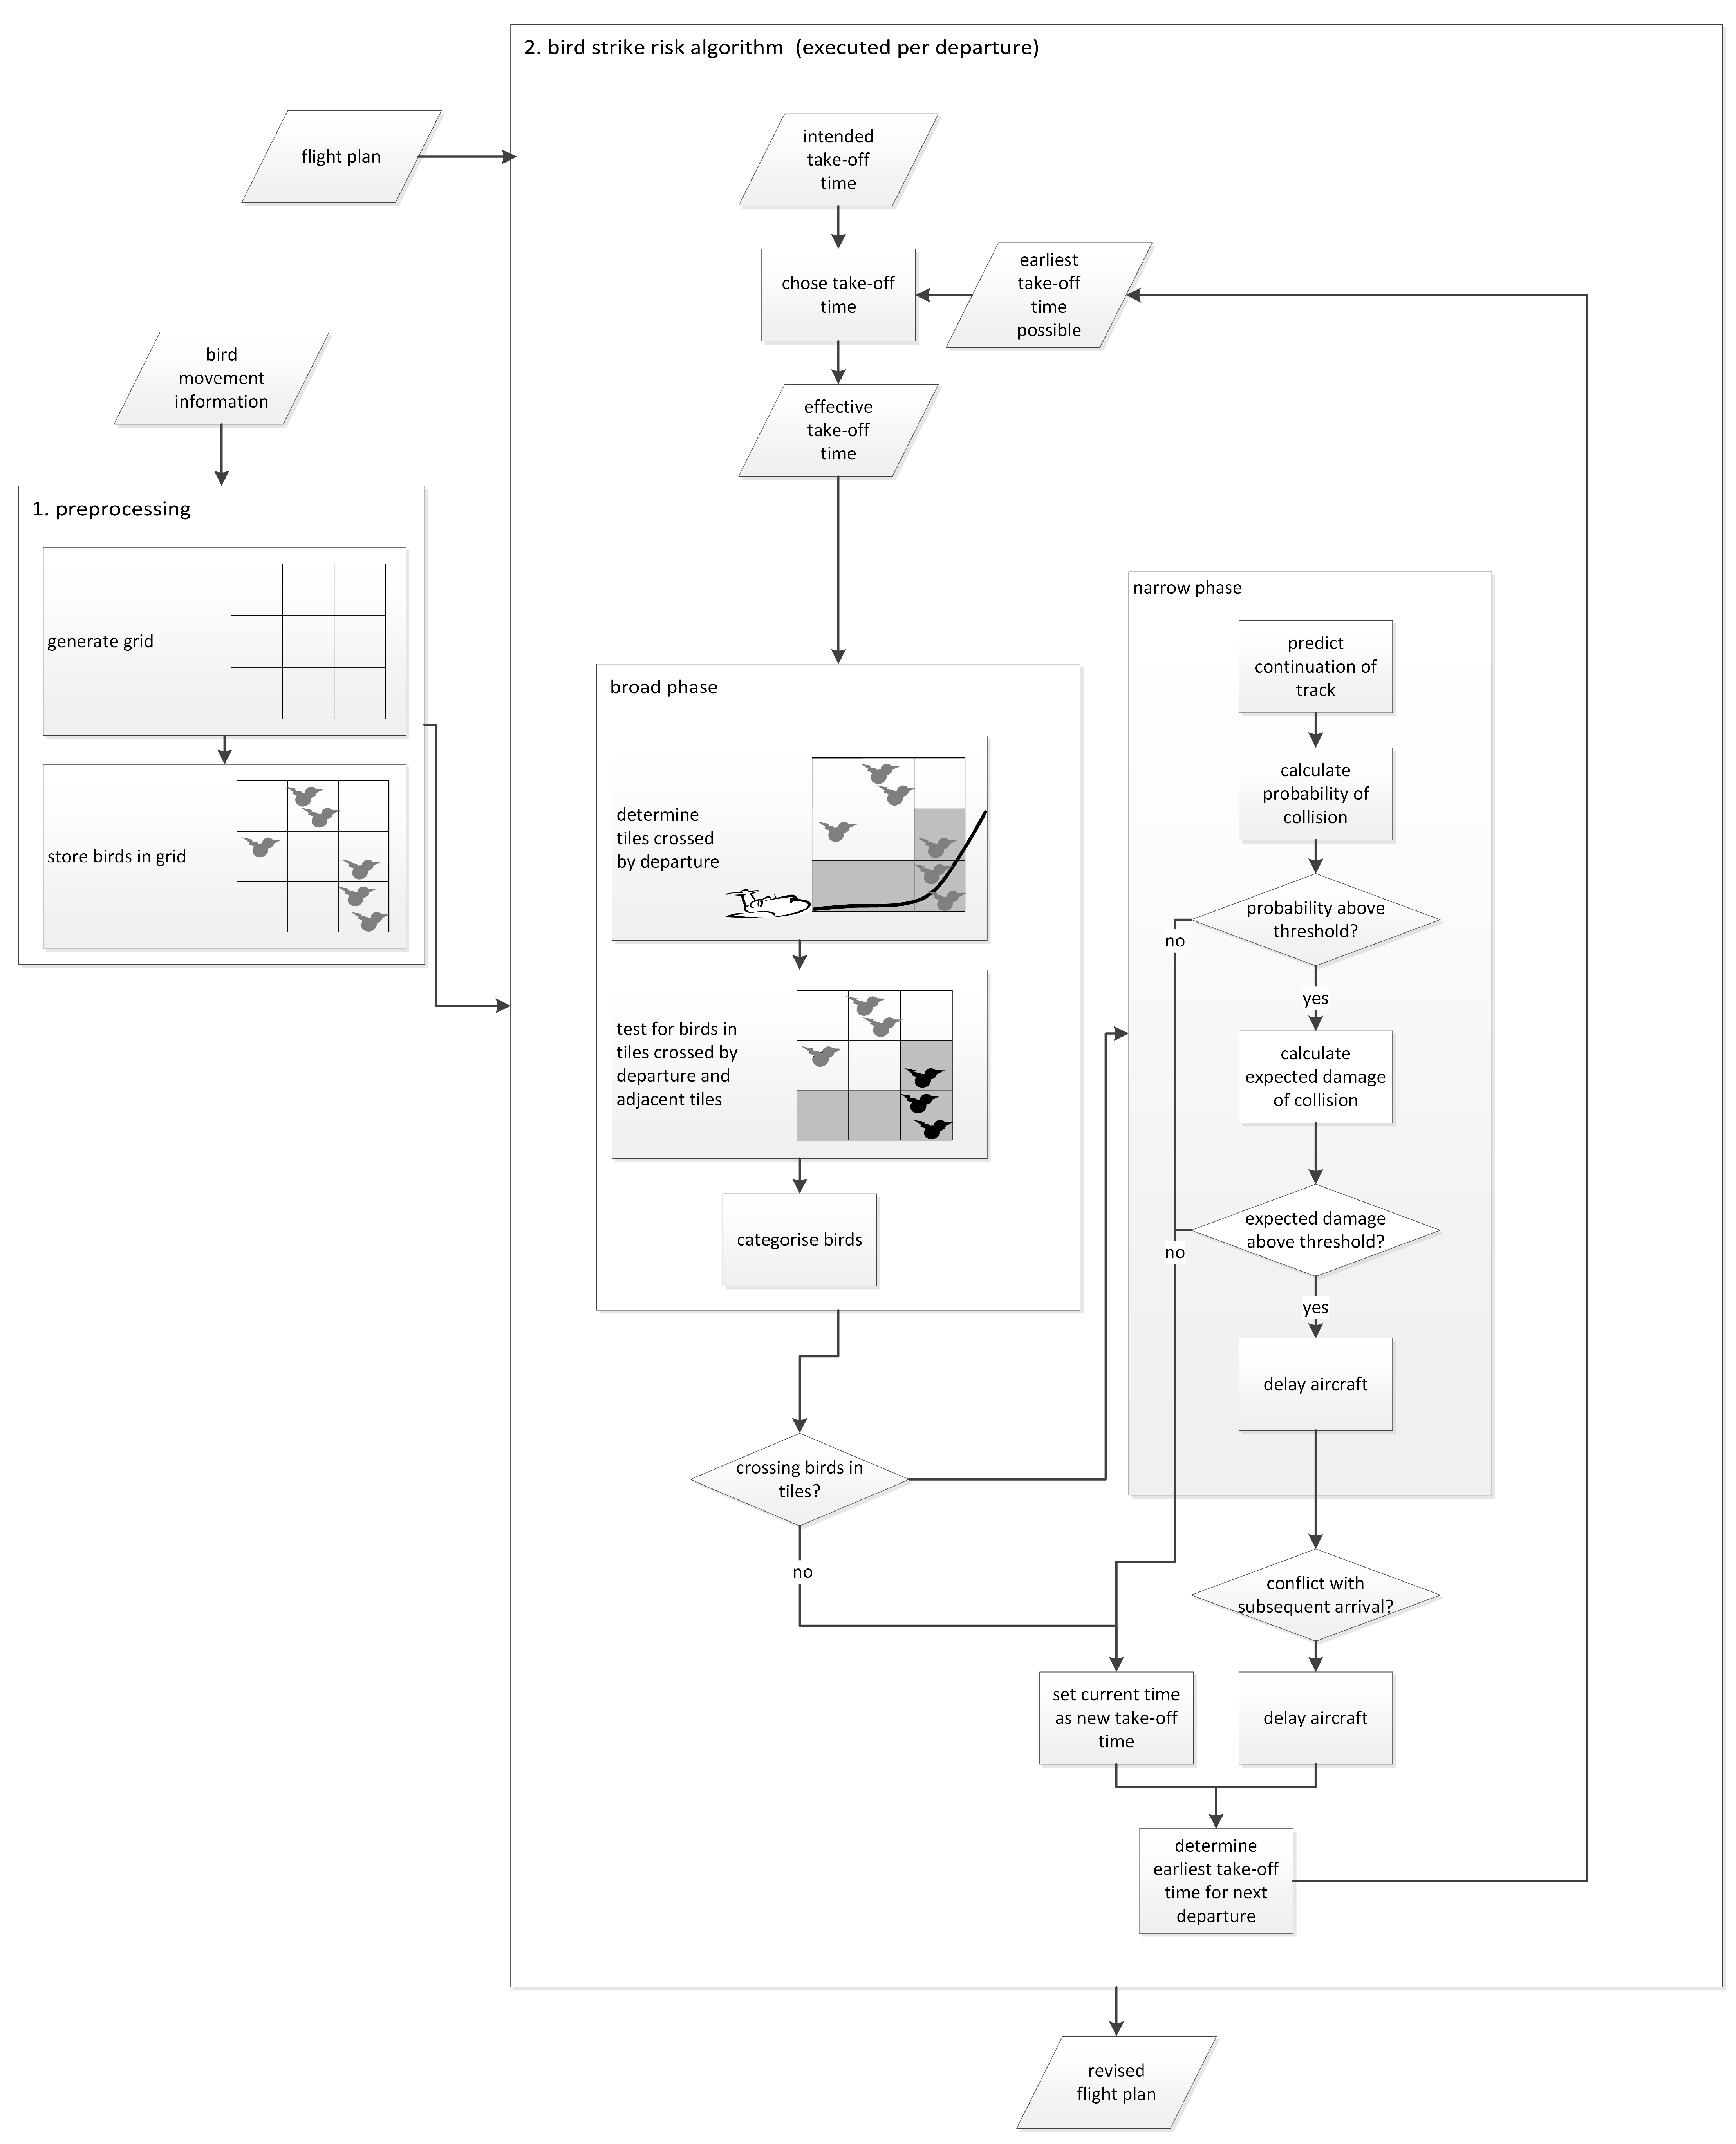
8]. In the current study, the next step is taken by abandoning the assumption of perfect predictability, and replacing it with a prediction logic. A concept is proposed that calculates the risk of bird strikes, based on the currently detected presence and movements of birds.

2. Material and Methods

The goal of this study is to evaluate the feasibility of a bird strike advisory system by enhancing the underlying collision avoidance algorithm which was developed in earlier research [8]. In this previous study, perfect predictability of bird movement was assumed. In the current study, the outcomes of a more realistic setting including the limited predictability of bird movement are analyzed. Therefore, modules for bird movement prediction as well as the calculation of probability and severity of bird strikes were developed. These were implemented in the initial collision avoidance algorithm, enhancing it to a bird strike risk algorithm. To evaluate the effects of the resulting algorithm, it was executed for different air traffic patterns and volumes, combining them with historic bird movements from various days throughout the four seasons. The scenarios rescheduled by the algorithm were simulated in fast-time to analyze how many bird strikes occurring in the initial flight plans the algorithm had prevented.
This section first introduces the set-up of the bird strike risk algorithm as well as the method to categorize and to predict bird movement. Thereafter, the evaluation experiment to evaluate the algorithm is described.

2.1. Bird Strike Risk Algorithm

The bird strike risk algorithm comprises the elements of predicting bird movement, calculating the risk of collision as well as avoiding the predicted collision in case of high risk.
The implementation of collision avoidance relies on the trajectory comparison of aircraft and birds. If the bird strike risk algorithm predicts an intrusion of protected volumes around aircraft by bird trajectories, a potential collision is detected. This general concept is comparable to Airborne Collision Avoidance System (ACAS) as mandated in civil aviation [14]. However, certain differences must be accounted for when implementing a system to prevent bird strikes. First, ACAS depends on the exchange of transponder information between aircraft. In case of a bird strike advisory system, ground-based sensors such as radar, visual or infrared video must be used to locate birds.
The risk that a bird strike results in damage is highest for aircraft taking off [15,16]. Pilots can contribute to limit the likelihood of strikes during this flight phase. For example, by delaying their take-off in case of observed or reported bird activity until the WCU took dispersal measures or by choosing steep rates of climb to limit the time in the critical altitude bands [9]. In this paper, take-off delays based on observations of bird movement in the entire extended airport area—beyond the range of visual observations by pilots or controllers—are selected.
For aircraft on approach, the European Organization for the Safety of Air Navigation (EUROCONTROL) recommends that unless a go-around can be achieved with a reasonable degree of confidence that the aircraft will not hit birds, it is less hazardous to continue the approach to land [17]. Bird strikes during approach to which the pilots reacted with go-arounds did lead to incidents and accidents in the past due to the reduced or lost thrust caused by the collision [9,18]. Therefore, arriving aircraft remain unimpeded by the system in this study.
When implementing an algorithm underlying a bird strike advisory system to predict and prevent bird strikes, the different characteristics of the opponents must be considered. First, birds are very small in comparison to aircraft. Hence, the trajectory comparison requires a high resolution and an update rate of positions to catch all potential intrusions of protected volumes. Second, the number of bird movements in the extended airport environment can be abundant, especially during migration and fledging seasons [19,20]. To achieve an efficient—and, for further research, real-time capable—implementation of the algorithm, filtering of actually threatening birds for the effective, run-time-intense trajectory comparison is highly relevant. Therefore, a two-step approach, which has been developed in earlier research, was chosen [8]. First, relevant birds are filtered in the so-called broad phase. For this purpose, the airspace is divided into a grid containing tiles with the dimensions time, latitude, longitude and altitude. Only birds that cross the same tiles as the current aircraft are forwarded to the narrow phase where the collision detection and resolution is performed in the second step.
The previous study [8] has shown that the concept of a bird strike advisory system has the potential to reduce the number of bird strikes while keeping runway capacity when assuming perfect predictability of bird movement. The imposed delays remain acceptable for almost all combinations of air traffic and bird movement mixes. Only when combining very high densities of air traffic and birds, 7% of the generated delays exceeded an acceptable value. The acceptability threshold was set to ten minutes to keep the ability to comply with potentially imposed Air Traffic Flow Management (ATFM) slots [21]. Since it is expected that the number of alerts, and consequently delays, rise when considering the uncertainty in bird predictability, prioritization of interventions was recommended.
For this reason, the algorithm presented here targets at birds outside the reach of action of WCU. An initial analysis on the radar data used for this study revealed two main categories of birds. The first kind is birds lingering close or on the runway center line, showing erratic flight behavior. Representative tracks are depicted in Figure 1a. In reality, these are taken care of by the WCU.
In addition, the bird data which serves as input for this study originates from Eindhoven airport in the Netherlands, which handles very low traffic densities. In the years 2015 and 2016, in which the data was gathered, 80 to 120 military and civil movements took place per day (Bird Strike Database, Royal Netherlands Air Force. Hans van Gasteren, 20 October 2020, personal communication). On airports with low aircraft activity, more bird activity on or close to the runway is to be anticipated—also with comparable efforts of the WCUs, as impressively demonstrated during the heavy traffic reductions during the COVID-19 pandemic [22,23,24]. However, the scope of this study lies on airports with medium and high traffic intensities where less birds would be expected around the runway due to the dispersal effect of aircraft themselves. Hence, these lingering birds are considered to be overrepresented in the input data. Since bird reaction to nearing aircraft is not accounted for in the algorithm, a high number of alerts for these birds and thus a bias in the results is expected. Therefore, lingering birds are disregarded by the bird strike risk algorithm.
The second category of birds contains the ones that cross the extended runway center line as illustrated in Figure 1b. These are the birds which can hardly be reached by the measures of WCU and where the expected safety benefit of a bird strike risk algorithm is. Consequently, the algorithm focuses on preventing strikes with these crossing birds. Moreover, it targets strikes that are likely to cause damage to aircraft since these impact aviation safety and operations the most.

2.1.1. Structure

The process within the bird strike risk algorithm is structured into a filtering broad phase and a narrow phase. In the narrow phase, the prediction of bird movement, the calculation of risk and the actual collision detection and resolution take place. Figure 2 shows the different steps. In an initial step, the grid used in the broad phase is set up and the bird positions of all birds present on the current day are stored in the tile. For this study, only the bird information available at the time of intended take-off will be made available to the algorithm. The filled grid as well as the air traffic flight plan serve as input for the bird strike risk algorithm which is executed per departing aircraft.
In the broad phase, the algorithm determines which tiles the departing aircraft will cross along its flight path. Thereafter, the birds with positions in these as well as adjacent tiles are categorized and filtered for crossing birds. To qualify as crossing, a bird needs at least two position recordings and a heading towards the runway to be classified, respectively. This is a relatively open criterion to ensure that all potentially threatening birds are considered.
The birds identified as crossing birds are forwarded to the narrow phase for the actual collision resolution. If there are no crossing birds in the relevant tiles, the aircraft takes off as intended.
Within the narrow phase, the trajectories of the crossing birds are extrapolated and the Closest Point of Approach (CPA) to the aircraft trajectory is determined. This step is described in detail in Section 2.1.2.
Thereafter, the probability of interference with the aircraft trajectory and the expected severity of the collision are calculated. These steps are described in Section 2.1.3 and Section 2.1.4. If both exceed previously defined thresholds, the aircraft is delayed until the critical crossing bird passed the runway or turned away. This implementation corresponds to the situation where the aircraft is ready for departure. The controller, based on the information from the bird strike advisory system, clears the pilots for take-off or delays the provision of the clearance.
This step-by-step implementation of the risk elements probability and severity are beneficial for runtime-efficiency. In addition, it allows analysis of which consequences result from which element. The implementation corresponds to the definition of risk as product of severity and probability. Warnings are generated if both elements exceed their individual thresholds and the risk is larger than their product.
After every delay imposed due to bird strike risk, the algorithm tests whether separation minima to subsequent arrivals are still reached. If this is not the case, a departure is shifted to after the arrival and tested again for potential collisions until the risk of collision with a crossing bird stays below the acceptable limit. Subsequent departures inherit delays from their predecessors if their departure times come below the separation minimum to arrivals or previous departures.

2.1.2. Flight Path Prediction

To extrapolate the currently known part of bird trajectories in the narrow phase and to determine the CPA, simple linear regression is applied.
Since the radar sources do not provide altitude information, every bird track is assigned to a constant altitude based on empirically determined distributions [25] in the preprocessing of the data. Consequently, the bird track relevant for the predictor consists of the dimensions of time, latitude and longitude.

2.1.3. Probability Calculation

To evaluate whether a departure should be delayed due to the presence of crossing birds, the risk of a collision with each relevant crossing bird was calculated. The ICAO defines risk and particularly safety risk as the predicted probability and severity of the consequences or outcomes of a hazard [26].
Hence, the probability of the collision was determined first, followed by the calculation of the expected severity. If both values exceed given thresholds, the aircraft is delayed by the bird strike risk algorithm. This section describes the probability calculation while the subsequent section addresses the damaging aspect.
In ACAS, protected volumes around all opponents are defined and segmented into a caution area, a warning area and a collision area [14]. Due to the small look-ahead time as well as the limited size and speed of birds, only the collision area was incorporated in the algorithm. The protected volume of the aircraft resembles a cylinder with the radius corresponding to the wingspan and the height corresponding to the average height of the aircraft. In the initial version, the rear part of the aircraft was cut from the protected volume [8]. Here, it was included again to reduce the number of variables in the analysis of the probability. Birds have a disc-shaped protected plane without a height. The radius rises with bird size and, in case of flocks, number of members [27].
The probability of a collision was calculated as illustrated in Figure 3 and as described below. It depends on the expected positions of aircraft and bird at the CPA as well as uncertainty of the actual bird location. The uncertainty in arrival time at the CPA was added to account for variability in bird speed. Lateral deviations along the trajectory were taken into account by adding uncertainties to the predicted location of the CPA.
For the probability calculation, the aircraft is set as point mass moving along the runway center line. Both protected volumes are drawn around the bird, resulting in a circle with radius R. The bird is expected at its center, at the Predicted Bird Position (PBP). The actual position of the bird is defined as Actual Bird Position (ABP). The probability calculation is separated into parallel in the direction of the relative speed between bird and aircraft and a perpendicular direction. Hence, the respective distances are divided in the respective components as well. The expected offset between the PBP and the ABP is expressed as uncertainty U. The distance between PBP at the time when the CPA is reached by the aircraft is called d C P A .
The probability of collision P is then expressed as
P = ( R d C P A p a r a l l e l U p a r a l l e l ) parallel · ( R d C P A p e r p e n d i c u l a r U p e r p e n d i c u l a r ) perpendicular
Here, the uncertainty in parallel refers to the maximum observed offset between the bird’s past trajectory and the corresponding regression line d m a x , or 20 m, whichever is less. The uncertainty in perpendicular is determined by the variability in bird speed. Therefore, the time required to reach the runway from the current position at minimum and maximum speed observed along the trajectory is calculated. The difference is then multiplied by the current bird speed to obtain a distance.
With
U p a r a l l e l = m i n ( d m a x , 20 m )
and
U p e r p e n d i c u l a r = v b i r d n o m i n a l · ( t m a x t m i n )
and
R = R P V a c protected volume aircraft + R P V b i r d protected volume bird
the probability of collision is calculated as
P = ( ( R P V a c + R P V b i r d ) d C P A p a r a l l e l d m a x ) parallel · ( ( R P V a c + R P V b i r d ) d C P A p e r p e n d i c u l a r v b i r d n o m i n a l · ( t m a x t m i n ) ) perpendicular
Since the regression line of the bird crosses the runway and thus passes the CPA, the distance between PBP and CPA is zero at the expected time of collision. Consequently, the equation simplifies to
P = ( ( R P V a c + R P V b i r d ) d m a x ) parallel · ( ( R P V a c + R P V b i r d ) v b i r d n o m i n a l · ( t m a x t m i n ) ) perpendicular

2.1.4. Severity Calculation

To prove their airworthiness, various aircraft components must demonstrate resistance towards the impact of bird strike before being certified by the aviation authorities [28]. For all components to be tested, the determining criterion to pass the tests is represented as a kinetic energy. Therefore, kinetic energy served as input for the calculation of expected severity in this study. The certification requirements by the European Aviation Safety Agency (EASA) were used as reference since they provide a benchmark for comparison. Since the focus of the study lies on commercial aircraft, the requirements for Large Aeroplanes [29] were referred to. Impact resistance to different numbers and sizes of birds has to be demonstrated for windshields and the structure. In addition, the engines must undergo engine ingestion tests [30]. The criteria for the different aircraft components are presented in Table 1.
The strictest regulations concern the engines. They demand that the engine must withstand the kinetic energy defined in Table 1 without resulting in a Hazardous Engine Effect. This definition includes, among others, uncontrolled fire, significant thrust in the direction opposite to that requested by the pilot or complete inability to shut the engine down [30].
Kinetic energy is defined as
E k i n = 1 2 · m · ( v ) 2
with m equals to mass and v to velocity.
In the context of the certification requirements, the mass of the bird(s) involved and the aircraft velocity are relevant. The bird mass to be used within the certification requirement test depends on the specific test conditions, i.e., the size of bird and individual or flocking bird as well as the surface of the engine inlet throat. The highest and thus most critical test mass from the test conditions of 2.7 kg was selected as reference for this study [30].
To determine the expected kinetic energy and thus the severity of a predicted bird strike within this study, the expected aircraft velocity at the CPA and the bird weight obtained from the processing of bird information served as inputs.

2.2. Specifications

The bird strike risk algorithm was configured as follows. Since aircraft trajectories are expected to be perfectly predictable, they were logged in the simulation tool BlueSky Open Air Traffic Simulator developed by TU Delft [32]. Here, all aircraft were of the very common type A320-200 and their performance was calculated using the Base of Aircraft Data (BADA) model, version 3.12 [33]. During lift-off between 0 m and 15 m altitude, trajectories were logged with a frequency of 10 Hz, to account for rapid changes in altitude occurring in that phase. The remaining part of the trajectories was logged with a frequency of 2 Hz. Between logged positions, linear interpolation was performed for both aircraft and birds.
The tile dimensions of the grid used to filter birds in the broad phase amounted to 1000 m for lateral width and 33 m for height. Recordings of bird tracks from an avian and a weather radar were used as inputs to be stored in the respective tiles (cf. Section 2.3.2). According to the manufacturer of the avian radar, tracked birds are expected to have landed if not observed for the past five seconds (Remco Kabos, Robin Radar, personal communication on 26 May 2020). Within the implementation of the algorithm, a safety buffer of five seconds was added. Weather radar birds were considered if they have appeared at least once within the last ten minutes to account for their low update rate.
The protected volumes defined for aircraft have a radius of 25 meters and a height of 1.01 m, representing the values for narrow body aircraft [27] as used in this study. The expansions of protected panes for birds depend on their weight category and, for flocks, number of members [27].
To determine a threshold for the probability from which on aircraft would be delayed, the probabilities of conflicts for one million combinations of the parameters involved in Equation (6) were performed. Here, the ranges for the individual parameters were obtained from historical data. The resulting probabilities can be found in Figure 4a. It was decided for 0.3 as threshold as this is relatively low and thus conservative to achieve a sufficient number of prevented strikes. Hence, with that setting, approximately 25% of strikes involving crossing birds would exceed the threshold and be prevented by the algorithm, as can be retrieved from Figure 4a. Consequently, the impact of the algorithm on capacity will be relatively high.
Regarding the kinetic energy criterion, it can be expected that already smaller impacts lead to damage, if not life-threatening one. To define a reasonable threshold, the magnitude of impacts observed in previous simulations was evaluated [27]. Their distribution as well as the comparison to the engine certification criterion are shown in Figure 4b. Here, 0.3 was selected as threshold as well. This is a conservative threshold. However, since even minor strikes cause operational and repair costs [2], these should be considered by the algorithm.
When multiplying the factors of probability and severity to correspond to risk, a risk threshold of 0.09 results. Consequently, aircraft are held back, if the probability and severity of a strike each exceed values of 0.3 and the resulting risk is higher than 0.09.

2.3. Evaluation Experiments

To evaluate the bird strike risk algorithm as described in the previous section, an approach involving Monte Carlo simulations was pursued which is outlined subsequently. Thereafter, the input data as well as the specifications of the simulations are presented.

2.3.1. Analysis

The following three steps were performed for the analysis of the bird strike risk algorithm. First, initial flight plans with various traffic intensities and patterns were simulated alongside bird movement from various days in fast-time in the BlueSky Open Air Traffic Simulator. The tool can represent aircraft as well as bird movement and record bird strikes [27,32]. With this step, the strikes to be prevented and as such the safety potential was determined.
Second, the algorithm was run for these combinations of flight plans and bird movement. From the resulting rescheduled flight plans, the impact of the algorithm on capacity and the delays induced could be obtained.
Third, the rescheduled flight plans were simulated alongside the bird movement in BlueSky to test for the number of strikes remaining after bird strike avoidance. In addition, false alerts were analyzed. They were identified by comparing the strikes prevented with the strikes that took place prior to the intervention of the algorithm.
It was hypothesized that the algorithm reduces the number of bird strikes with crossing birds. Since lingering birds are disregarded, the average number of strikes involving these birds should stay constant.
The thresholds for intervention are set conservatively. Hence, also birds with a small risk of collision can cause delays. Still, due to focusing on crossing birds, the delays should remain within tolerable limits.

2.3.2. Input Data and Specifications

To obtain representative results, flight plan data was randomized and tested for bird movement information from various seasons.
Previous analyses showed that the impact of the algorithm on capacity is most critical for large traffic intensities [8,27]. In this study, scenarios with 500 and 900 flights per day were tested, representing medium and high traffic intensities, respectively. To obtain representative results, flight plans for the two intensities were randomized. Therefore, 1000 randomizations for the four departure shares of 25%, 50%, 75% and 100% were performed by following a procedure presented earlier [8]. A minimum separation of 66 s had to be kept between flights to allow high density traffic schedules to be handled within the set airport opening hours of 18 h per day.
Bird data was obtained from two radar sources. For the direct airport environment and up to 200 m, the avian radar installed at the time of the initial studies at Eindhoven airport in the Netherlands served as source. This radar delivers two-dimensional and categorized tracks of which the ones for small, medium, large birds and flocks were considered. Constant bird altitudes were assigned based on historic observations [25]. For higher altitudes beyond the range of the avian radar, data from the weather radar in De Bilt, also in the Netherlands, was incorporated. Weather radar can be filtered and processed to receive bird densities [34]. Since the weather radar data is used from 200 m upwards, the birds included in that data are likely to follow relatively straight tracks, either for daily commuting or during seasonal migration [35]. Hence, for the initial study presuming perfect bird predictability, these birds were modelled to fly straight and at constant velocity [36]. For the present analysis, the following uncertainty elements were included to reduce the predictability. The weather radar data is updated in five-minute intervals and average bird directions and velocities can be retrieved [34]. For every update time, the birds present were assigned to a new velocity and direction. To further increase the unpredictability, the actual update time of every bird was varied. A normal random distribution was used for all variations. The possible range for velocities lies within the observed standard deviations of 6 m/s, or 1 m/s, should the randomly picked value fall below that. The heading change was distributed ± 15 around the average heading change observed by the radar [37]. The appointed update times lay in a range of 90 s around the actual update time. The assignment of flight altitudes, bird mass and number of birds in flocks was described earlier [36]. Eventually, the processed bird data which served as input for the bird strike risk algorithm contained time-stamped information about location, bird category and corresponding mass, current heading and current velocity.
In initial studies tracks up to 1000 m, where the risk of bird strikes is highest, were integrated [3,8,27]. However, the validity of the bird tracks incorporated from the weather radar data is limited since they are artificial. In addition, while there are many birds present in that airspace layer, only a few of them cause collisions, as Table 2 displays. Although most birds included in the simulations fly above 200 m, it is the birds below that altitude that most often cause collisions [27]. Consequently, to include weather radar birds with a representative share without challenging memory-requirements too much, weather radar birds are considered from 200 m to 400 m. Since the number of birds present on a day is not a sufficient predictor for the number of strikes on that day [27], bird movement information was chosen based on number of generated strikes. Days on which the maximum number, the average number and the lowest number of strikes have been observed in previous experiments were chosen to represent seasonal variability in bird abundance. Therefore, the bird movement information varies in bird strike risk rather than number of birds present. The selected days were 10 January 2016 for low, 14 October 2015 for medium and 5 June 2016 for high bird density when combining with high air traffic scenarios and 10 January 2016 for low, 25 August for medium and 5 June for high bird density when combining with medium air traffic scenarios.
To evaluate whether the results of the algorithm are reproducible, 80% of all flight plans per departure share were tested for the bird movement described above in the baseline. The remaining 20% of flight plans were tested for additional bird movement information in the validation. For comparability, the additional bird data was gained from days of the same weeks as the data used for the baseline. This separation resulted in 9600 scenarios for the baseline and in 2400 scenarios for the validation.

3. Results

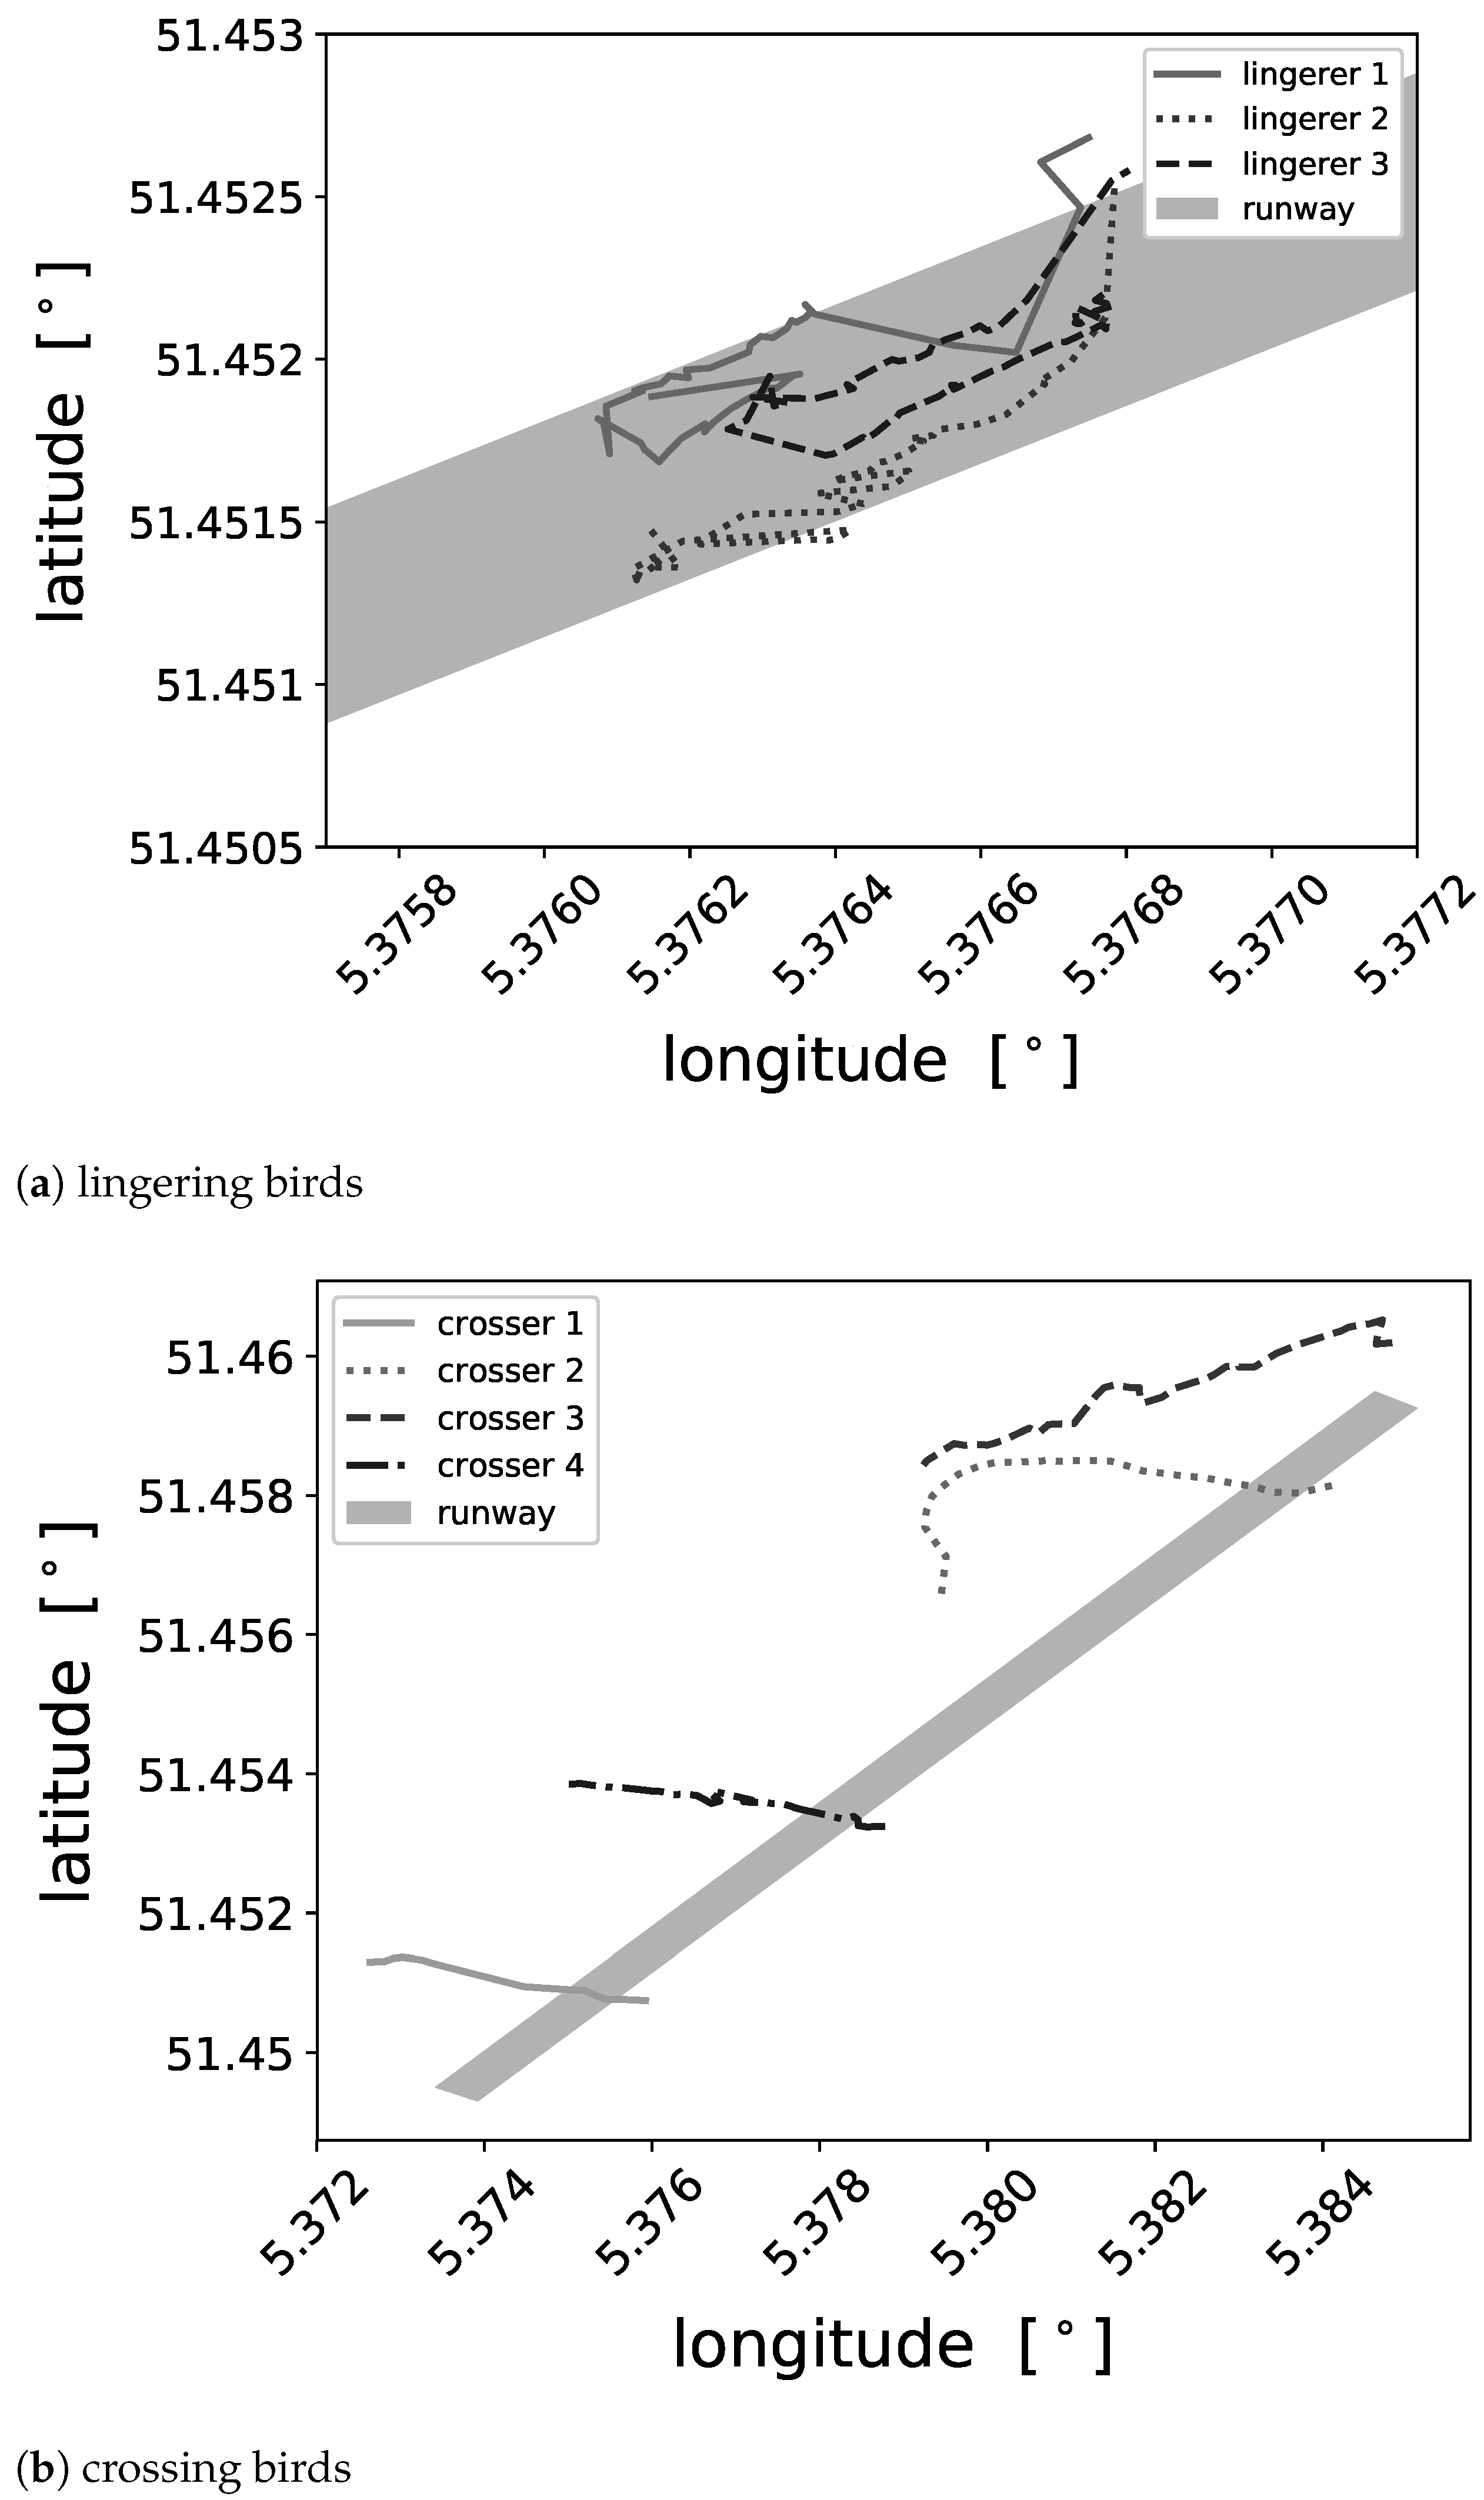
In this study, the effects of a bird strike advisory system on the safety and the traffic flows of an airport were evaluated. The bird strike risk algorithm underlying the system focuses on preventing strikes with birds crossing the runway which are expected to cause damage to the aircraft. Birds lingering on or close to the runway are excluded. The limitation to prevent potentially damaging strikes was performed to find a balance between safety and capacity, limiting the induced delays to a reasonable level.
The number of interventions and the resulting delays were considered first. The overview is provided by Figure 5. The average number of delays and the distribution of their duration is comparable between the baseline and the validation. Delays above ten minutes and as such above a tolerable level were outliers. Their share amounted to 0.8% of delays in the baseline and 0.5% in the validation. All aircraft of all scenarios were able to depart within the designated airport opening hours. Hence, the capacity was not impaired.
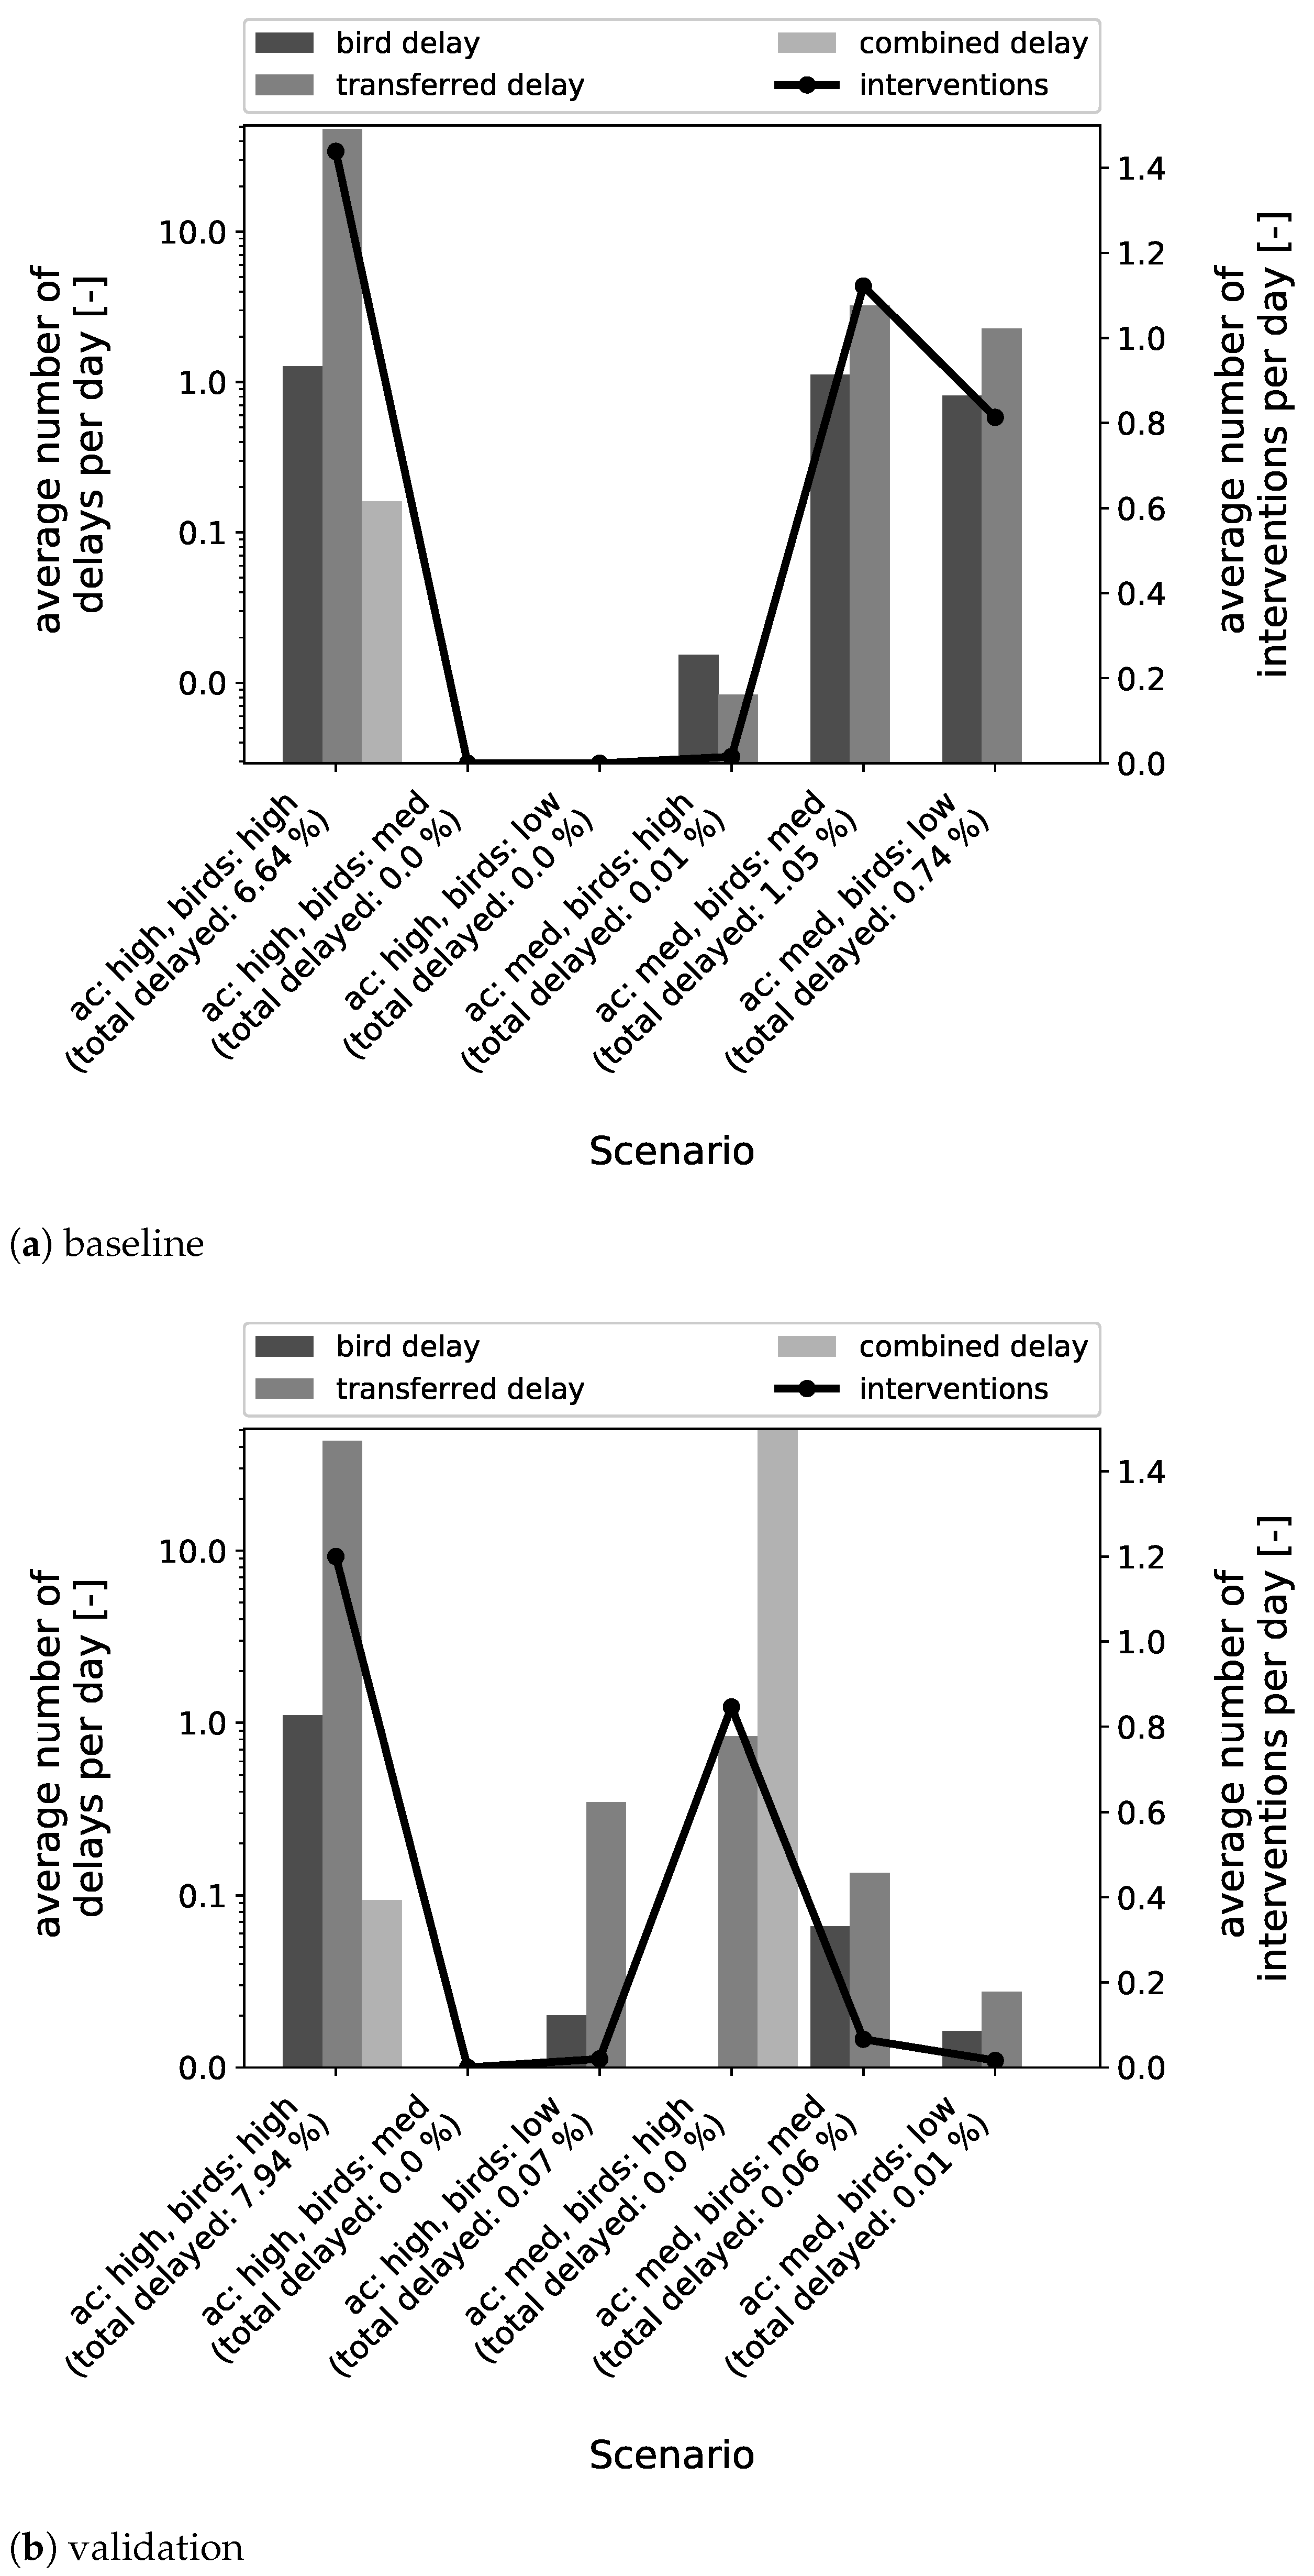
To gain more insight into the origin of delays, Figure 6 depicts the average number of interventions per day and scenario as well as the average number of generated delays. The average number of interventions per day and scenario is very low. In some scenarios, even no intervention at all took place. One intervention by the algorithm results in up to six delays in total. The delays additional to the ones caused to prevent a bird strike (bird delay) are delays inherited from a previous departure (transferred delay). If an aircraft with a transferred delay receives a bird delay, it is called combined delay. Transferred and combined delays especially appear in the high air traffic scenarios, where the flight plans are denser, and a rescheduling of a departure is more likely to penetrate separation minima to subsequent aircraft. With the exception of the combination of medium air traffic intensity with high bird strike risk in the baseline, more inherited delays than bird delays take place.
To evaluate whether an intervention by the algorithm was successful, aircraft with a bird delay and without any inherited delay from a previous departure were considered. These had the same intended take-off times in the original and the revised flight plans. Therefore, they experienced the identical bird situation, which made them comparable. Testing whether these aircraft experienced a bird strike after having received a bird delay in the revised flight plan served as measure for successful interventions. For both the baseline and the validation, the share of comparable flights amounted to 95%. The algorithm prevented 139 collisions with crossing birds in the baseline and 9 in the validation. In the baseline, three of these flights experienced a strike with another bird than the targeted one. All other departures delayed due to bird strike risk departed collision-free. All comparable correct interventions were successful with respect to the target birds.
The bird strike rates for the original as well as the revised flight plans can be found in Table 3. In the baseline, the strike rates slightly increases by 0.8%. In the validation, it decreases by 0.2%. When normalizing the number of prevented strikes by 10,000 flights, similar to the bird strike rate, the baseline has a prevention rate of 70 and the validation of 20. Still, the bird strike rates in the baseline are higher than in the validation.
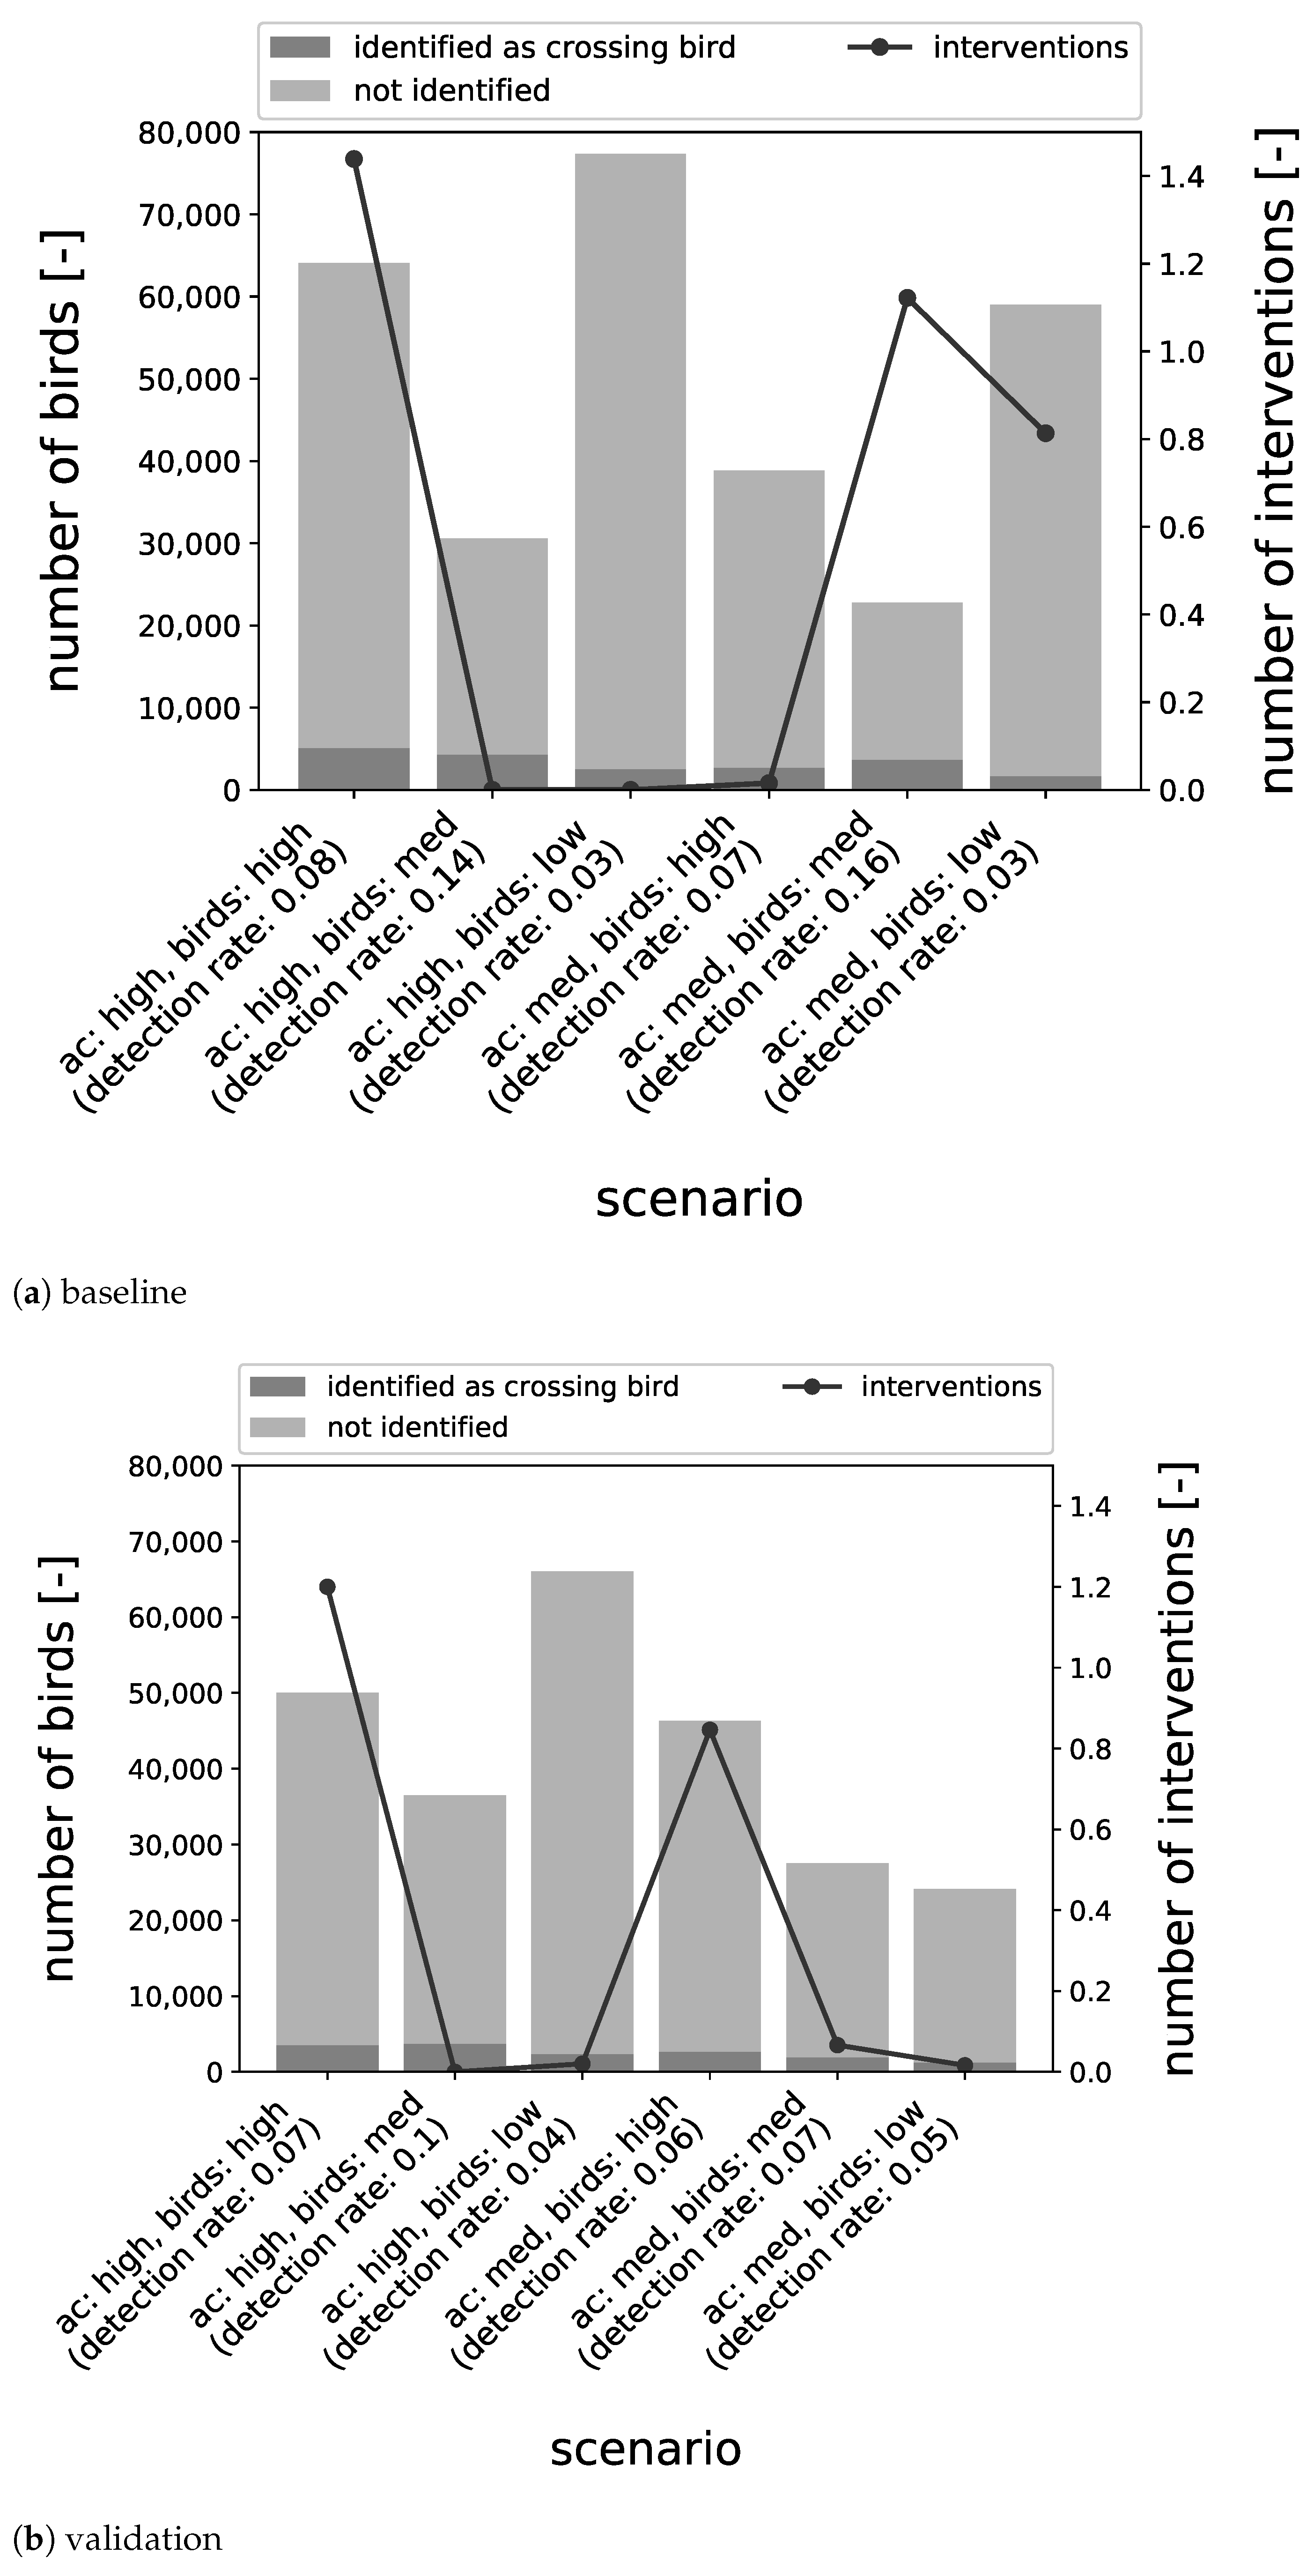
To analyze these opposing trends, the number of interventions were compared against the number of birds present in the airspace as well as the ones identified as crossing birds. The results are presented in Figure 7. It must be noted that the bird scenarios were selected based on the strike risk they hold rather than number of birds (see Section 2.3.2). The number of interventions and the number of birds present do not correspond well. For example, most birds occur in the combination of high air traffic intensity and low bird density in the baseline and the validation, but (almost) no interventions take place. Also, between the number of identified birds and number of interventions, there is limited consistency only. Moreover, even though the corresponding bird densities in the baseline and the validation originate from the same calendar weeks, numbers of birds as well as the detection rates vary.
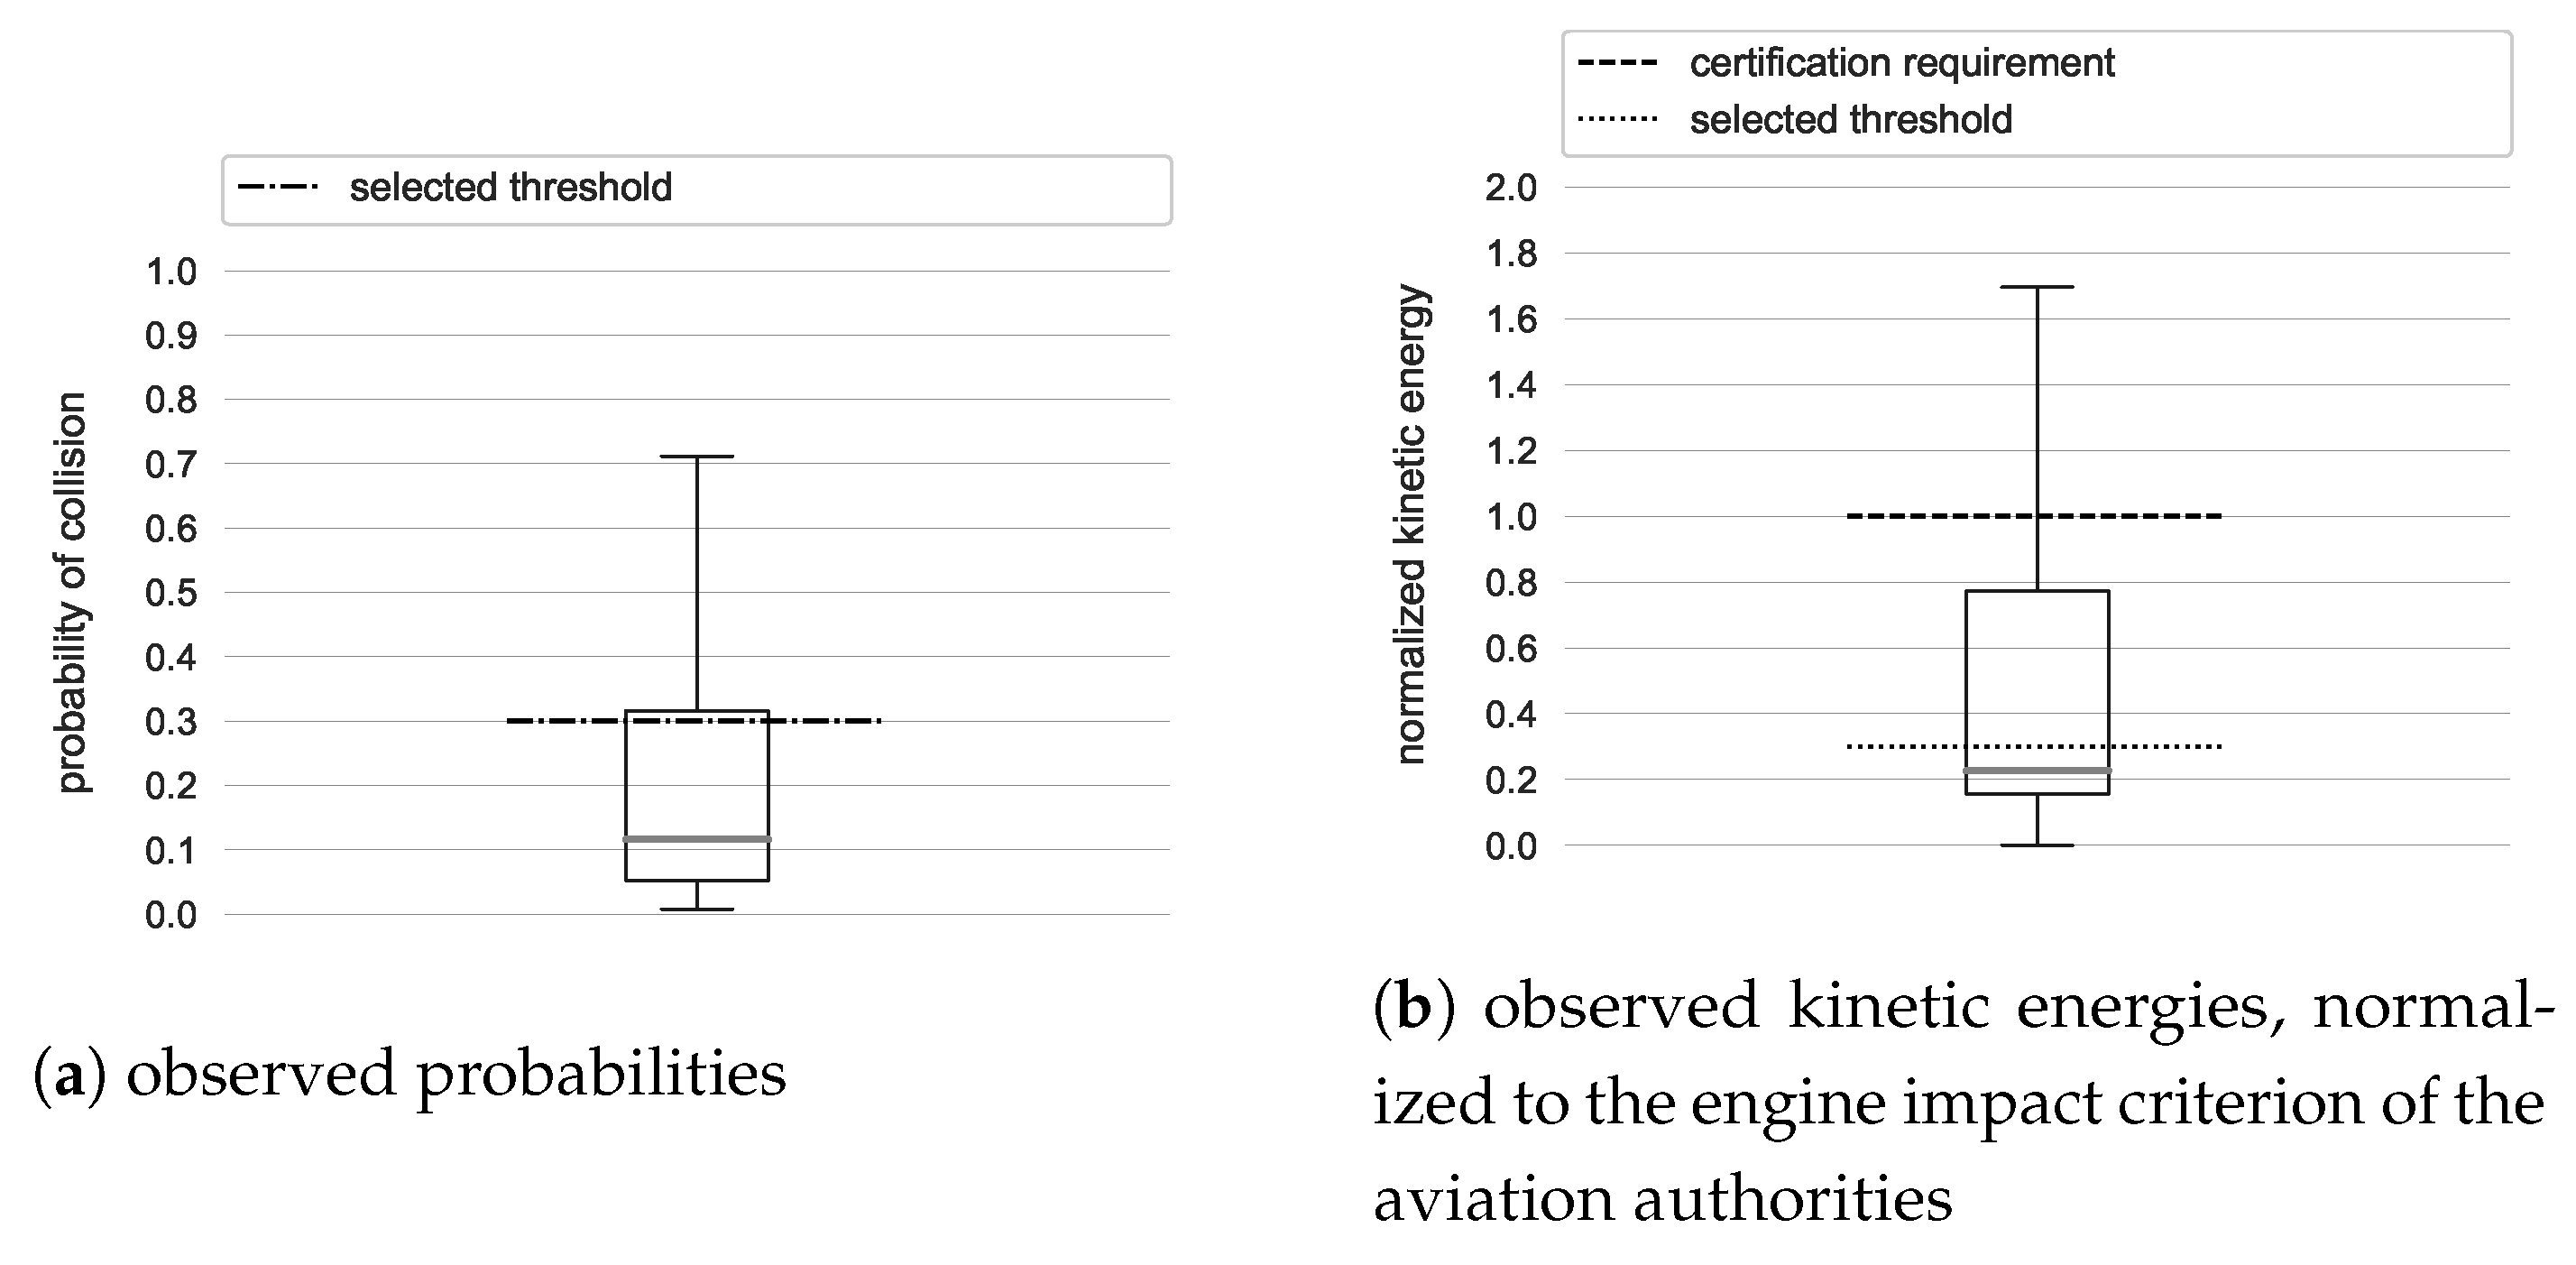
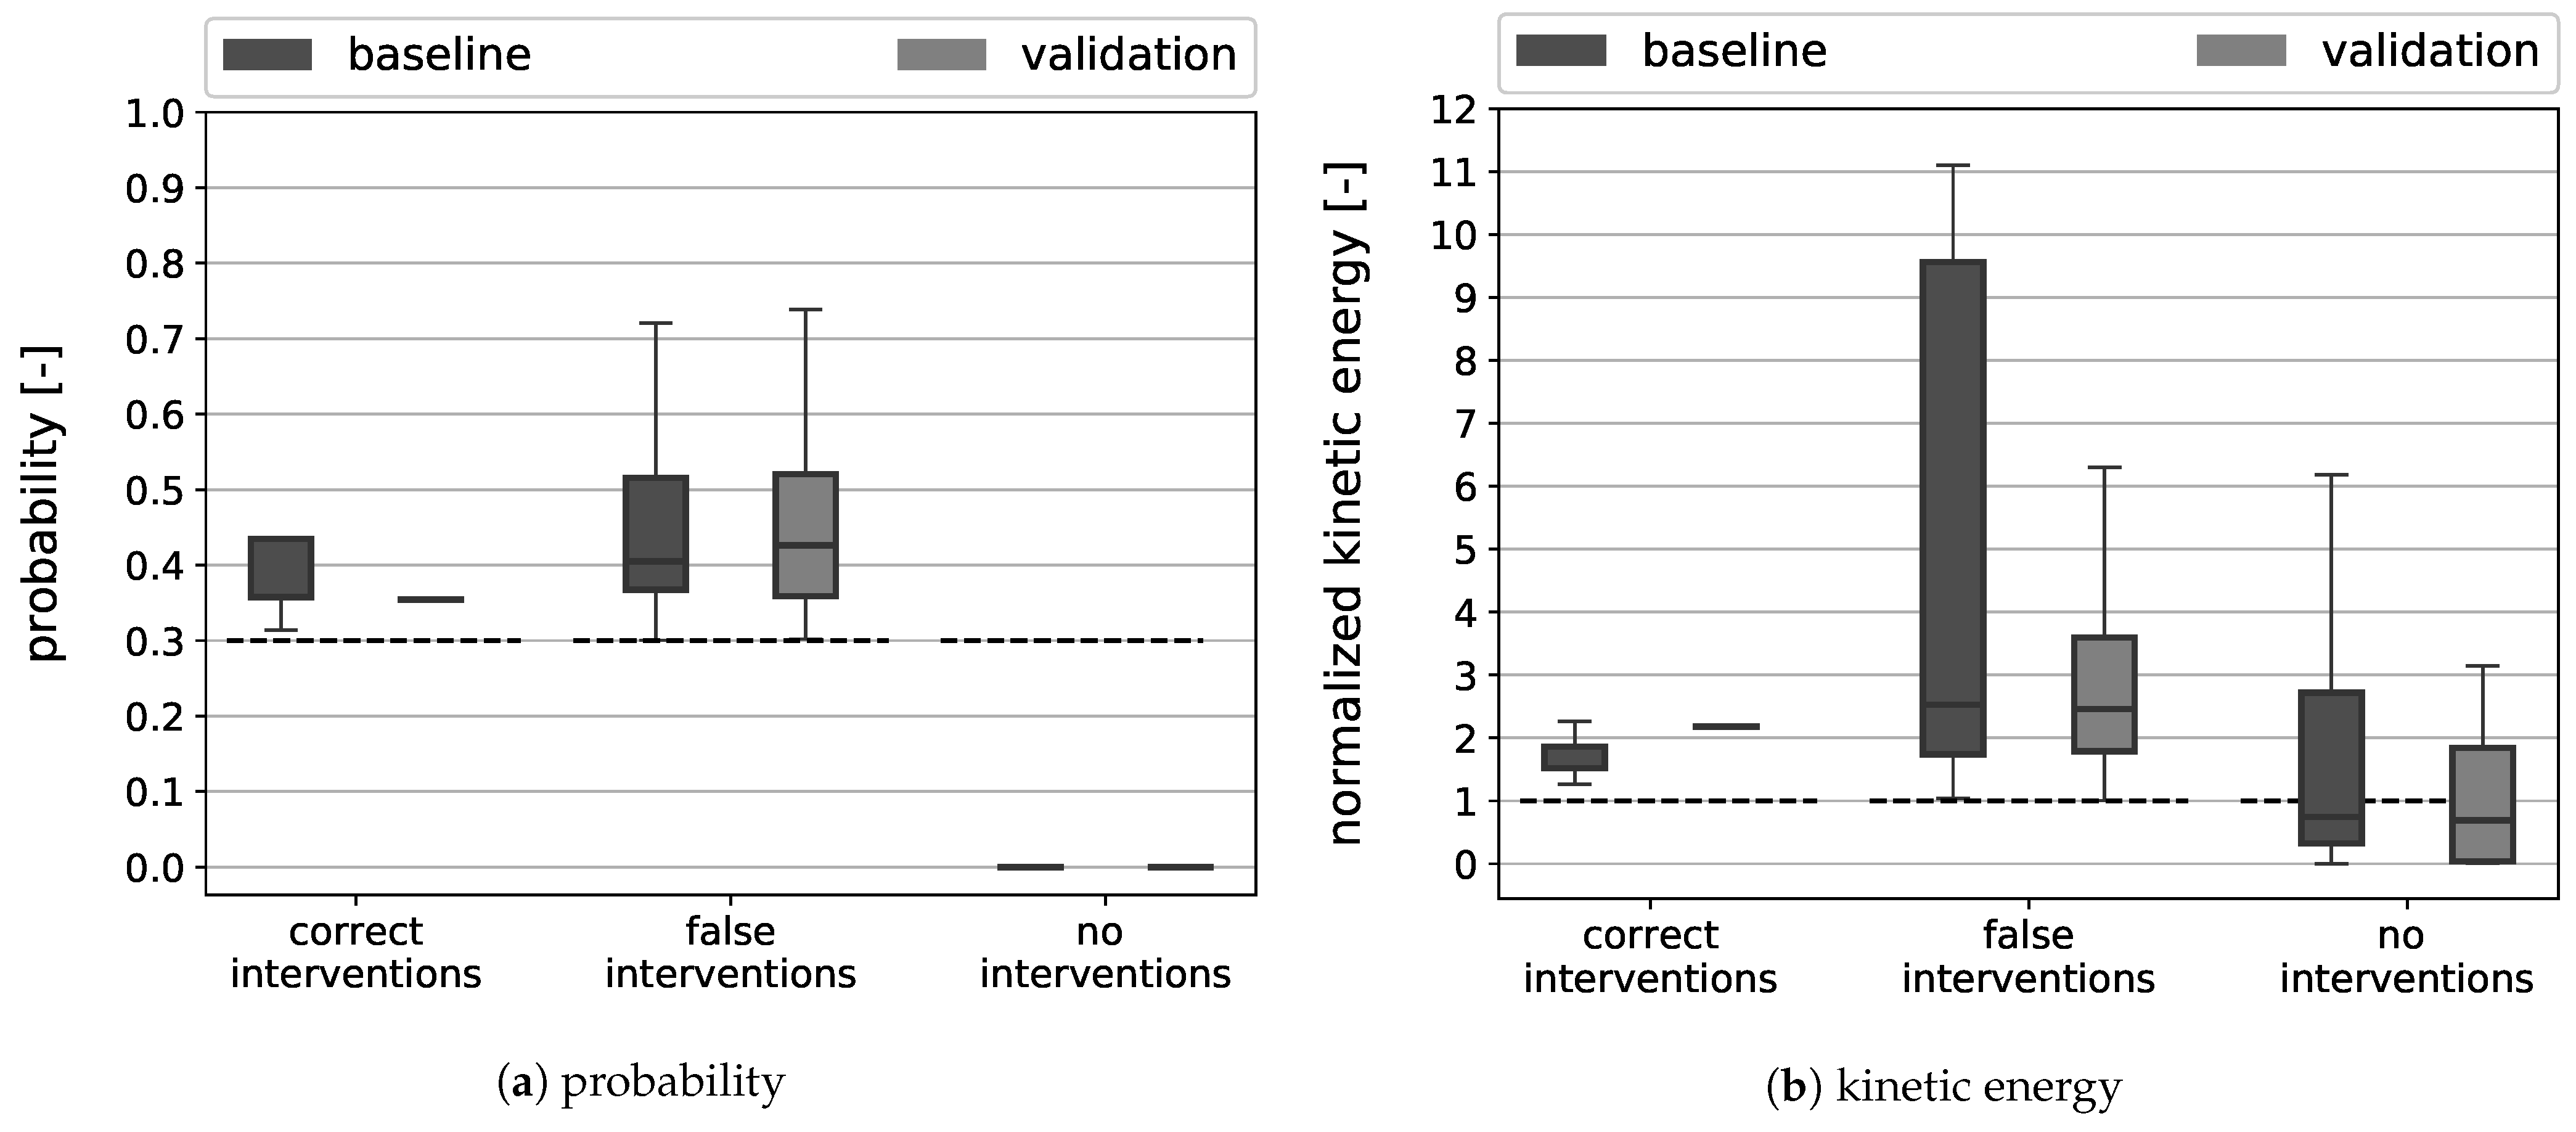
The decision to delay an aircraft depends on the determined values for risk as well as its factors probability and severity. If the three of them exceed the selected thresholds, an algorithm intervention is triggered. To evaluate the resulting interventions in detail, the analysis is performed individually for the probability and the severity. Their distribution for strikes where the algorithm intervened correctly or falsely are shown in Figure 8. Moreover, the distributions where the algorithm did not intervene, and the aircraft then collided with birds are presented. Figure 8a depicts the distribution of probabilities. They all are above the triggering threshold of 0.3 for correct and false interventions, as required for the triggering of the algorithm. The spreads are larger for false alerts, reaching higher probabilities than in the case of correct alerts. They are comparable between baseline and validation in case of false alerts. For correct alerts, the spread is much smaller for the validation than for the baseline. For missed strikes, the probabilities were just slightly higher than zero and as such far below the threshold to trigger an intervention.
Figure 8b illustrates the second risk element, the severity of strikes. Here, the predicted kinetic energy was normalized with the kinetic energy required to trigger an algorithm intervention. Hence, the threshold lies at one. The spreads of the baselines are higher than for the validations for all three alert types. In the case of correct alerts, the lower boundary of the predicted kinetic energies lies higher than for false alerts. The majority of strikes that were missed by the algorithm did exceed the threshold of kinetic energy. However, due to the small predicted probabilities as seen in Figure 8a, no intervention took place.
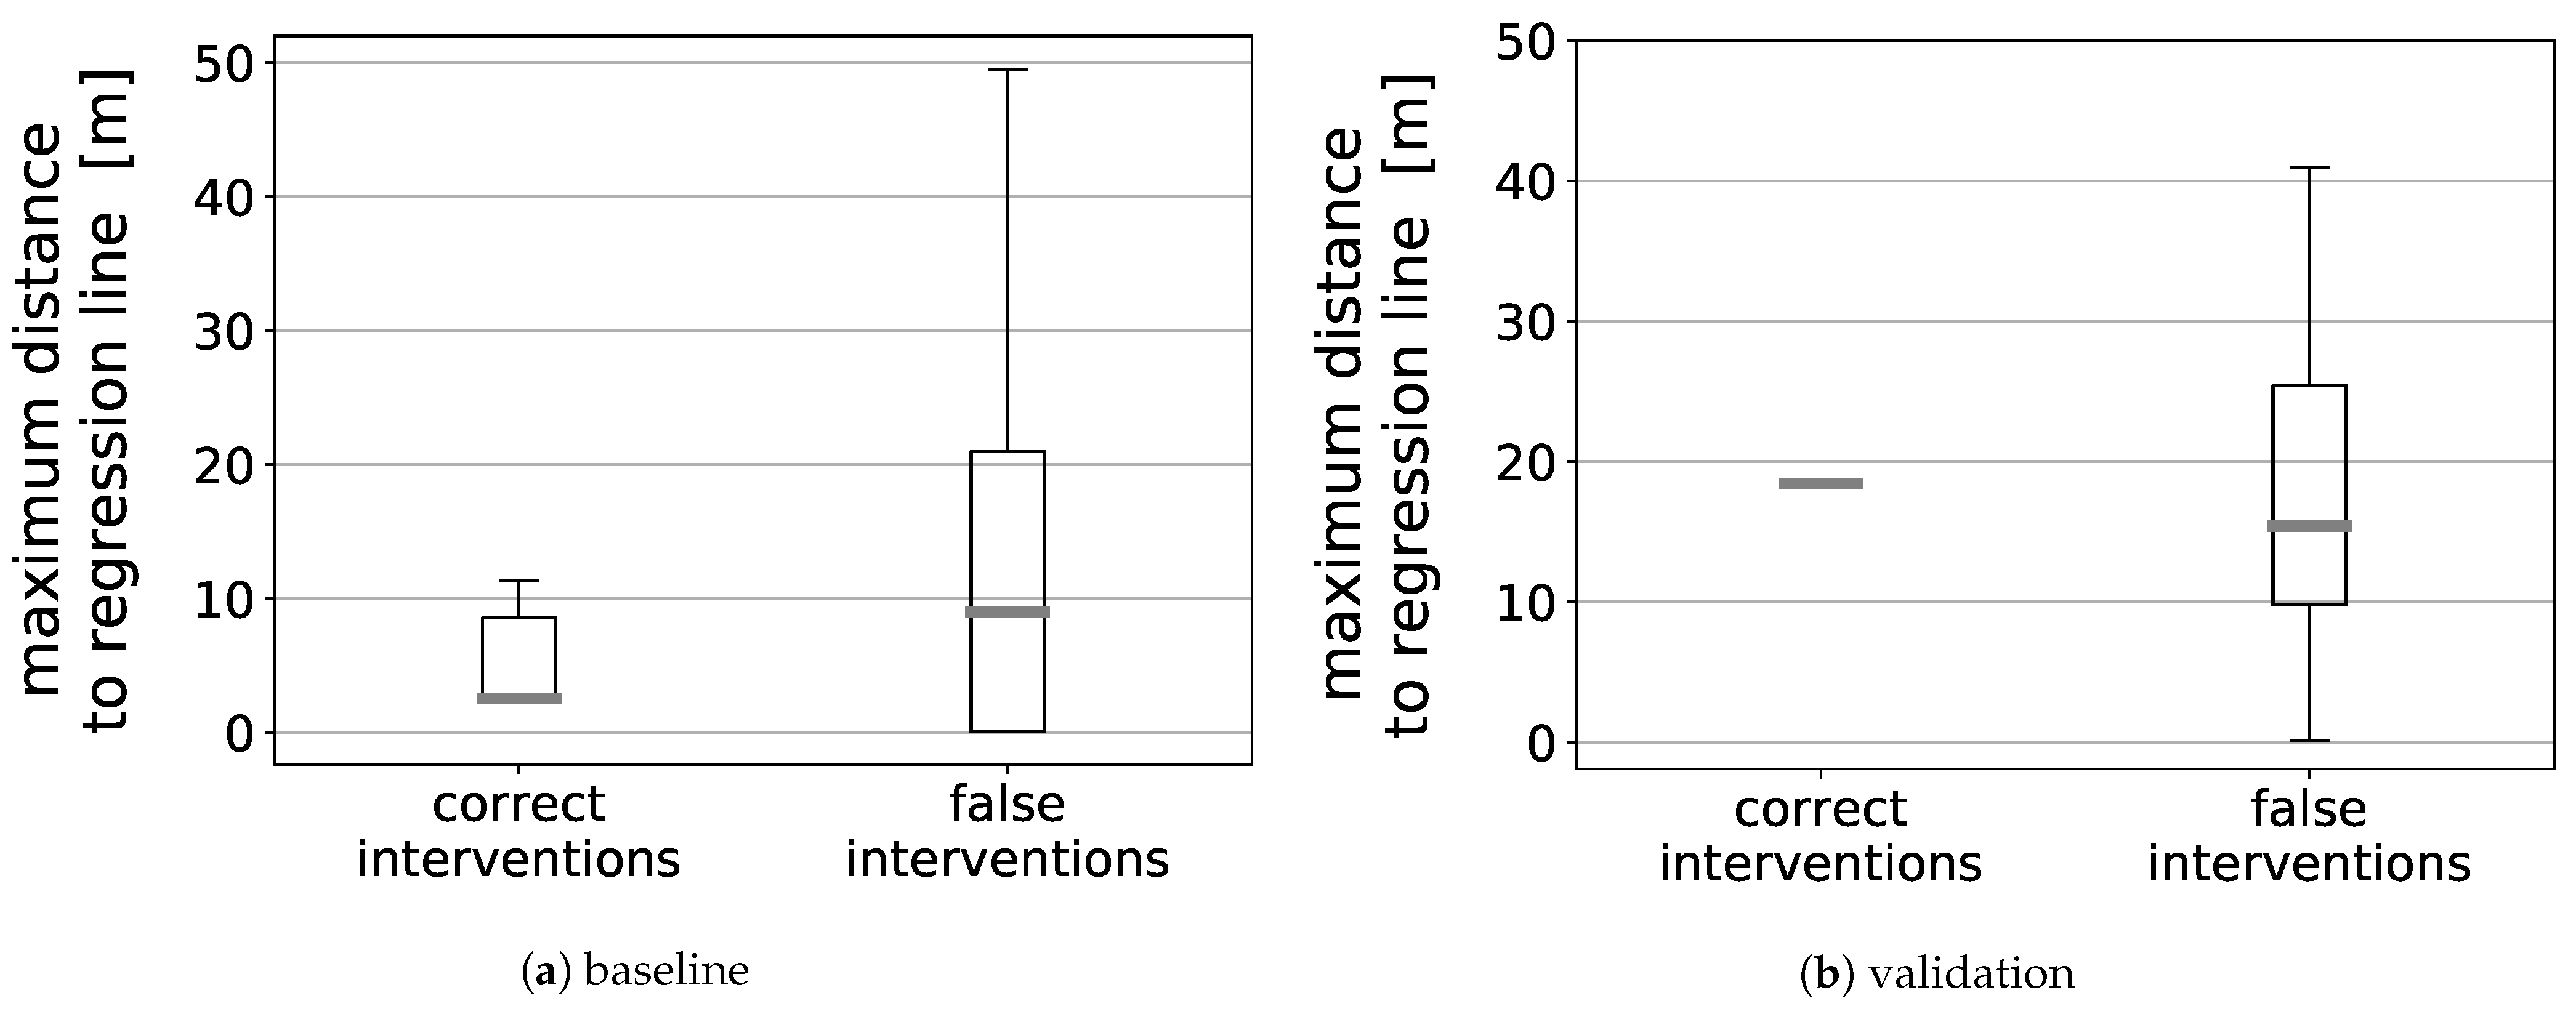
Finally, the quality of bird movement prediction which underlies the determined probability of a strike was evaluated for correct and false alerts. As introduced in Equation (6), the probability of collision depends on the maximum distance from the regression line d m a x and the variation in bird speed along the trajectory. The latter is expressed as time interval in which the bird is expected to cross the aircraft trajectory. To analyze the precision of predicted bird location, the maximum perpendicular distances between the bird positions known at the time when the future trajectory was predicted and the regression line, d m a x , were analyzed. Their distributions for correct and false alerts are illustrated in Figure 9. For both alert types, there is a wider spread at a lower level in the baseline than in the validation. Although the distributions of false alerts are to some extent comparable between the baseline and the validation, the distribution for correct alerts is much wider in the baseline, with a relatively high median of ca. 20 m in the validation. 
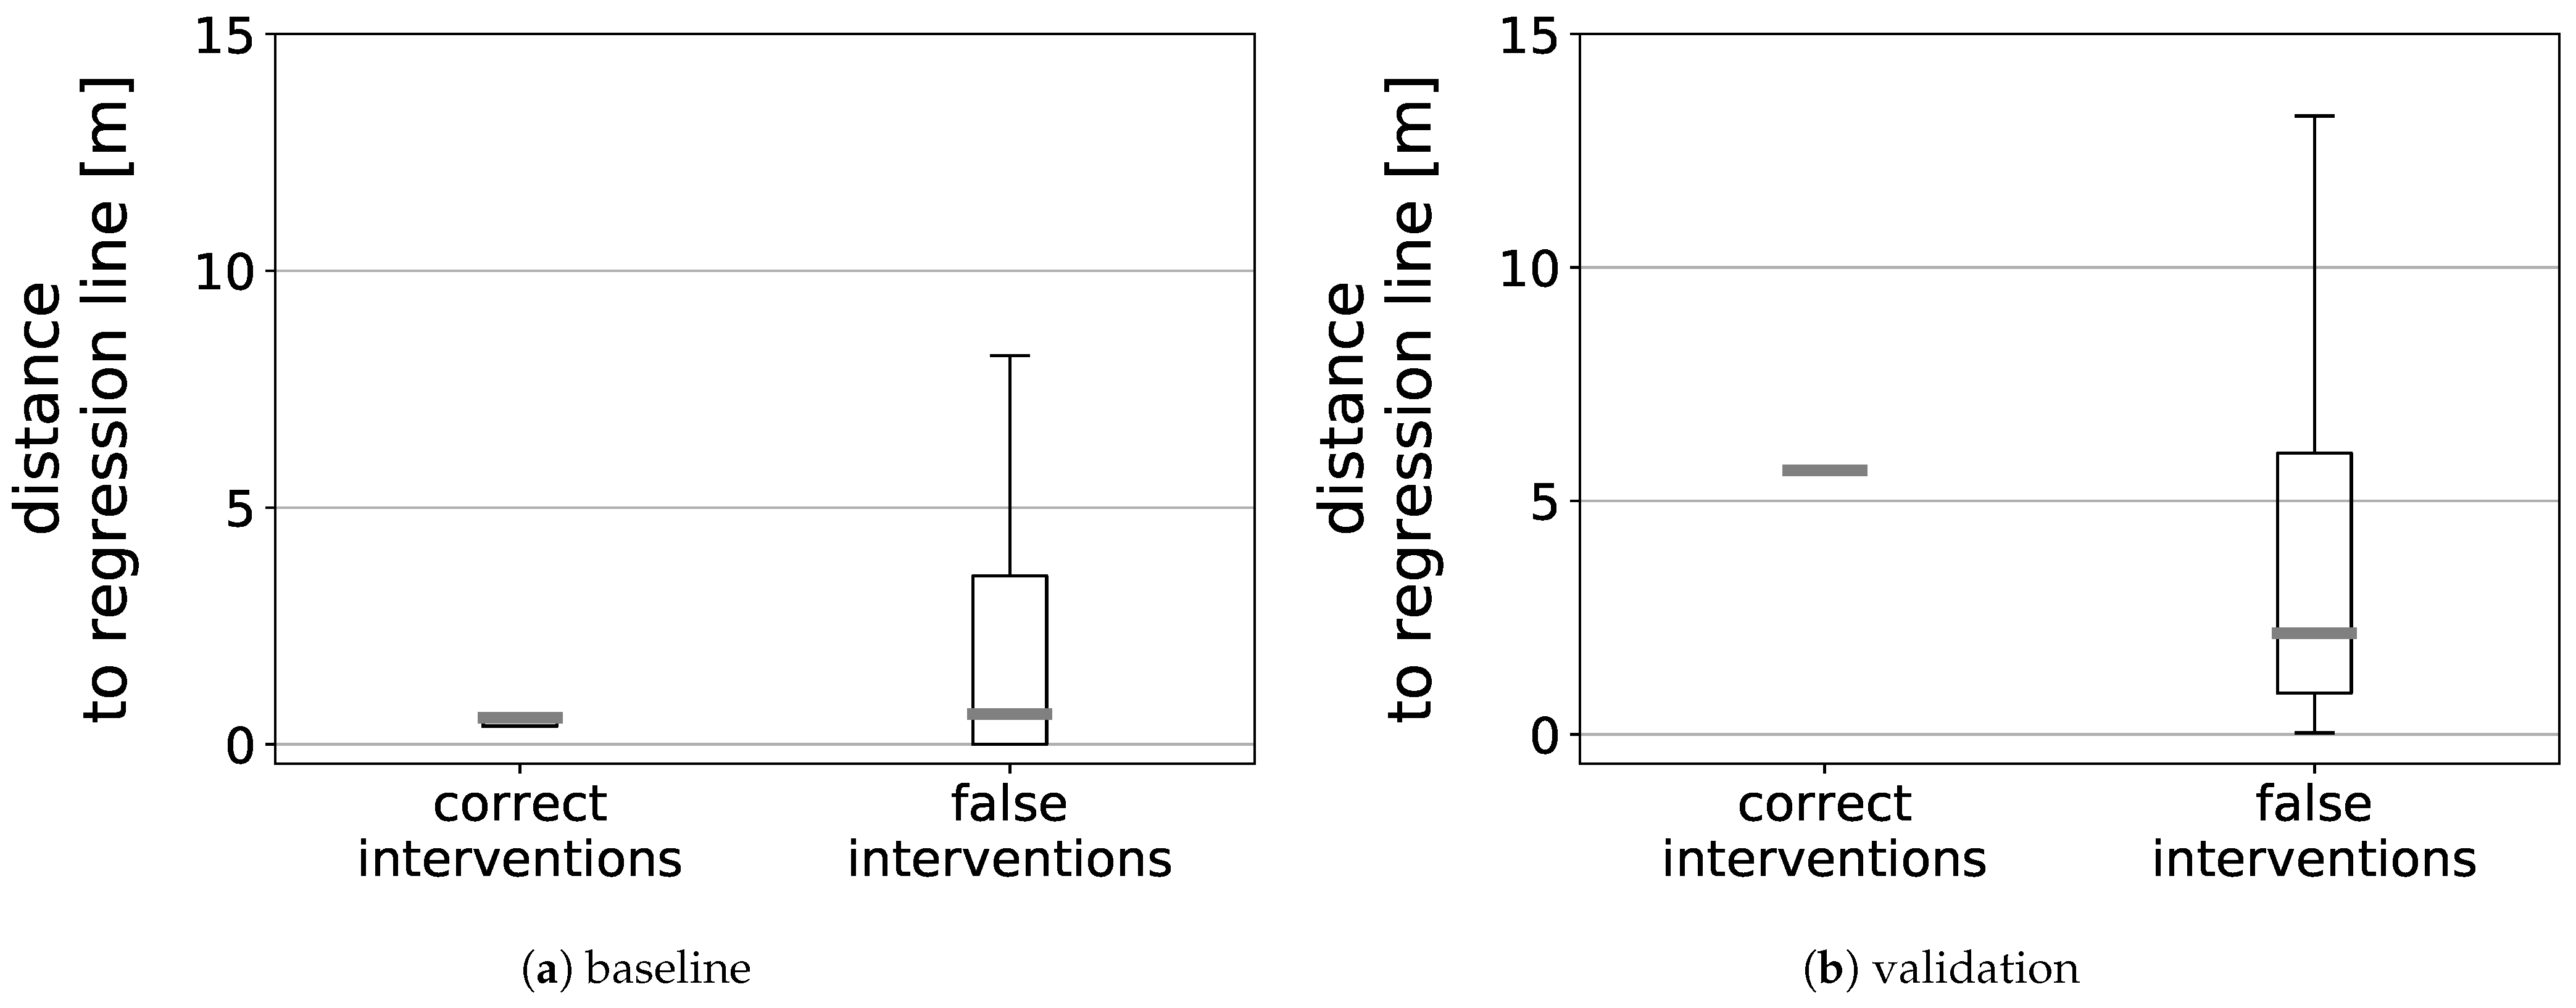
Figure 10 shows, how far from the regression line the bird was at the time of the CPA. In the baseline, the birds causing correct alerts are much closer to the regression line, with a small spread of values only. Also in for false alerts, the spread is smaller in the baseline than in the validation. However, here, the majority of birds triggering false alerts are closer to the regression line. The majority of offsets for false and correct alerts lay well below ten meters. All offsets were smaller than d m a x .
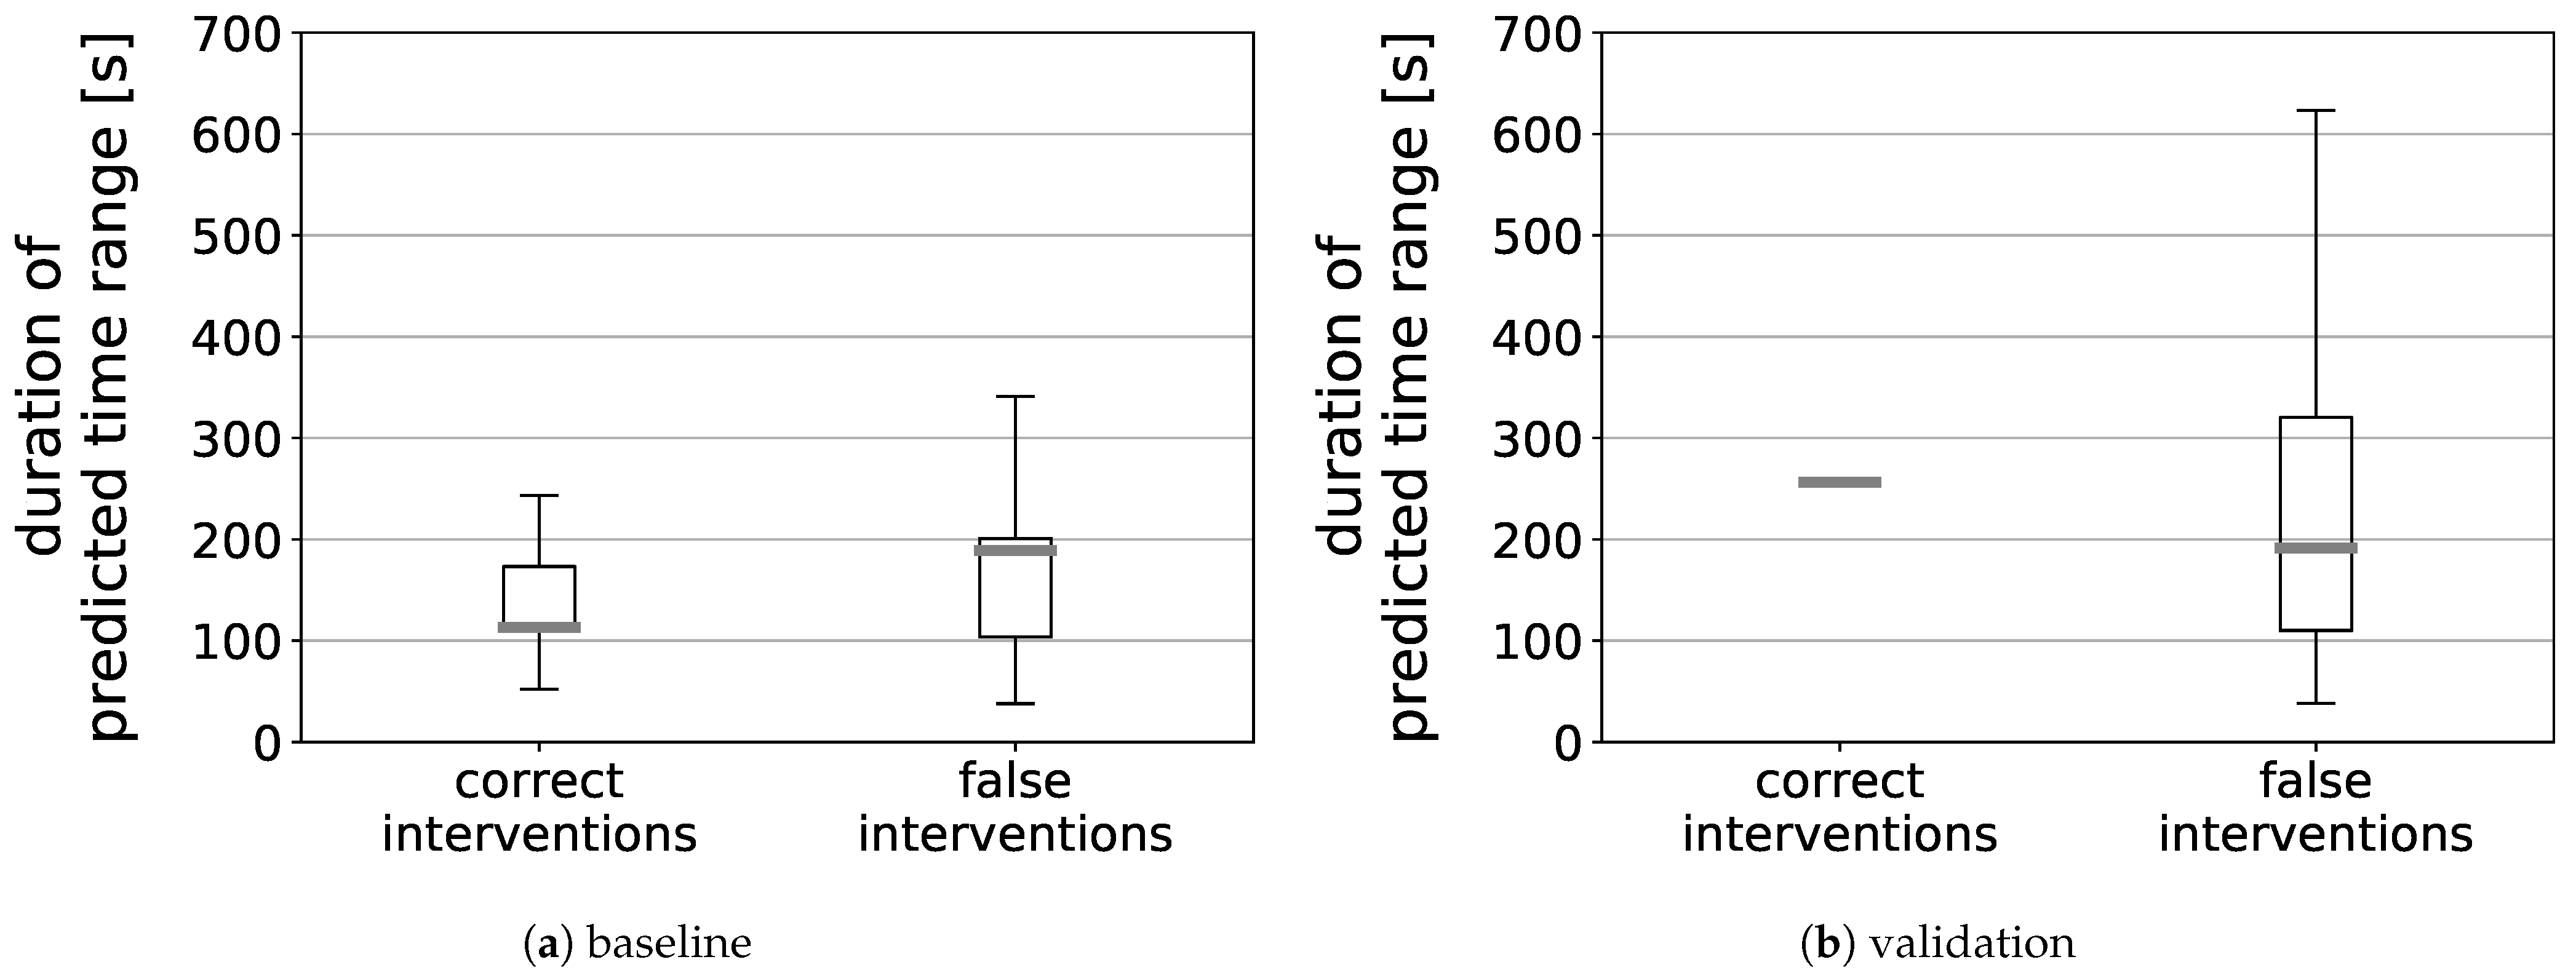
To evaluate the precision of predicting the time of arrival at the CPA, the period between the earliest and latest expected arrival time is shown in Figure 11. In the baseline, the spreads for the false alerts are slightly higher than for the correct interventions. In the validation, it is much higher for the false interventions. However, there are also smaller time intervals than observed for the correct alerts. The predicted time ranges span up to 300 s for correct alerts and up to 650 s for false alerts. This indicates a high variability in bird velocities, especially for birds causing false alerts.
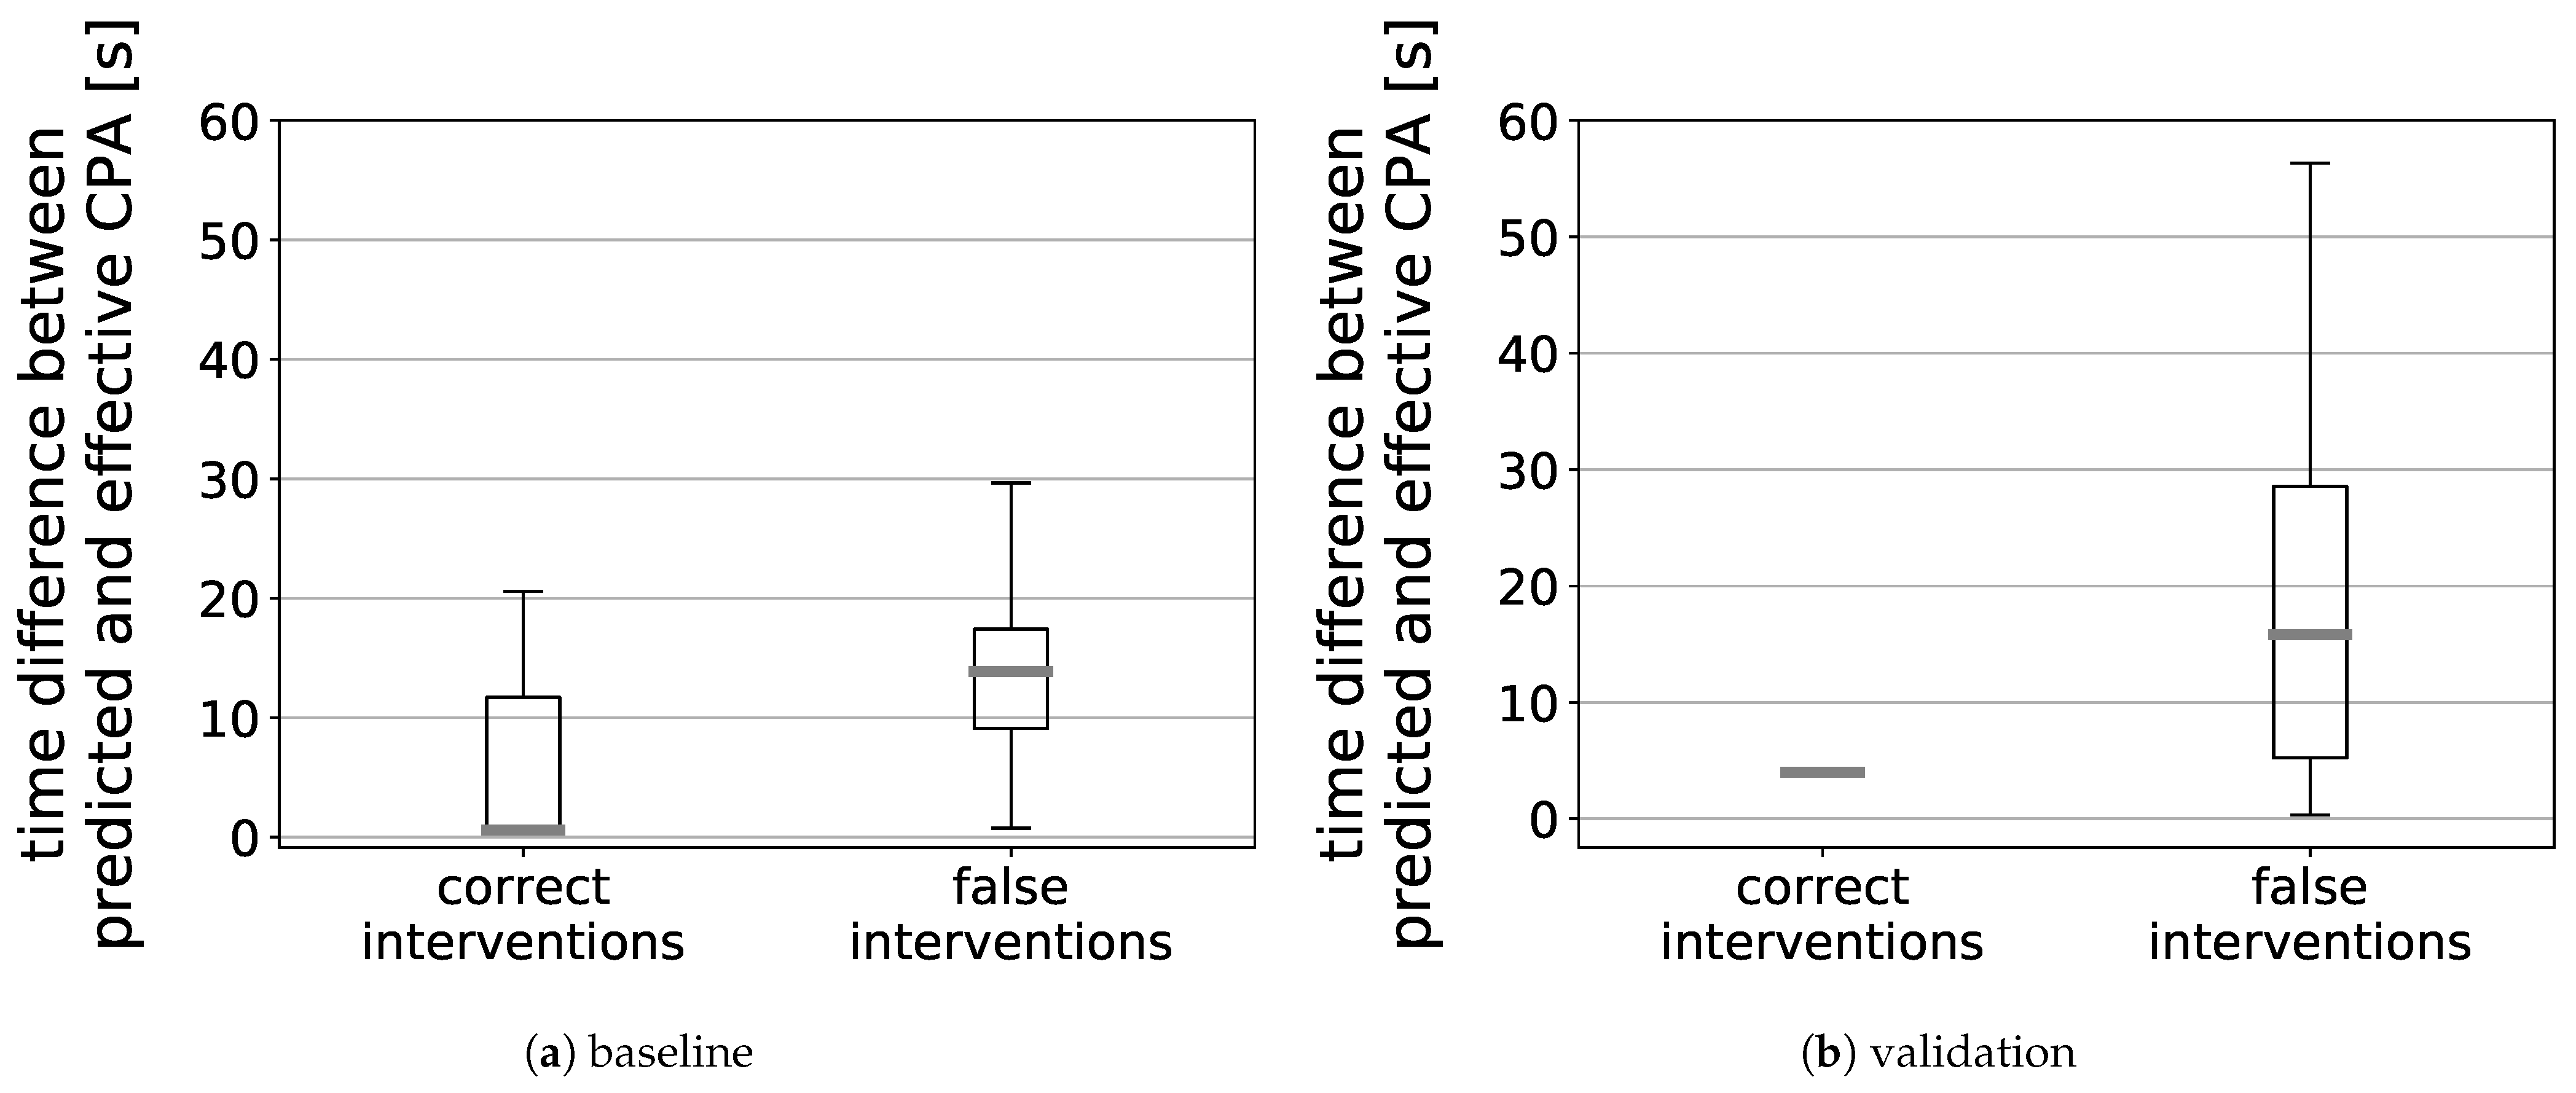
When considering the difference between predicted and effective time of the CPA depicted in Figure 12, the much higher precision for the correct alerts becomes visible for both the baseline and the validation. Although birds which cause correct alerts arrive with a maximum time offset of 20 s at the CPA, the difference amounts up to almost 60 s for false alerts. The birds always arrived either earlier than or within the predicted time range. When considering correct alerts, 33% of birds arrived earlier, 67% within the predicted time range in the baseline. In the validation, all these birds arrived within the predicted time range. Regarding the false alerts, 16% of birds arrived earlier and 84% within the predicted time range in the baseline. In the validation, 13% if birds arrived earlier than and 87% within the predicted time range.

4. Discussion

In an initial study, the strong potential to enhance avian and aviation safety by implementing a bird strike advisory system in the idealized conditions of perfect predictability of bird movement was demonstrated [8]. This study enhanced the algorithm with a module to predict bird movement and to calculate the risk of bird strikes.
In the optimized settings of the initial study, where the algorithm aimed at preventing strikes with all birds in the airport environment, imposed delays could exceed acceptable levels for tight flight plans. This indicated bird strikes to be warned off need prioritization to keep delays and impact on runway capacity reasonable.
Since birds lingering on and close to the runway were identified as being overrepresented in the input bird data and, in addition, are already in the scope of currently implemented prevention measures, they were excluded for the study presented here. Hence, the algorithm focuses on strikes with birds predicted to cross the extended runway center line. Moreover, only these birds which were expected to cause damage to the aircraft, caused an intervention of the algorithm.
The reduction of interventions to be considered resulted in acceptable delays imposed on departures. Only 0.8% of delays exceeded the acceptable threshold of ten minutes in the baseline, 0.5% in the validation. The maximum observed delay amounted to 21 min, representing an outlier. All aircraft were able to depart within the airport opening hours. Hence, the airport capacity could be maintained. This was true even though the thresholds to trigger an intervention were set relatively low, to 0.3 for probability and severity individually, and to 0.09 for their product, to obtain a sufficient number of interventions for the analysis. Hence, the hypothesis for tolerable delays in all scenarios was confirmed.
If there is a danger of interventions influencing the traffic flow too strongly in real-life operations, especially the severity criterion could be adjusted. However, it should be kept in mind that the severity of a strike can also be increased due to, e.g., hits of multiple birds into different aircraft components, which was not considered here. Additional research might be required to refine the definition of the severity criterion itself.
The algorithm succeeded in preventing bird strikes. Still, the overall bird strike rates did not significantly change for the revised flight plans. This resulted from strikes experienced by aircraft inheriting delays from departures which were delayed due to bird strike risk. This is connected to one-sided effects of changing the take-off time of an aircraft. An aircraft that departs collision-free when taking off as intended, either departs collision-free after rescheduling or experiences a collision. Collisions can therefore only be added but not removed for aircraft that initially took off without a bird strike. Hence, in case of birds hard to predict, the additional strikes happening to aircraft that experienced inherited delays can compromise the safety benefits by correctly prevented strikes. These additional strikes were either caused by birds that could not be seen by the algorithm due to taking off after the aircraft or due to an insufficient number of known positions to predict their track. Consequently, the hypothesis of a reduction in bird strike rates could not be confirmed for this implementation.
Most of the bird strikes where the algorithm decided against intervention, exceeded the damage criterion. However, since their probability stayed below the criterion, the algorithm was prevented to intervene. This was true even though the probability threshold was set to a relatively low value of 0.3 which implies an insufficient precision in the prediction of bird movements. The prediction logic builds on linear regression of the bird track known at the time of intended aircraft take-off, including uncertainty buffers to allow for lateral deviations and speed variation along the track. In the parallel direction, the distance between the bird and the predicted track in form of a regression line is relevant. For both correct and false alerts, the offsets at the time of CPA were low with a maximum of 15 m for false alerts. This still lies in a position range which could be correctly detected as a threat for collision or as harmless. The larger imprecision arises from the perpendicular direction, where the predicted time interval at the CPA is relevant. Even for correct alerts, the predicted intervals lasted up to 300 s. For false alerts, they spread up to 650 s. Since the time intervals are calculated based on the minimum and maximum bird speeds along the known part of the trajectories, this indicates high variability in bird velocity, resulting in a high uncertainty, when the bird will cross the runway. This is indicated by the offset between the predicted and effective arrival of the birds at the CPA. Their maximum ranges to 20 s for correct interventions and to 60 s, which is still large, but smaller than the wide spread of time ranges suggest. When comparing the results in the parallel and perpendicular directions, it seems that the predictability of flight direction is higher than the predictability of bird velocity.
Adjusting the probability calculation to base the probability in the perpendicular direction on the expected time of arrival at CPA rather than the predicted time interval could slightly improve the results. However, since there still are relatively large offsets of up to 60 s considering the false alerts, the success of that measure might be limited. To achieve more realistic predictions, a more sophisticated approach is recommended. As such, deep learning on multi-year data of bird movement could be performed to develop site-specific bird movement models. Since radar is limited in the ability to distinguish between individual bird species, the inclusion of data from different sensors such as video- or infrared-based technology or even observations performed by humans or drones should be considered.
The avian radar data used in this study was limited in its range. Hence, tracks of birds flying in higher altitudes were modelled from bird densities obtained from weather radar. Due to the small update rate of this radar type of five minutes, a small change in heading can quickly lead to a deviation from the predicted direction of flight and thus contribute to the imprecision of the selected prediction approach. Recently, the range of avian radar technology has increased to cover more of the critical areas outside the airport boundaries. Incorporating these data is expected to increase the prediction results when using the method of this study. These data also include height information and as such allow the thorough study of bird movement supporting the development of more sophisticated methods to predict bird movement as described above.
The number of interventions varies among the combinations of air traffic intensities and bird movement densities. A higher abundance of birds or even a higher number of birds identified as crossing birds does not necessarily imply a higher number of interventions by the algorithm. The variation of flight plans is, especially in the high air traffic intensity scenarios, limited by the number of flights that must be performed within the airport opening hours. Hence, the main variation is achieved by the different bird movement flight plans. This is demonstrated by the difference of factor 1.3 between the bird strike rates in the baseline and the validation. This difference occurs even though the bird movement information for the same bird densities in the baseline and the validation originate from the same calendar weeks. Hence, the bird abundance and the behavior of birds leading to risk of air traffic seems to be strongly individual from one day to the next.
The variability between baseline and validation is also observed in the other metrics evaluated in this study. The differences of prediction precision (Figure 9, Figure 10, Figure 11 and Figure 12) are larger for the validation. In contrast, the calculated probabilities and damaging potentials spread wider for the baseline in all cases. The latter could result from the larger data set used in the baseline. However, since the predictions themselves spread wider for the validation, this rather indicates the high variability in bird movement even within one calendar week. Factors influencing the bird strike risk from the bird perspective in such a short period might include different weather conditions. Since bird movement information was selected from days with little or no precipitation to get maximum detection rates by the radar [27], other factors such as wind, temperature, cloudiness or humidity might play a role. To achieve a prediction, when the bird strike risk is highest even within the same season and when algorithm interventions are most appropriate, a more in-depth study on the dependencies of bird strike rates of weather conditions is needed. This knowledge could be useful for refining the algorithm and for implementing relative thresholds to trigger interventions depending on the current situation.

5. Conclusions

The study presented here evaluated the impacts on the safety and capacity of an airport when implementing a bird strike advisory system, which calculates the risk of bird strikes by predicting tracks of birds and esteeming the severity of a collision. Simple linear regression was applied on the known parts of the tracks to extrapolate their future path. The algorithm focuses on birds expected to cross the runway and generate aircraft damage upon collision. This study has demonstrated that a precise prediction of bird movement is essential to enhance aviation and avian safety with a bird strike advisory system. The selected approach based on linear regression does not suffice this purpose even when probability aspects are taken into account. The bird strike rates remain similar. However, it has been shown that with a reasonable number of interventions, airport capacity can be kept even at high air traffic intensities. To find and implement suitable models to predict bird movement more precisely and as such to strongly enhance the number of correct alerts, deep learning on multi-year data of bird movement and a shift from risk of individual bird strikes to cumulative bird strike risk is recommended to develop a feasible bird strike advisory system. The next steps towards actual implementation involve the development of the controller interface as well as field-tests.

Author Contributions

Formal analysis, I.C.M.; Investigation, I.C.M.; Methodology, I.C.M., J.E., T.M., D.K. and J.M.H.; Validation, I.C.M.; Writing—original draft, I.C.M.; Writing—review & editing, J.E., T.M., D.K. and J.M.H. All authors have read and agreed to the published version of the manuscript.

Funding

This work was financially supported by the DLR-DAAD Research Fellowship.

Acknowledgments

We thank Robin Radar, the Royal Netherlands Air Force and the Royal Netherlands Meteorological Institute for providing us with radar data. We appreciate the constructive feedback of Alexander Kuenz, Klaus Brinkmann and three anonymous reviewers which supported us in improving our manuscript.

Conflicts of Interest

The authors declare no conflict of interest.

References

  1. EASA. Bird population trends and their impact on Aviation safety 1999–2008; EASA Safety Report; European Aviation Safety Agency: Cologne, Germany, 2009. [Google Scholar]
  2. Dolbeer, R.A.; Begier, M.J.; Miller, P.R.; Weller, J.R.; Anderson, A.L. Wildlife Strikes to Civil Aircraft in the United States 1990–2018; Federal Aviation Administration National Wildlife Strike Database. Serial Report Number 25; Federal Aviation Administration, U.S. Department of Agriculture: Washington, DC, USA, 2019.
  3. McKee, J.; Shaw, P.; Dekker, A.; Patrick, K. Approaches to Wildlife Management in Aviation. In Problematic Wildlife. A Cross-Disciplinary Approach; Angelici, F.M., Ed.; Springer: Cham, Switzerland, 2016; Chapter 22; pp. 465–488. [Google Scholar]
  4. ICAO. 2008–2015 Wildlife Strike Analyses (IBIS); Electronic Bulletin: Montreal, QC, Canada, 2017. [Google Scholar]
  5. ICAO. In Aerodromes, 8th ed.; Annex 14 to the Convention on International Civil Aviation: Montreal, QC, Canada, 2018; Volume I.
  6. DeFusco, R.P.; Unangst, E.T.J.; Cooley, T.R.; Landry, J.M. ACRP Report 145 Applying an SMS Approach to Wildlife Hazard Management; Airport Cooperative Research Program; Transportation Research Board: Washington, DC, USA, 2015. [Google Scholar]
  7. Dolbeer, R.A. Increasing Trend of damaging bird strikes with aircraft outside the airport boundary: Implications for mitigation measures. Hum. Wildl. Interact. 2011, 5, 1235–1248. [Google Scholar]
  8. Metz, I.C.; Ellerbroek, J.; Mühlhausen, T.; Kügler, D.; Kern, S.; Hoekstra, J.M. The Efficacy of Operational Bird Strike Prevention. Aerospace 2021, 8, 17. [Google Scholar] [CrossRef]
  9. MacKinnon, B. Sharing the Skies. An Aviation Industry Guide to the Management of Wildlife Hazards; Transport Canada: Ottawa, ON, Canada, 2004. [Google Scholar]
  10. European Organization for the Safety of Air Navigation. Bird Strike: Guidance for Controllers. 2018. Available online: https://www.skybrary.aero/index.php/Bird_Strike:_Guidance_for_Controllers (accessed on 26 June 2019).
  11. Beason, R.C.; Nohara, T.J.; Weber, P. Beware the Boojum: Caveats and strengths of avian radar. Hum. Wildl. Interact. 2013, 7, 16–46. [Google Scholar]
  12. Marshall, L. Bird arrivals, departures a priority at new airport in Africa. Natl. Geogr. Available online: https://blog.nationalgeographic.org/2010/03/24/bird-arrivals-departures-a-priority-at-new-airport-in-africa (accessed on 24 March 2010).
  13. Hale, M.R.; Stanley, R. Evaluating the Design and Suitability of the Wildlife Surveillance Concept. In Proceedings of the Integrated Communications Navigation and Surveillance Conference, Herndon, VA, USA, 18–20 April 2017. [Google Scholar] [CrossRef]
  14. Federal Aviation Administration. Introduction to TCAS II Version 7.1; Federal Aviation Administration: Washington, DC, USA, 2011. [Google Scholar]
  15. Dolbeer, R.A. Feathers in the fan. AeroSafety World 2008, 3, 22–26. [Google Scholar]
  16. Avrenli, K.A.; Dempsey, B.J. Statistical analysis of aircraft–bird strikes resulting in engine failure. Transp. Res. Rec. 2014, 2449, 14–23. [Google Scholar] [CrossRef]
  17. European Organization for the Safety of Air Navigation. Bird Strike on Final Approach: Guidance for Flight Crews. 2017. Available online: https://www.skybrary.aero/index.php/Bird_Strike_on_Final_Approach:_Guidance_for_Flight_Crews (accessed on 9 January 2019).
  18. Thorpe, J. Conflict of Wings: Birds Versus Aircraft. In Problematic Wildlife. A Cross-Disciplinary Approach; Angelici, F.M., Ed.; Springer: Cham, Switzerland, 2016; Chapter 21; pp. 443–464. [Google Scholar]
  19. Ebert, J. Bird Strikes in the German Civil Aviation 2011 to 2015. Vogel und Luftverkehr Online 2016. Available online: http://www.davvl.de/sites/default/files/2018-06/2016_ebert_vogelschlaege_deutschen_zivilluftfahrt_11bis15.pdf (accessed on 13 February 2020).
  20. van Gasteren, H.; Krijgsveld, K.L.; Klauke, N.; Leshem, Y.; Metz, I.C.; Skakuj, M.; Sorbi, S.; Schekler, I.; Shamoun-Baranes, J. Aeroecology meets aviation safety: Early warning systems in Europe and the Middle East prevent collisions between birds and aircraft. Ecography 2018, 42. [Google Scholar] [CrossRef]
  21. European Organization for the Safety of Air Navigation. ATFCM User Manual, 22.1 ed.; EUROCONTROL: Brussels, Belgium, 2018. [Google Scholar]
  22. Airport Council International. Aviation Operations During COVID-19 Business Restart and Recovery; Airport Council International: Montreal, QC, Canada, 2020. [Google Scholar]
  23. Office of the Director General of Civil Aviation, Government of India. Circular: Wildlife Hazard Management at Airports; No. AV.20011/01/2020-AL; Office of the Director General of Civil Aviation, Government of India: New Delhi, India, 8 June 2020.
  24. Ebert, J. Skylarks, aerodromes, COVID-19. In Proceedings of the Presented at the World Bird Strike Virtual Conference. Available online: https://www.worldbirdstrike.com (accessed on 14 January 2021).
  25. Shamoun-Baranes, J.; Farnsworth, A.; Aelterman, B.; Alves, J.A.; Azijn, K.; Bernstein, G.; Branco, S.; Desmet, P.; Dokter, A.M.; Horton, K.; et al. Innovative visualizations shed light on avian nocturnal migration. PLoS ONE 2016, 11, e0160106. [Google Scholar] [CrossRef] [PubMed] [Green Version]
  26. ICAO. Safety Management, 2nd ed.; Annex 19 to the Convention on International Civil Aviation; Available online: https://caainternational.com/wp-content/uploads/2018/05/AN19_2ed-publication.pdf (accessed on 14 July 2016).
  27. Metz, I.; Mühlhausen, T.; Ellerbroek, J.; Kügler, D.; van Gasteren, H.; Kraemer, J.; Hoekstra, J. Simulation Model to Calculate Bird-Aircraft Collisions and Near Misses in the Airport Vicinity. Aerospace 2018, 5, 112. [Google Scholar] [CrossRef] [Green Version]
  28. Federal Aviation Administration. 14 CFR 91.7—Civil Aircraft Airworthiness; Federal Aviation Administration: Washington, DC, USA, 2020. [Google Scholar]
  29. European Aviation Safety Agency. Certification Specifications for Normal Aeroplanes; Ammendment 5; European Aviation Safety Agency: Cologne, Germany, 2017. [Google Scholar]
  30. European Aviation Safety Agency. Certification Specifications for Engines; Amendment 3; European Aviation Safety Agency: Cologne, Germany, 2010. [Google Scholar]
  31. European Aviation Safety Agency. Certification Specifications and Acceptable Means of Compliance for Large Aeroplanes CS-25; Amendment 23; European Aviation Safety Agency: Cologne, Germany, 2019. [Google Scholar]
  32. Hoekstra, J.M.; Ellerbroek, J. BlueSky ATC Simulator Project: An Open Data and Open Source Approach. In Proceedings of the 7th International Conference on Research in Air Transportation, Philadelphia, PA, USA, 20–24 June 2016; Volume 131, p. 132. [Google Scholar]
  33. EUROCONTROL. User Manual for the Base of Aircraft Data (BADA) Revision 3.12; EEC Technical/Scientific Report No. 14/04/24-44 ed.; EUROCONTROL: Brussels, Belgium, 2014. [Google Scholar]
  34. Dokter, A.M.; Liechti, F.; Stark, H.; Delobbe, L.; Tabary, P.; Holleman, I. Bird migration flight altitudes studied by a network of operational weather radars. J. R. Soc. Interface 2010, 8, 30–43. [Google Scholar] [CrossRef] [PubMed] [Green Version]
  35. Lensink, R.; Kwak, R. Vogeltrek Over Arnhem in 1983 Met een Samenvatting Over de Periode 1981–1983 en Methodieken Voor het bewerken van Telmateriaal; LWVT: Arnhem, The Netherlands, 1985. [Google Scholar]
  36. Metz, I.; Ellerbroek, J.; Mühlhausen, T.; Kügler, D.; Hoekstra, J.M. Simulating the Risk of Bird Strikes. In Proceedings of the 7th SESAR Innovation Days, 2017; Available online: http://pure.tudelft.nl/ws/files/35585954/SIDs_2017_Metz_BirdStrike.pdf (accessed on 21 January 2021).
  37. Metz, I.; Mühlhausen, T.; Ellerbroek, J.; Kügler, D.; Hoekstra, J. What is the Potential of a Bird Strike Advisory System? In Proceedings of the 13th USA/Europe Air Traffic Management Research and Development Seminar, Vienna, Austria, 17–21 June 2019. [Google Scholar]
Figure 1. Exemplary bird tracks representative for the categories lingering birds (a) and crossing birds (b) (Source: avian radar data, recorded at Eindhoven Airport on 5 June 2016).
Aerospace 08 00032 g001
Figure 2. Steps of the Collision Detection and Resolution.
Aerospace 08 00032 g002
Figure 3. Model to calculate the probability of a collision (CPA: Closest Point of Approach; PBP: Predicted Bird Position; p e r p : perpendicular).
Aerospace 08 00032 g003
Figure 4. Distributions of probability (a) and normalized kinetic energy as well as the selected thresholds (b). Note the different scaling.
Aerospace 08 00032 g004
Figure 5. Duration of delays imposed by the algorithm focusing on crossing birds (n: average number of delays per day).
Aerospace 08 00032 g005
Figure 6. Number of interventions and generated delays by type for the different combinations of air traffic intensities and bird strike risk within the baseline and the validation (note logarithmic scale for delays).
Aerospace 08 00032 g006
Figure 7. Number of birds and number of interventions for the different combinations of air traffic intensities and bird strike risk within the baseline and the validation.
Aerospace 08 00032 g007
Figure 8. Distributions of probability and kinetic energy normalized by the certification specification requirements for impact resistance. Dashed lines represent the thresholds for triggering an algorithm intervention. This is only triggered when the thresholds of probability as well as kinetic energy are exceeded.
Aerospace 08 00032 g008
Figure 9. Variation of maximum distance from the regression line at the time of prediction.
Aerospace 08 00032 g009
Figure 10. Distance from the regression line at the time of CPA.
Aerospace 08 00032 g010
Figure 11. Duration of time intervals in which the bird was expected to cross the aircraft trajectory.
Aerospace 08 00032 g011
Figure 12. Time difference between the birds’ predicted and effective time of arrival at the CPA.
Aerospace 08 00032 g012
Table 1. Kinetic energy criteria as defined by the EASA for Large Aeroplanes [31]. 4 lb amount to 1.8 kg, 8000 ft correspond to 2438 m, 200 kts equal 102.9 m/s. v r e f e r e n c e refers to cruise speed at the respective altitude.
ComponentKinetic Energy Criterion
Windshield E k i n = 1 2 · 4 lb · ( v r e f e r e n c e ) 2
Structure E k i n = 1 2 · 4 lb · ( 0.85 · v r e f e r e n c e 8000 f t ) 2
E k i n = 1 2 · 4 lb · ( v r e f e r e n c e s e a l e v e l ) 2
Engine E k i n = 1 2 · m b i r d · ( 200 kts ) 2
Table 2. Shares of birds (n = 1,906,240) and caused strikes (n = 69,463) in the different altitude bands.
0 m–200 m200 m–1000 m200 m–400 m400 m–1000 m
share of birds7%93%59%34%
share of strikes79%21%13%8%
Table 3. Bird strike rates (number of collisions per 10,000 flights).
CaseOriginal Flight PlansRevised Flight PlansDifference
baseline57.858.020.8%
validation43.1443.050.2%
Publisher’s Note: MDPI stays neutral with regard to jurisdictional claims in published maps and institutional affiliations.

