1. Introduction
In current aircraft maintenance support work, huge amounts of data, including structured and unstructured data, are recorded. Due to the relatively mature processing methods of structured data, there exist many ways for fault diagnosis based on structured data. However, a large amount of unstructured data, such as text data recorded by aircraft fault maintenance activities, are insufficiently exploited, which results in a waste of resources. Meanwhile, these unstructured data contain a lot of fault knowledge, which can provide decision support for the maintenance of aircraft and can help fault diagnosis and necessary maintenance work based on mechanism.
Text mining [
1,
2,
3] is a variation of data mining, as they both try to find interesting patterns from large databases. Data mining tools are designed to handle structured data from databases. Nowadays, text mining has attracted lots of attention in many fields, especially with the rapid development of natural language processing technology. Pan et al. [
4] collected many comments on COVID-19 and agricultural topics and used a text mining method to explore the influences of COVID-19 on the agricultural economy and mitigation measures in China. Chen et al. [
5] combined text mining and econometrics analysis technology to explore the mechanism of doctor–patient interactions in an online health community. Chu et al. [
6] proposed a text-mining-based supply chain risk management framework to reduce risks in supply chain operations. In the repair and maintenance work of aircraft, the description of the abnormal operation status of one device has also been recorded in the form of text. If effective methods can be adopted to excavate the information behind these texts, this could be a great help to provide decision support for the design and maintenance of aircraft systems.
Aiming at the problem that the fault text has not been fully used, our research aim was to establish an effective aircraft fault diagnosis model based on text data to provide decision support for aircraft maintenance work. To achieve this goal, Word2vec was used to extract text features to solve the problem that the computer cannot recognize text data directly. Then, an excellent classifier was necessarily needed to realize fault diagnosis. We built a two-level stacking ensemble model to improve the overall prediction. The basic learners are k-nearest neighbor, one-vs-all support vector machine (SVM), gradient boosting decision tree and native Bayes. At the top level, we have used random forest to combine the predictions produced by the bottom level. We carried out verification experiments on a real aircraft fault text dataset to verify the effectiveness of the proposed aircraft fault diagnosis model. The main contributions of this study could be outlined as follows:
- (a)
Aiming at the problem that fault text is not fully used, we propose a feasible fault diagnosis model based on fault text.
- (b)
Word2vec, as an efficient method, is used for text feature extraction instead of traditional methods.
- (c)
A stacking ensemble scheme-based fault diagnosis model was constructed, and it has better performance than traditional methods, such as SVM.
The rest of this paper is organized as follows.
Section 2 introduces the related work on feature extraction and aircraft fault diagnosis.
Section 3 shows our overall framework and the classifier used for fault diagnosis. In
Section 4, we evaluate the effectiveness of the proposed aircraft fault diagnosis model by using real data and comparing it with fault diagnosis methods in other literature. Finally,
Section 5 concludes the paper.
2. Literature Review
In classic data-driven fault diagnosis, there are two main steps:
Feature extraction: A method of transforming a set of measurements of a pattern in order to highlight the representative characteristics of that pattern. Feature extraction is related to dimension reduction. Additionally, the quality of features has a crucial influence on the model’s generalization ability.
Fault diagnosis model: The data-driven method is based on the input and output data of the system and analyzing the statistical characteristics of the data to establish the data feature model of the process.
2.1. Text Feature Extraction
As a kind of unstructured data, a text document contains a vast range of information but lacks the imposed structure of a traditional database [
7]. We first need to have an effective document representation model to convert the unstructured data into structured data so that the computer can correctly identify the content.
The most common and basic text representation methods, such as one-hot encoding and term frequency-inverse document frequency (TF-IDF), preserve a very limited amount of information [
8]. The one-hot encoding uses one vector to represent one sentence, and the length of a one-hot vector is equal to the number of words it contains. Each dimension in that vector space corresponds to one word: “1” represents that the word appears in the sentence, and “0” represents that the word does not appear in the sentence. TF-IDF is a statistical method used to judge the importance of words according to their frequencies of occurrence in a corpus and gives weights to words on the basis of the word bag model. TF means term frequency, and IDF represents inverse document frequency. In a specific document, a word with a high occurrence rate that is contained in low quantities in other documents in the dataset is considered to reflect the uniqueness of the document according to the TF-IDF algorithm. At present, many studies have been deployed for optimizing term weighting methods based on TF-IDF from different perspectives [
9,
10,
11,
12,
13].
Topic modeling methods are commonly used techniques in text mining to find relationships among data and documents [
14]. Topic modeling methods based on latent Dirichlet allocation (LDA) have been applied to natural language processing, text mining, social media analysis and information retrieval [
15]. Brzustewicz P et al. [
16] used LDA for topic modeling and the Louvain algorithm for semantic network clustering to analyze sustainable consumption during the COVID-19 pandemic. Liu J et al. [
17] used LDA topic modeling, dictionary-based sentiment analysis and the NRC Word-Emotion Association Lexicon to extract the topics, sentiments and context features of user reviews of online mental health consultation services. Zhang N et al. [
18] crawled online reviews of express companies and used an LDA model and sentiment analysis to identify service attributes and customer satisfaction so as to analyze user-generated content and provide a scientific service innovation scheme for express enterprises. However, as an unsupervised algorithm, the LDA model is blind in the process of generating word vectors and is not suitable for short texts [
19].
Both of the methods mentioned above have their limitations. For example, the bag of words model ignores the semantics of text and easily leads to dimension explosion, and the LDA model performs poorly with short text datasets and generates topics blindly. Word2vec, as a more efficient method, and has been used to perform text feature extraction instead of the traditional methods since it was proposed. Word2vec is a neural network probabilistic language model proposed by Mikolov et al. [
20]. It captures the semantic information of text, and the dimensions of the generated word vectors can be controlled so that Word2vec will not cause a dimension explosion [
21].
2.2. Data-Driven Aircraft Fault Diagnosis
Due to the complex systems of aircraft and the harsh working environments of parts, a fault in one single component can significantly alter the performance of the whole craft and may even result in complete mission failure [
22]. It is important to discover faults, determine fault types and isolate faults in time. At present, many scholars have performed a lot of research on data-driven fault diagnosis. He et al. [
23] developed a data-driven diagnostic method, which is termed adaptively regularized periodic overlapping group sparsity (ARPOGS). Shen et al. [
24] developed a novel data-driven fault diagnostic framework that uses hybrid multi-mode machine learning strategies to monitor system health status. Berri P.C.C. et al. [
25] proposed a computational method combining physics-based knowledge of the system’s damage propagation rate, machine learning and real-time measurements of the health status to obtain accurate estimates of the remaining useful life of an aerospace system. Nguyen et al. [
26,
27] proposed a magnitude order balance method to diagnose quadcopters actuator faults based on sensor data and developed an attitude fault-tolerant control method based on a nonsingular fast terminal sliding mode and a neural network to compensate for actuator faults. Zhao et al. [
28] reduced R-LSSVM’s computational complexity and proposed an extended LSSVM (E-LSSVM), and successfully applied it to the fault diagnosis of an aircraft engine.
The above methods are based on structured data for fault diagnosis. As computers cannot recognize unstructured data directly, aircraft fault diagnosis driven by unstructured data represented by text and images has not been widely studied. However, with the development of machine learning and natural language processing, fault diagnosis based on unstructured data has also been developed. Almansoori N.N. et al. [
29] proposed an automatic fault detection model that compares images of an aircraft with images taken of a properly functioning, identical aircraft to conclude whether sections of the aircraft are faulty and need maintenance. Wei et al. [
30] proposed bi-level, topic-labeled latent Dirichlet allocation for extracting features of text data and a cost-sensitive support vector machine (CSSVM)-based fault text classification method. Wang et al. [
31] proposed a bi-level (at syntax and semantic) feature extraction-based text mining technique for fault diagnosis to meet the challenges of high-dimensional data and imbalanced fault class distribution. Chen et al. [
32] proposed a prior-knowledge CNN that introduces expert fault knowledge through cloud similarity measurement (CSM) to improve the performance of a fault classifier.
3. Materials and Methods
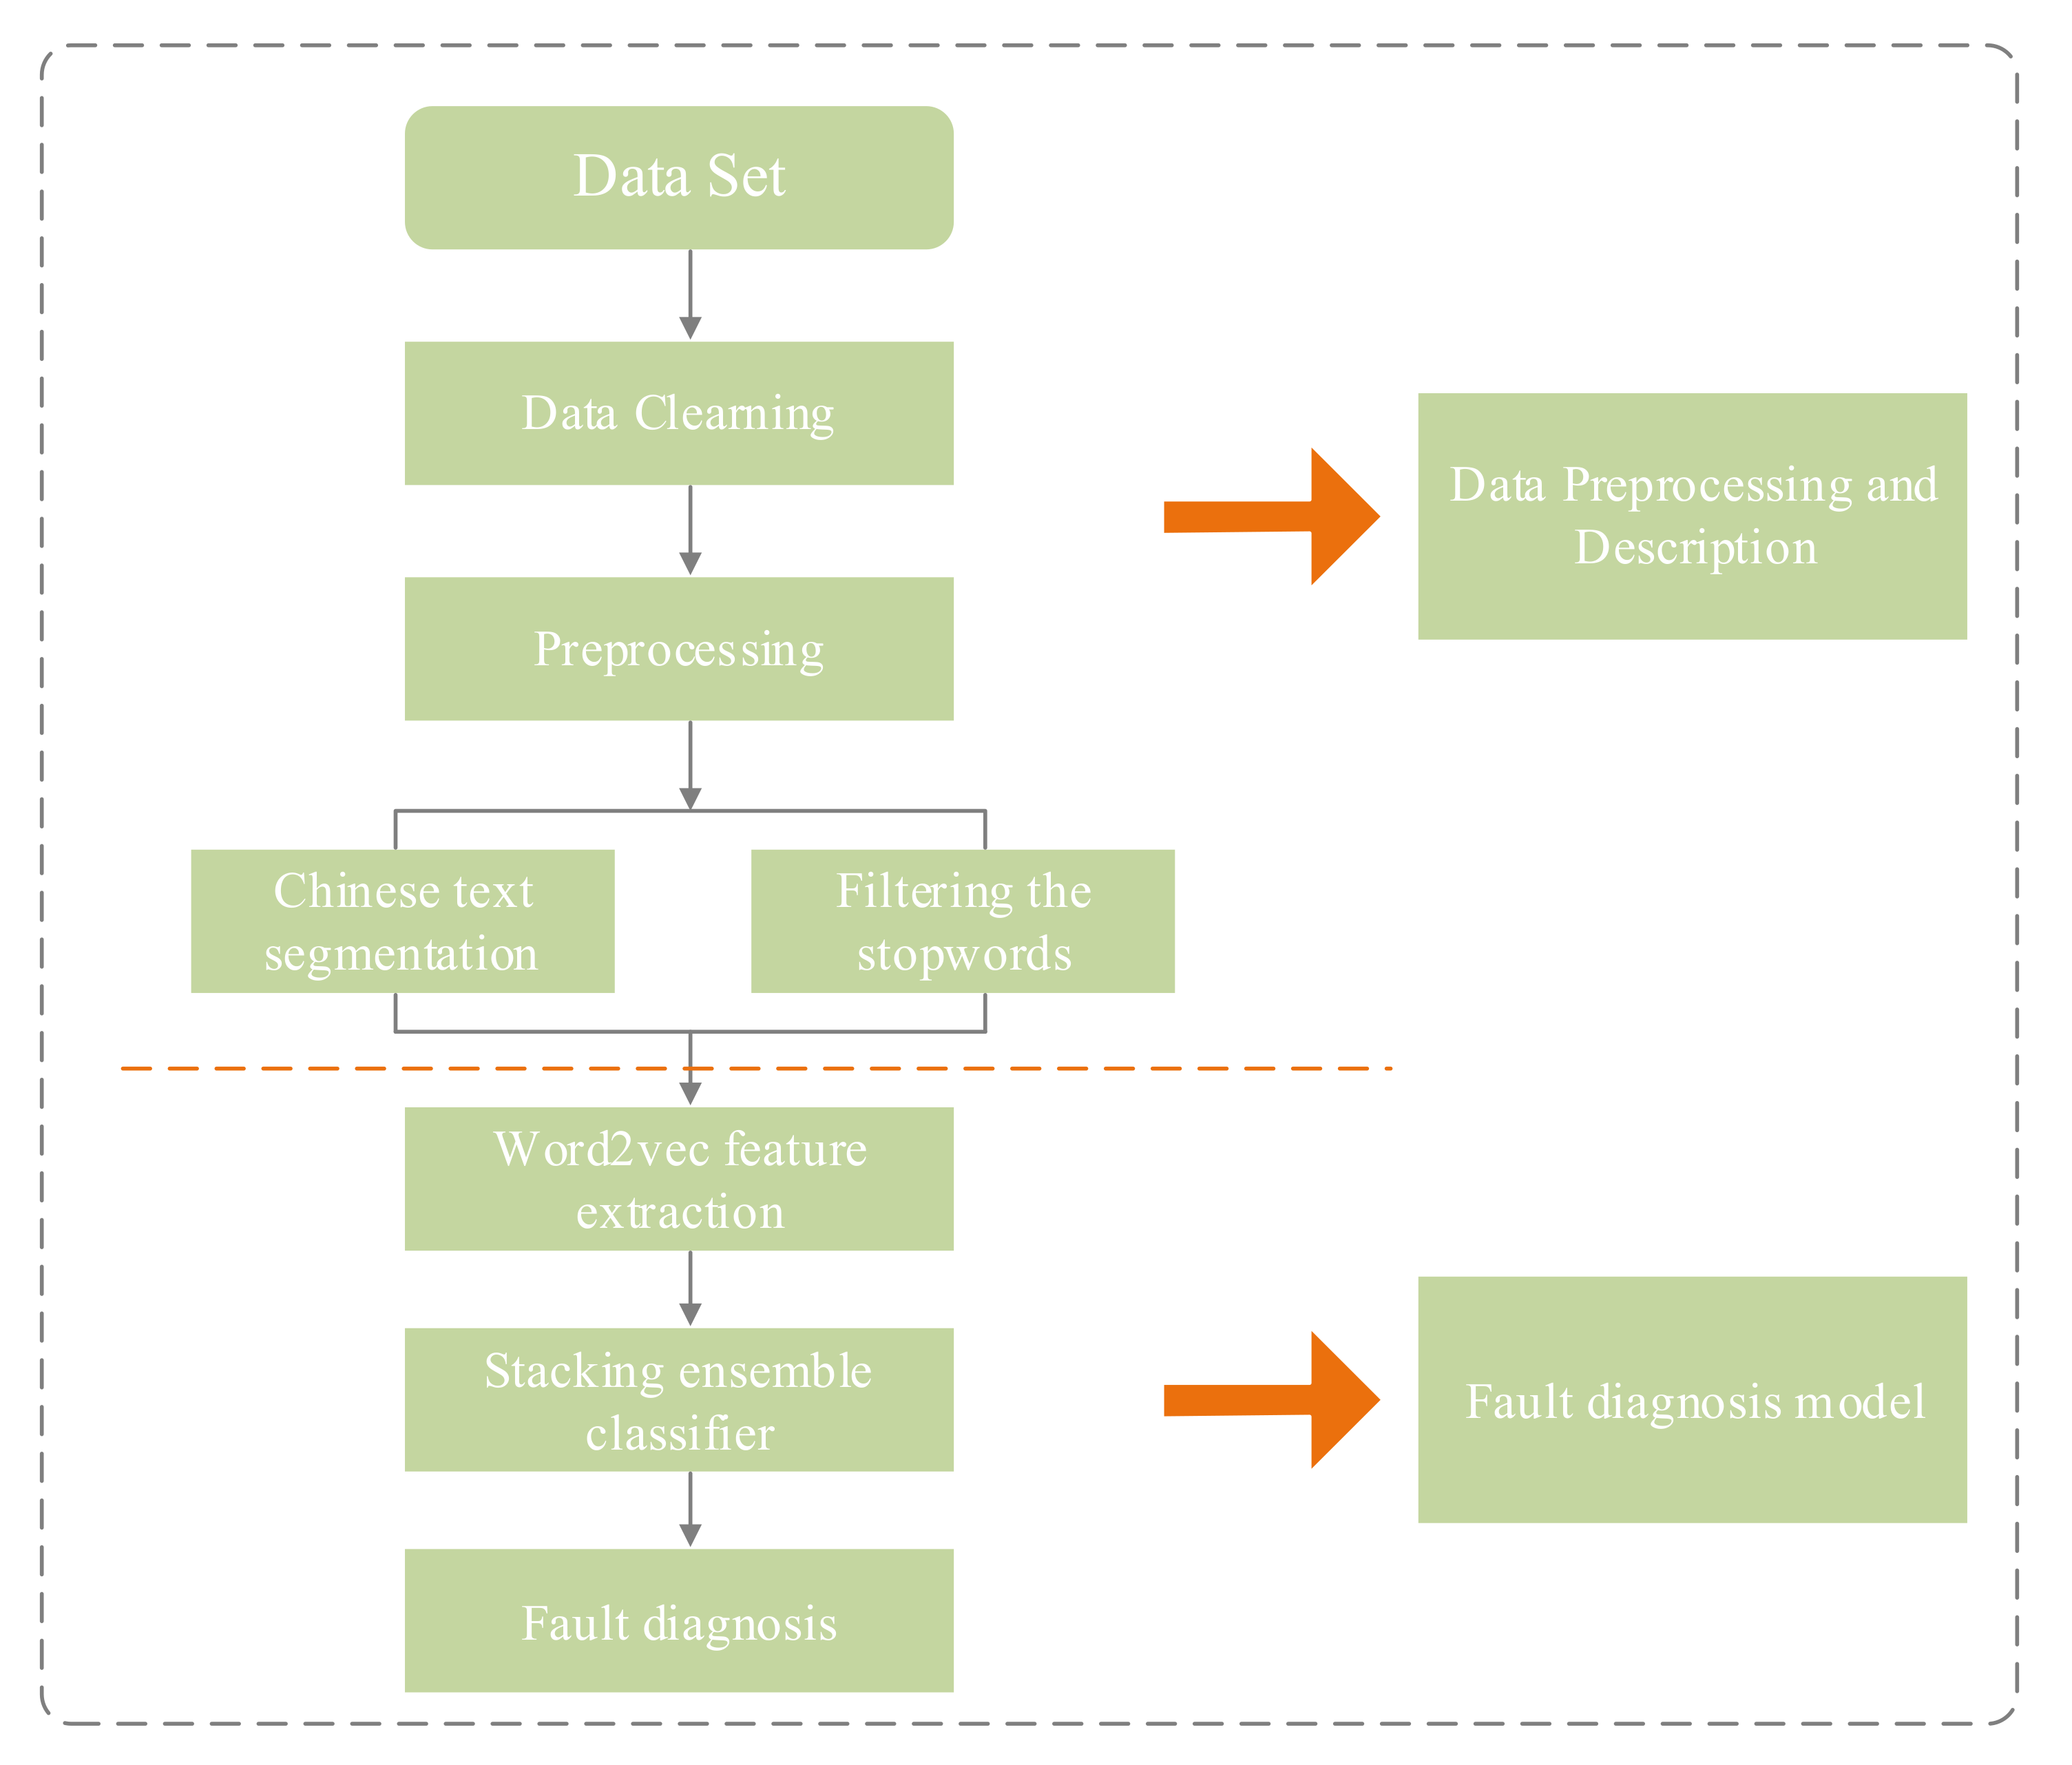
This section introduces data characteristics and the overall framework of our text-based fault diagnosis model. The schematic framework (
Figure 1) shows the methodological framework of the study.
As seen in
Figure 1, the overall framework is divided into three parts. First, we need to preprocess the input aircraft fault text data, and this includes eliminating the repeated data, eliminating the missing data, performing word segmentation and removing stop words. Then comes mapping the preprocessed text data to the word vector space by Word2vec to obtain the aircraft fault text vector. Finally, we use the vectors to train our classifier for further fault diagnosis.
3.1. Data Description and Preprocessing
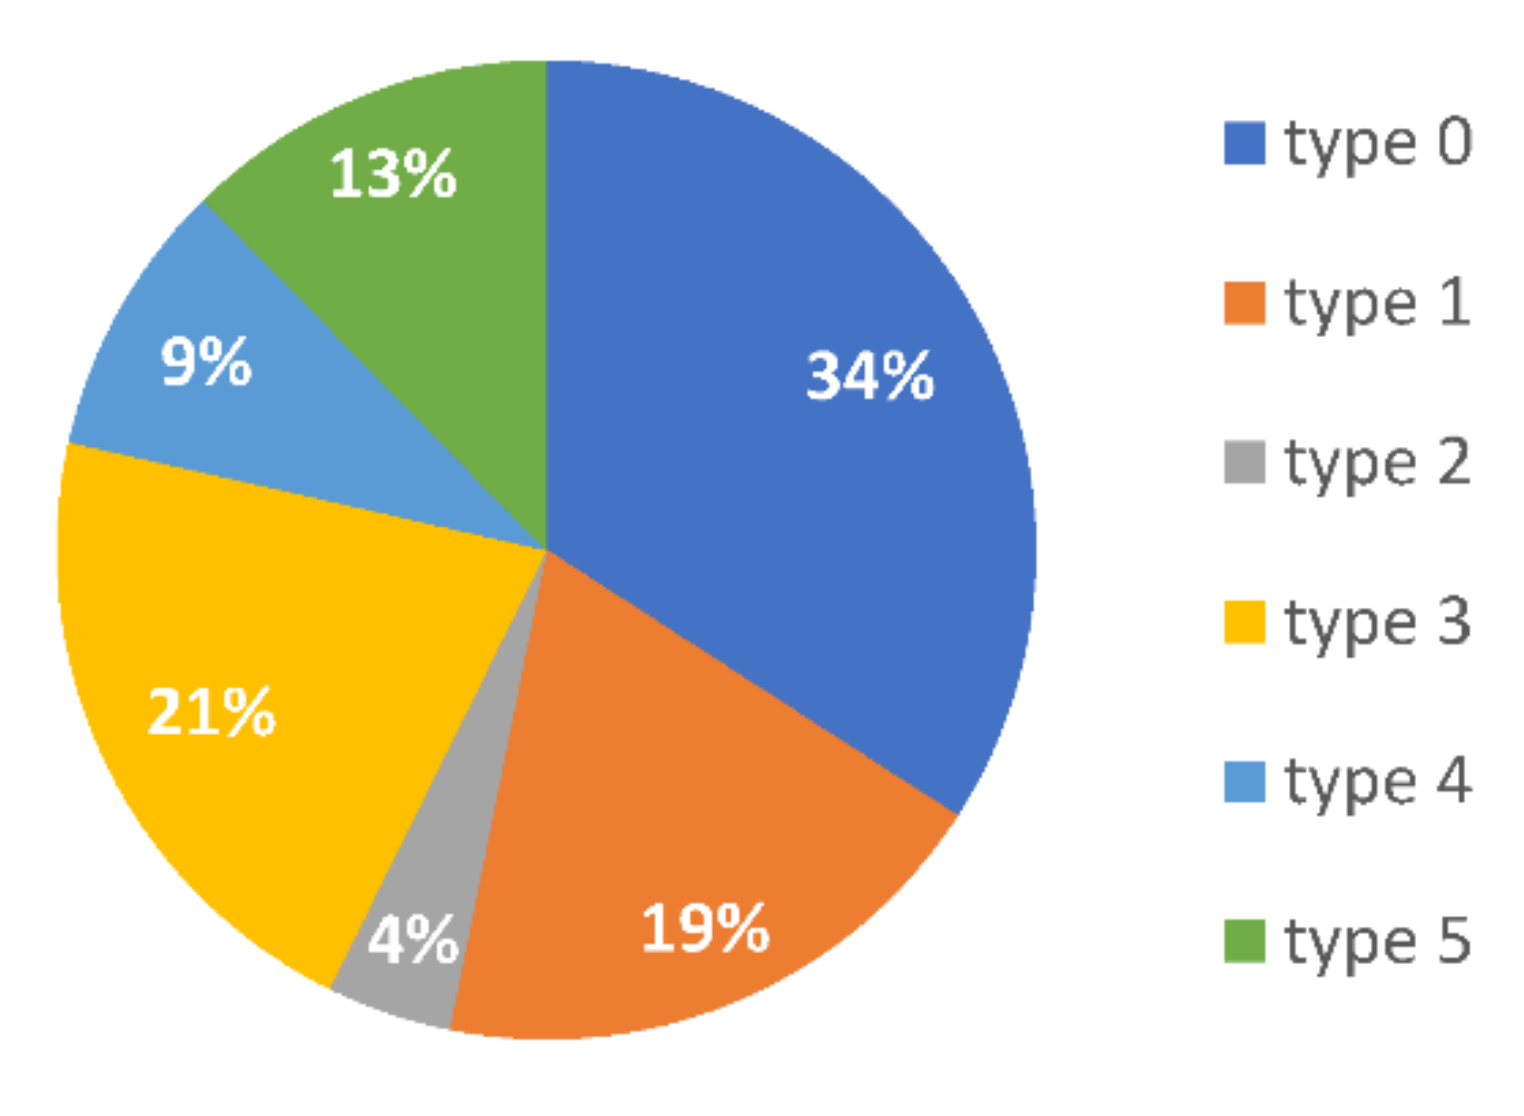
Our experimental data were a real aircraft fault text dataset, which was obtained by long-term repair and maintenance work. Every piece of data included fault phenomenon, fault type, the time of breaking down, the cause of the fault and the solution. In total, there were six fault types in the dataset. We marked them as sensor faults (0), equipment aging (1), equipment ablation (2), human error (3), circuit faults (4) or mechanical faults (5). Some of the data are shown in
Table 1. Additionally, the proportions of types of faults are shown in
Figure 2 below.
In the process of data analysis and mining, data preprocessing is a very necessary prerequisite step. The original datasets always have missing data, redundant data, different formats and information errors. The accuracy of subsequent data analysis results will be affected if necessary preprocessing work is not carried out. In addition, for unstructured text data, Chinese word segmentation and removal of stop words are needed to carry out subsequent text analysis. Unlike English, there exist no spaces between words in Chinese text. Chinese text is a continuous string of Chinese characters. Thus, after data cleaning, we first needed to slice the words in the documents using certain rules and methods. Commonly used Chinese word segmentation methods mainly include dictionary-based word segmentation methods, statistics-based word segmentation methods and rule-based statistical methods [
33]. Considering that the dictionary-based word segmentation method has good efficacy, we used the Jieba word segmentation tool to carry out word segmentation. The Jieba word segmentation tool is based on the Trie tree structure [
34] and uses dynamic programming to find the maximum probability path to obtain the word segmentation results. In our work, the precise mode of the Jieba word segmentation tool was adopted for word segmentation processing. Additionally, the stop word processing was carried out according to the stop word list.
3.2. Word2vec Feature Extraction
As a bag of words ignores the semantics of text and easily leads to dimension explosion, and the LDA model has poor performance in short text processing, we adopted the Word2vec model to extract text features. Word2vec is a neural network probabilistic language model proposed by Mikolov et al. [
20]. The purpose of vectorizing by Word2vec is to map words in vector space, so that words with similar meanings are closer in space (or similarity) and words with different meanings are farther apart in space (or similarity). Word2vec includes the CBOW model (continuous bag of words) and the skip-gram model. CBOW inputs the current word to predict the surrounding words, whereas the skip-gram model inputs the surrounding words to predict the current word. CBOW is suitable for processing small corpora, and skip-gram is suitable for processing big corpora. The data used in this paper are a typical small corpus, so we used CBOW to extract the text features.
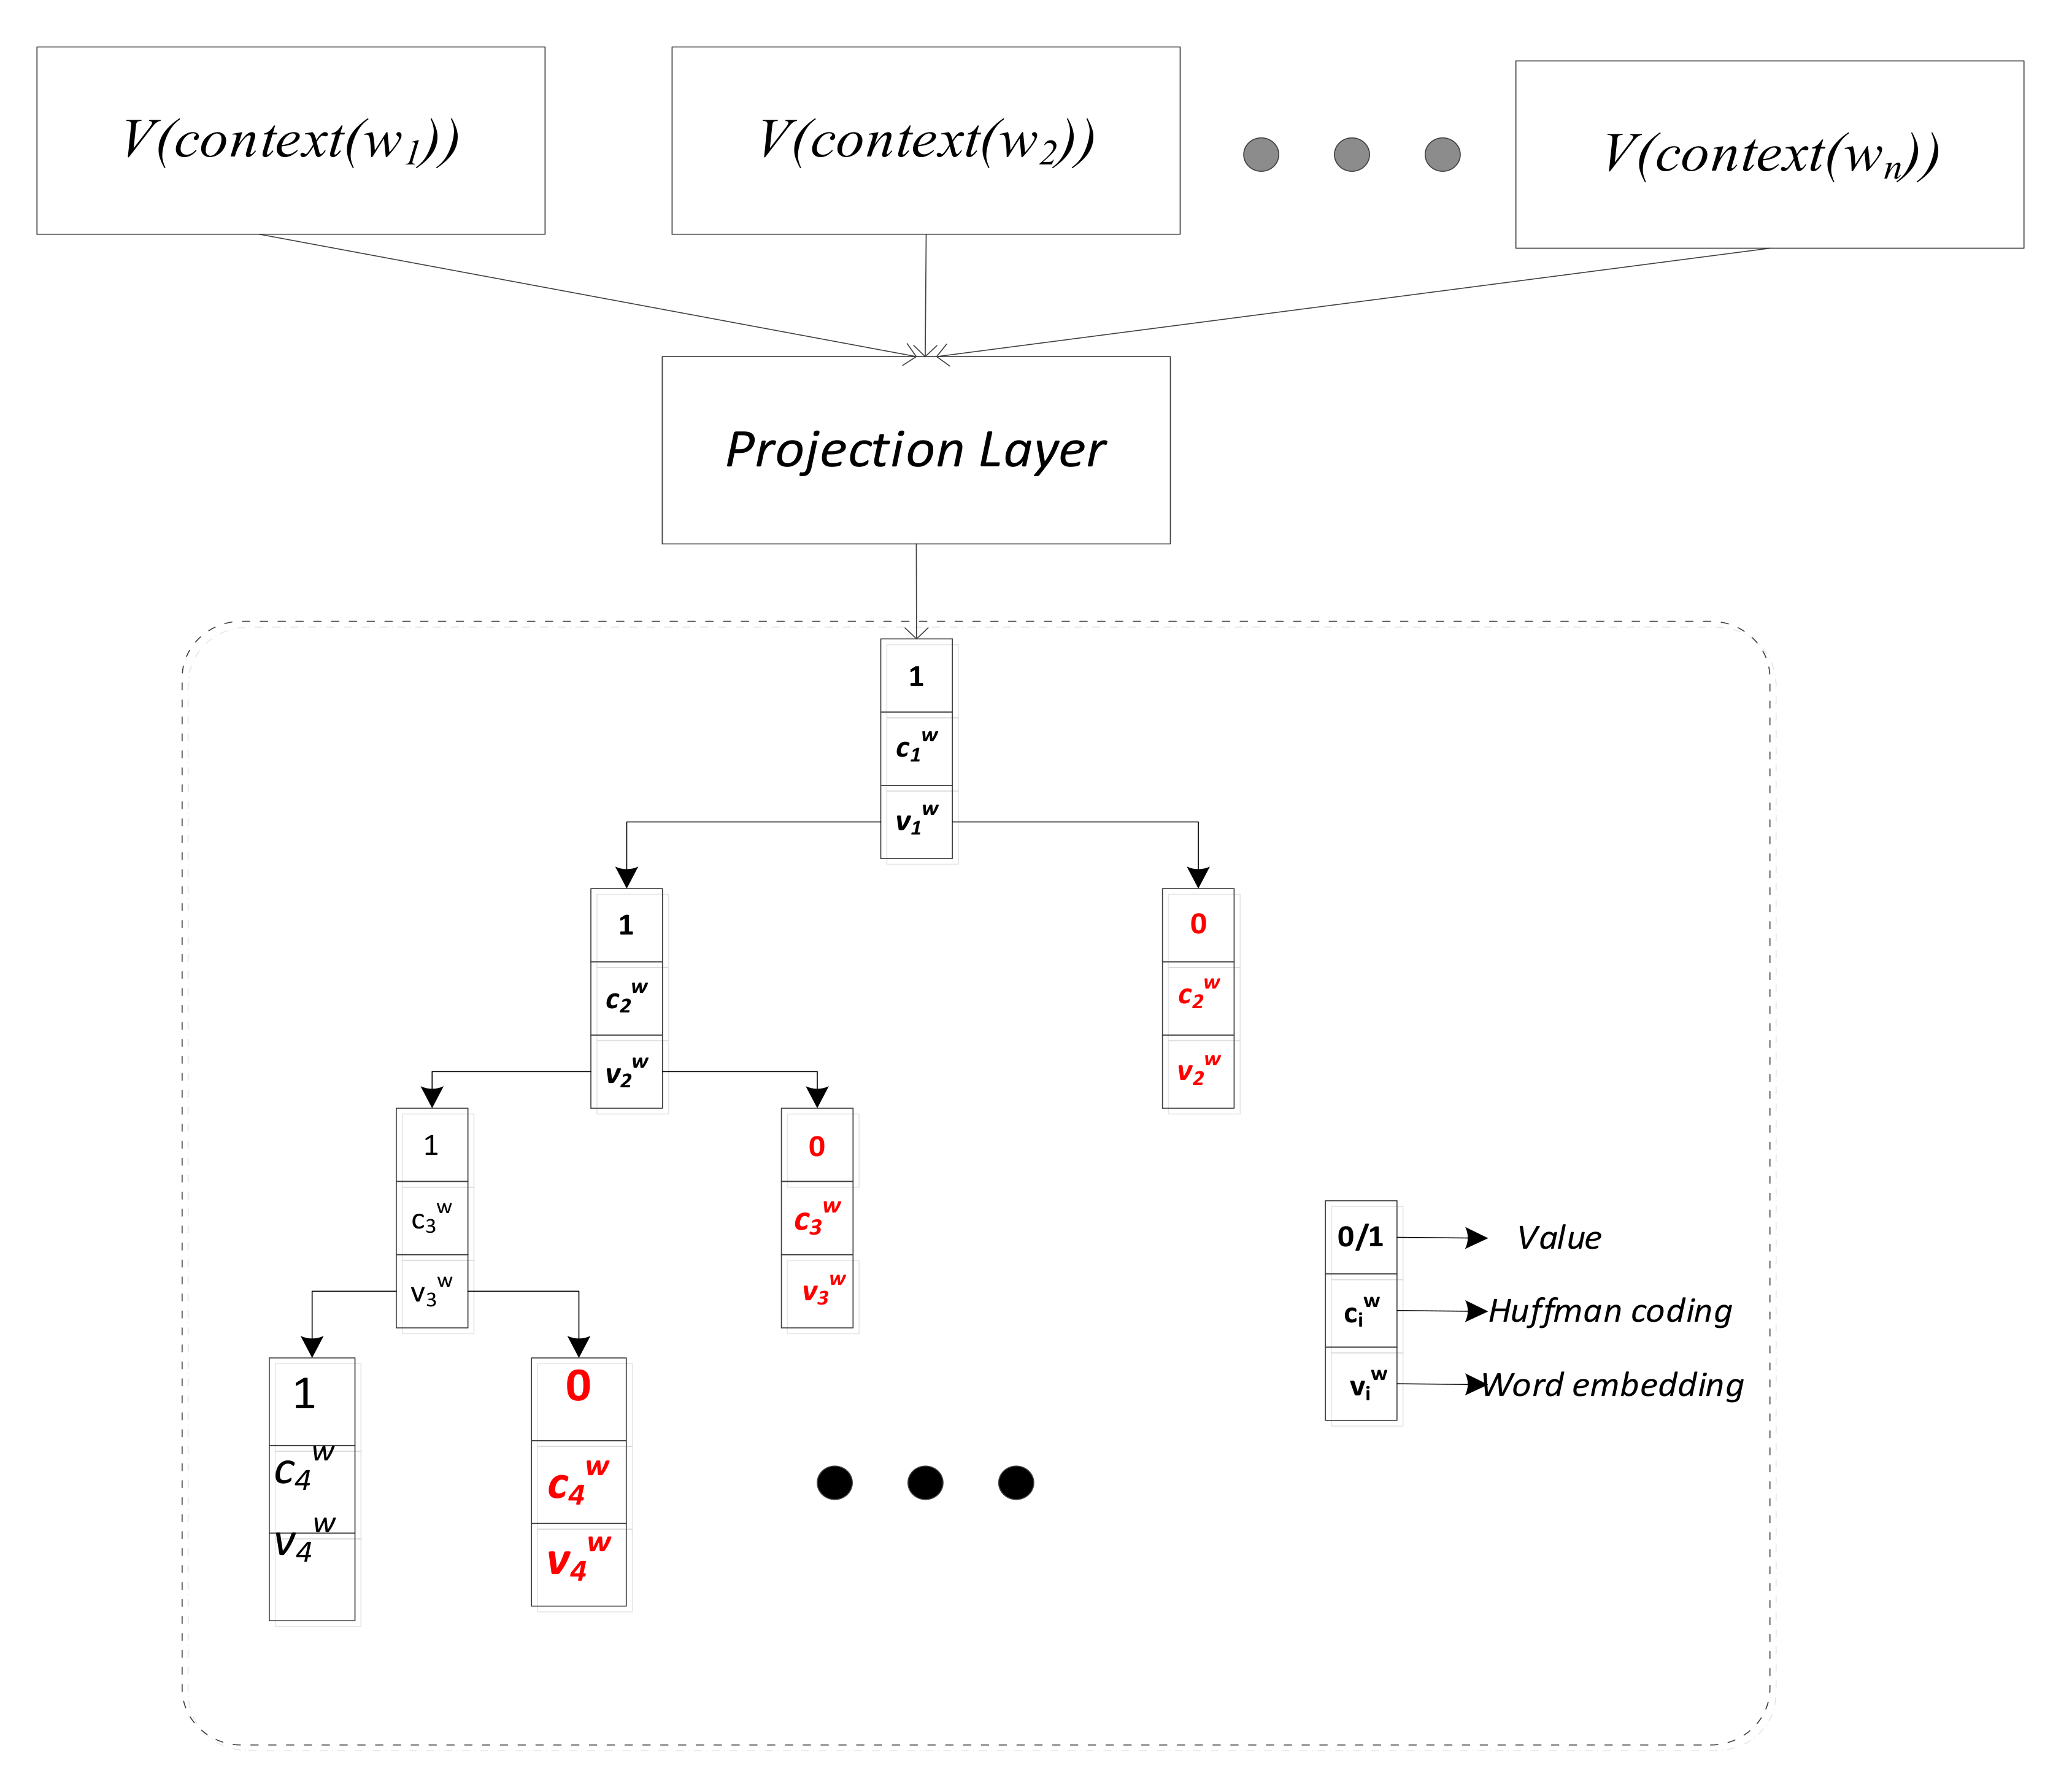
As shown in
Figure 3, CBOW is a three-layer neural network, including an input layer, a hidden layer and an output layer. Additionally, the CBOW architecture predicts the current word based on the context. Each word in the dictionary is assigned a vector
of fixed dimensions, with
representing the context of the word
W.
Input layer: The input is the vector representation of a total of
n words in the context (one-hot representation). Assuming that
V words appear in the corpus, there are
nodes.
Hidden layer: All
n vectors of the input layer are accumulated and summed, and the connecting edge of the word matrix exists between the input layer and the hidden layer. The word matrix is the output form of the word vector after training:
Output layer: The output layer contains a Huffman tree, which uses the occurrence frequency of each word in the corpus as its weight, and its leaf node is the word in the corpus. That is, there are n leaf nodes and n-1 none-leaf nodes.
3.3. Fault Diagnosis Based on Stacking Ensemble Model
To improve the performances of classification models, ensemble methods are often used at present [
35]. The principle of ensemble learning is to combine multiple weak models in some way to get a strong model. The underlying idea of ensemble learning is that even if a weak classifier gets a wrong prediction, other weak classifiers can correct the error [
36,
37]. The most used and well-known of the basic ensemble methods are bagging, boosting and stacking [
38].
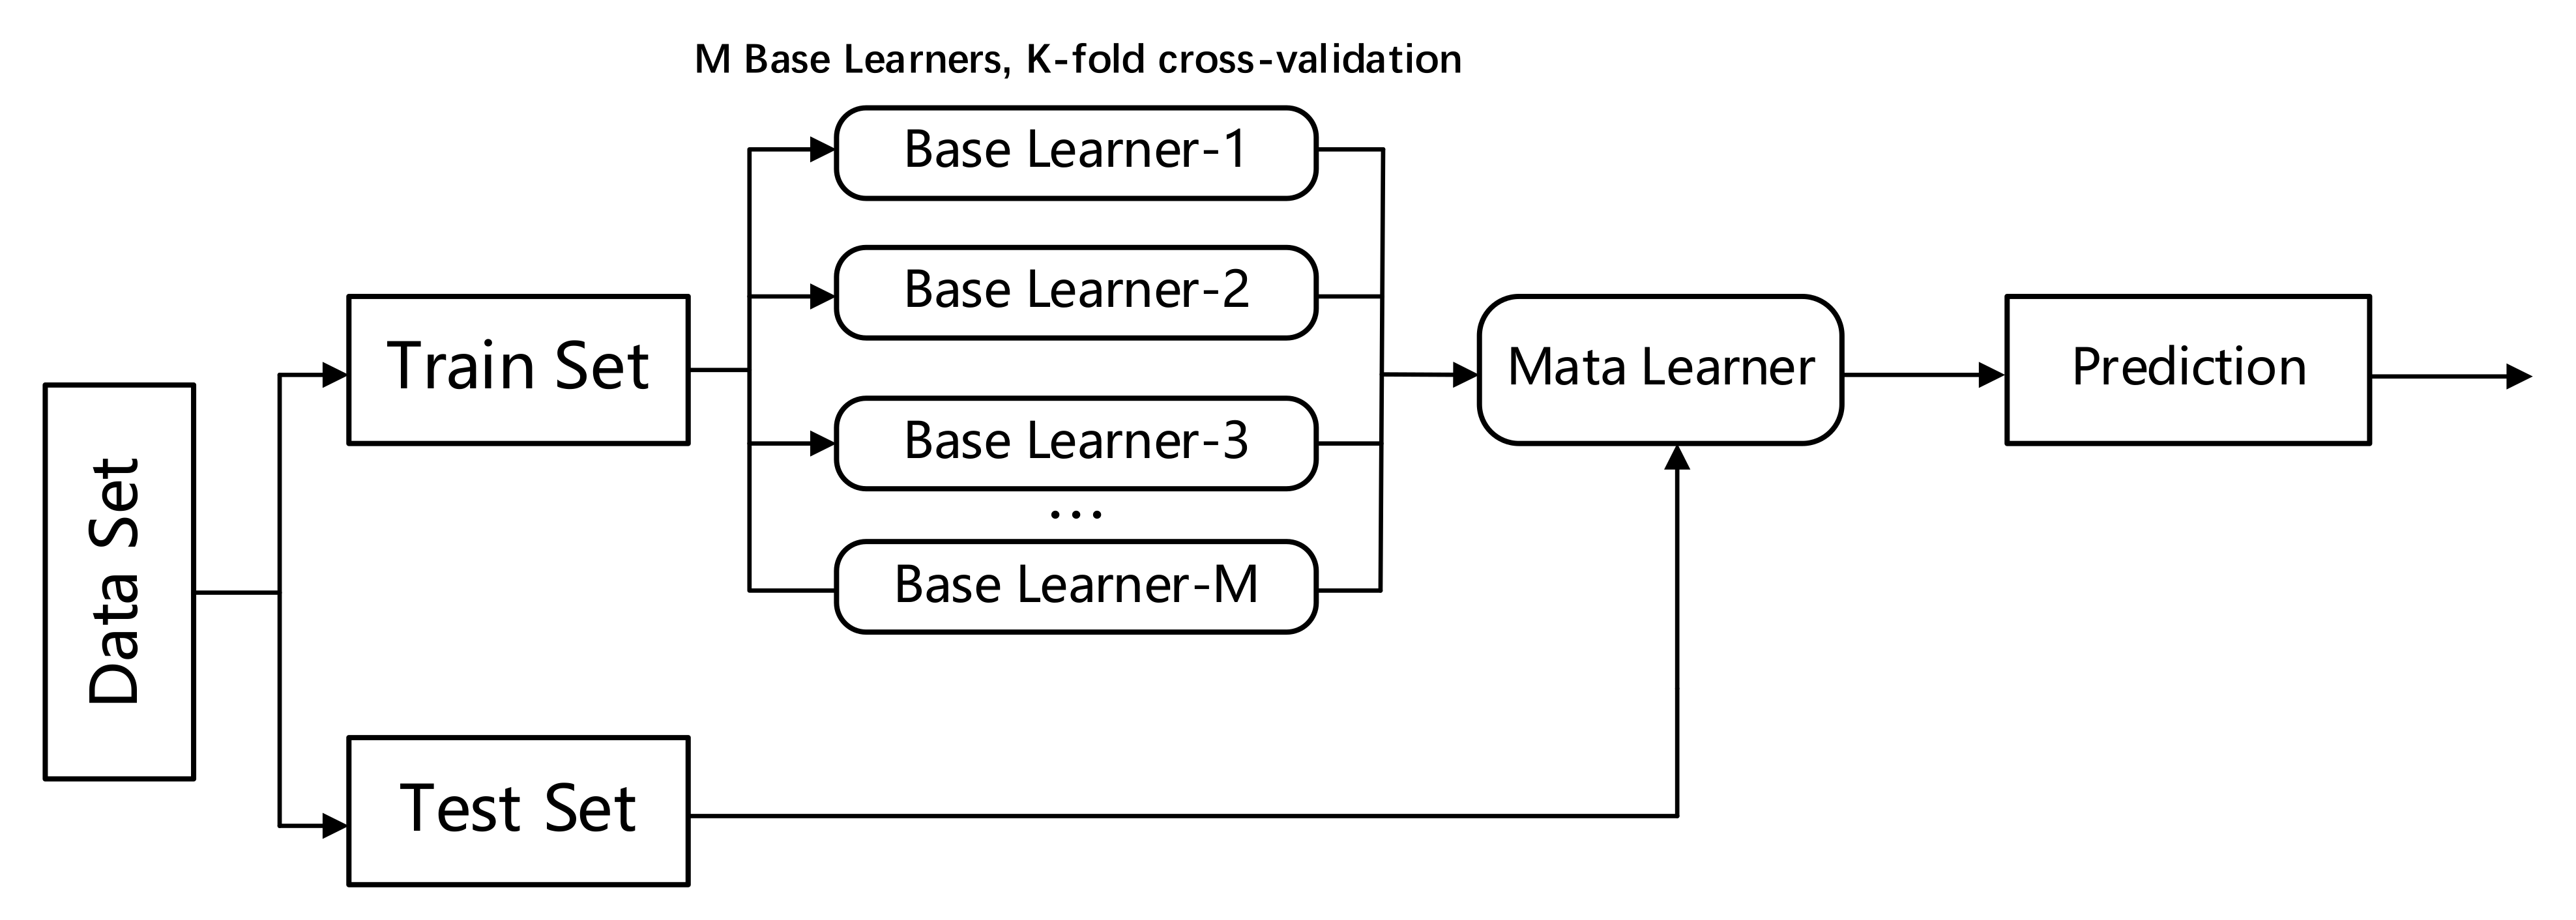
Stacking ensemble models improve the overall prediction accuracy by using a meta-learner to generalize the prediction results generated by all base learners. A commonly used stacking ensemble model has a two-layer structure, in which the first layer consists of multiple base learners whose inputs are the original training set, and the second layer is trained by the outputs of the first layer’s base learners. The flow chart is shown in
Figure 4 below.
For dataset , is the feature vector of the nth sample. Additionally, y is the label of the nth sample. We randomly divide the dataset into K subsets similar in size.
Assuming that there is a total M of base learners, the dataset T is divided into a training set and test set. The meta-learner’s training data and test data are combined by the prediction of each base learner in the training set and test set. In order to avoid over-fitting, k-fold cross-validation is used when generating training data for the meta-learner. The training set is divided into K groups, and the base model is trained on the K-1 group each time; the remaining dataset and the predicted value of the model in the dataset are output. In this way, the predictions of the base learner on the whole training set and the predictions based on the K group test set can be obtained after completing the k-fold cross verification. For M base models, the predictions of each base learner using the training set are integrated to obtain the training data of the meta-learner, and the dimensions are . The test data of the meta-learner can be obtained by averaging and integrating the prediction of each base learner into the test set, and the dimensions are . The meta-learner is trained based on the training data and predicted on the test data to get the final prediction of the stacking ensemble model.
To select base learners, we should follow two principles: The first is to select a learner with strong performance so as not to affect the overall performance of the model. In addition, the number of base learners should be determined according to the actual situation. The second is to choose learners that are considerably different from each other and as different from the base learner as far as possible so that each model can learn from the others. Additionally, the meta-learner should avoid overfitting, so we always choose a simple learner.
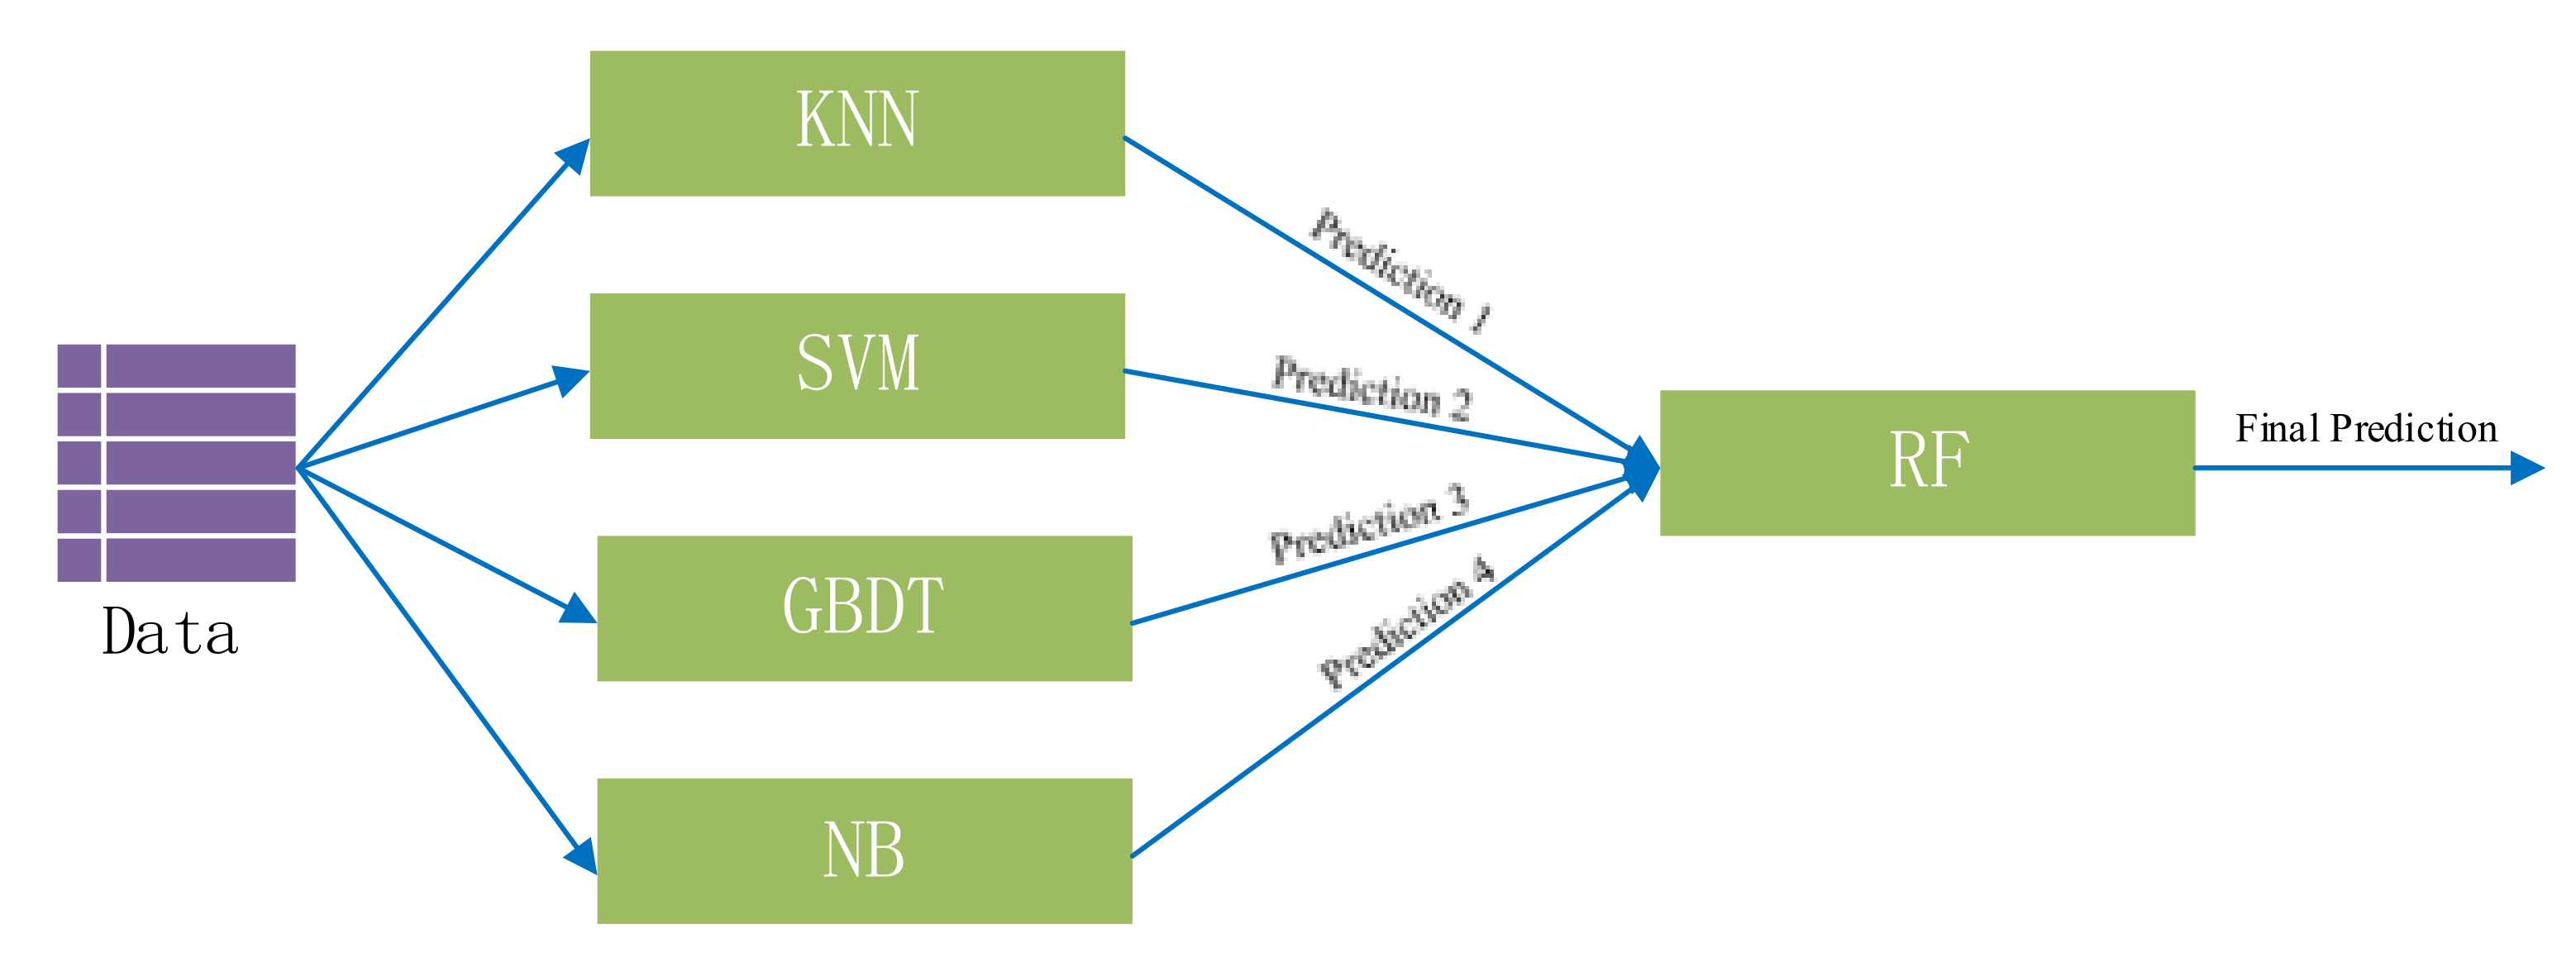
In our work, we used a two-level stacking ensemble model. The basic learners were k-nearest neighbor (KNN), one-vs-all support vector machine (SVM), gradient boosting decision tree (GBDT) and native Bayes (NB). At the top level, we used random forest (RF) to combine the predictions produced by the bottom level. The model structure is shown in
Figure 5.
The research methodology is organized as follows:
K-nearest neighbor (KNN), (n_neighbors = 5, algorithm= “auto”, weights= “uniform”, metric = “minkowski”);
Support vector machine (SVM) (on-vs-all, kernel = ‘rbf’, probability = True);
Gradient boosting decision tree (GBDT) (learning_rate = 0.1, n_estimators = 100);
Native Bayes (NB), GaussianNB;
Random Forest (RF) (100 trees, max_depth = None);
Training set accounted for 80%, test set accounted for 20%.
4. Experiments and Discussion
4.1. Dataset
The experimental dataset adopted in this paper has been described in
Section 3.1. Some of the data after data clearing and preprocessing are shown in
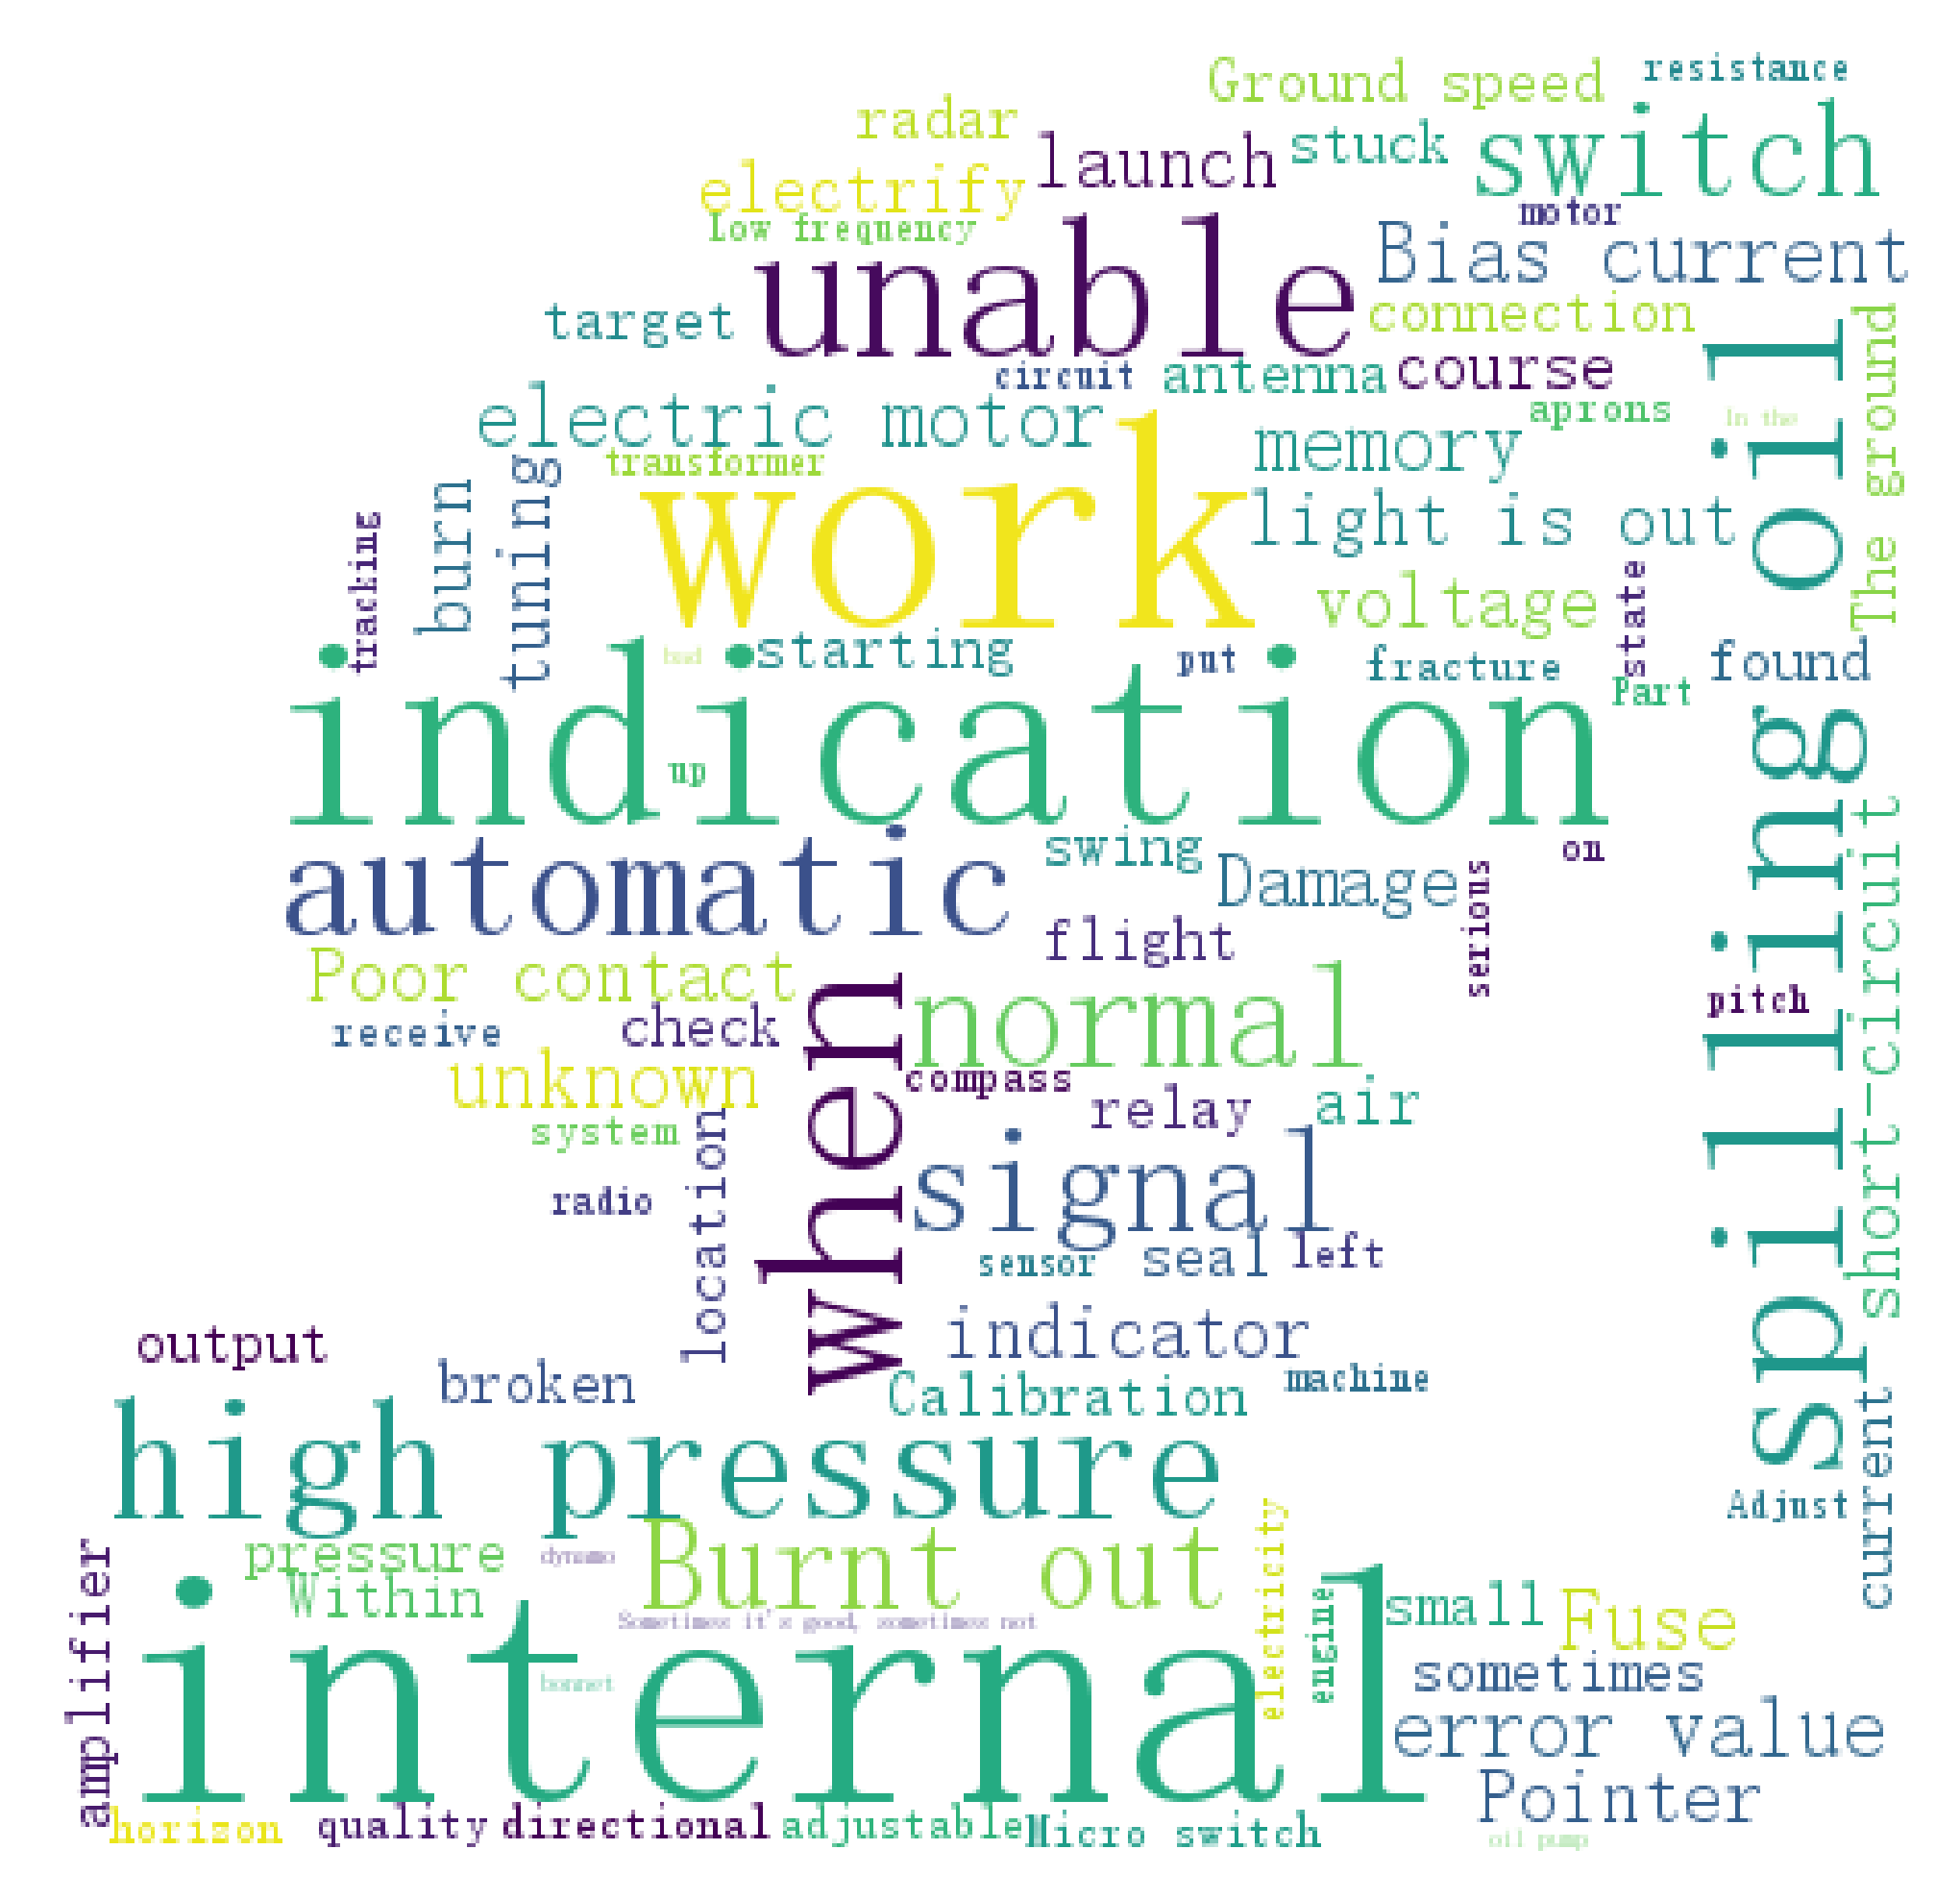
Table 2. Additionally, we have drawn a word cloud to more intuitively show the overall situation of the data. The word cloud art is shown in
Figure 6.
4.2. Experimental Results
To verify the effectiveness of our fault diagnosis model, we carried out a validation test on the real fault set using different indicators to comprehensively evaluate the performance.
For multi-class classification, multiple evaluation indicators are needed. The confusion matrix is shown in
Table 3. Each row of the confusion matrix represents the true category of data, and the total number of data instances in each row represents this category’s instances number. Each column represents the prediction category, and the total number of each column represents the number predicted for this category. Additionally, from it, the formulas of each indicator have been obtained [
39,
40]. The formulas of each indicator are as follows:
-score comprehensively considers precision and recall. Its formula is as follows:
After data cleaning and preprocessing, Word2vec was used to extract the text features and map the text to a 100-dimensional vector space. Then we trained the classification model to implement fault diagnosis based on fault text. To verify the superiority of the proposed fault diagnosis model, our model was compared with other models. The experiments were implemented with python software on a personal computer with Core i5-6300hq CPU, 8 GB memory, Windows10 64-bit system and the model took three minutes to complete the learning.
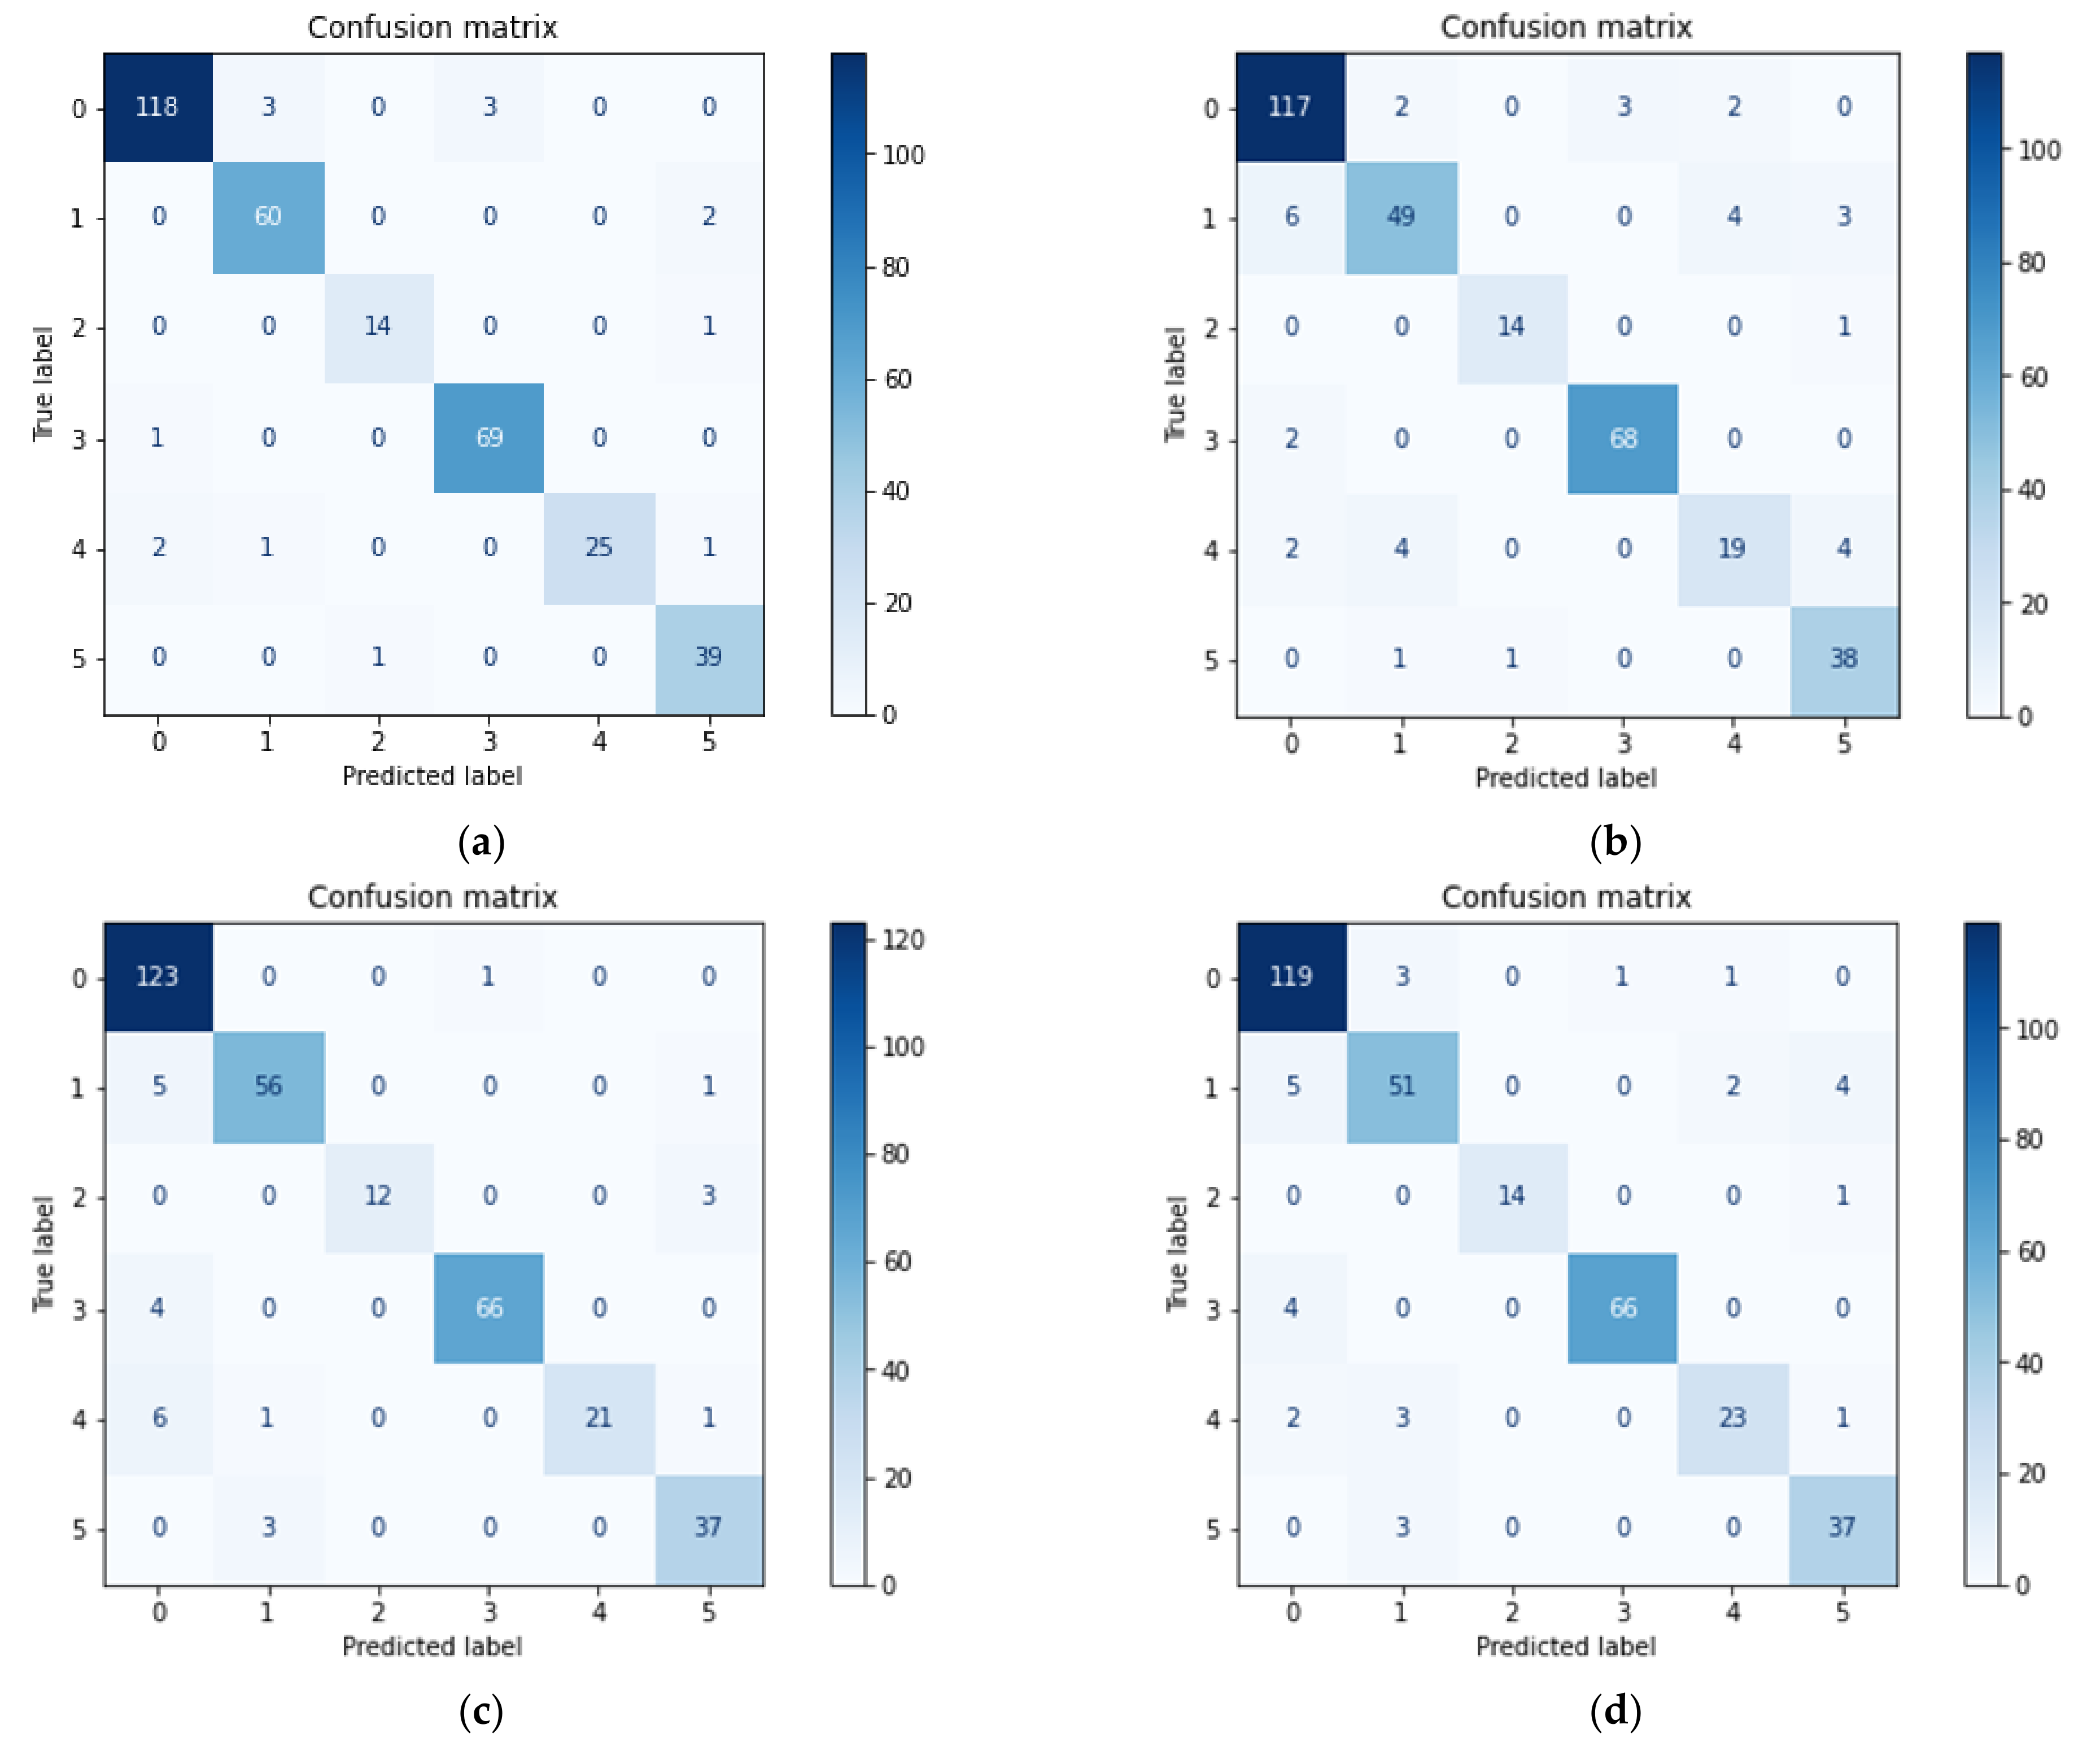
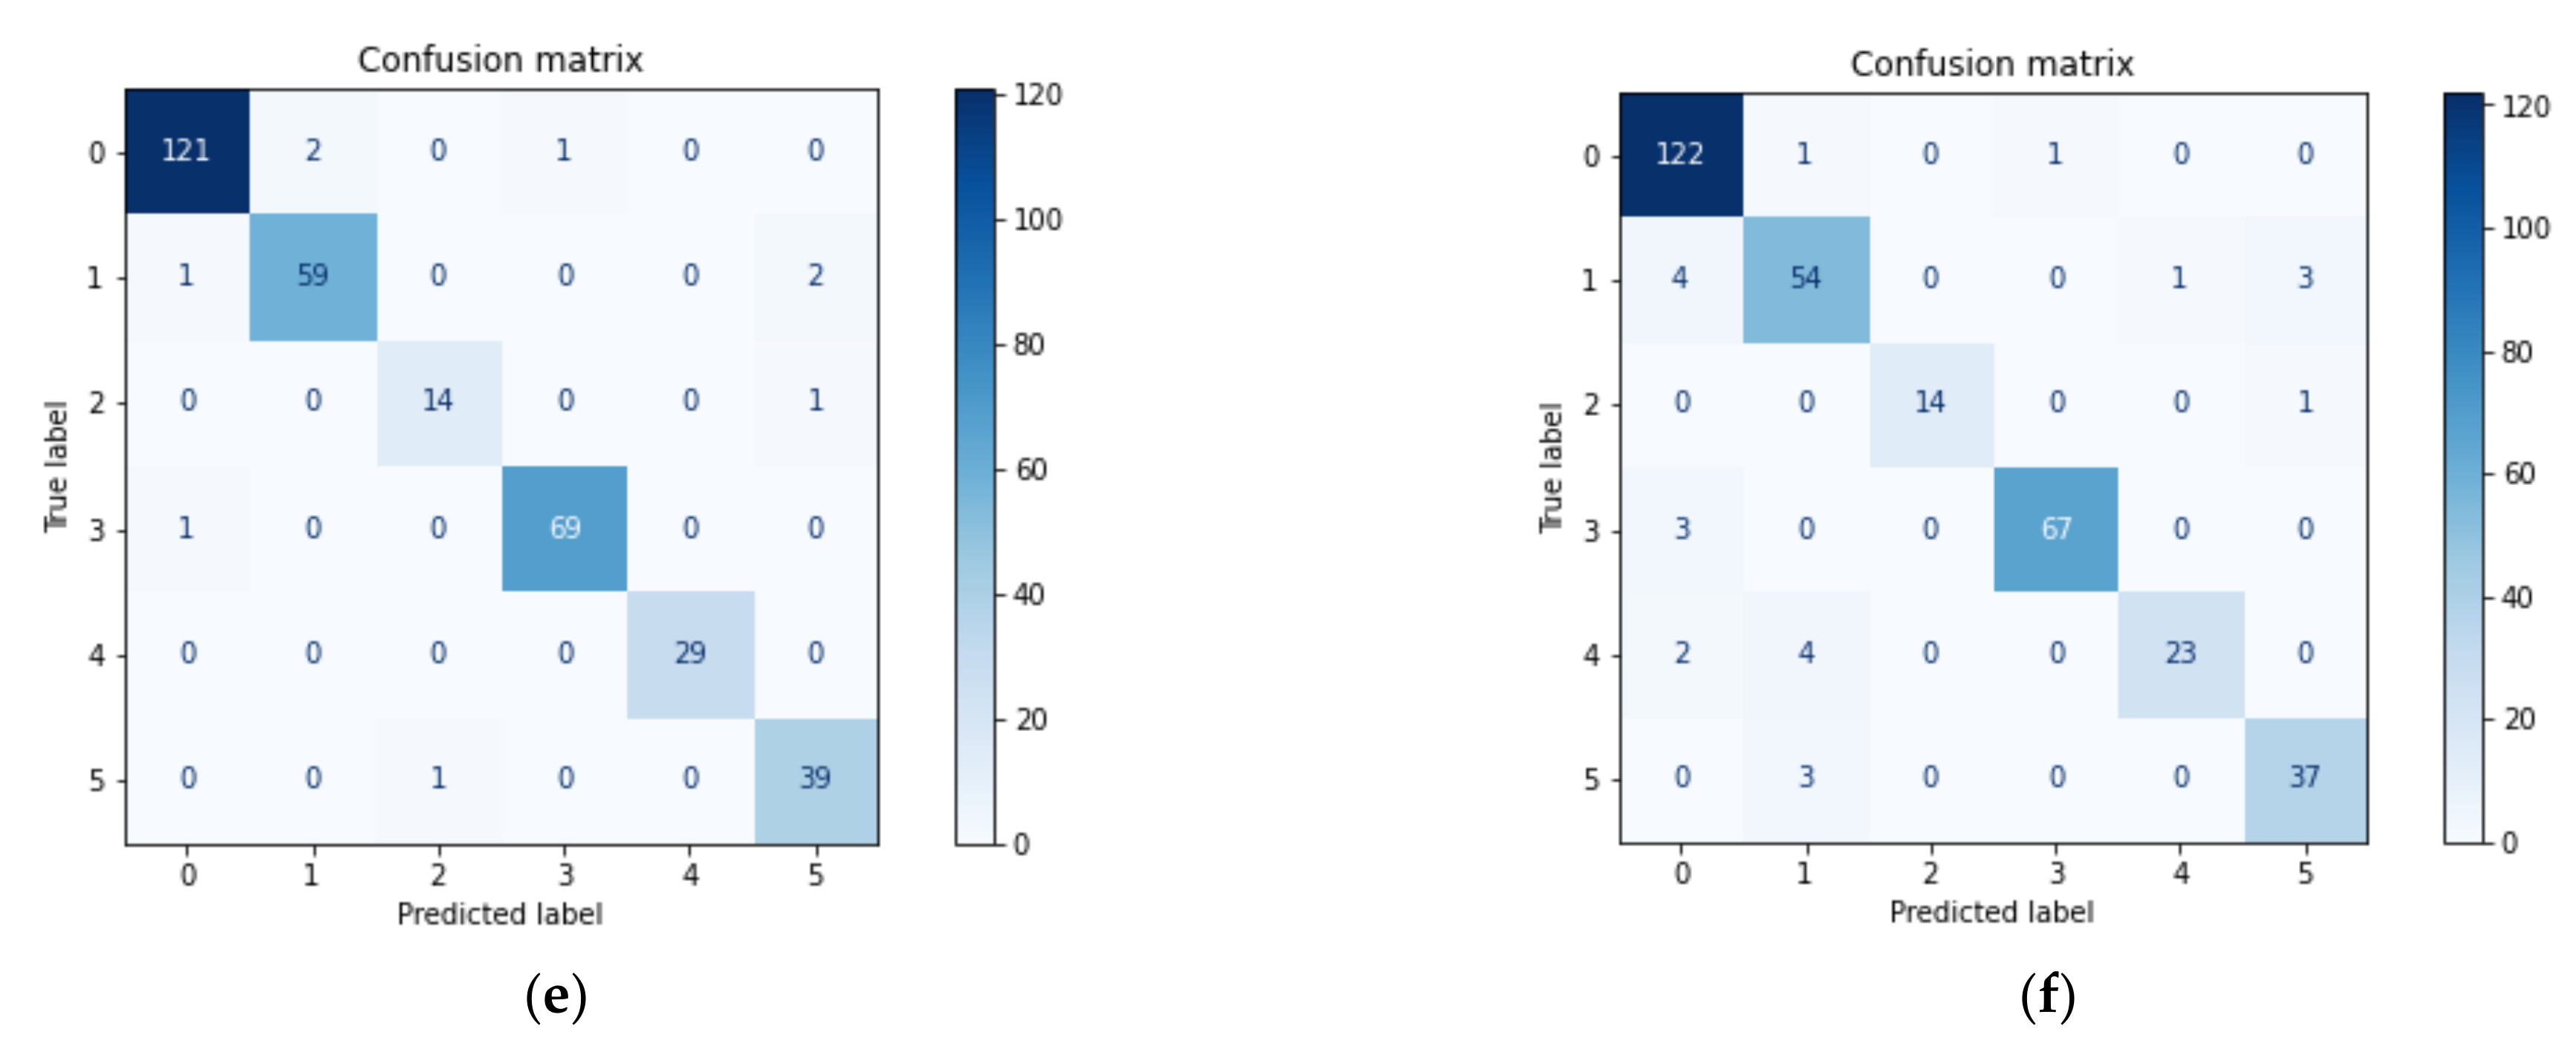
Table 4 shows that through the stacking ensemble scheme, the fault diagnosis model achieved the highest accuracy of 97.35%. To analyze the diagnostic effects of various faults,
Figure 7 lists the confusion matrices from different methods.
Figure 7a–c shows the diagnosis results of native Bayes, k-nearest neighbor and support vector machine. They are commonly used methods for text classification. For native Bayes, the accuracy was 0.9558. The establishment of Bayes’ theorem itself requires a strong conditional independence hypothesis, which is often untenable in practical situations, so its classification accuracy will decline. KNN’s accuracy was 0.8970. When the samples are unbalanced, the category of new samples is biased to the category with the dominant quantity in the training sample, which easily leads to prediction errors. SVM can obtain better results than other algorithms on small sample training sets, but it is sensitive to missing data and the selection of parameters and kernel functions. Finally, we can see that the diagnosis precision has been improved by using the stacking ensemble model. In the stacking model, the training results of the bottom layer are used as features to participate in the training of the first layer learner, which can effectively extract the valid features from the bottom layer and correct the prediction errors caused by each base learner in the bottom prediction model, so as to effectively improve the prediction accuracy of the model.
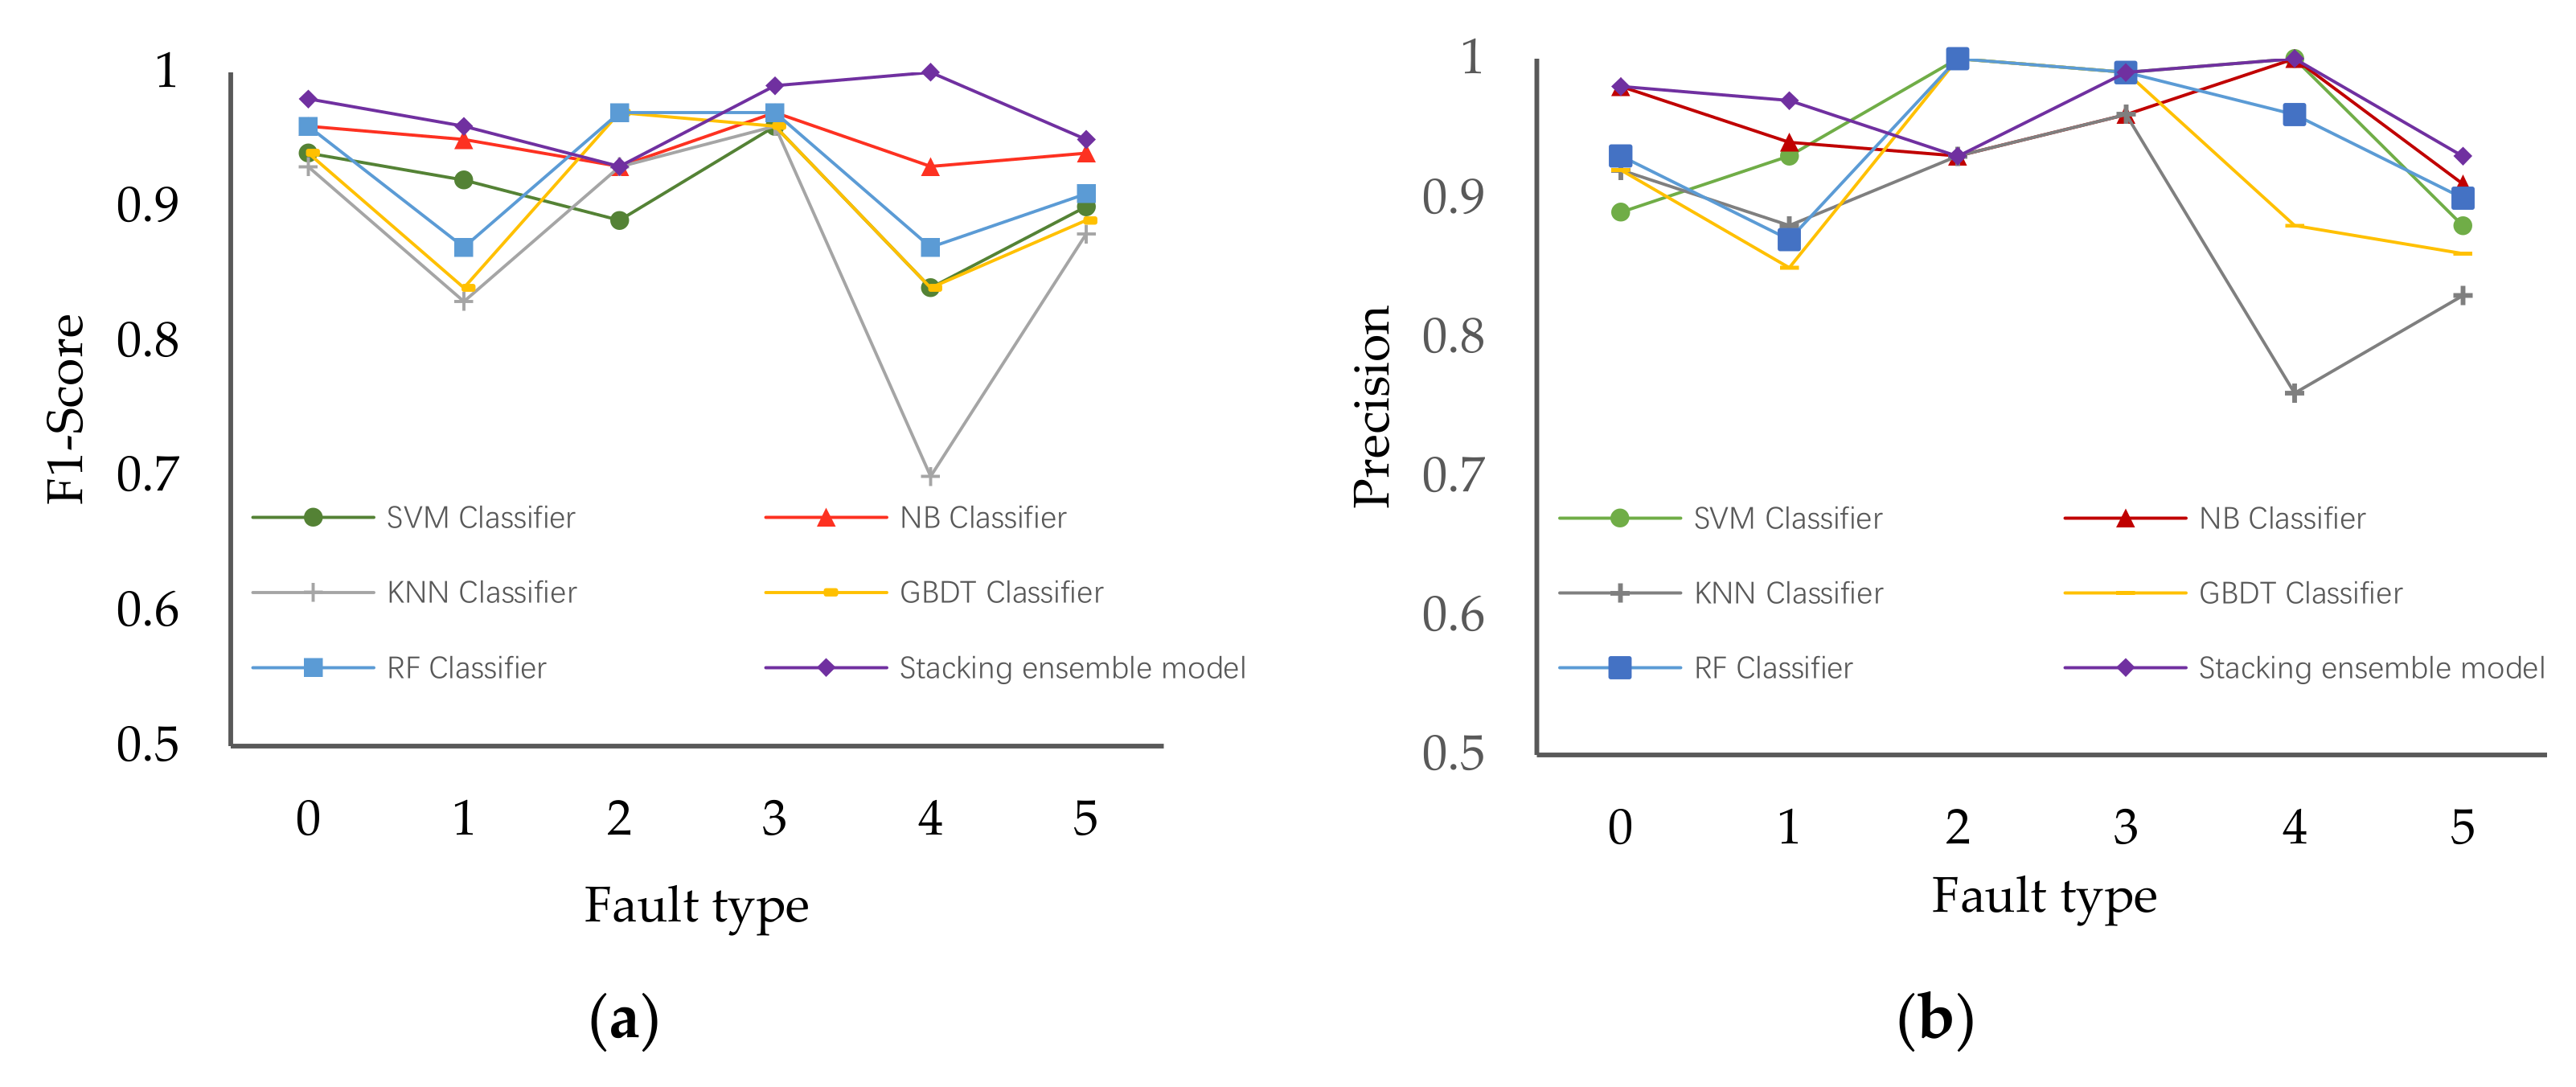
Figure 8 shows the F1-score and precision results for all categories by each model. Due to the imbalanced distribution of fault classes, the fault data in classes of small sample size were easily divided into classes of large sample size, resulting in poor fault diagnosis for small-sample-size classes. Combined with
Figure 8a,b, we can see that the stacking ensemble model also had good performance in identifying minority fault classes. Detailed data are shown in
Table 5 and
Table 6.
5. Conclusions
A large amount of unstructured data, such as text data recorded by aircraft fault maintenance activities, is insufficiently exploited, so we established an effective aircraft fault diagnosis model based on text data to provide decision support for aircraft maintenance work. We particularly emphasized fault feature extraction and fault diagnosis. First, as bag of words ignores the semantics of text and easily leads to dimension explosion and the LDA model has poor performance for short text processing, Word2vec—as a more efficient method—was used to perform text feature extraction. Second, to improve the performance of the classification model, we built a two-level stacking ensemble model to improve the overall prediction. The basic learners are k-nearest neighbor, one-vs-all SVM, gradient boosting decision tree and native Bayes. At the top level, we used random forest to combine the predictions produced by the bottom level.
The proposed fault diagnosis model was evaluated by precision, a confusion matrix and F1-score with a real dataset collected by a long-term maintenance and repair work. The experimental results show that the proposed method had the highest fault diagnosis accuracy among those tested, at 97.35%. Additionally, the F1-score and confusion matrix also verified the effectiveness of the proposed aircraft fault diagnosis model. Moreover, it has a better performance for minority fault classes, which can help in fault diagnosis with unbalanced data.
Author Contributions
Conceptualization, S.Z.; data curation, P.L. and A.L.; formal analysis, C.W.; funding acquisition, S.Z. and W.C.; investigation, P.L. and C.W.; methodology, S.Z. and W.C.; Project administration, W.C.; resources, Y.X.; supervision, S.Z.; validation, C.W. and A.L.; visualization, P.L. and C.W.; writing—original draft, C.W.; writing—review and editing, C.W. All authors have read and agreed to the published version of the manuscript.
Funding
This research was funded by the National Natural Science Foundation of China (Grant No. 71971013 & 71871003) and the Fundamental Research Funds for the Central Universities (YWF-20-BJ-J-943). The study was also sponsored by the Scientific Research Project of Beijing Institute of Economics and Management (21BSA04) and the Graduate Student Education & Development Foundation of Beihang University.
Institutional Review Board Statement
Not applicable.
Informed Consent Statement
Not applicable.
Data Availability Statement
Not applicable.
Conflicts of Interest
The authors declare no conflict of interest.
References
- Berry, M.W. Survey of text mining. Comput. Rev. 2004, 45, 548. [Google Scholar]
- Navathe Shamkant, B.; Elmasri, R. Data Warehousing And Data Mining. In Fundamentals of Database Systems; Pearson Education pvt Inc.: Singapore, 2000; pp. 841–872. [Google Scholar]
- Gupta, V.; Lehal, G.S. A survey of text mining techniques and applications. J. Emerg. Technol. Web Intell. 2009, 1, 60–76. [Google Scholar] [CrossRef]
- Pan, D.; Yang, J.; Zhou, G. The influence of COVID-19 on agricultural economy and emergency mitigation measures in China: A text mining analysis. PLoS ONE 2020, 15, e0241167. [Google Scholar] [CrossRef] [PubMed]
- Chen, S.; Guo, X.; Wu, T. Exploring the online doctor-patient interaction on patient satisfaction based on text mining and empirical analysis. Inf. Process. Manag. 2020, 57, 102253. [Google Scholar] [CrossRef]
- Chu, C.Y.; Park, K.; Kremer, G.E. A global supply chain risk management framework: An application of text-mining to identify region-specific supply chain risks. Adv. Eng. Inform. 2020, 45, 101053. [Google Scholar] [CrossRef]
- Harish, B.S.; Guru, D.S.; Manjunath, S. Representation and classification of text documents: A brief review. IJCA 2010, 2, 110–119. [Google Scholar]
- Schütze, H.; Manning, C.D.; Raghavan, P. Introduction to Information Retrieval; Cambridge University Press: Cambridge, UK, 2008. [Google Scholar]
- Zhao, H.; Liu, Z.; Yao, X. A machine learning-based sentiment analysis of online product reviews with a novel term weighting and feature selection approach. Inf. Process. Manag. 2021, 58, 102656. [Google Scholar] [CrossRef]
- Jiang, Z.; Gao, B.; He, Y. Text classification using novel term weighting scheme-based improved TF-IDF for Internet media reports. Math. Probl. Eng. 2021, 2021, 1425. [Google Scholar] [CrossRef]
- Pan, Q.; Huang, C.; Chen, D. A method based on multi-standard active learning to recognize entities in electronic medical record. Math. Biosci. Eng. MBE 2021, 18, 1000–1021. [Google Scholar] [CrossRef]
- Mohapatra, S.K.; Prasad, S.; Bebarta, D.K.; Das, T.K.; Srinivasan, K.; Hu, Y.-C. Automatic Hate Speech Detection in English-Odia Code Mixed Social Media Data Using Machine Learning Techniques. Appl. Sci. 2021, 11, 8575. [Google Scholar] [CrossRef]
- Dogan, T.; Uysal, A.K. A novel term weighting scheme for text classification: TF-MONO. J. Informetr. 2020, 14, 101076. [Google Scholar] [CrossRef]
- Blei, D.M.; Ng, A.Y.; Jordan, M.I. Latent dirichlet allocation. J. Mach. Learn. Res. 2003, 3, 993–1022. [Google Scholar]
- Jelodar, H.; Wang, Y.; Yuan, C. Latent Dirichlet allocation (LDA) and topic modeling: Models, applications, a survey. Multimed. Tools Appl. 2019, 78, 15169–15211. [Google Scholar] [CrossRef] [Green Version]
- Brzustewicz, P.; Singh, A. Sustainable Consumption in Consumer Behavior in the Time of COVID-19: Topic Modeling on Twitter Data Using LDA. Energies 2021, 14, 5787. [Google Scholar] [CrossRef]
- Liu, J.; Gao, L. Research on the Characteristics and Usefulness of User Reviews of Online Mental Health Consultation Services: A Content Analysis. Healthcare 2021, 9, 1111. [Google Scholar] [CrossRef]
- Zhang, N.; Zhang, R.; Pang, Z. Mining Express Service Innovation Opportunity From Online Reviews. J. Organ. End User Comput. (JOEUC) 2021, 33, 1–15. [Google Scholar] [CrossRef]
- Kim, D.; Seo, D.; Cho, S. Multi-co-training for document classification using various document representations: TF–IDF, LDA, and Doc2Vec. Inf. Sci. 2019, 477, 15–29. [Google Scholar] [CrossRef]
- Mikolov, T.; Chen, K.; Corrado, G. Efficient estimation of word representations in vector space. arXiv 2013, arXiv:1301.3781. [Google Scholar]
- Jatnika, D.; Bijaksana, M.A.; Suryani, A.A. Word2vec model analysis for semantic similarities in english words. Procedia Comput. Sci. 2019, 157, 160–167. [Google Scholar] [CrossRef]
- Djebko, K.; Puppe, F.; Kayal, H. Model-based fault detection and diagnosis for spacecraft with an application for the SONATE triple cube nano-satellite. Aerospace 2019, 6, 105. [Google Scholar] [CrossRef] [Green Version]
- He, W.; Guo, B.; Chen, B. A data-driven group-sparse feature extraction method for fault detection of wind turbine transmission system. Meas. Sci. Technol. 2020, 31, 074008. [Google Scholar] [CrossRef]
- Shen, Y.; Khorasani, K. Hybrid multi-mode machine learning-based fault diagnosis strategies with application to aircraft gas turbine engines. Neural Netw. 2020, 130, 126–142. [Google Scholar] [CrossRef]
- Berri, P.C.C.; Dalla Vedova, M.D.; Mainini, L. Learning for predictions: Real-time reliability assessment of aerospace systems. In Proceedings of the AIAA Scitech 2021 Forum, Online, 19–21 January 2021; p. 1478. [Google Scholar]
- Nguyen, N.P.; Huynh, T.T.; Do, X.P. Robust fault estimation using the intermediate observer: Application to the quadcopter. Sensors 2020, 20, 4917. [Google Scholar] [CrossRef]
- Nguyen, N.P.; Mung, N.X.; Thanh Ha, L.N.N. Finite-Time Attitude Fault Tolerant Control of Quadcopter System via Neural Networks. Mathematics 2020, 8, 1541. [Google Scholar] [CrossRef]
- Zhao, Y.P.; Wang, J.J.; Li, X.Y. Extended least squares support vector machine with applications to fault diagnosis of aircraft engine. ISA Trans. 2020, 97, 189–201. [Google Scholar] [CrossRef] [PubMed]
- Almansoori, N.N.; Malik, S.; Awwad, F. A Novel Approach for Fault Detection in the Aircraft Body Using Image Processing. In Proceedings of the AIAA Scitech 2021 Forum, Online, 19–21 January 2021; p. 520. [Google Scholar]
- Wei, W.; Zhao, X. Bi-TLLDA and CSSVM based fault diagnosis of vehicle on-board equipment for high speed railway. Meas. Sci. Technol. 2021, 32, 085005. [Google Scholar] [CrossRef]
- Wang, F.; Xu, T.; Tang, T. Bilevel feature extraction-based text mining for fault diagnosis of railway systems. IEEE Trans. Intell. Transp. Syst. 2016, 18, 49–58. [Google Scholar] [CrossRef]
- Xu, Z.; Chen, B.; Zhou, S. A Text-Driven Aircraft Fault Diagnosis Model Based on a Word2vec and Priori-Knowledge Convolutional Neural Network. Aerospace 2021, 8, 112. [Google Scholar] [CrossRef]
- Zhao, H.; Cai, D.; Huang, C. Chinese word segmentation: Another decade review (2007–2017). arXiv 2019, arXiv:1901.06079. [Google Scholar]
- Krishnaraj, N.; Elhoseny, M.; Lydia, E.L. An efficient radix trie-based semantic visual indexing model for large-scale image retrieval in cloud environment. Softw. Pract. Exp. 2021, 51, 489–502. [Google Scholar] [CrossRef]
- Ren, Y.; Zhang, L.; Suganthan, P.N. Ensemble classification and regression-recent developments, applications and future directions. IEEE Comput. Intell. Mag. 2016, 11, 41–53. [Google Scholar] [CrossRef]
- Dietterich, T.G. Ensemble Methods in Machine Learning. In International Workshop on Multiple Classifier Systems; Springer: Berlin/Heidelberg, Germany, 2000; pp. 1–15. [Google Scholar]
- Mendes-Moreira, J.; Soares, C.; Jorge, A.M. Ensemble approaches for regression: A survey. Acm Comput. Surv. 2012, 45, 1–40. [Google Scholar] [CrossRef]
- Divina, F.; Gilson, A.; Goméz-Vela, F. Stacking ensemble learning for short-term electricity consumption forecasting. Energies 2018, 11, 949. [Google Scholar] [CrossRef] [Green Version]
- Mitra, B.; Craswell, N. An introduction to neural information retrieval. Found. Trends® Inf. Retr. 2018, 13, 1–126. [Google Scholar] [CrossRef]
- Fernández, J.C.; Carbonero, M.; Gutiérrez, P.A. Multi-objective evolutionary optimization using the relationship between F 1 and accuracy metrics in classification tasks. Appl. Intell. 2019, 49, 3447–3463. [Google Scholar] [CrossRef]
| Publisher’s Note: MDPI stays neutral with regard to jurisdictional claims in published maps and institutional affiliations. |
© 2021 by the authors. Licensee MDPI, Basel, Switzerland. This article is an open access article distributed under the terms and conditions of the Creative Commons Attribution (CC BY) license (https://creativecommons.org/licenses/by/4.0/).


