Article

Estimation and Separation of Longitudinal Dynamic Stability Derivatives with Forced Oscillation Method Using Computational Fluid Dynamics

1
Department of Aerospace Information Engineering, Konkuk University, Seoul 05029, Korea
2
Konkuk Aerospace Design Airworthiness Institute, Seoul 05029, Korea
3
Department of Smart Vehicle Engineering, Konkuk University, Seoul 05029, Korea
*
Author to whom correspondence should be addressed.
Aerospace 2021, 8(11), 354; https://doi.org/10.3390/aerospace8110354
Submission received: 11 September 2021 / Revised: 8 November 2021 / Accepted: 11 November 2021 / Published: 19 November 2021

Abstract

:
This paper focuses on estimating dynamic stability derivatives using a computational fluid dynamics (CFD)-based force oscillation method, and on separating the coupled dynamic derivatives terms obtained from the method. A transient RANS solver is used to calculate the time history of aerodynamic moments for a test model oscillating about the center of gravity, from which the coupled dynamic derivatives are estimated. The separation of the coupled derivatives term is carried out by simulating simple harmonic oscillation motions such as plunging motion and flapping motion which can isolate the pitching moment due to AOA rate ( C m α ˙ ) and the pitching moment due to pitch rate ( C m q ), respectively. The periodic motions are implemented using a CFD dynamic mesh technique with user-defined function (UDF). For the validation test, steady and unsteady simulations are performed on the Army-Navy Finner Missile model. The static aerodynamic moments and pressure distribution, as well as the coupled dynamic derivative results from the pitching oscillation mode, show good agreement with the previously published wind tunnel tests and CFD analysis data. In order to separate the coupled derivative terms, two additional harmonic oscillation modes of plunging and flapping motions are tested with the angle of attack variations from 0 to 85 degrees at a supersonic speed to provide real insight on the missile maneuverability. The cross-validation study between the three oscillation modes indicates the summation of the individual plunging and flapping results becoming nearly identical to the coupled derivative results from the pitching motion, which implies the entire set of coupled and separated dynamic derivative terms can be effectively estimated with only two out of three modes. The advantages and disadvantages of each method are discussed to determine the efficient approach of estimating the dynamic stability derivatives using the forced oscillation method.

1. Introduction

The dynamic stability derivatives of flight vehicles are key parameters for the evaluation of aerodynamic characteristics, control system design, and flight qualities. Its importance grows for fighter-type aircraft requiring high maneuverability and operability in the high angle of attack range, and for tailless stealth-type aircraft which is likely to have unsteady dynamic characteristics. For conventional aircraft flying at low speed and low angle of attack, static stability derivatives alone are sufficient to predict moment generated by the aircraft maneuver [1]. Non-linear aerodynamic phenomena like boundary layer separation, vortex oscillation, and vortex breakdown are bound to happen at a higher angle of attack, especially for cases of transonic or supersonic regimes where shock waves are more likely to happen [2]. To obtain a better flight model, an aerodynamic model with accurate dynamic derivatives is needed especially for higher angle of attack regime flight where dynamic derivatives can provide a significant effect [3].
One of the traditional ways to obtain the dynamic derivative information is through flight tests [4], but the actual flight tests are very costly and risky. Another traditional approach that has been actively explored to obtain dynamic stability derivatives is the wind tunnel experiments [5,6]. However, the wind tunnel test method can be also limited and become costly by the complex experimental set-up to simulate various dynamic motions. In addition, the inertial force produced by oscillating test model should be eliminated from the measured aerodynamic data, which requires accurate synchronization between the motion history and the measured moment data. The small discrepancy in the synchronization can result in a very large error source in the dynamic derivative results; therefore, a very accurate and careful experimental set-up is required. There is also the scaling problem, not to mention another issue in the wind tunnel concerning support interference issues. In the case of high angle of attack and high Mach number regime, these factors hinder the analysis to accurately predict the aerodynamic properties of the model. In addition, there is also the vibration device delay error of measurement data due to the mechanical nature of the physics phenomenon of the vibrating device. These are some of the limiting factors for a wind tunnel test [7,8,9].
To overcome these shortcomings, along with the recent rapid growth in computational capabilities, these dynamic stability derivatives can be analyzed using a computational fluid dynamics (CFD) method. The evolution of computing capacity and dynamic grid development techniques such as dynamic mesh allows high-dimensional analysis of more complex models. With these capabilities, the dynamic stability derivatives can be analyzed more efficiently using the numerical analysis method.
Several studies use numerical analysis methods for dynamic stability analysis [7,10,11,12,13,14]. Most of the current research regarding dynamic derivatives analysis provides a good method for obtaining the combined dynamic stability derivatives of pitch damping coefficients. The concept of stability for the aerodynamic derivatives at the linear range with the small disturbance was introduced by Bryan [15]. According to him, aerodynamics and flight dynamics can be decoupled then the aerodynamic forces and moment are expressed as functions of several static and dynamic parameters, such as disturbance velocities, control angles, and their rates of change. For 2D cases, there is an early analytical method applied to simple configurations like the analysis method by Theodorsen for 2D NACA 0012 Airfoil [16], which are then improved in identifying the directional and sideslip derivatives for flow around a thin airfoil at the supersonic speed [17]. There are also time-domain methods to analyze these dynamic stability derivatives that can obtain various dynamic derivatives from solving the unsteady flow field and its time-based related parameters, using a forced oscillation method [18,19,20]. This method works by forcing an aircraft to oscillate around its center of gravity with a constant magnitude of angular displacement. One of the simple displacement methods that can be used is the simple harmonic oscillation (SHO) method. By forcing the aircraft to oscillate around its center of gravity with simple harmonic motion, the unsteady aerodynamics calculated with CFD tools can be used to obtain the dynamic stability derivatives [13]. The dynamic stability derivatives that can be acquired through this method are C m 0 , C m α , and ( C m q + C m α ˙ ). Besides C m 0 and C m α , the longitudinal pitch damping coefficient derivatives always comes in its coupled forms of ( C m q + C m α ˙ ) because the change in angle of attack are related to its alpha changing rate and pitching rate where these two components always come together thus create a coupling of these derivatives. This coupled form is sufficient to create a linear aerodynamic model of the aircraft. However, in order to have better fidelity at higher angle of attack and higher Mach number, these coupled coefficient needs to be acquired as a separate coefficient. The separation of these coupled derivatives components into C m q and C m α ˙ allows higher order of aerodynamic model to be generated more accurately. The separation of dynamic stability derivatives components could increase the fidelity of the dynamic derivatives model at unsteady and non-linear aerodynamics area.
In 2011, Newman [21] proposed using the forced oscillation in a water tunnel for a standard dynamics model (SDM). This was then further investigated by Erm [22], where the water tunnel’s SDM analysis result was compared with the wind tunnel analysis result. The capability of forced oscillation analysis using CFD has been proved to obtain single and coupled dynamic stability derivatives [11,13]. For further analysis, the yawing oscillations method could also be computed similarly with the longitudinal oscillations analysis method [23]. So far there have only been analyses of dynamic stability derivatives separation analysis for low to high number Mach number with a small range of angle of attack (alpha). For alpha above 20 degrees [22] or 30 deg for the aircraft cases, a complex interaction of the strake and wing vortices develops [7], hence the non-linear flight model with separated dynamic coefficient are needed to accurately describe the aerodynamics phenomenon happens at higher alpha. A new-generation fighter aircraft’s angle of attack limit could reach up to 40–50 deg or even more. Meanwhile, for missile cases, the required angle of attack tests analysis is up to 90 deg or more. That is why further investigations for the capabilities of separating the dynamic stability derivatives are needed to define the limits of when and what methods work for which cases.
The goal of this paper is to obtain an efficient method of separating the longitudinal dynamic stability derivatives coefficients using CFD analysis for a wide range of angles of attack at higher Mach numbers. The method used is forced simple harmonic oscillation method with its three oscillation modes variations. Although the first modes, which are widely known as simple harmonic pitching oscillation, are commonly conducted in the wind tunnel test, the other two variations require more complex instruments and set-up, which makes them easier to conduct in the numerical analysis domain compared to the experimental domain. Using the combination and variation of these methods, dynamic stability derivatives are expected to be efficiently separated. The case condition that is analyzed for this analysis includes high Mach number with high angle of attack of dynamic stability derivatives analysis cases.

2. Methodology

2.1. Moment Calculation

For the longitudinal moment coefficient calculation, the mathematical expression of the forces and moments can be obtained by a Taylor series expansion, and the linearized equation may be rewritten for the aerodynamics moment coefficient for the unsteady analysis as [24]:
C m ( t ) = C m 0 + C m α ( α α 0 ) + C m α ˙ α ˙ k ω + C m q q k ω
where C m 0 is not affected by any transient motion, C m α is affected by the change in alpha (angle of attack), C m α ˙ is affected by the change in alpha rate, and C m q is affected by the change in pitch rate.
There are three modes of simple harmonic oscillation for the forced oscillation method: pitching mode, plunging mode, and flapping mode. These oscillation methods are illustrated in Figure 1. To achieve these kinds of oscillations motion, each mode has a different input combination of translational and angular velocity along the x-y-z axes. These inputs are implemented into CFD setup using user-defined input (UDF) for each mode following the axis system as shown in Figure 2, where x-axis is the lateral axis, y-axis is the longitudinal axis, and z-axis. The summary of UDFs for the three modes is shown in Table 1 where the α 0 is the initial angle of attack, α A is the pitching amplitude, z A is the plunging amplitude, θ A is the theta amplitude, and ω is the angular velocity.

2.2. Forced Simple Harmonic Oscillation

2.2.1. Pitching Mode

The first one is forced pitching simple harmonic oscillation (pitching mode) that analyzes the dynamic stability derivatives by oscillating the model around its center of gravity/moment reference point. The oscillation for this method is made by defining a constant sinusoidal angular velocity along the longitudinal axis of the aircraft without any translation movement.
By defining that,
Δ θ = θ ( t ) = θ A sin ω t
α ( t ) = α 0 + α A sin ( ω t )
q = θ ˙
and combining Equations (2) and (3) into Equation (4), we can obtain:
θ ˙ ( t ) = q ( t ) = α ˙ ( t ) = α A ω cos ω t
Using non-dimensionalised aerodynamic time parameter, the Equation (1) become:
C m ( t ) = C m o + C m α α A sin ( ω t ) + ( C m q + C m α ˙ ) c 2 V α A ω cos ( ω t )
If we are to rewrite Equation (6) in a general way, it becomes:
C m = C m o + C m α ( Δ θ ) + ( C m q + C m α ˙ ) c 2 V θ ˙
This equation can then be rewritten in matrix form to process the unsteady C m data from CFD analysis [21]. From that matrix equation, we can get the dynamic stability derivatives of C m o , C m α , and ( C m q + C m α ˙ ) in its coupled form from the pitching mode analysis.

2.2.2. Plunging Mode

The second one is the forced plunging simple harmonic oscillation (plunging mode). This motion makes the model moves in a plunging motion without any change in the pitching angle. Therefore, this movement eliminates the effect of moment coefficients due to pitch rate. We can get a C m α ˙ from this movement. The UDF is made by giving translational velocity in the z-direction and zero angular velocity.
The vibration equation for this motion is:
α ( t ) = α 0 + α A sin ( ω t )
θ ( t ) = 0
Following these, we can modify Equation (7) as:
C m = C m o + C m α ( Δ θ ) + ( C m α ˙ ) c 2 V θ ˙
Since there is no change in the pitching rate, the only change in the angle of attack comes from the plunging motion which gives the angle of attack rate of change. The ( C m q + C m α ˙ ) the coefficient in Equation (7) becomes C m α ˙ , thus we can get a separate value of C m α ˙ from this plunging mode method.

2.2.3. Flapping Mode

The third mode is the forced flapping motion; this motion is made by moving the missile plunging along the z-axis while constantly rotating it on the y-axis. This movement eliminates the change in the angle of attack faced by the missile relative to the free stream. Thus, the C m α ˙ component is eliminated from the equation:
α ( t ) = α 0
θ ( t ) = θ A sin ( ω t )
Equation (7) becomes,
C m = C m o + C m α ( Δ θ ) + ( C m q ) c 2 V θ ˙
For this movement, since there is not any change in angle of attack, there is only a change in the pitch rate. With the same method for the plunging mode, we can use this method to obtain the separated C m q for the flapping mode.

3. Numerical Analysis

3.1. Computational Fluid Dynamics

3.1.1. Geometry Configuration

The model used for this analysis is Army-Navy Basic Finner Missile which was designed and fabricated at VKF. This missile was used for many years as a reference projectile and it was tested extensively in other aeroballistic ranges and wind tunnels [26]. The CAD model was generated based on the configuration of this missile in the technical report paper at AEDC wind tunnel data of supersonic missile testing [27]. The model has a 20° nose cone on a cylindrical body with four rectangular fins. The separation analysis uses the Finner missile with l / d = 10 as the model. Using 1 caliber equal to 0.03175 m, the model diameter is measured as 1 caliber with the fins having a chord of 0.923 calibers and an overall span of 3 calibers. The model has a total length of 10 calibers with a moment reference point/pivot axis located at 6.1 calibers behind the nose as shown in Figure 3. This model was balanced to have the center of gravity on the flexure pivot axis. The test was conducted with Ø = 45 deg as shown in Figure 2b.

3.1.2. Mesh Configuration

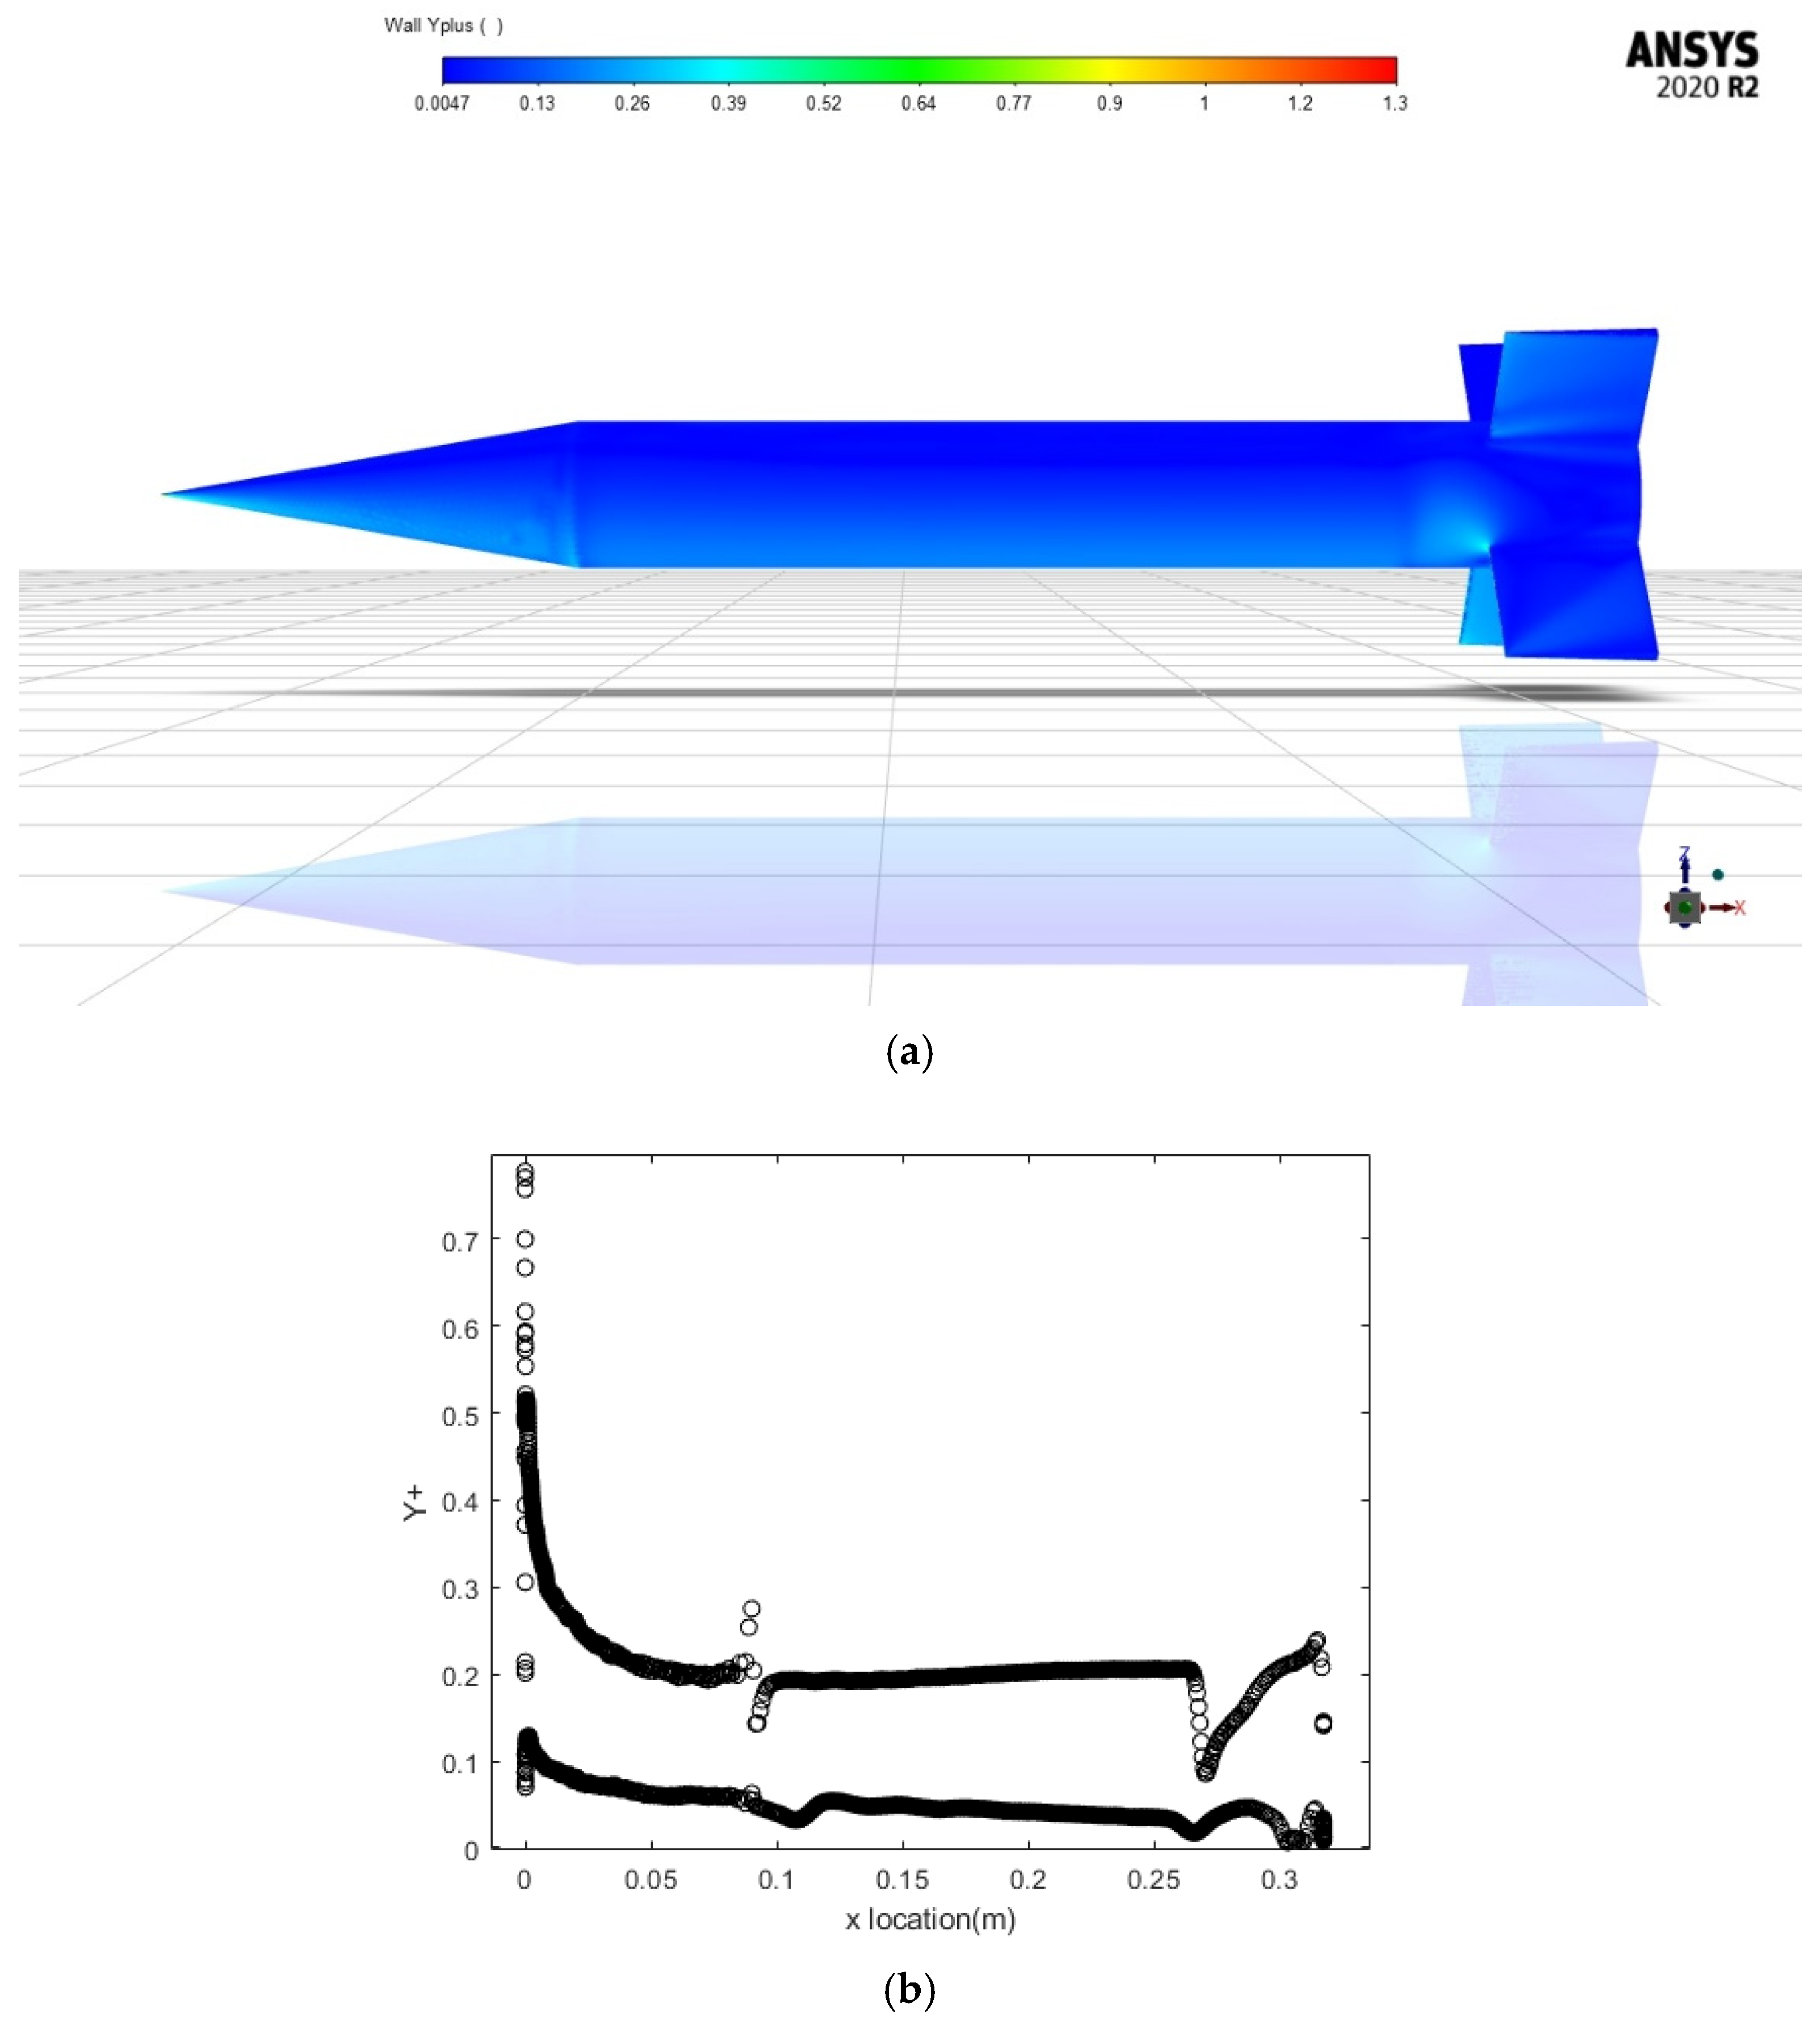
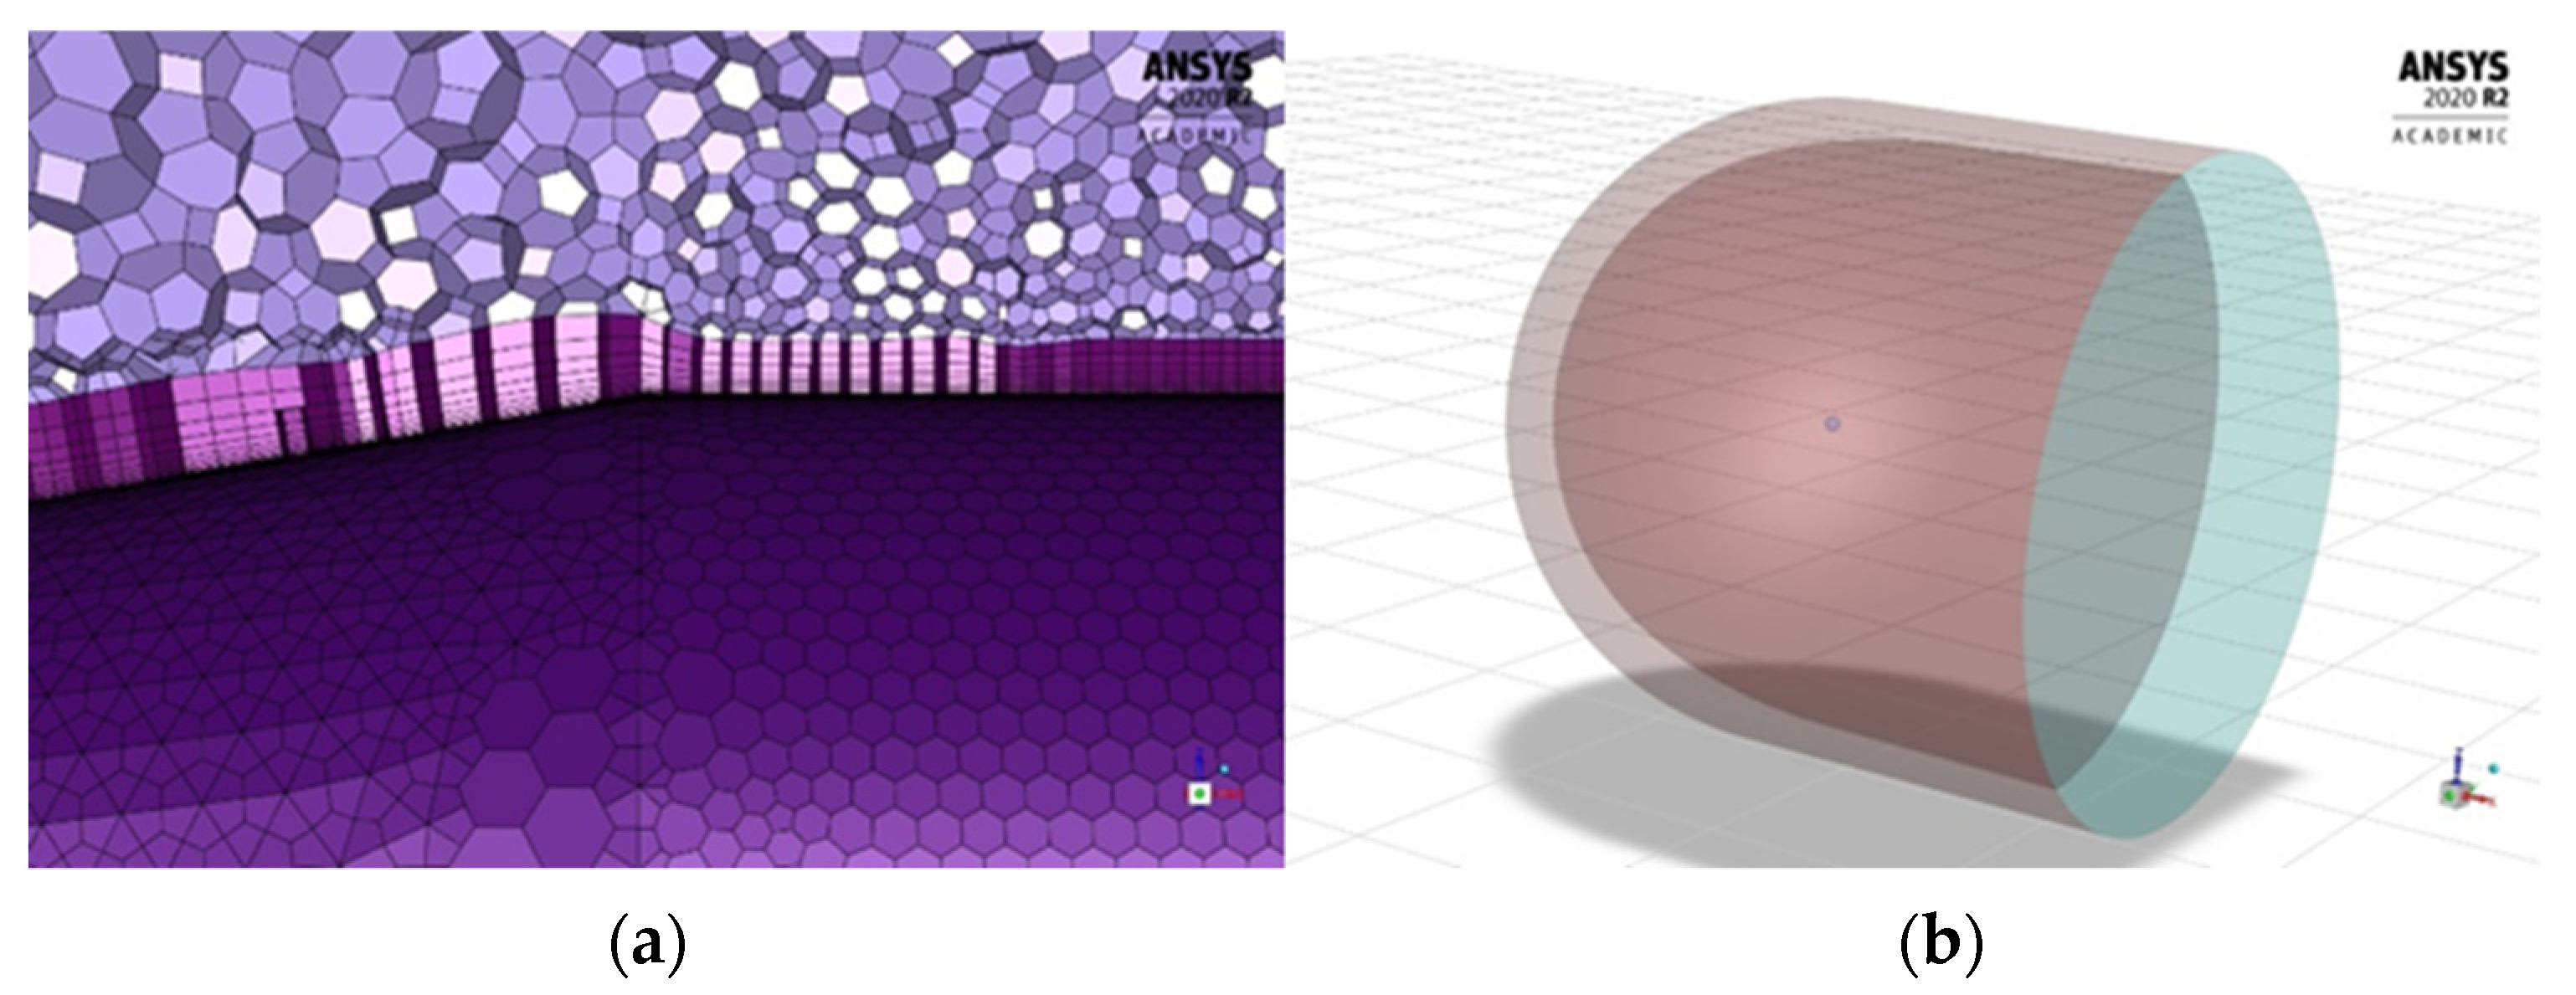
For the CFD analysis, a 3D CAD model of the Finner missile on the physical domain is transformed into numerical domain using unstructured meshing method. The surface mesh was made using Ansys fluent meshing with unstructured triangle mesh. To obtain a good flow accuracy near the wall boundary layer, a 20 layer of prism mesh with Yplus equal to 1 was applied on top of the surface mesh. Yplus value decides how well the mesh can capture the boundary layer flow phenomenon of the model since it described how small is the distance of the first layer of the boundary layer mesh. This mesh then grows into volume mesh using tetra mesh configuration. To increase the convergence rate and to reduce the mesh size, this unstructured mesh is then converted into polyhedral mesh using ANSYS fluent meshing as shown in Figure 4. This The final Yplus distribution along the mesh model can be seen in Figure 5. This distribution corresponds with the prism layer growth along the surface wall as shown in Figure 6a.
Considering the high Mach and high range of angle of attack analysis, the far-field (Figure 6b) size is made with 50 times the size of length reference ( l = 10 d ) along the positive x-direction and 25 times to the other direction. The extra size to the backside direction of the far-field is to accommodate the compressible flow so it can converge well.

3.1.3. Mesh Convergence Study

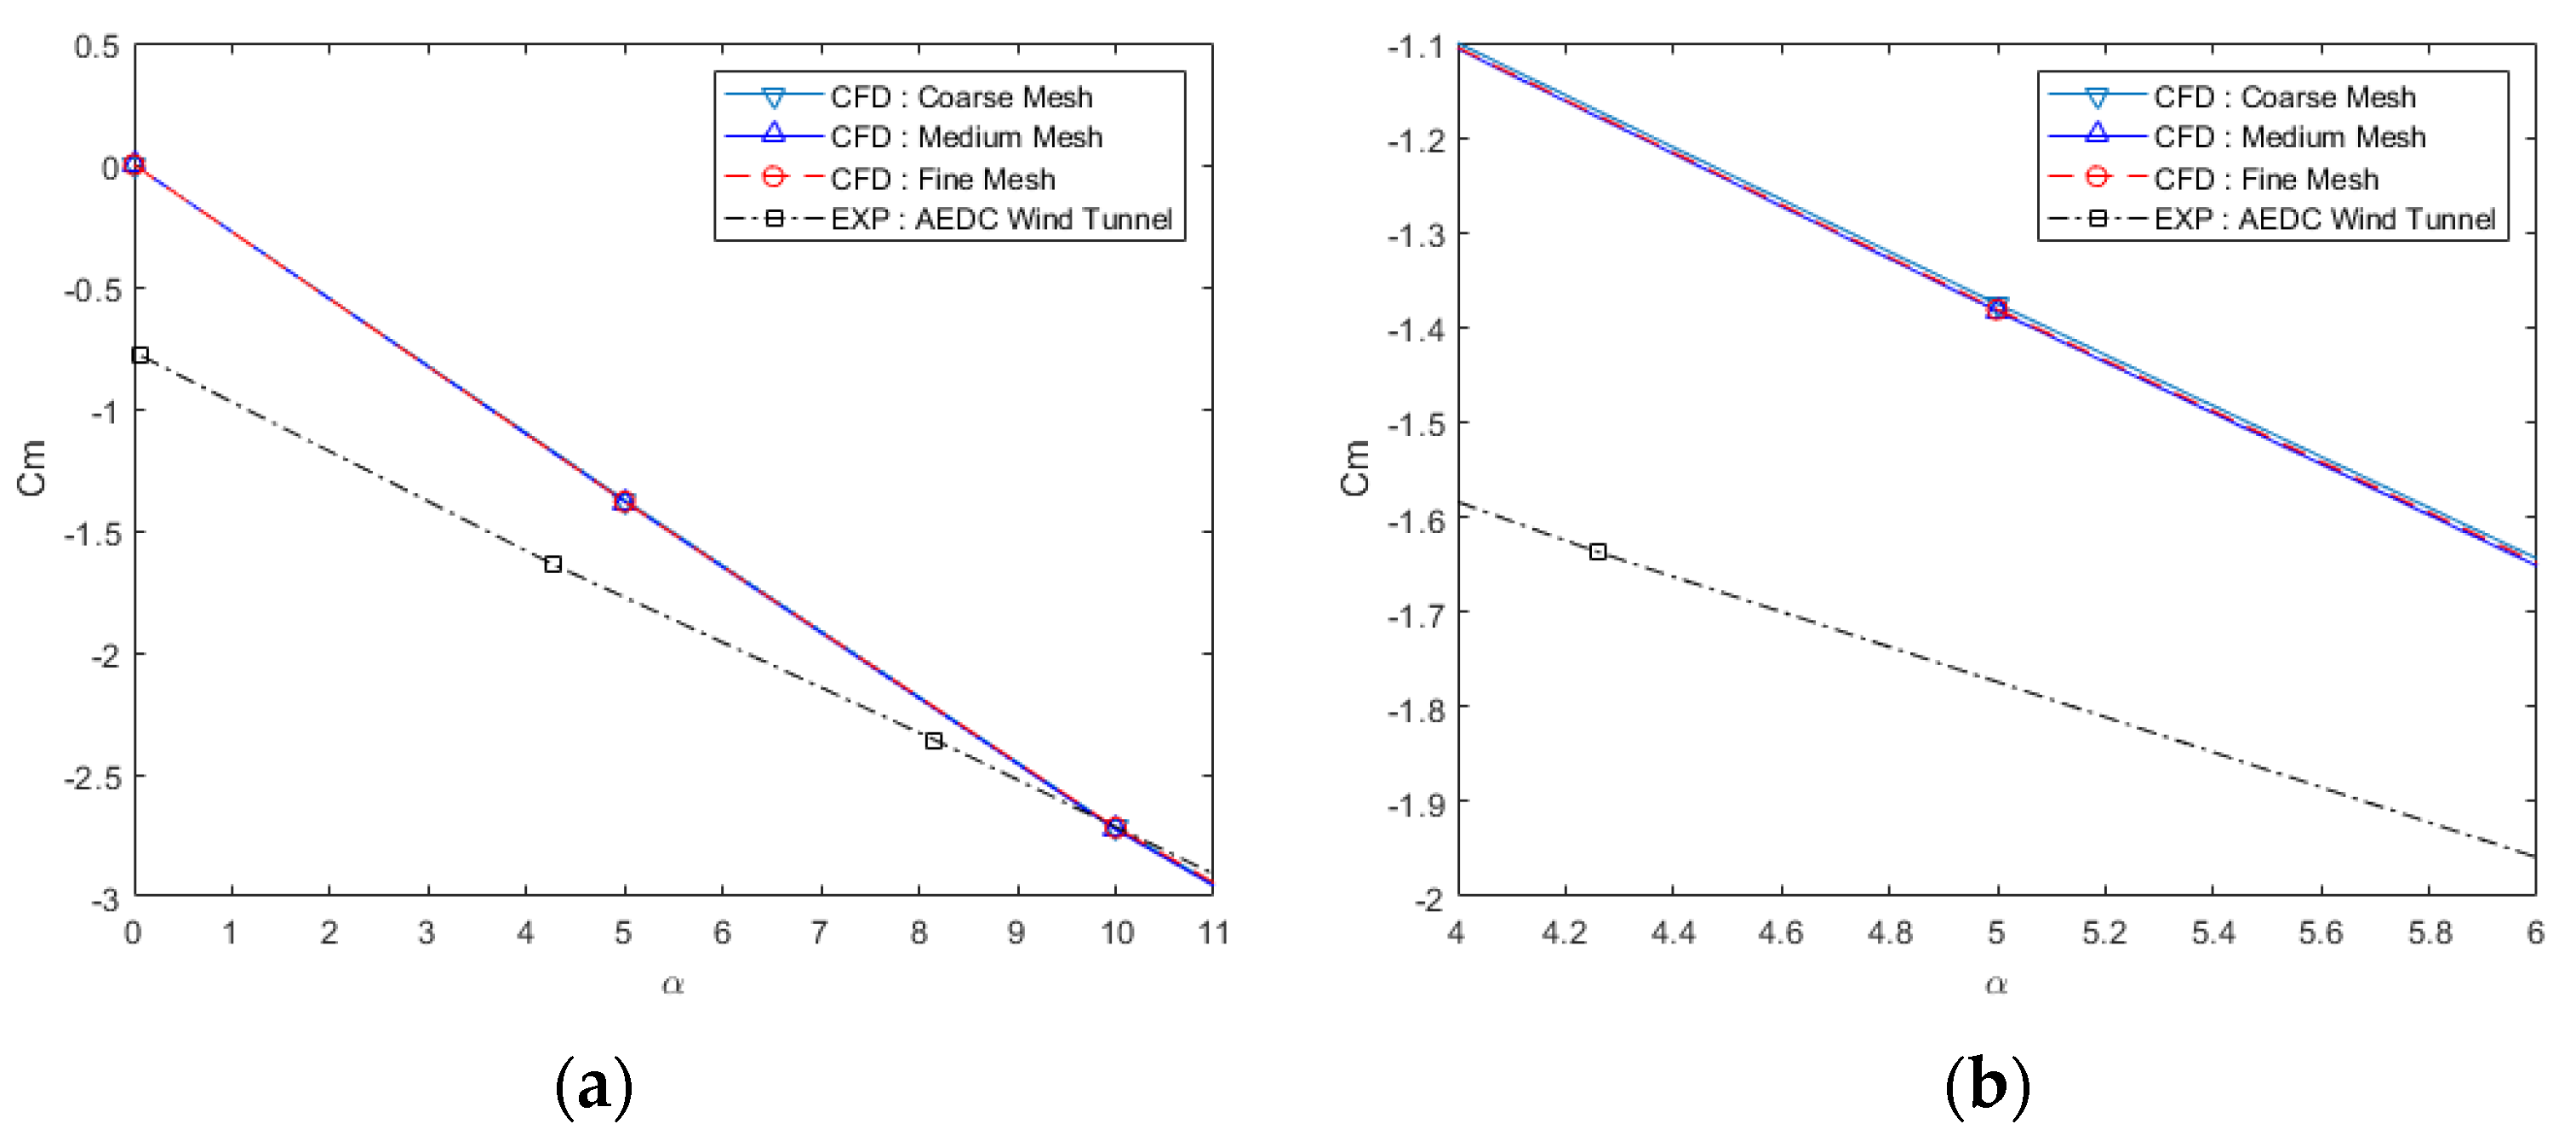
To determine the dependence of the result regardless of the mesh density, the mesh dependence study test is undertaken with three types of mesh density: coarse, medium, and fine. The test is undertaken for steady angle of attack sweep analysis from 0, 5, and 10 deg angle of attack. The test was undertaken with the same flow setting as in Table 2 and the longitudinal moment coefficient (CM) is compared with the wind tunnel result.
Figure 7a shows that all of the mesh models have good accuracy, however, Figure 7b shows that the fine mesh with a total mesh size of 2,506,824 cells has the best accuracy among all of the three models. Benefiting from the polyhedral mesh conversion that helps reduce the mesh number size greatly, the fine mesh density can be chosen for the simulations. Further grid validations are presented later using pertinent aerodynamic coefficients.

3.1.4. Dynamic Mesh

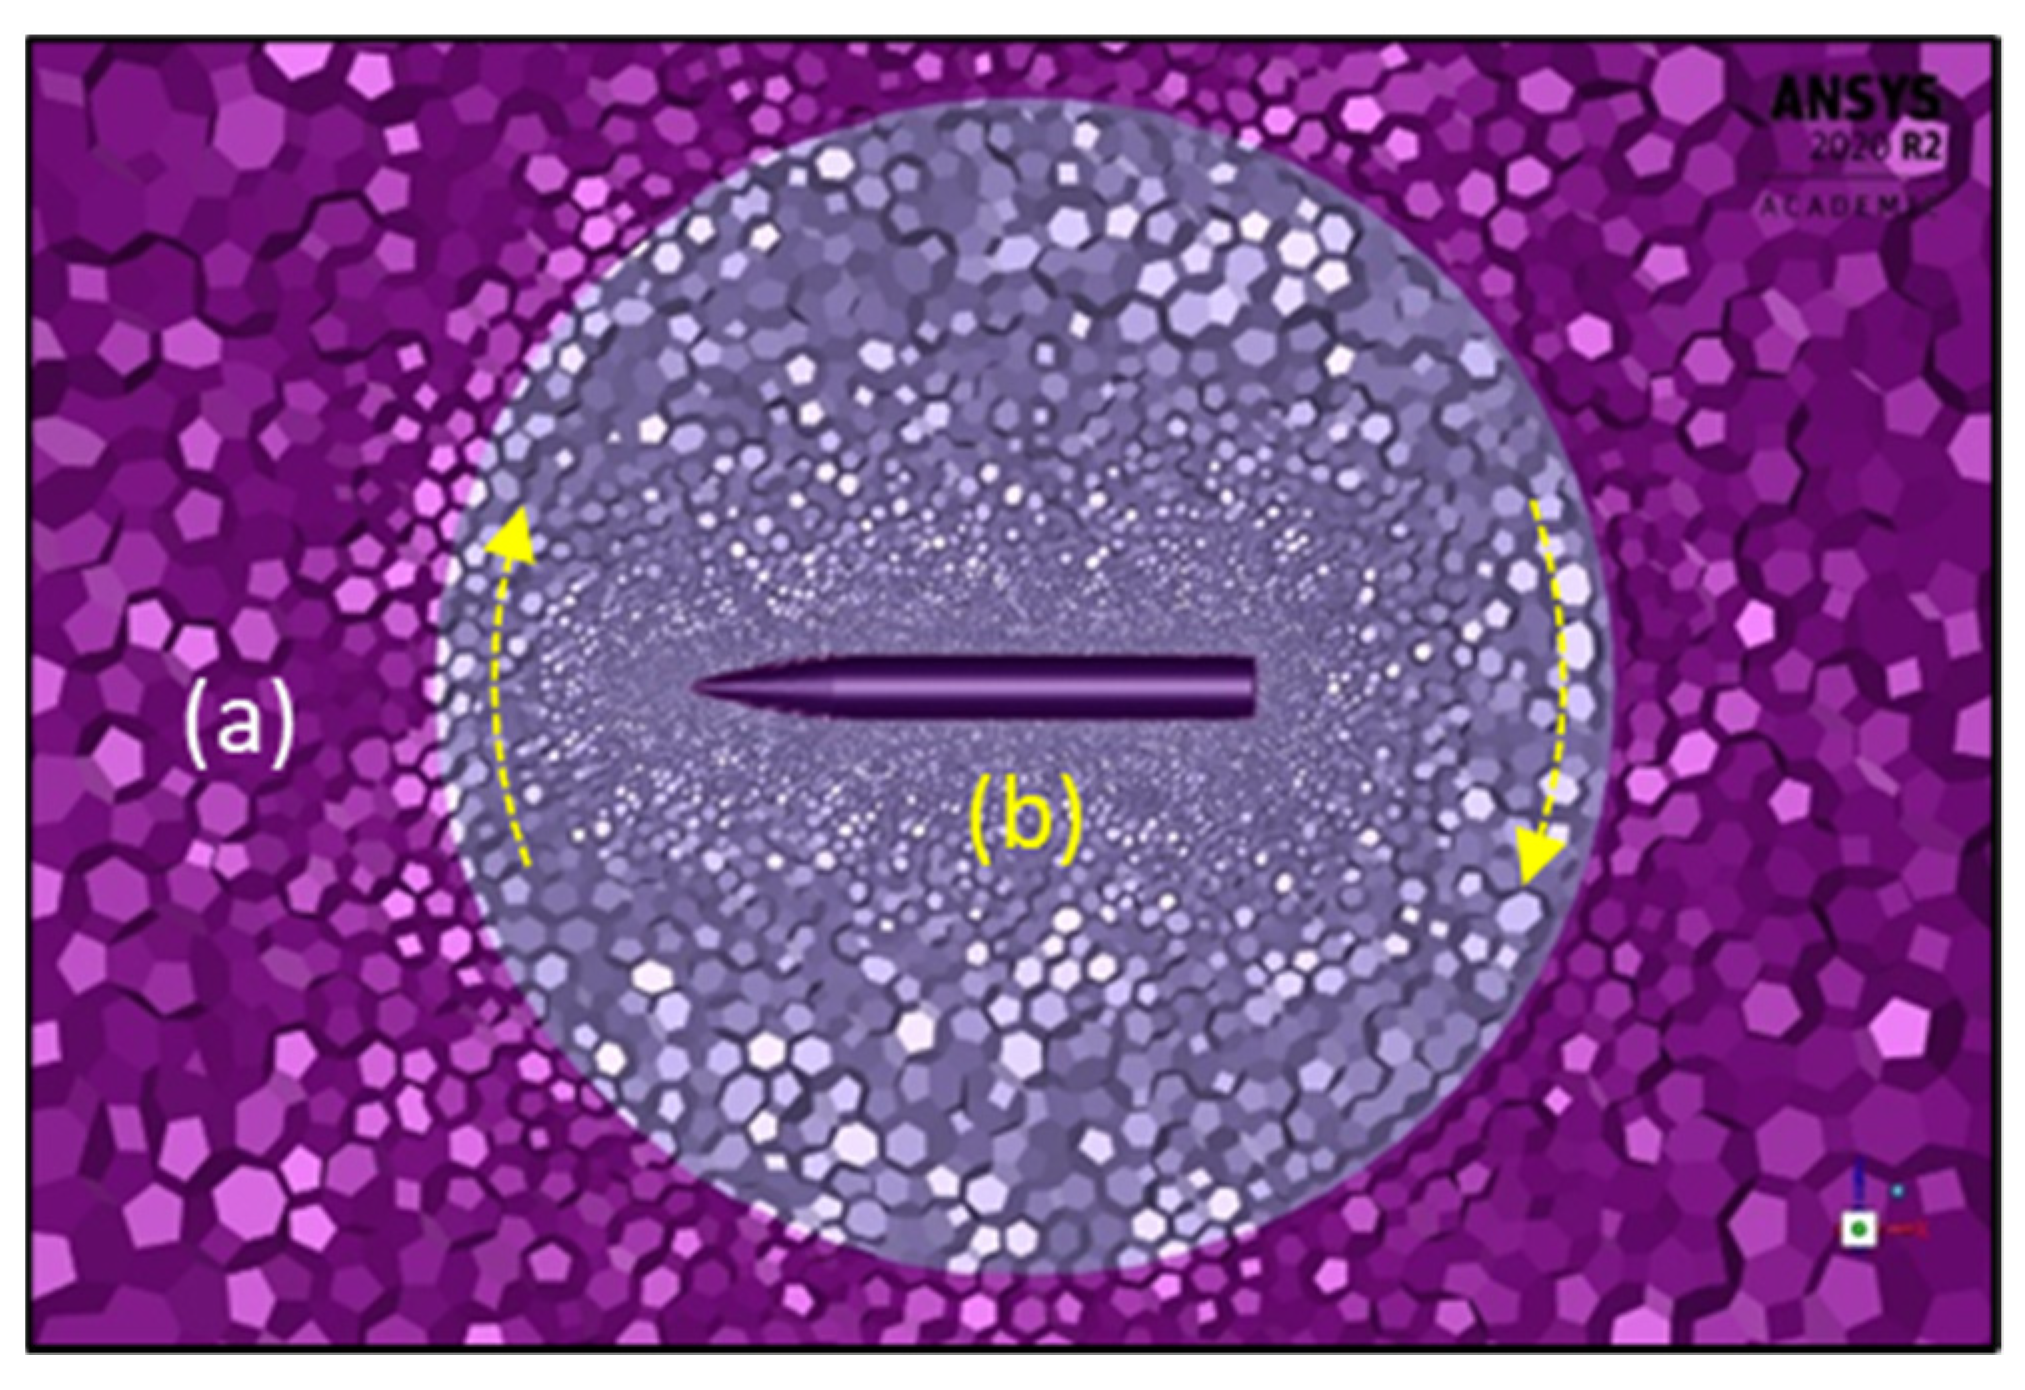
For dynamic stability analysis, the transient unsteady analysis method uses a dynamic mesh. A relatively smaller sphere compared to a far-field is made to enclose the model. This sphere is moving rigidly with the surface and boundary layer mesh. The outer part of this sphere rigidly stays with no movement relative to the far-field. The area in between these two zones (Figure 8) is the dynamic mesh area where mesh update by smoothing and remeshing happens every time-step increment. The purpose of the small sphere is to ensure that the dynamic mesh interaction occurs way outside the prism boundary layer where the mesh size is relatively larger, and more uniform compared to the mesh around the surface of the model. Hence, it reduces the loads and complexity for each mesh update lessens, which can help to prevent skewed or negative volume mesh occurring during the smoothing and remeshing process.
To set up the dynamic meshing method, prescribed motion is set in UDF in Fluent [28]. There are six components in the UDF, three components of translational velocity and three of angular velocity. There are a total of three UDF for three simple harmonic oscillation modes. For the first UDF, the pitching motion of the model can made by giving the angular velocity with the sinusoidal motion along the y-axis. For the second UDF, the plunging motion is made by providing the velocity in the translational direction along the z-axis only. For the third UDF, the flapping motion is made by combining both input from the first and the second motion, providing the angular velocity along the y-axis and translational velocity along the z-axis. The summary of the UDF for each mode can be seen in Table 1.

3.2. Solver Setting

For the CFD analysis, a commercial flow solver Ansys Fluent 2020 R2 [29] is used. This software provides comprehensive modeling capabilities for the calculation of steady and unsteady flow. The three-dimensional compressible fluid flow is solved using Reynolds-averaged Navier Stokes (RANS). Considering the flow is supersonic, the turbulence model is Spalart–Allmaras (SA) because SA is proven to provide a comparative and accurate result as a 1-equation turbulence model with faster computation compared to other turbulence models with 2-equation or more in compressible flow with unstructured grids [30].
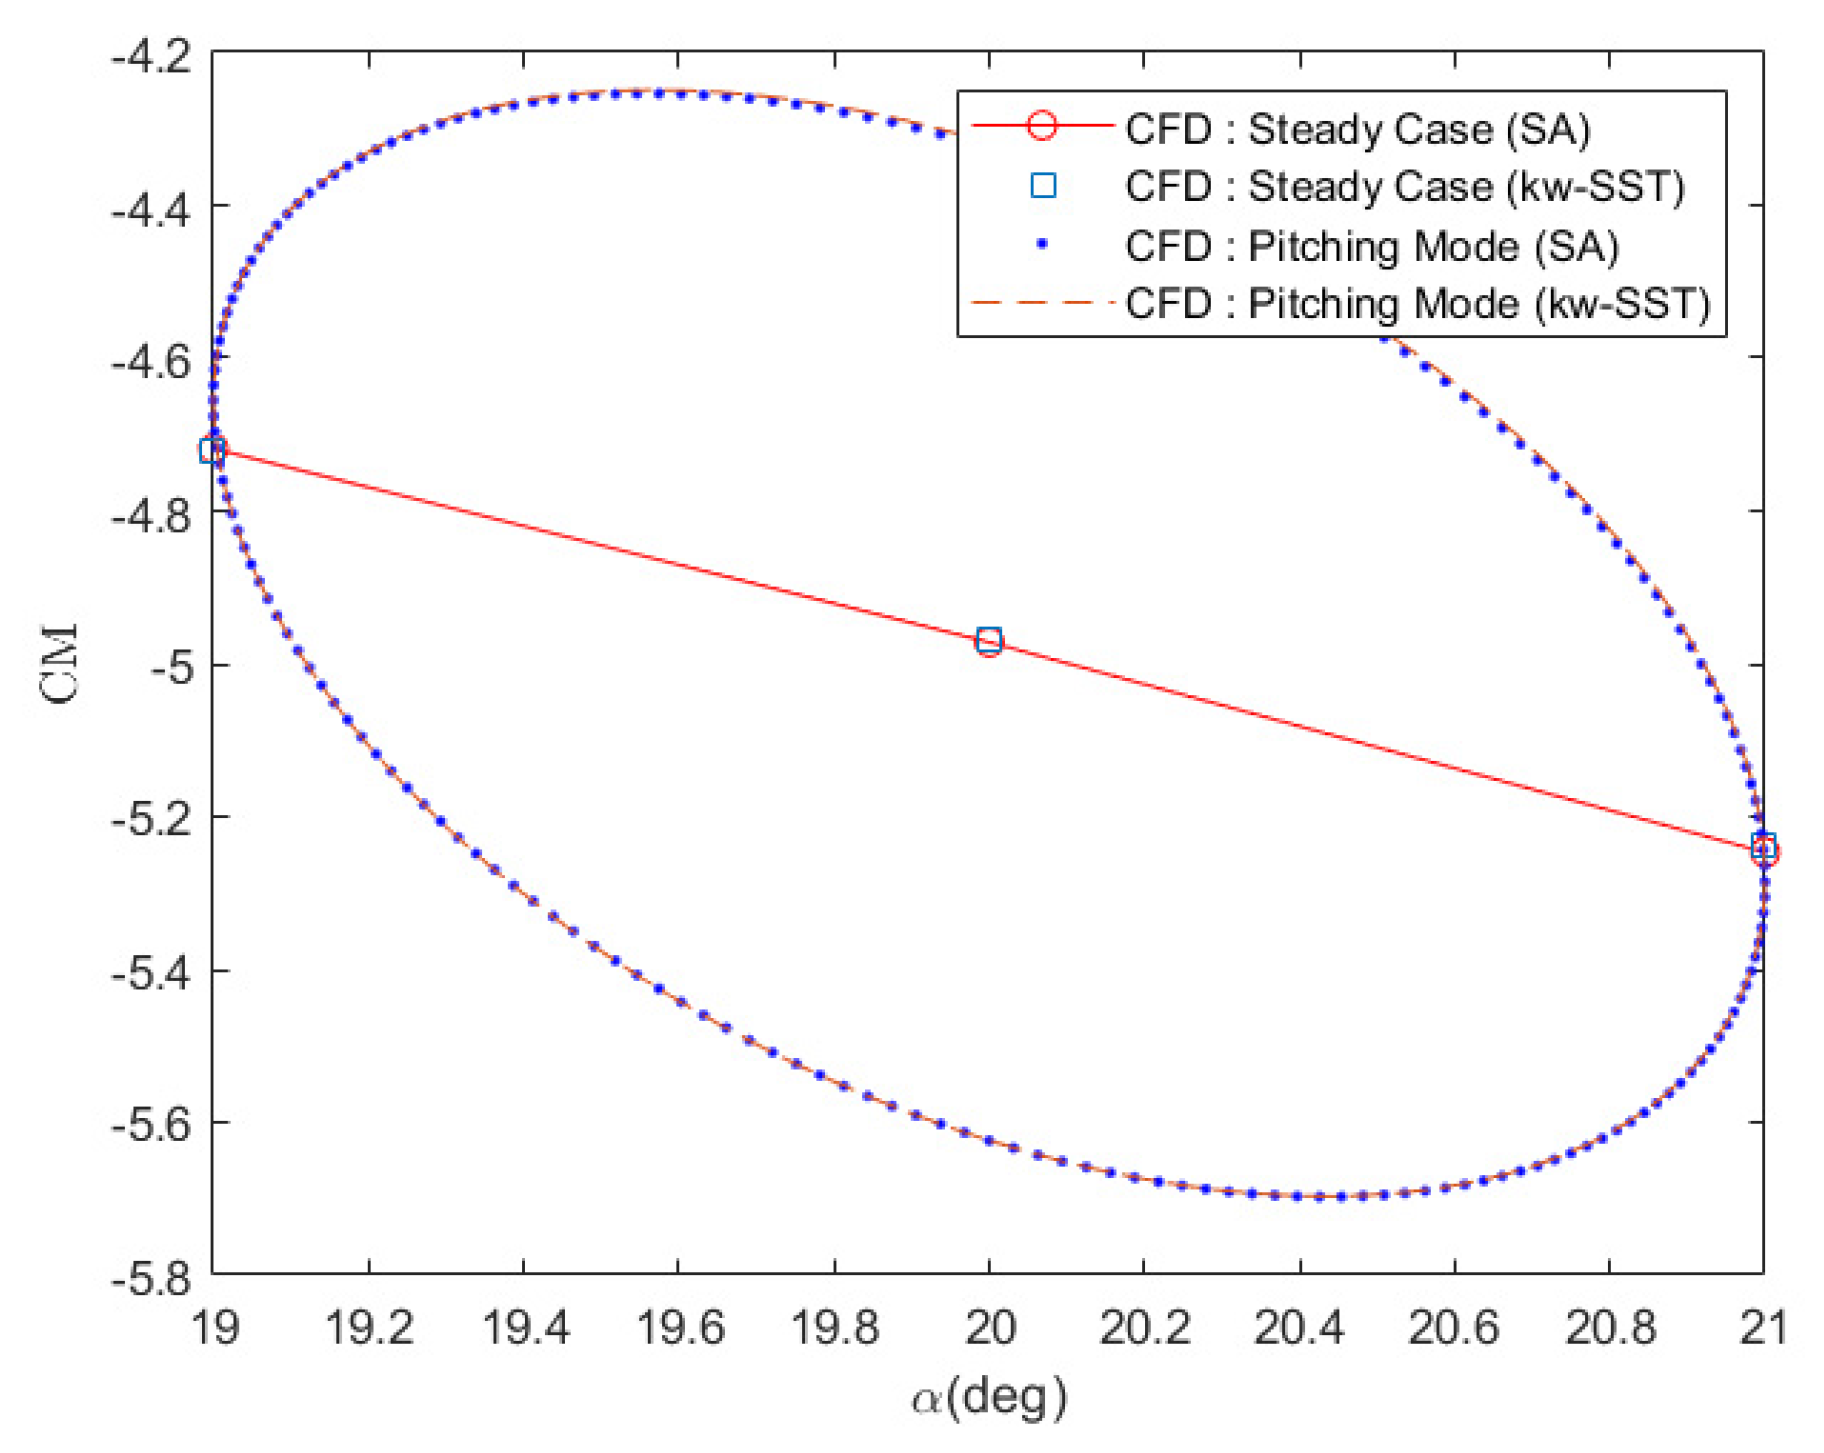
Comparison between SA and the kω-SST model for a steady and unsteady case in Figure 9 shows that the difference between these two model are very small, especially for unsteady dynamic simulation. This small error between SA and kω-SST are negligible considering the main goal of this analysis is to develop an efficient method to separate the dynamic derivatives coefficient. For future works where an accurate result is expected from this unsteady analysis, a better turbulence modeling which can deliver higher accuracy result like RSM is imperative [31].
The flow condition in Table 2 refers to the existing AEDC’s von Karman Gas Dynamics Supersonic Wind Tunnel Facility by Uselton, et al. [27]. Using the same Reynolds number and the same model size, the CFD analysis ensures flow similarity with the reference data. With the high Re, the setting used is an implicit density-based solver for steady and unsteady CFD analysis. For the density-based and ideal gas flow setting, the boundary condition used is pressure-far-field and pressure outlet at the far-field. Meanwhile, for the missile surface, the boundary condition used is the non-slip wall boundary condition.

4. Validation and Results

4.1. Computational Fluid Dynamics (CFD) Validation

4.1.1. Steady Case Validation

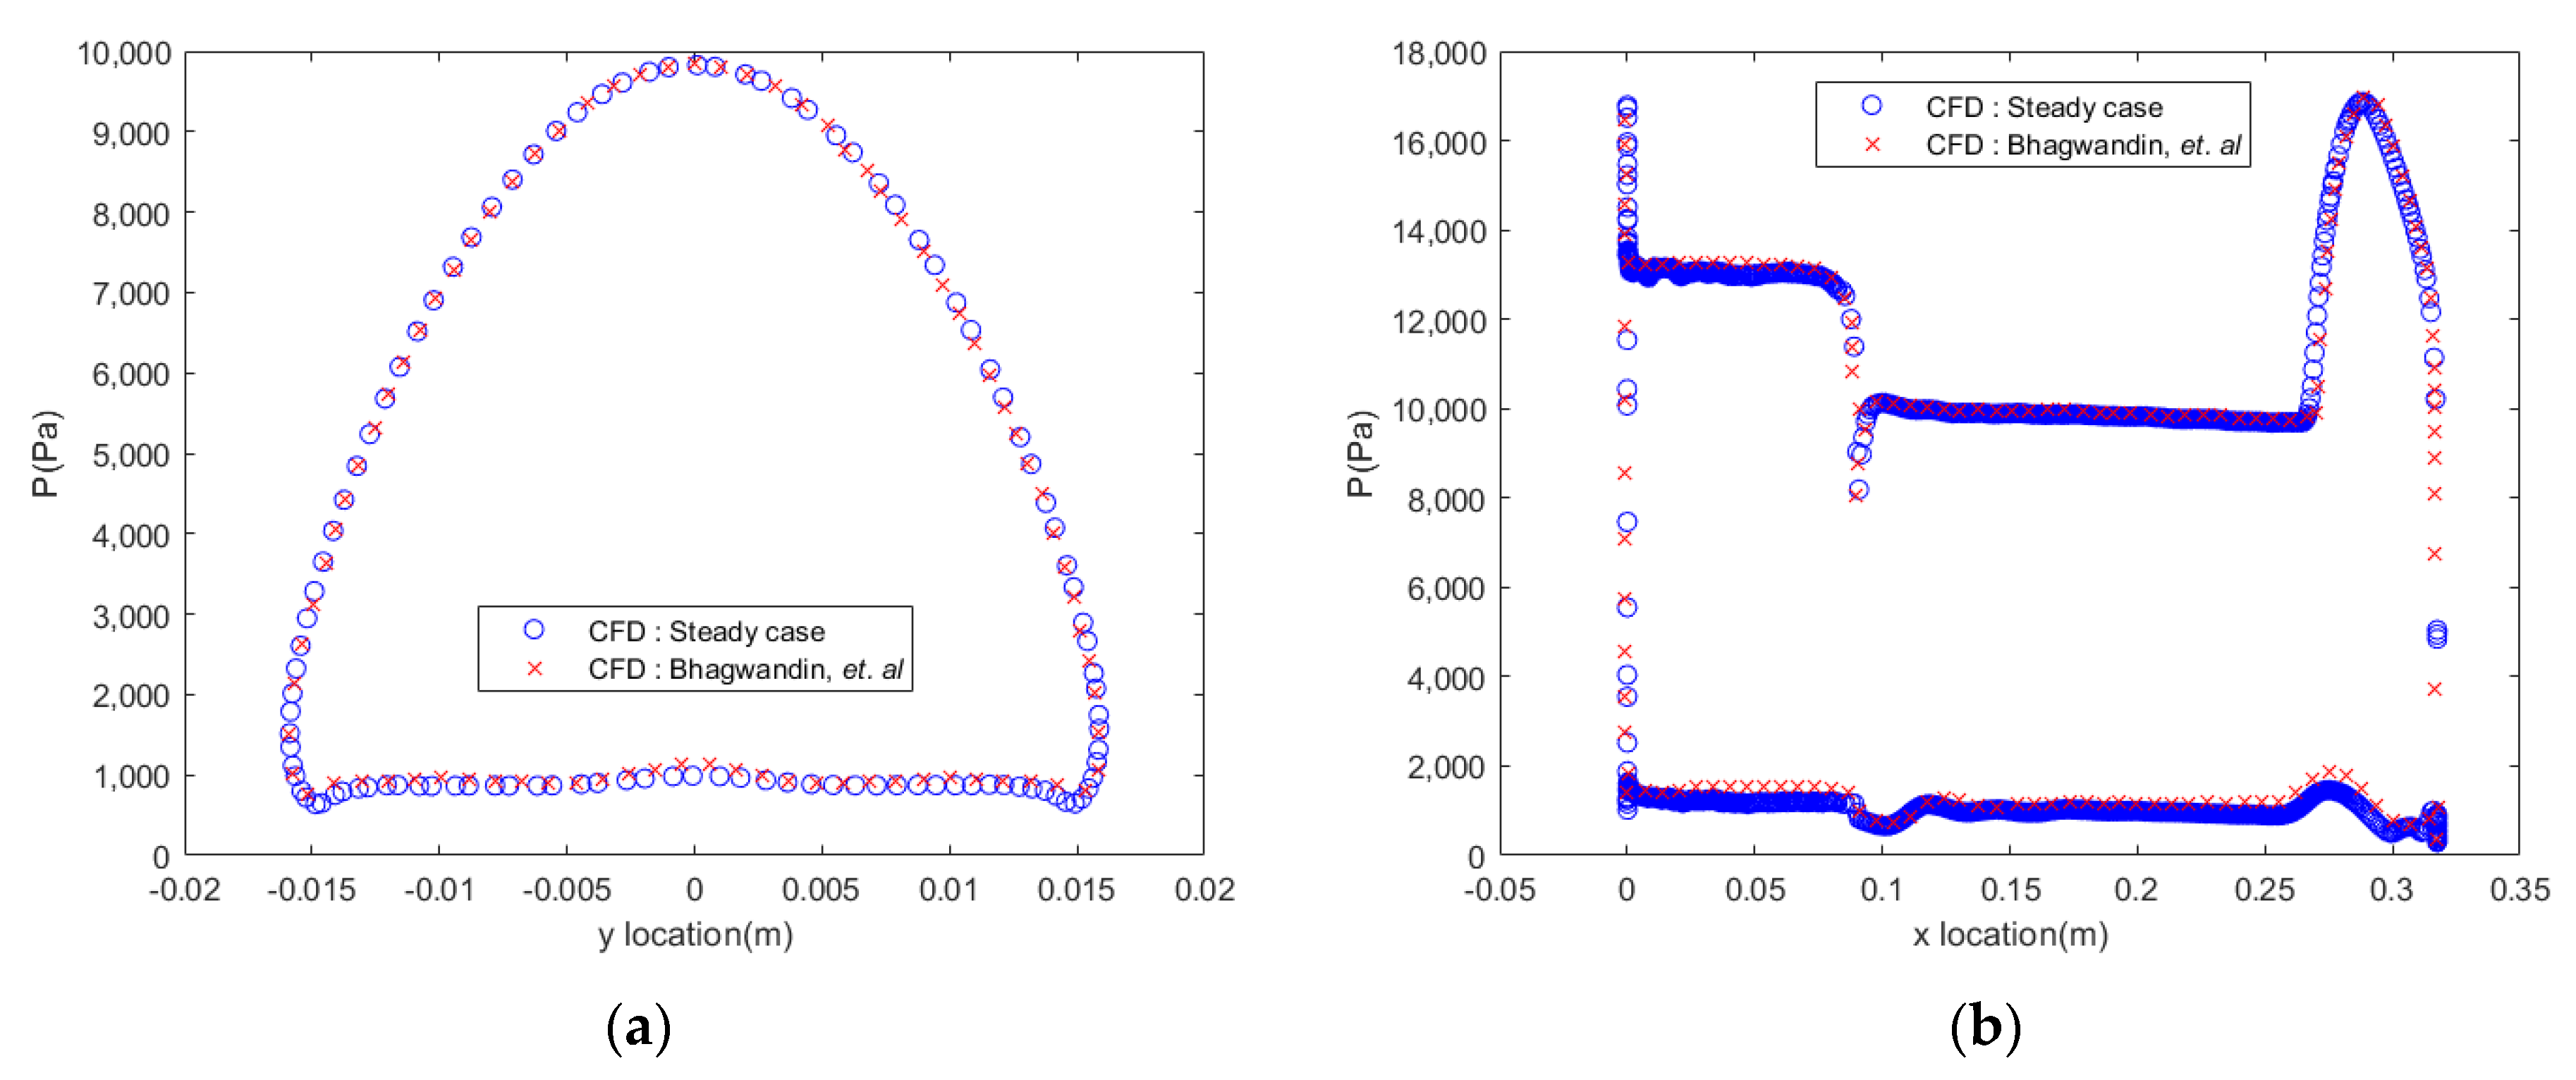
For the validation of the CFD method, the result is compared with the existing wind tunnel and other CFD analysis results [10]:
Extensive model comparison between meshes with different Yplus levels has already been undertaken by Bhagwandin, et al. [10]. Three levels of Yplus are compared, and they all show that the coarse, medium, and fine models have good accuracy in providing the static pressure value at the wall boundary. The CFD model made for this separation analysis has a good agreement when it is compared with those results. Figure 10a shows the circumferential static pressure comparison between the CFD model used for this analysis and the reference CFD model in [10]. The axial static pressure profile can be found in Figure 10b.
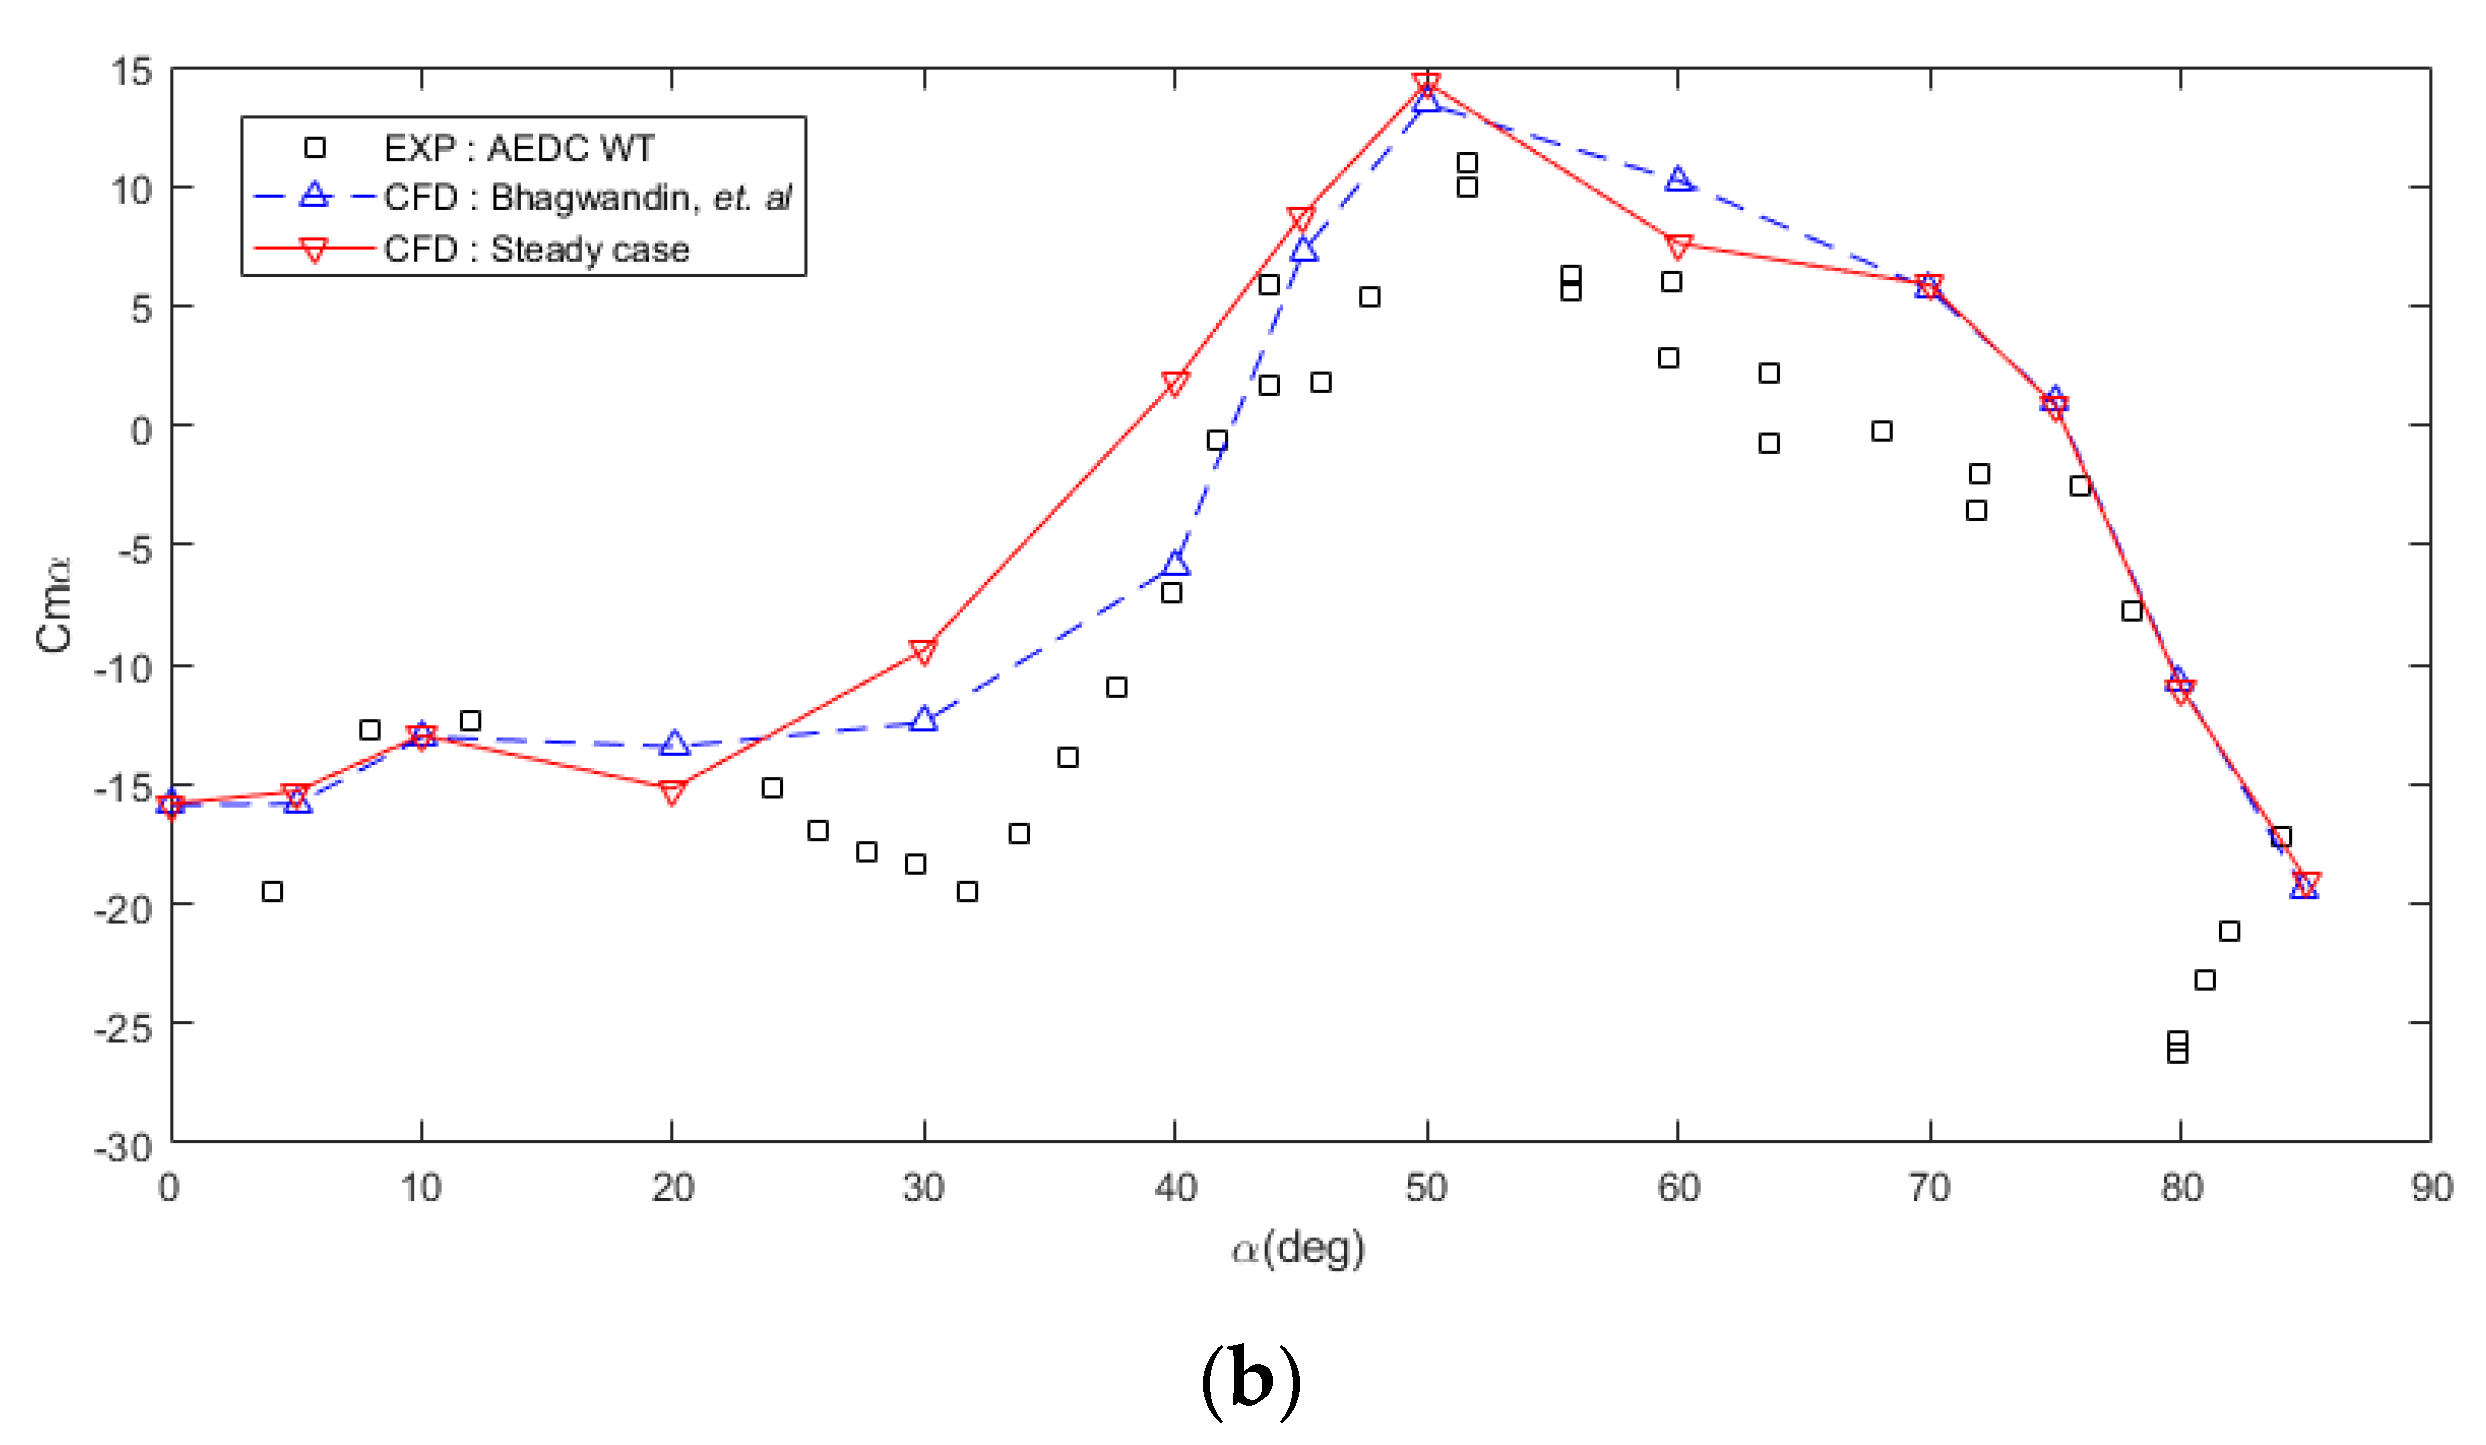
To validate the CFD analysis further, the steady analysis result is compared with wind tunnel data. There are some discrepancies between the previous CFD result and it was mentioned in the wind tunnel report that the wind tunnel data have 5% uncertainty in the parameter setup ( p o , T o , M ) which led to ±10% error in the coefficient result [27].
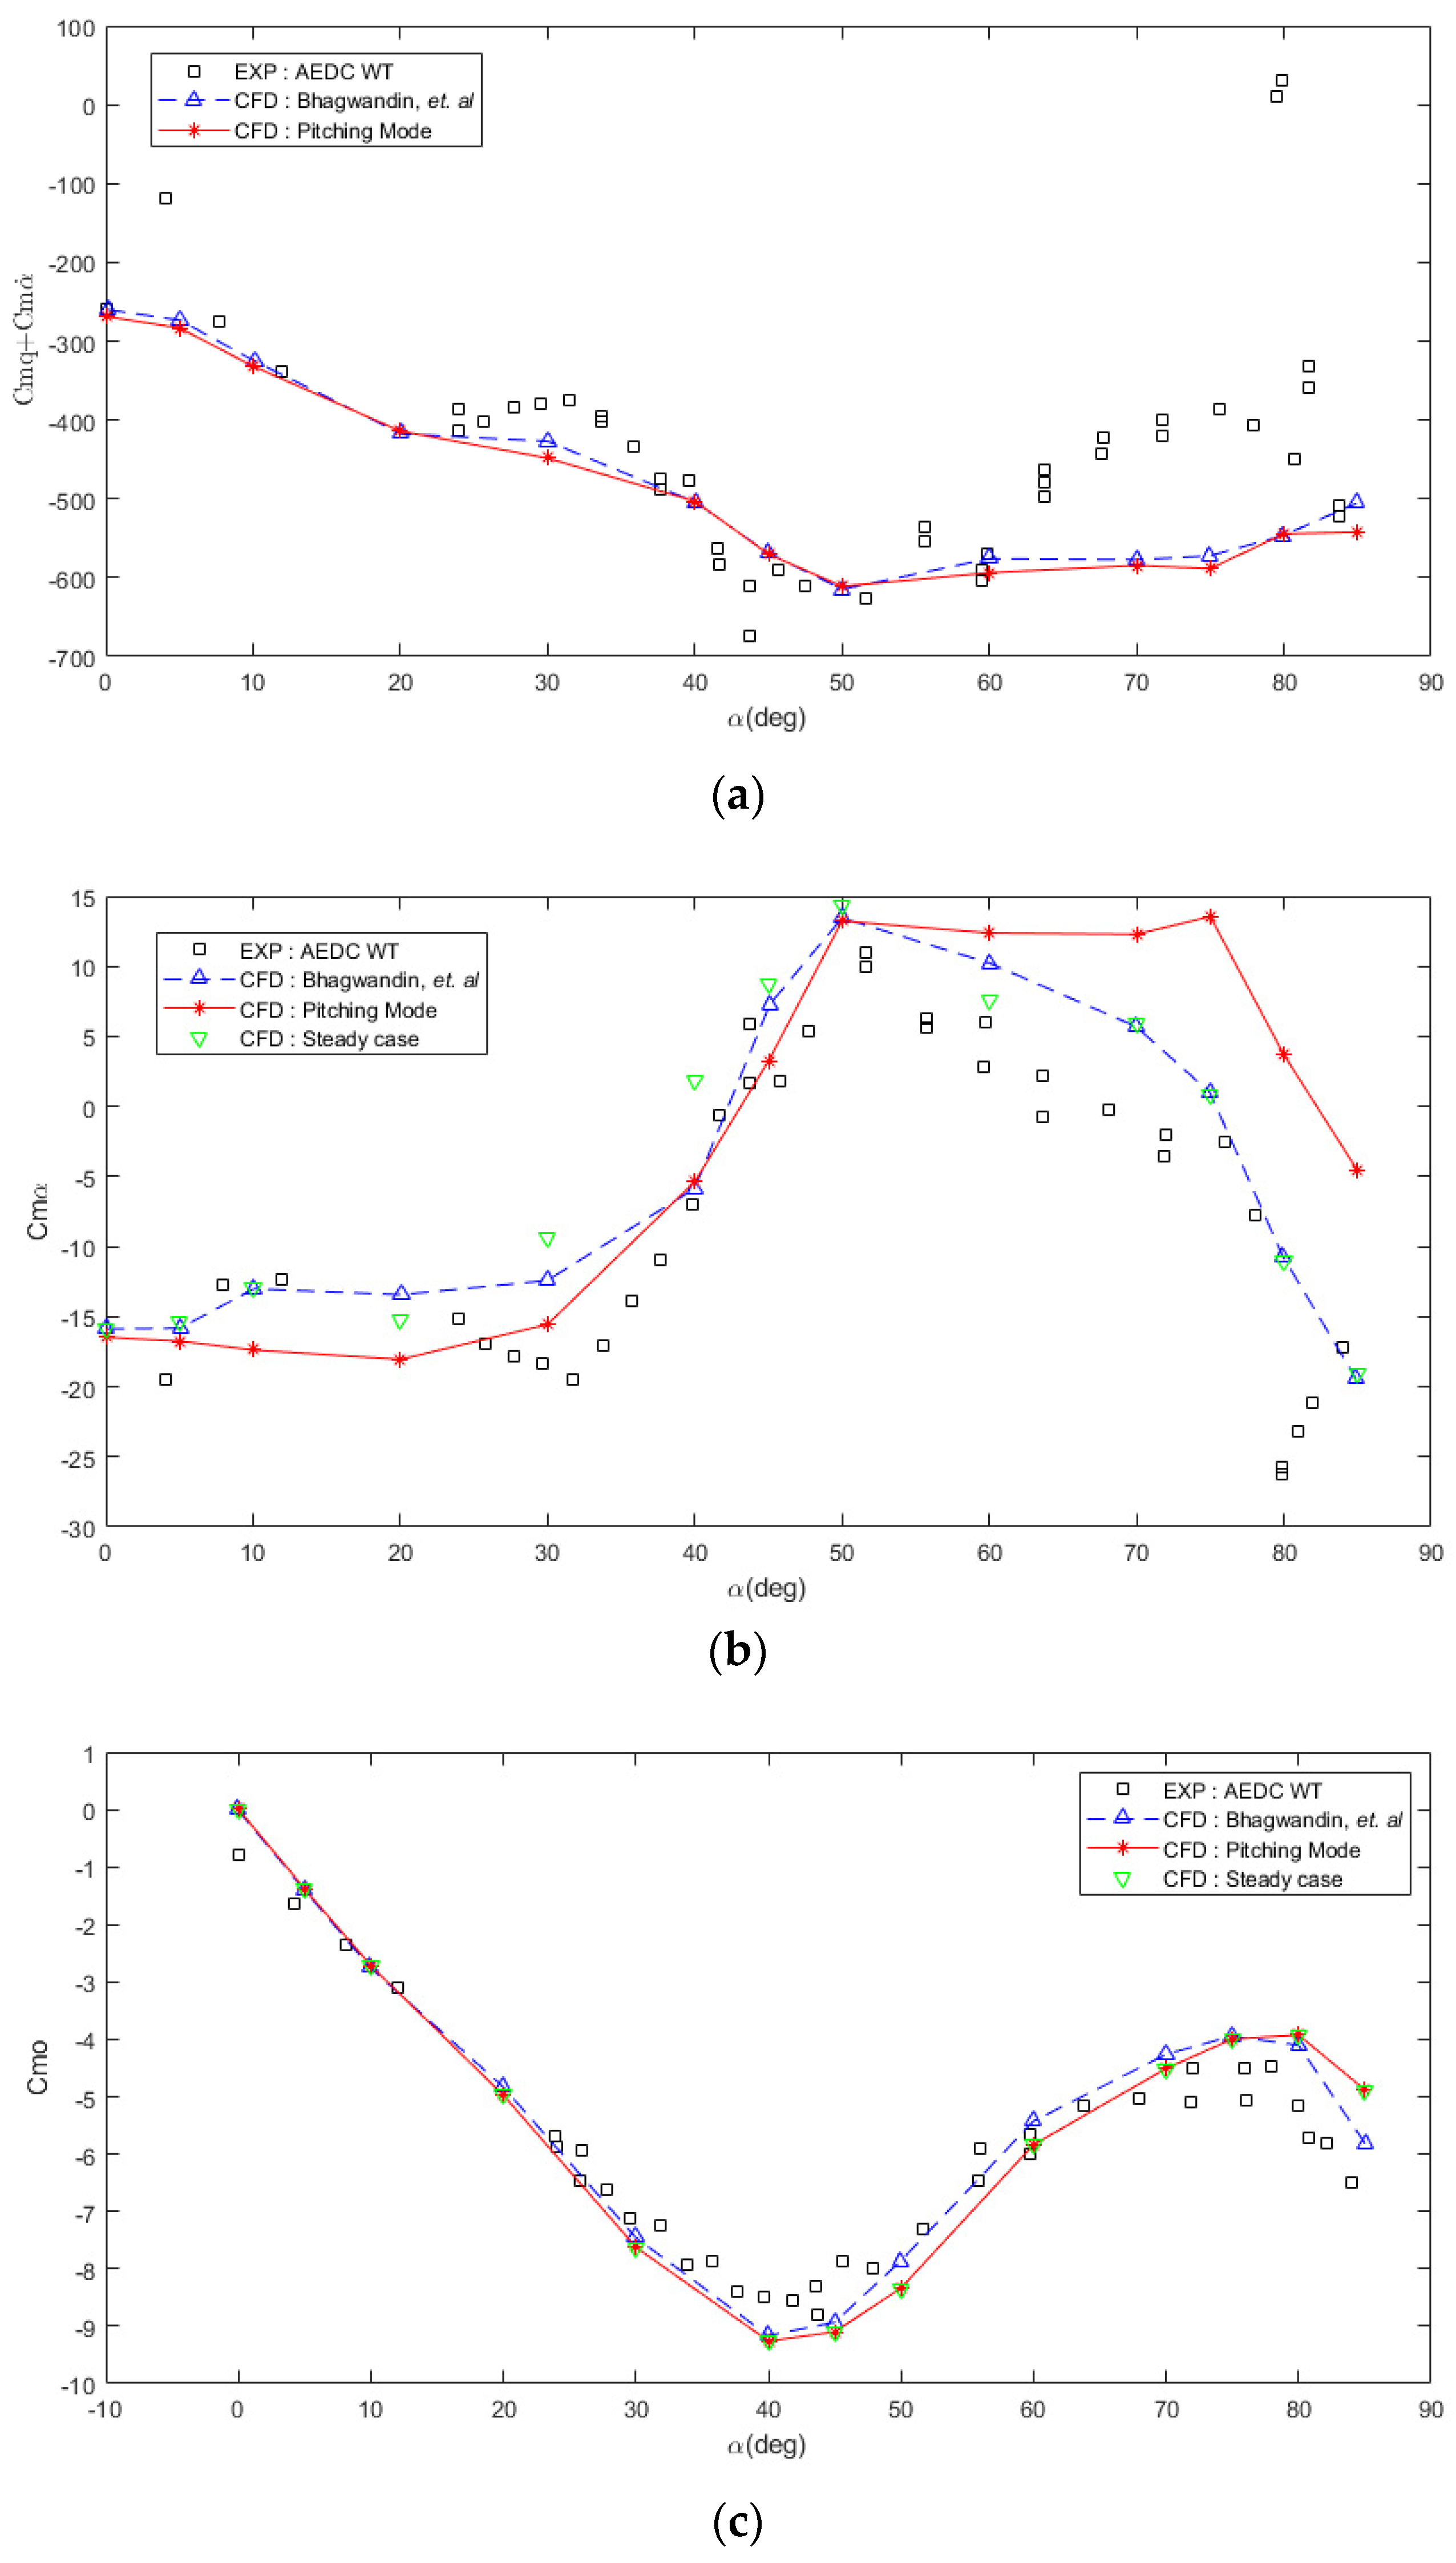
For the validation, the alpha sweep is undertaken for angles of attack of 0 to 85 deg with 13 analysis points. The results are shown in Figure 11. C m o of the steady analysis have a good agreement with the C m o of wind tunnel data. In case of C m α , which acquire using the slope gradient of C m o , there are some discrepancies due to the lesser number of analysis points between the wind tunnel and CFD.

4.1.2. Unsteady Case Data Filtering

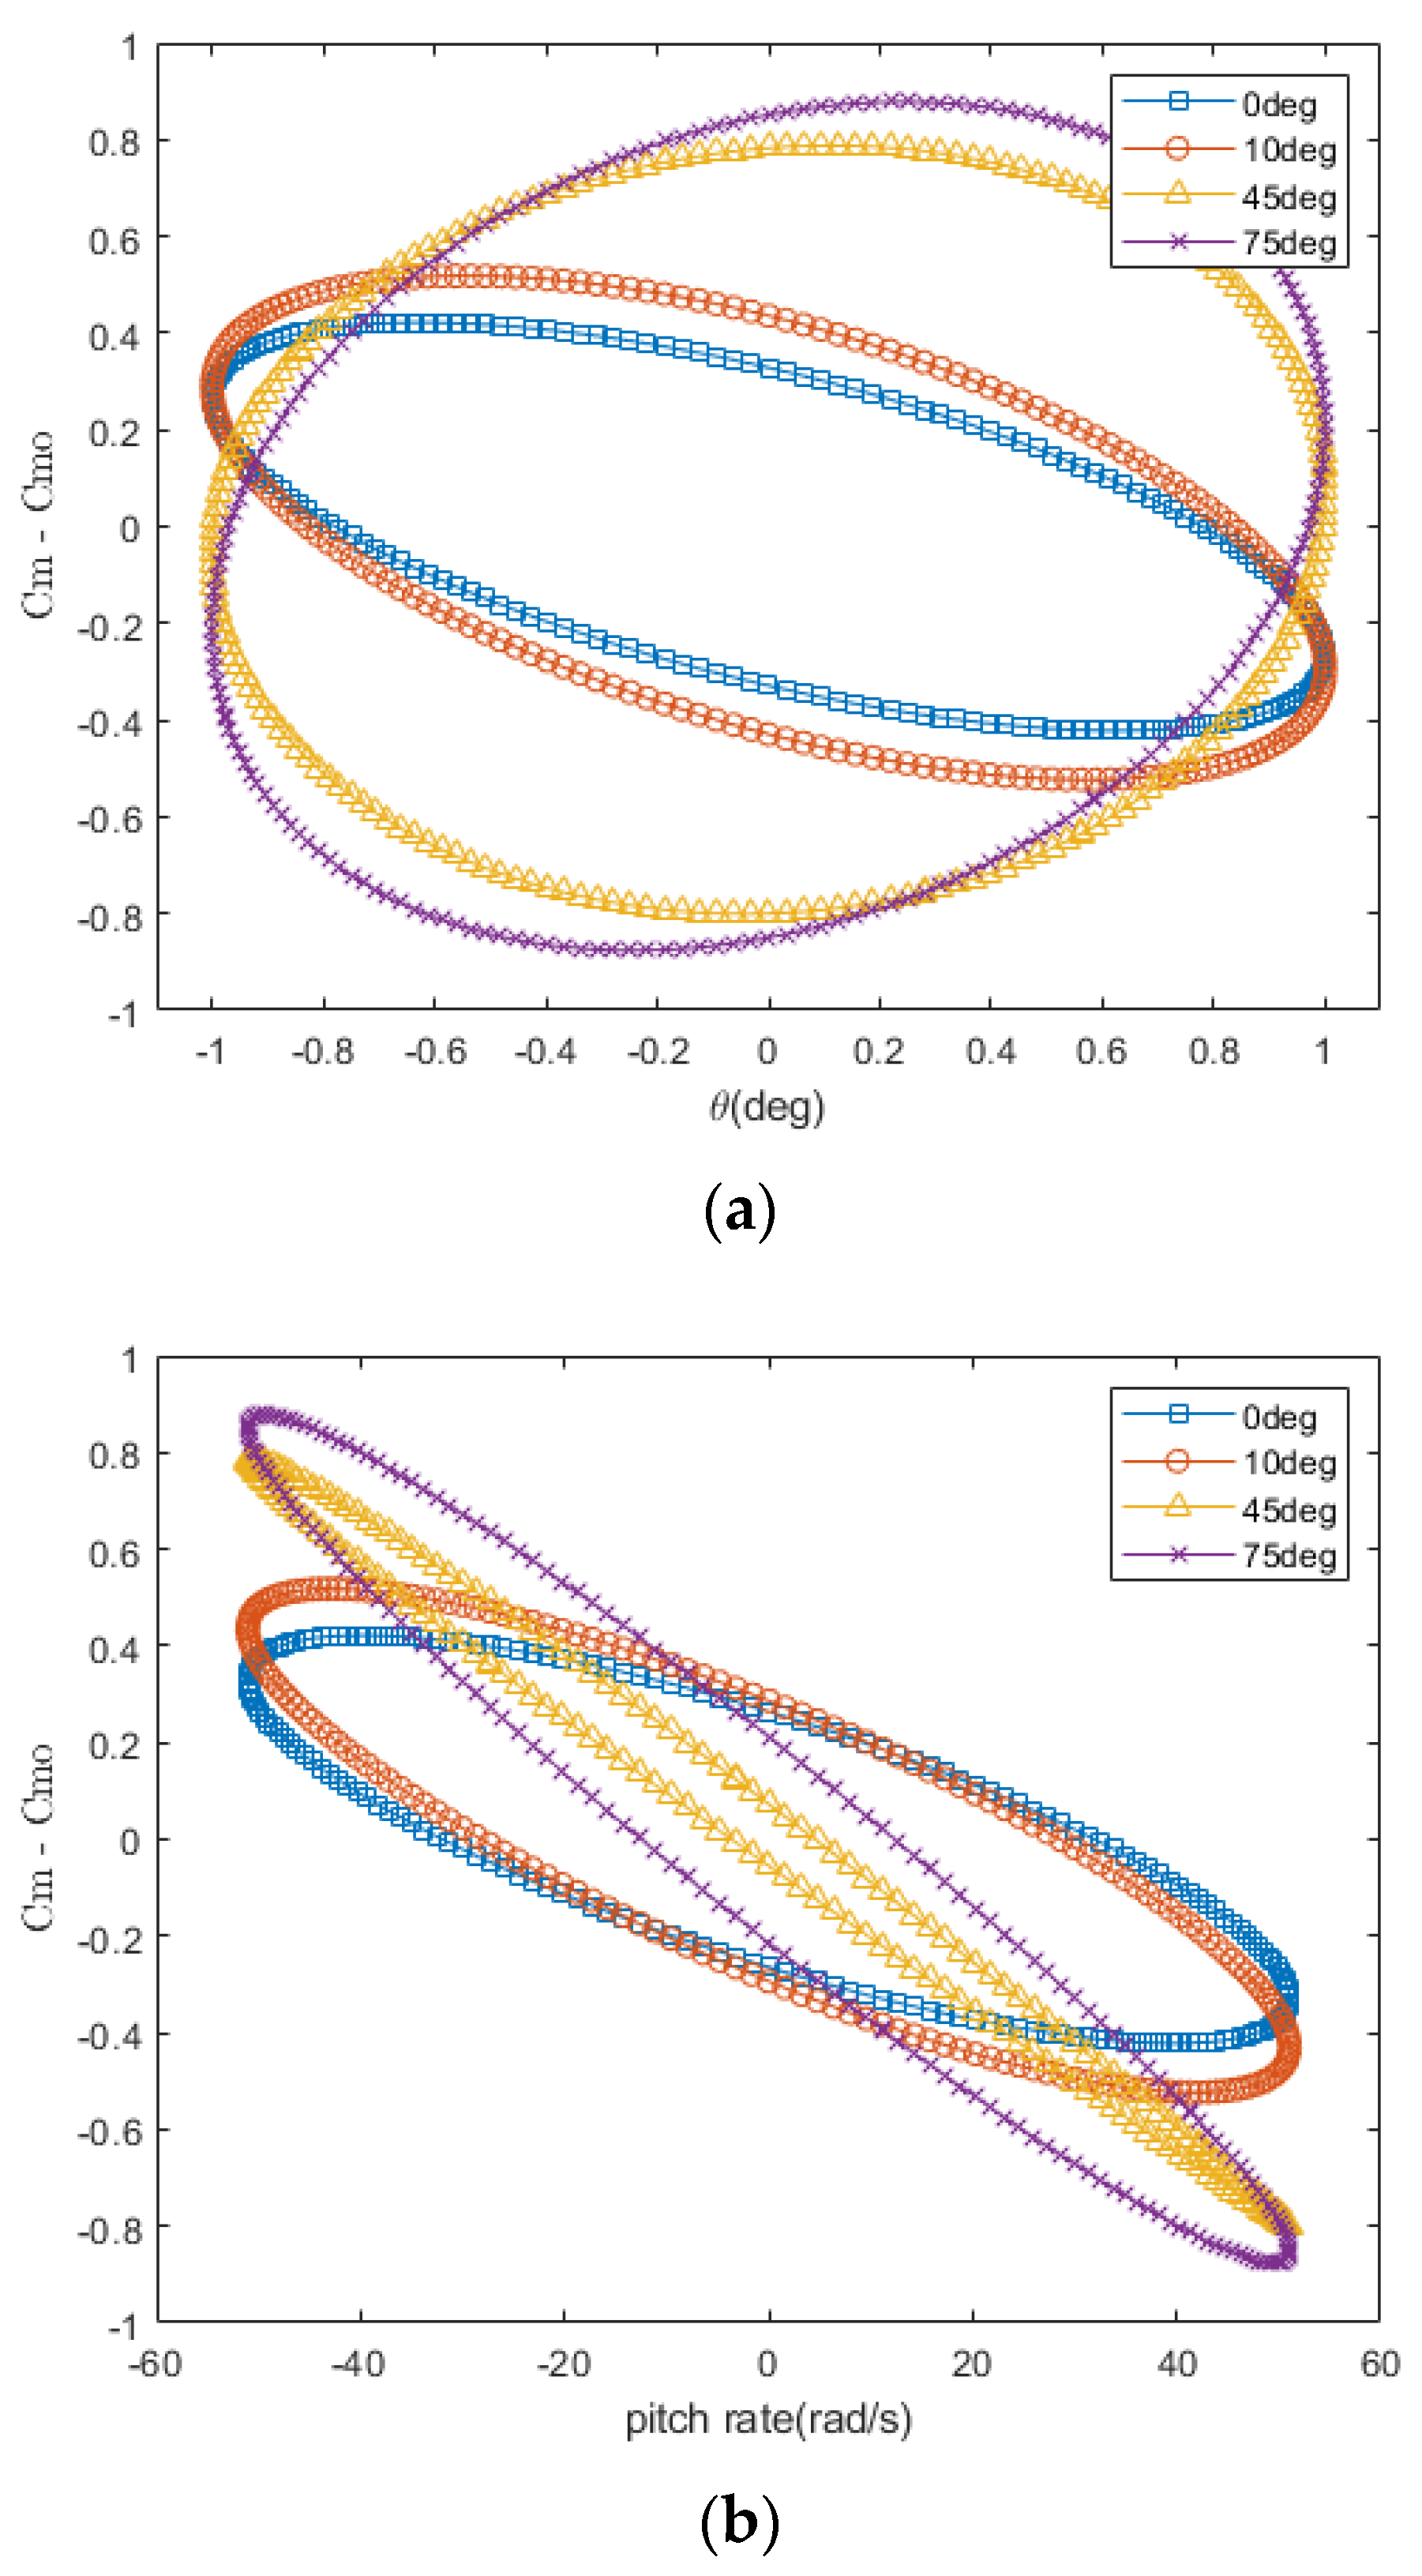
For the unsteady case, the value of reduced frequency k is 0.0898 which corresponds to a vibration frequency of 465.57 Hz. This value is taken accordingly to match the experimental cases [27] with an amplitude of 1 deg. Since this oscillation simulation is time-accurate, the time-step per cycle is determined using N = 200 numerical iterations per cycle with 12 iterations each as mentioned in the previous studies [10,14,32,33] that showed that N ≥ 100 iterations per cycle was sufficient to provide accurate dynamic damping derivatives for the Finner missile.. There are a total of 600 time-steps for three oscillation cycles for one case with Δt = 1.07393 × 10⁻⁵. To filter the result, the first cycle is omitted, and the last two cycles are taken into consideration. Figure 12 shows the comparison between the full three cycles and the filtered result of the last two cycles. The filtering process is undertaken to remove the transient region data which are not very well converged yet during the first cycle. Figure 13 shows the comparison for three sets of ( C m C m o ) for various angles of attack which have been filtered. The four angles of attack are shown to represent the whole alpha sweep region. The smooth ellipse curve shows that the moment coefficient values converged well and are fit to be used in the unsteady dynamic derivatives analysis.

4.1.3. Unsteady Case Validation

To validate the CFD analysis method for unsteady analysis, the value of the moment coefficient C m o , C m α , and ( C m q + C m α ˙ ) is compared with the existing wind tunnel result and recent CFD analysis data.
Figure 14a shows the comparison of ( C m q + C m α ˙ ) vs. α graph for the unsteady analysis. The CFD result shows good agreement with the wind tunnel data for low angle of attack cases, while the difference between these two becomes more significant for higher angle of attack cases. The area for angle of attack above 20 deg is considered as high angle of attack area whereas unsteady and non-linear flow phenomenon occurs. The divergence of results along with the increasing angle of attack is bound to happen. Although there is a bigger difference at higher angle of attack, the CFD result has a greater tendency to follow the previous numerical analysis result by Bhagwandin, et al. [10]. Meanwhile, there are quite a few discrepancies between the C m α results at Figure 14b because the C m α for unsteady analysis was calculated using the AR matrix form [21] of the Equation (7) with fewer points for the CFD analysis than the wind tunnel test points. Lastly, for C m o , results from pitching mode are overlapping between the unsteady and the steady analysis as shown in Figure 14c.

4.1.4. Steady vs. Unsteady Comparison

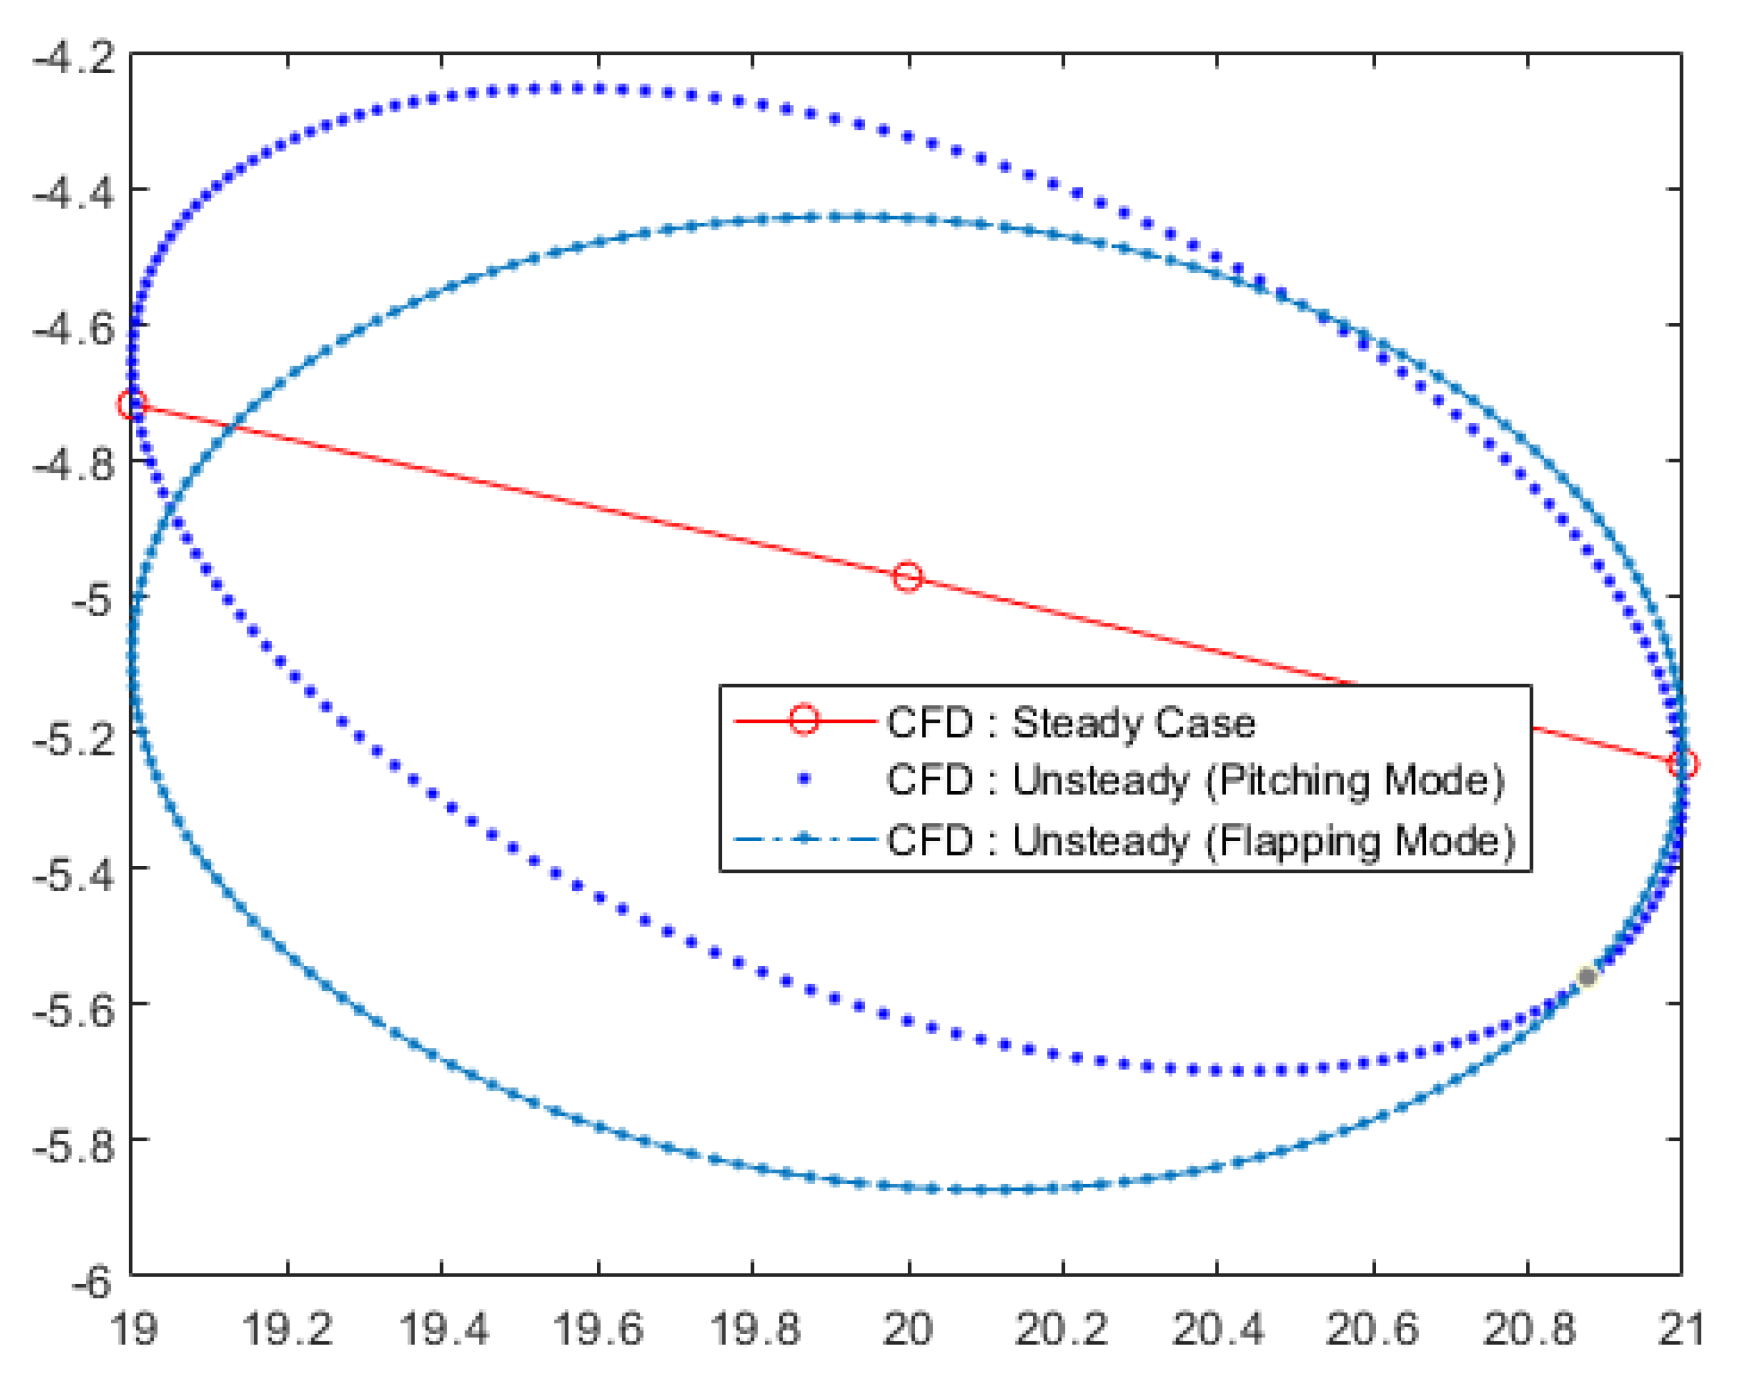
To analyze the effect of dynamic unsteady analysis, a comparison is made by comparing the CM history with respect to the instantaneous angle of attack of unsteady pitching modes at 20 deg and amplitude of ±1 deg with steady case analysis at 19, 20, and 21 deg.
In Figure 15, the static steady case Cm shows a linear gradient between the three points. Meanwhile, for the unsteady pitching mode analysis, there are hysteresis loops that show there are some dynamic effects from the pitching motion. The pitching movement adds another moment force due to the change of alpha ( C m α ) , alpha change rate ( C m α ˙ ) , and pitch rate ( C m q ) . Due to these changes, the missile faces an additional or less “actual” angle of attack for the same alpha depending on which direction it is oscillating (Figure 1). Hence, there are different values of Cm for the same alpha value. Meanwhile, the static cases are facing the same “actual” alpha with the given alpha test points. Figure 15 also shows the difference hysteresis loops between pitching and flapping modes. The flapping mode has a similar hysteresis loop with pitching modes, but with lower hysteresis points due to the superposition of simple harmonic oscillation between pitching movement and the heaving movement which counter the change in alpha due to alpha change rate ( α ˙ ) , leaving only Cm change due to pitch rate ( C m q ) .

4.2. Coefficient Separation Method

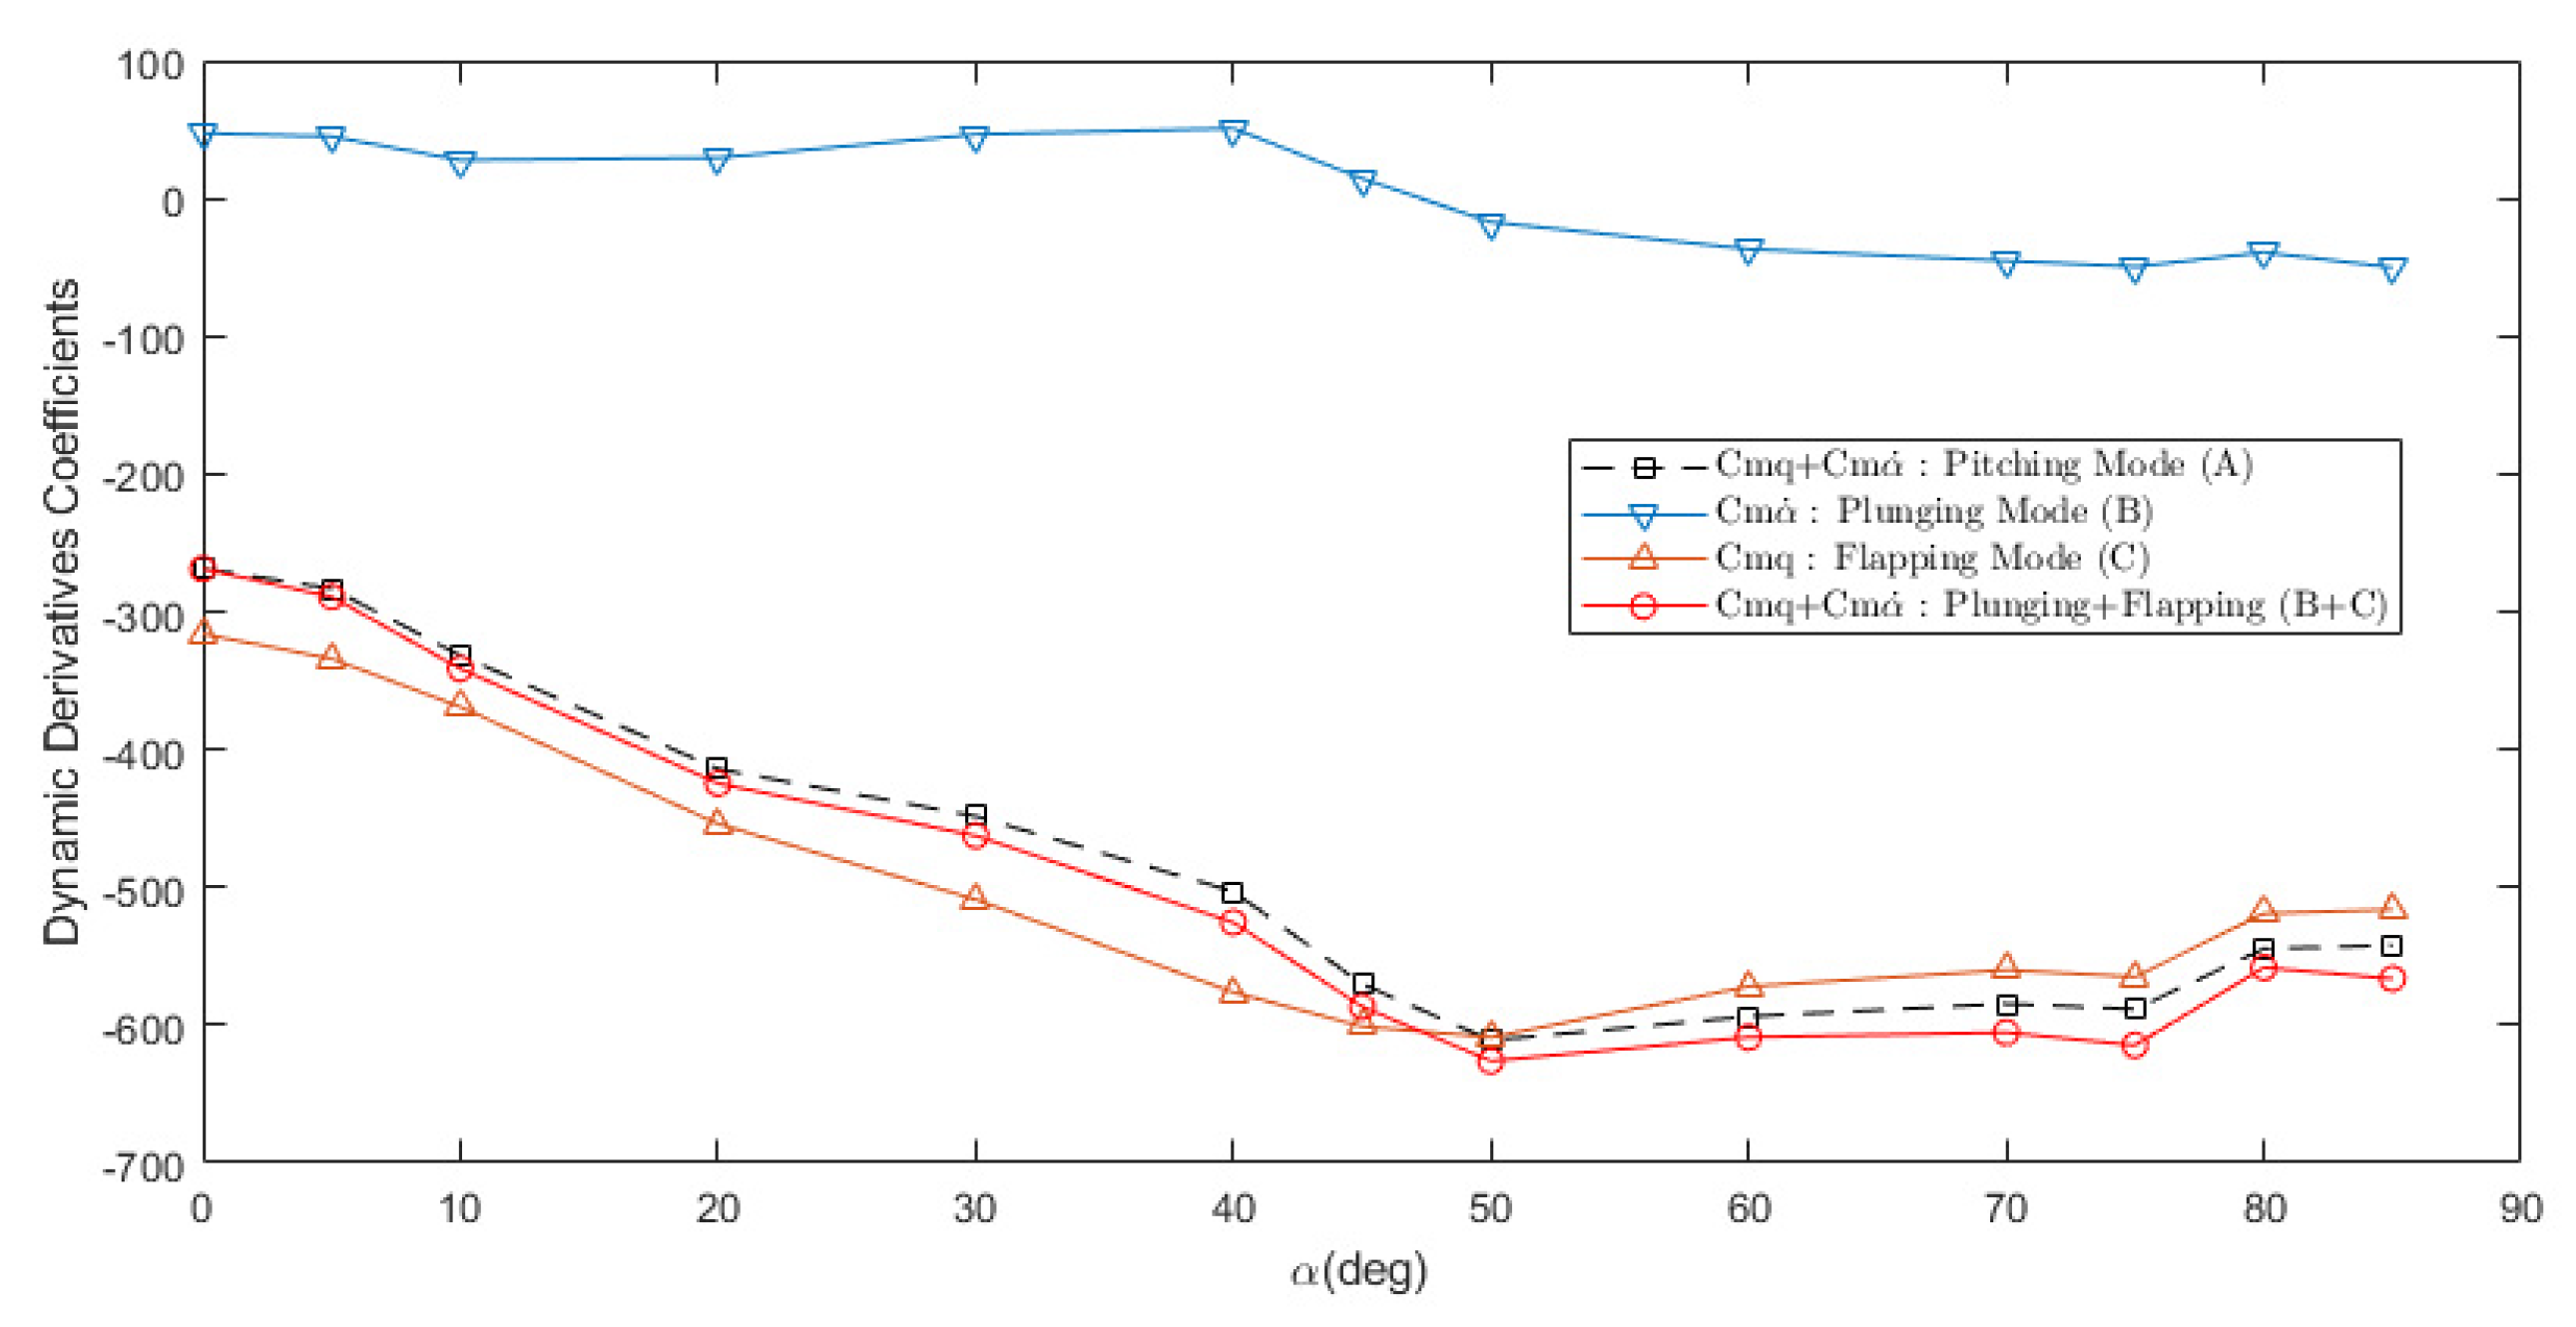
To separate the coefficients of the dynamic derivative, at least two different oscillation methods are required. Pitching mode provides ( C m q + C m α ˙ ), plunging mode provides pure C m α ˙ , while flapping mode provides pure C m q .
Figure 16 shows that pitch damping derivatives coefficient ( C m q + C m α ˙ ) obtained from pitching mode (A) (for comparison, pitching mode is referred to as method A), matched closely with the summation of C m α ˙ from plunging mode (B) (for comparison, plunging mode is referred to as method B) and C m q from flapping mode (C) (for comparison, flapping mode is referred to as method C). It can be said that:
C m q + C m α ˙   ( A ) = C m α ˙   ( B ) = C m q   ( C )

Dynamic Derivative Coefficients

Table 3 shows the exact value from the selected angle of attack to represent the various range of alpha from the analysis data. As seen in Table 3, Equation (14) works perfectly on all the angles of attack range with maximum error <5%.
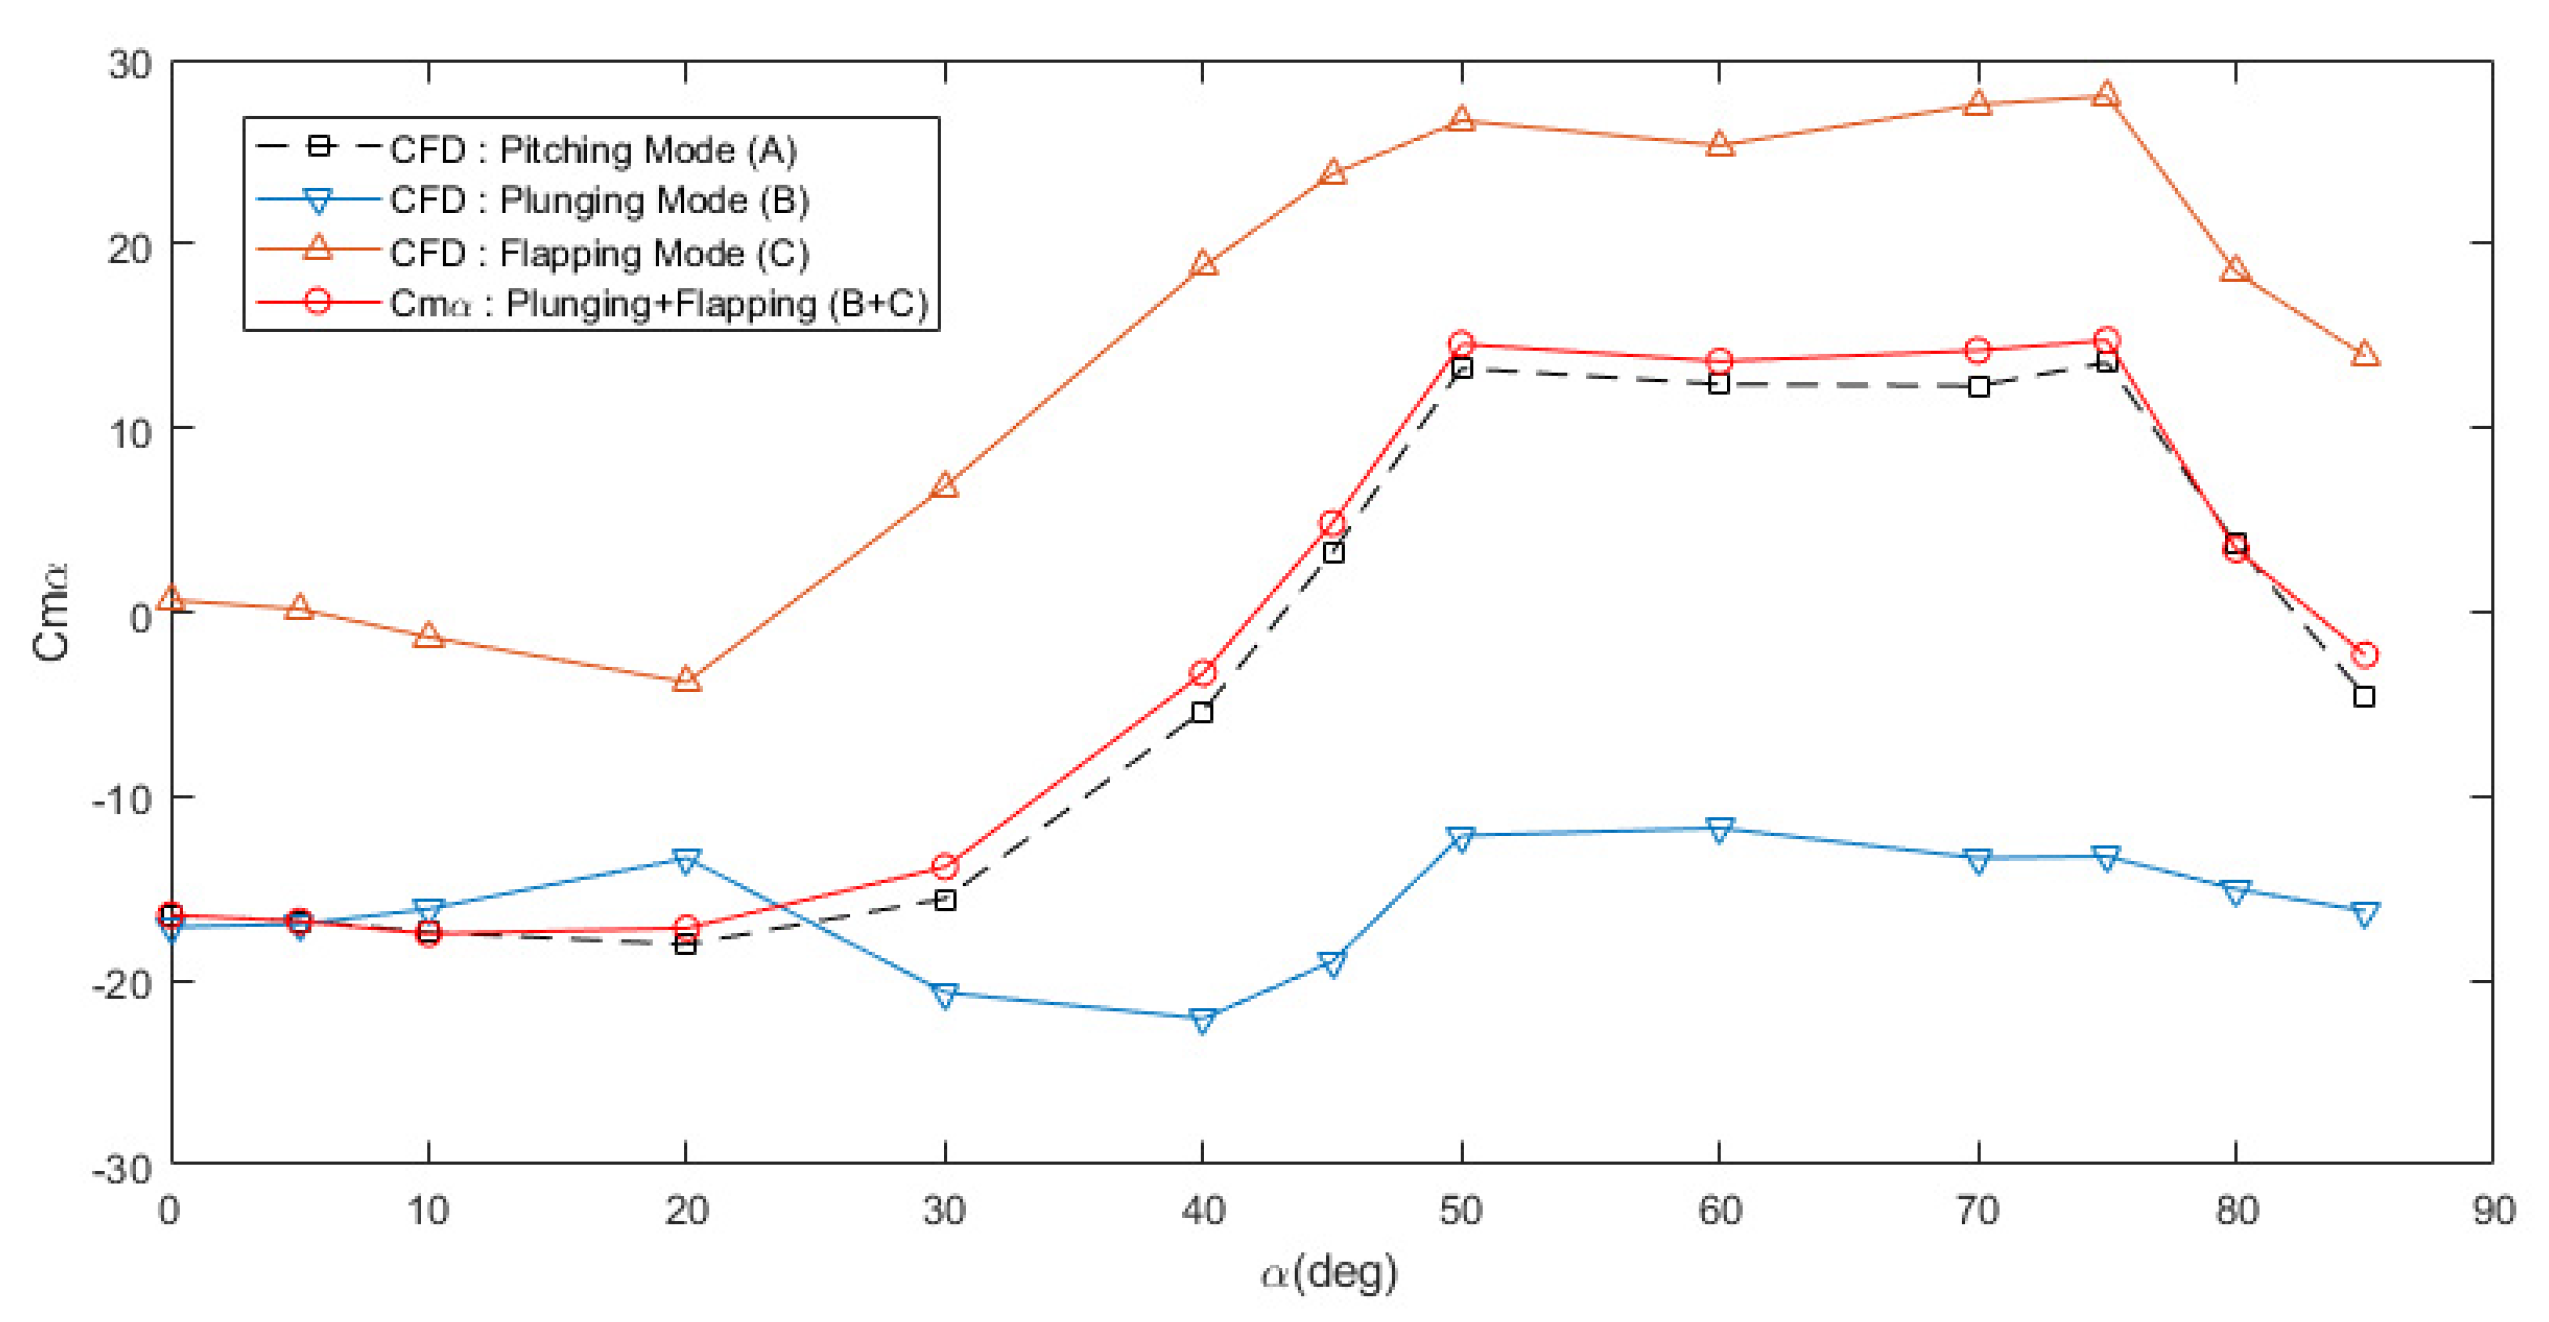
The results of dynamic derivatives for moment coefficient due to change in angle of attack C m α are shown in Figure 17 and Table 4. The summation of C m α of plunging mode (B) and flapping mode (C) equals C m α from the pitching mode (A).
C m α   ( A ) = C m α   ( B ) + C m α   ( C )
Plunging mode is derived from pitching mode by eliminating the change in pitch rate. Meanwhile, flapping mode is derived from forced pitching by eliminating the change of alpha from the movement. We can say that forced pitching (A) is a combination of forced plunging (B) and forced flapping (C). That explains why the value of ( C m q + C m α ˙ ) and C m α follows the Equations (14) and (15) if all of them are undertaken in the same simulation conditions.
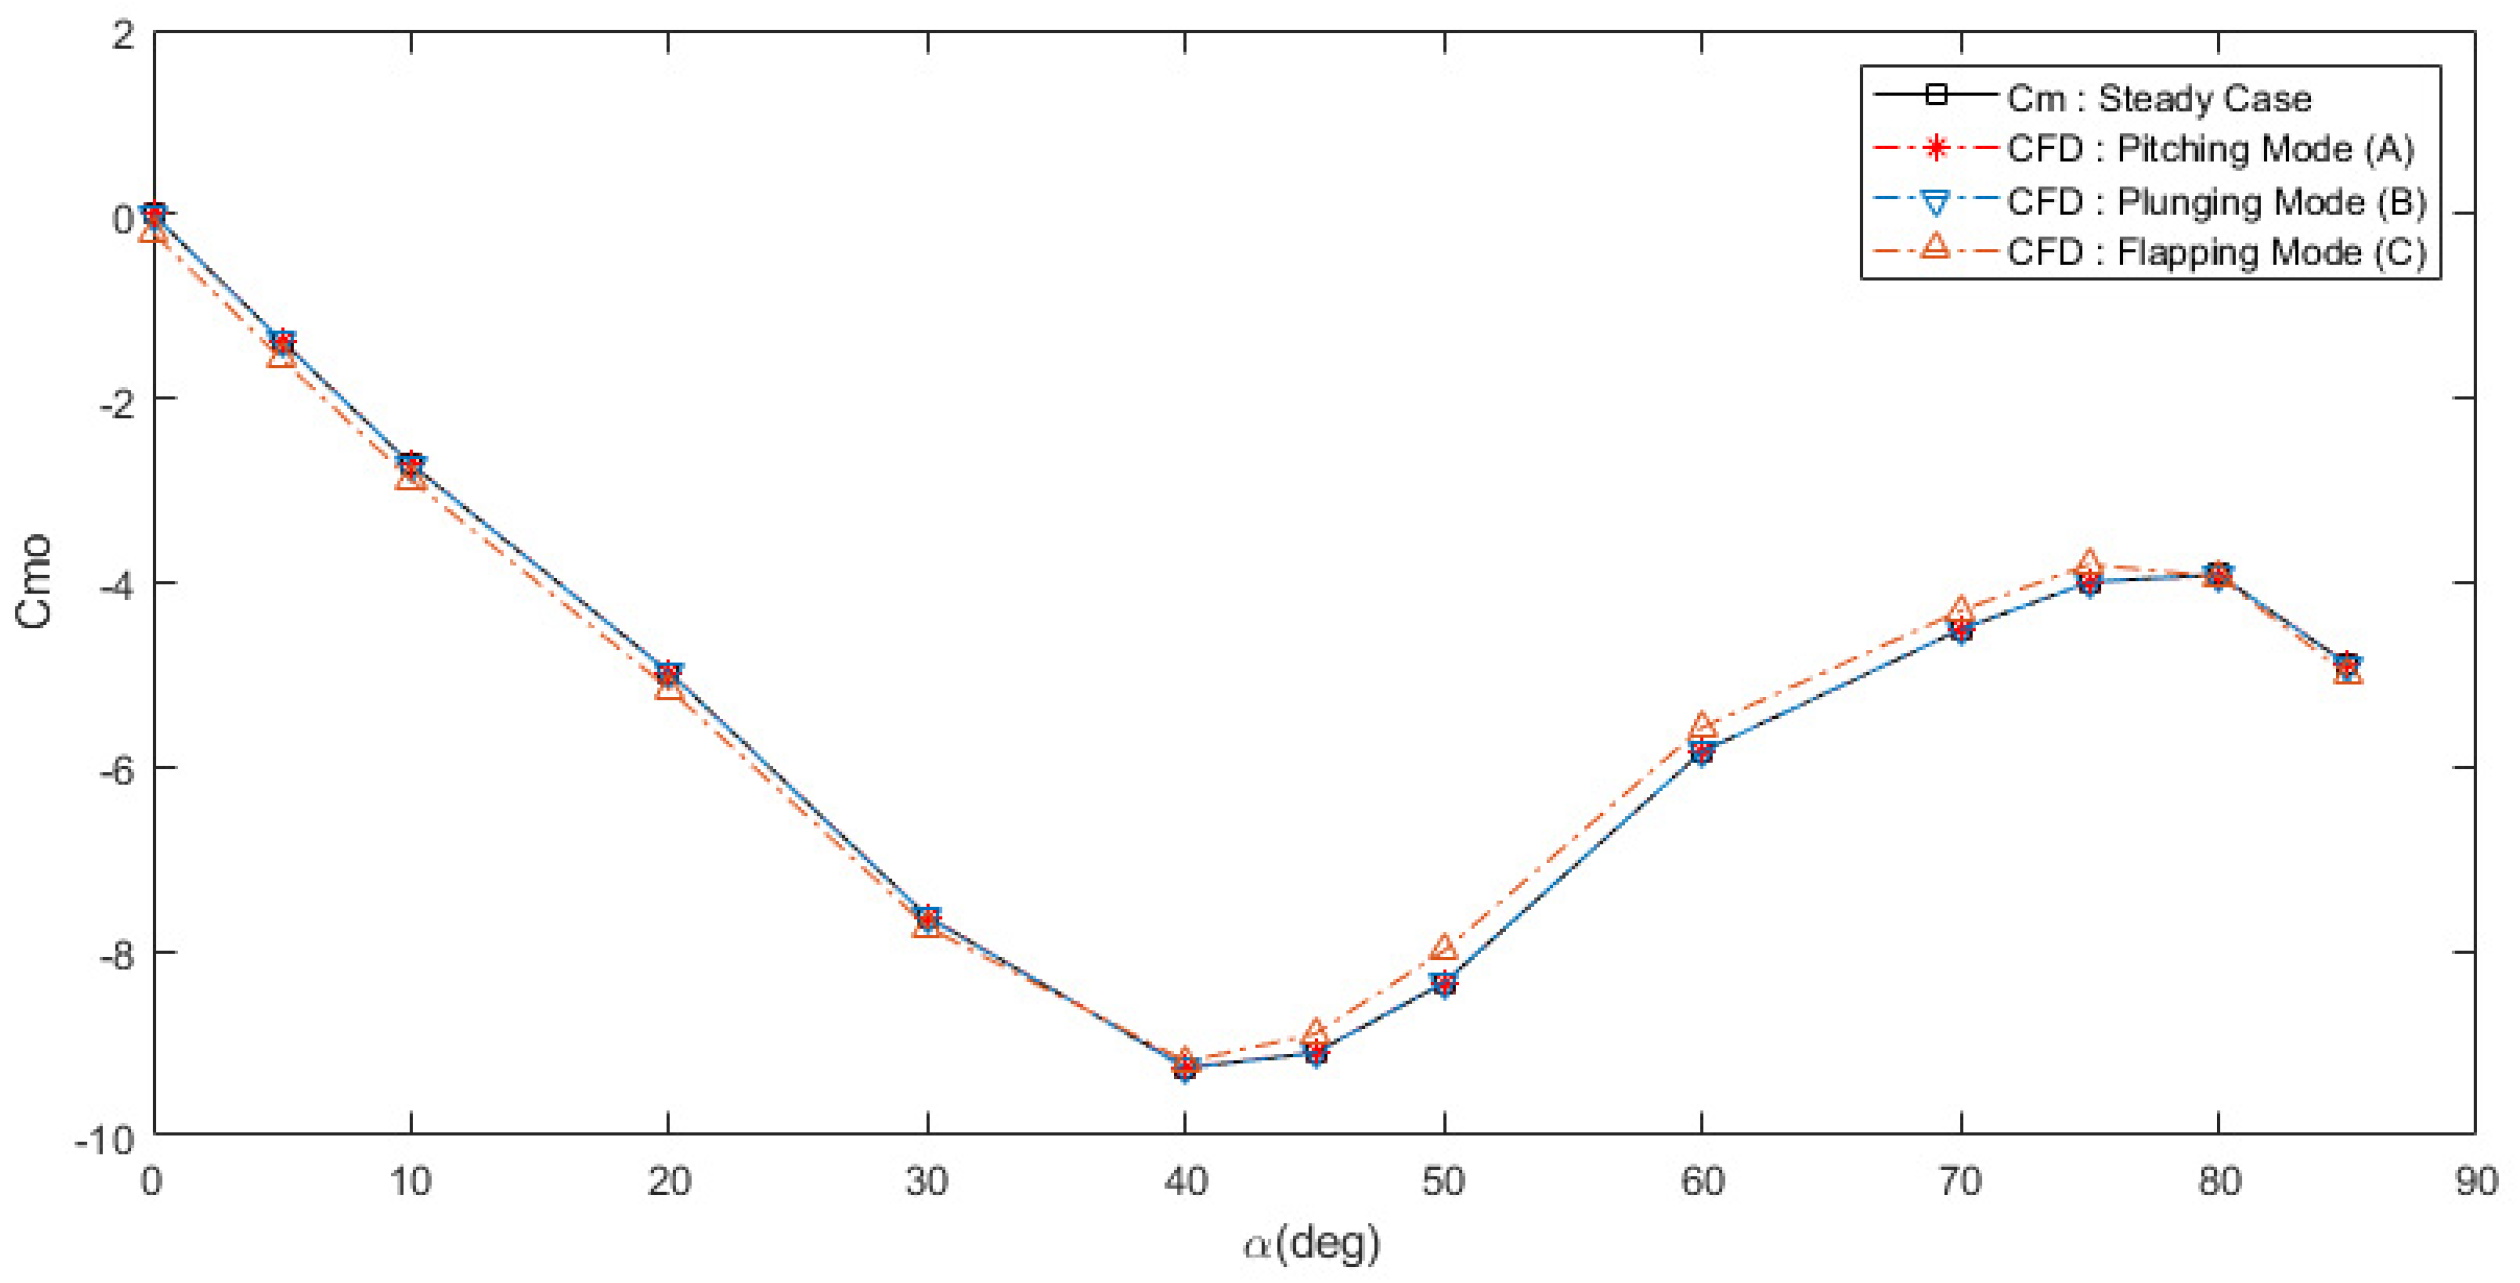
The value for C m q + C m α ˙ and C m α complement the other methods although a different phenomenon occurs for the C m o value. Figure 18 shows that C m o from pitching and plunging modes overlapped each other, they even match the value from the steady calculation, meanwhile the C m o from the flapping modes shows some transient effect where the location of C m o value shifts slightly from its original location.

5. Conclusions

Longitudinal dynamic stability derivatives can be separated using at least two kinds of forced simple harmonics oscillation method. By eliminating the source of the coefficient, we can separate the C m q + C m α ˙ into C m α ˙ and C m q .
The set-up for these three methods of forced simple harmonic oscillation can be undertaken efficiently using computational fluid dynamics. The set-up for the forced oscillation method can be undertaken easily using UDF and dynamic mesh. The forced pitching method is suitable to conduct in the wind tunnel test since the set-up and tools to conduct an oscillating pitching movement are still feasible. Meanwhile, it needs more effort to conduct the plunging/flapping mode method with the wind tunnel test since the load and set-up for the support arm increase significantly. The use of CFD or a combination of wind tunnel data and CFD could provide an accurate and good cross-platform validation method of dynamic stability derivatives analysis.
The Finner missile analysis with computational fluid dynamics has proven that this method works for higher Mach number regime with notes that higher angle of attack is a highly non-linear area where there are high flow separations and turbulence which makes the flow more difficult to analyze. Error can be minimized by choosing a small amplitude suitable with the reduced frequency value.
For future works, application of this method can be applied to a more complex aircraft with a better turbulence model to increase its accuracy, especially in non-linear flow areas. The development of a new analysis method that can simplify the separation process using only one type of forced oscillation movement could increase the dynamic stability derivatives separation process, thus increasing the capability of dynamic stability analysis using CFD.

Author Contributions

Conceptualization, N.J. and H.-S.C.; methodology, N.J. and H.-S.C.; software, N.J. and H.-S.C.; validation, N.J. and H.-S.C.; formal analysis, N.J. and H.-S.C.; investigation, N.J.; resources, H.-S.C., J.-W.L. and S.K.; data curation, N.J. and H.-S.C.; writing—original draft preparation, N.J. and H.-S.C.; writing—review and editing, N.J., H.-S.C., J.-W.L. and S.K.; visualization, N.J.; supervision, J.-W.L. and S.K.; project administration, S.K.; funding acquisition, S.K. All authors have read and agreed to the published version of the manuscript.

Funding

This research was supported by Konkuk University in 2021.

Institutional Review Board Statement

Not applicable.

Informed Consent Statement

Not applicable.

Data Availability Statement

Not applicable.

Conflicts of Interest

The authors declare no conflict of interest.

Nomenclature

C m Pitching moment coefficient
C m o Pitching moment coefficient in steady reference condition
C m q Pitching moment coefficient due to pitch rate
C m α Pitching moment coefficient due to change in angle of attack
C m α ˙ pitching moment coefficient due to change rate of the angle of attack
C m q + C m α ˙ Direct pitching moment coefficient damping derivatives
lLength reference (m)
dModel diameter (m)
fDimensional frequency (Hz)
TPeriod cycle
kReduced oscillation frequency
q Pitch rate
M Freestream Mach number
R e d Reynolds number based on the model diameter
P 0 Total Pressure, Pa
T 0 Total Temperature, K
q Freestream dynamic pressure, Pa
V Freestream velocity, m/s
c ¯ Mean chord
tTime(s)
ΔtTime-step size(s)
NNumber of iteration
VVelocity of the body relative to the fluid
α Angle of attack (deg)
α ˙ Angle of attack change rate
β Angle of sideslip
ρ Density of the fluid
θ Inclination angle measured normal to the horizontal plane to aircraft longitudinal axis
θ A Inclination angle oscillation amplitude
ω Angular rate

References

  1. Williams, J.E.; Vukelich, S.R. The USAF Stability and Control Digital Datcom; AFFDL-TR-79-3032; McDonnell Douglas Astronautics Co.: St. Louis, MO, USA, 1979. [Google Scholar]
  2. Dowell, E.H.; Bland, S.R.; Williams, M.H. Linear/nonlinear behavior in unsteady transonic aerodynamics. AIAA J. 1983, 21, 38–46. [Google Scholar] [CrossRef]
  3. Nguyen, L.T. Evaluation of Importance of Lateral Acceleration Derivatives in Extraction of Lateral-Directional Derivatives at High Angles of Attack; NASA TN D-7739; NASA: Washington, DC, USA, 1974.
  4. Davis, M.C.; White, J.T. X-43A Flight-Test-Determined Aerodynamic Force and Moment Characteristics at Mach 7.0. J. Spacecr. Rocket. 2008, 45, 472–484. [Google Scholar] [CrossRef] [Green Version]
  5. Greenwell, D.I. Frequency Effects on Dynamic Stability Derivatives Obtained from Small-Amplitude Oscillatory Testing. J. Aircr. 1998, 35, 776–783. [Google Scholar] [CrossRef]
  6. Kramer, B. Experimental evaluation of superposition techniques applied to dynamic aerodynamics. In Proceedings of the 40th AIAA Aerospace Sciences Meeting & Exhibit, Reno, NV, USA, 14–17 January 2002; p. 700. [Google Scholar]
  7. Da Ronch, A.; Vallespin, D.; Ghoreyshi, M.; Badcock, K.J. Evaluation of Dynamic Derivatives Using Computational Fluid Dynamics. AIAA J. 2012, 50, 470–484. [Google Scholar] [CrossRef]
  8. Chung, H.; Lee, H.; Lee, M. Estimation of Aircraft Longitudinal Dynamic Derivatives Using Dynamic Mesh Method. Available online: https://www.dbpia.co.kr/journal/publicationDetail?publicationId=PLCT00001276 (accessed on 23 March 2021).
  9. Lee, H.-R.; Gong, H.-J.; Kim, B.-S.; Lee, S.-S. Prediction of Pitch and Roll Dynamic Derivatives for Flight Vehicle using CFD. J. Korean Soc. Aeronaut. Space Sci. 2012, 40, 395–404. [Google Scholar] [CrossRef]
  10. Bhagwandin, V.; Sahu, J. Numerical Prediction of Pitch Damping Derivatives for a Finned Projectile at Angles of Attack. In Proceedings of the 50th AIAA Aerospace Sciences Meeting Including the New Horizons Forum and Aerospace Exposition, American Institute of Aeronautics and Astronautics, Nashville, TN, USA, 9–12 January 2012; p. 691. [Google Scholar]
  11. Liu, X.; Liu, W.; Zhao, Y. Navier–Stokes predictions of dynamic stability derivatives for air-breathing hypersonic vehicle. Acta Astronaut. 2016, 118, 262–285. [Google Scholar] [CrossRef]
  12. Oktay, E.; Akay, H. CFD predictions of dynamic derivatives for missiles. In Proceedings of the 40th AIAA Aerospace Sciences Meeting & Exhibi, Reno, NV, USA, 14–17 January 2002; p. 276. [Google Scholar]
  13. Baigang, M.; Hao, Z.; Ban, W. Computational Investigation of simulation on the dynamic derivatives of flight vehicle. In Proceedings of the 29th Congress of the International Council of the Aeronautical Sciences, St. Petersburg, Russia, 7−12 September 2014; pp. 1–7. [Google Scholar]
  14. Sahu, J. Numerical Computations of Dynamic Derivatives of a Finned Projectile Using a Time-Accurate CFD Method. In Proceedings of the AIAA Atmospheric Flight Mechanics Conference and Exhibit, Hilton Head, SC, USA, 20 August 2007; 2007; p. 6581. [Google Scholar]
  15. Bryan, G.H. Stability in Aviation: An Introduction to Dynamical Stability as Applied to the Motions of Aeroplanes; Macmillan and Company, Limited: London, UK, 1911. [Google Scholar]
  16. Theodorsen, T.; Garrick, I.E.; U.S.N.A.C. for Aeronautics. General Potential Theory of Arbitrary Wing Sections; US Government Printing Office: New York, NY, USA, 1933.
  17. Theodorsen, T.; Mutchler, W.H. General Theory of Aerodynamic Instability and the Mechanism of Flutter; Rept. 496; NACA: Washington, DC, USA, 1935. [Google Scholar]
  18. Alemdaroglu, N.; Iyigun, I.; Altun, M.; Uysal, H.; Quagliotti, F.; Guglieri, G. Determination of dynamic stability derivatives using forced oscillation technique. In Proceedings of the 40th AIAA Aerospace Sciences Meeting & Exhibit, Reno, NV, USA, 14–17 January 2002; p. 528. [Google Scholar]
  19. Guglieri, G.; Quagliotti, F.B. Dynamic stability derivatives evaluation in a low-speed wind tunnel. J. Aircr. 1993, 30, 421–423. [Google Scholar] [CrossRef]
  20. Hanff, E.S.; Orlik-Ruckemann, K.J. Wind-Tunnel Measurement of Dynamic Cross-Coupling Derivatives. J. Aircr. 1978, 15, 40–46. [Google Scholar] [CrossRef]
  21. Newman, D.M. A Technique for Measurement of Static and Dynamic Longitudinal Aerodynamic Derivatives Using the DSTO Water Tunnel; DSTO Defence Science and Technology Organisation: Victoria, Australia, 2011. [Google Scholar]
  22. Erm, L. An Experimental Investigation into the Feasibility of Measuring Static and Dynamic Aerodynamic Derivatives in a Water Tunnel. In Proceedings of the 30th AIAA Applied Aerodynamics Conference, New Orleans, LA, USA, 25–28 June 2012; p. 3119. [Google Scholar]
  23. Moelyadi, M.A.; Sachs, G. CFD based determination of dynamic stability derivatives in yaw for a bird. J. Bionic Eng. 2007, 4, 201–208. [Google Scholar] [CrossRef]
  24. Chung, H.-S.; Yang, K.-J.; Kwon, K.-B.; Lee, H.-K.; Kim, S.-T.; Lee, M.-S.; Reu, T. Estimation of Longitudinal Dynamic Stability Derivatives for a Tailless Aircraft Using Dynamic Mesh Method. J. Korean Soc. Aeronaut. Space Sci. 2015, 43, 232–242. [Google Scholar] [CrossRef]
  25. Mi, B.; Zhan, H. Review of Numerical Simulations on Aircraft Dynamic Stability Derivatives. Arch. Comput. Methods Eng. 2019, 27, 1515–1544. [Google Scholar] [CrossRef]
  26. Dupuis, A.D.; Hathaway, W. Aeroballistic Range Tests of the Basic Finner Reference Projectile at Supersonic Velocities; DREV-TM-9703; Defence Research Establishment: Valcartier, QC, Canada, 1997.
  27. Uselton, B.L.; Uselton, J.C. Test Mechanism for Measuring Pitch-Damping Derivatives of Missile Configurations at High Angles of Attack; AEDC-TR-75-43; Arnold Engineering Development Center Arnold AFB: Hillsboro, TN, USA, 1975. [Google Scholar]
  28. ANSYS Inc. 2009. Available online: https://www.afs.enea.it/project/neptunius/docs/fluent/html/udf/node4.htm (accessed on 23 March 2021).
  29. Ansys Inc. ANSYS Fluent. Available online: https://www.ansys.com/products/fluids/ansys-fluent (accessed on 21 January 2020).
  30. Araya, G. Turbulence Model Assessment in Compressible Flows around Complex Geometries with Unstructured Grids. Fluids 2019, 4, 81. [Google Scholar] [CrossRef] [Green Version]
  31. Schütte, A.; Marini, R.N. Computational Aerodynamic Sensitivity Studies for Generic Delta Wing Planforms. In New Results in Numerical and Experimental Fluid Mechanics XII. DGLR 2018. Notes on Numerical Fluid Mechanics and Multidisciplinary Design; Dillmann, A., Heller, G., Krämer, E., Wagner, C., Tropea, C., Jakirlić, S., Eds.; Springer: Cham, Switzerland, 2020; Volume 142. [Google Scholar] [CrossRef] [Green Version]
  32. DeSpirito, J.; Silton, S.; Weinacht, P. Navier-Stokes predictions of dynamic stability derivatives: Evaluation of steady-state methods. J. Spacecr. Rocket. 2009, 46, 1142–1154. [Google Scholar] [CrossRef] [Green Version]
  33. Weinacht, P. Characterization of Small-Caliber Ammunition Performance Using a Virtual Wind Tunnel Approach. In Proceedings of the AIAA Atmospheric Flight Mechanics Conference and Exhibit, Hilton Head, SC, USA, 20–23 August 2007; p. 6579. [Google Scholar]
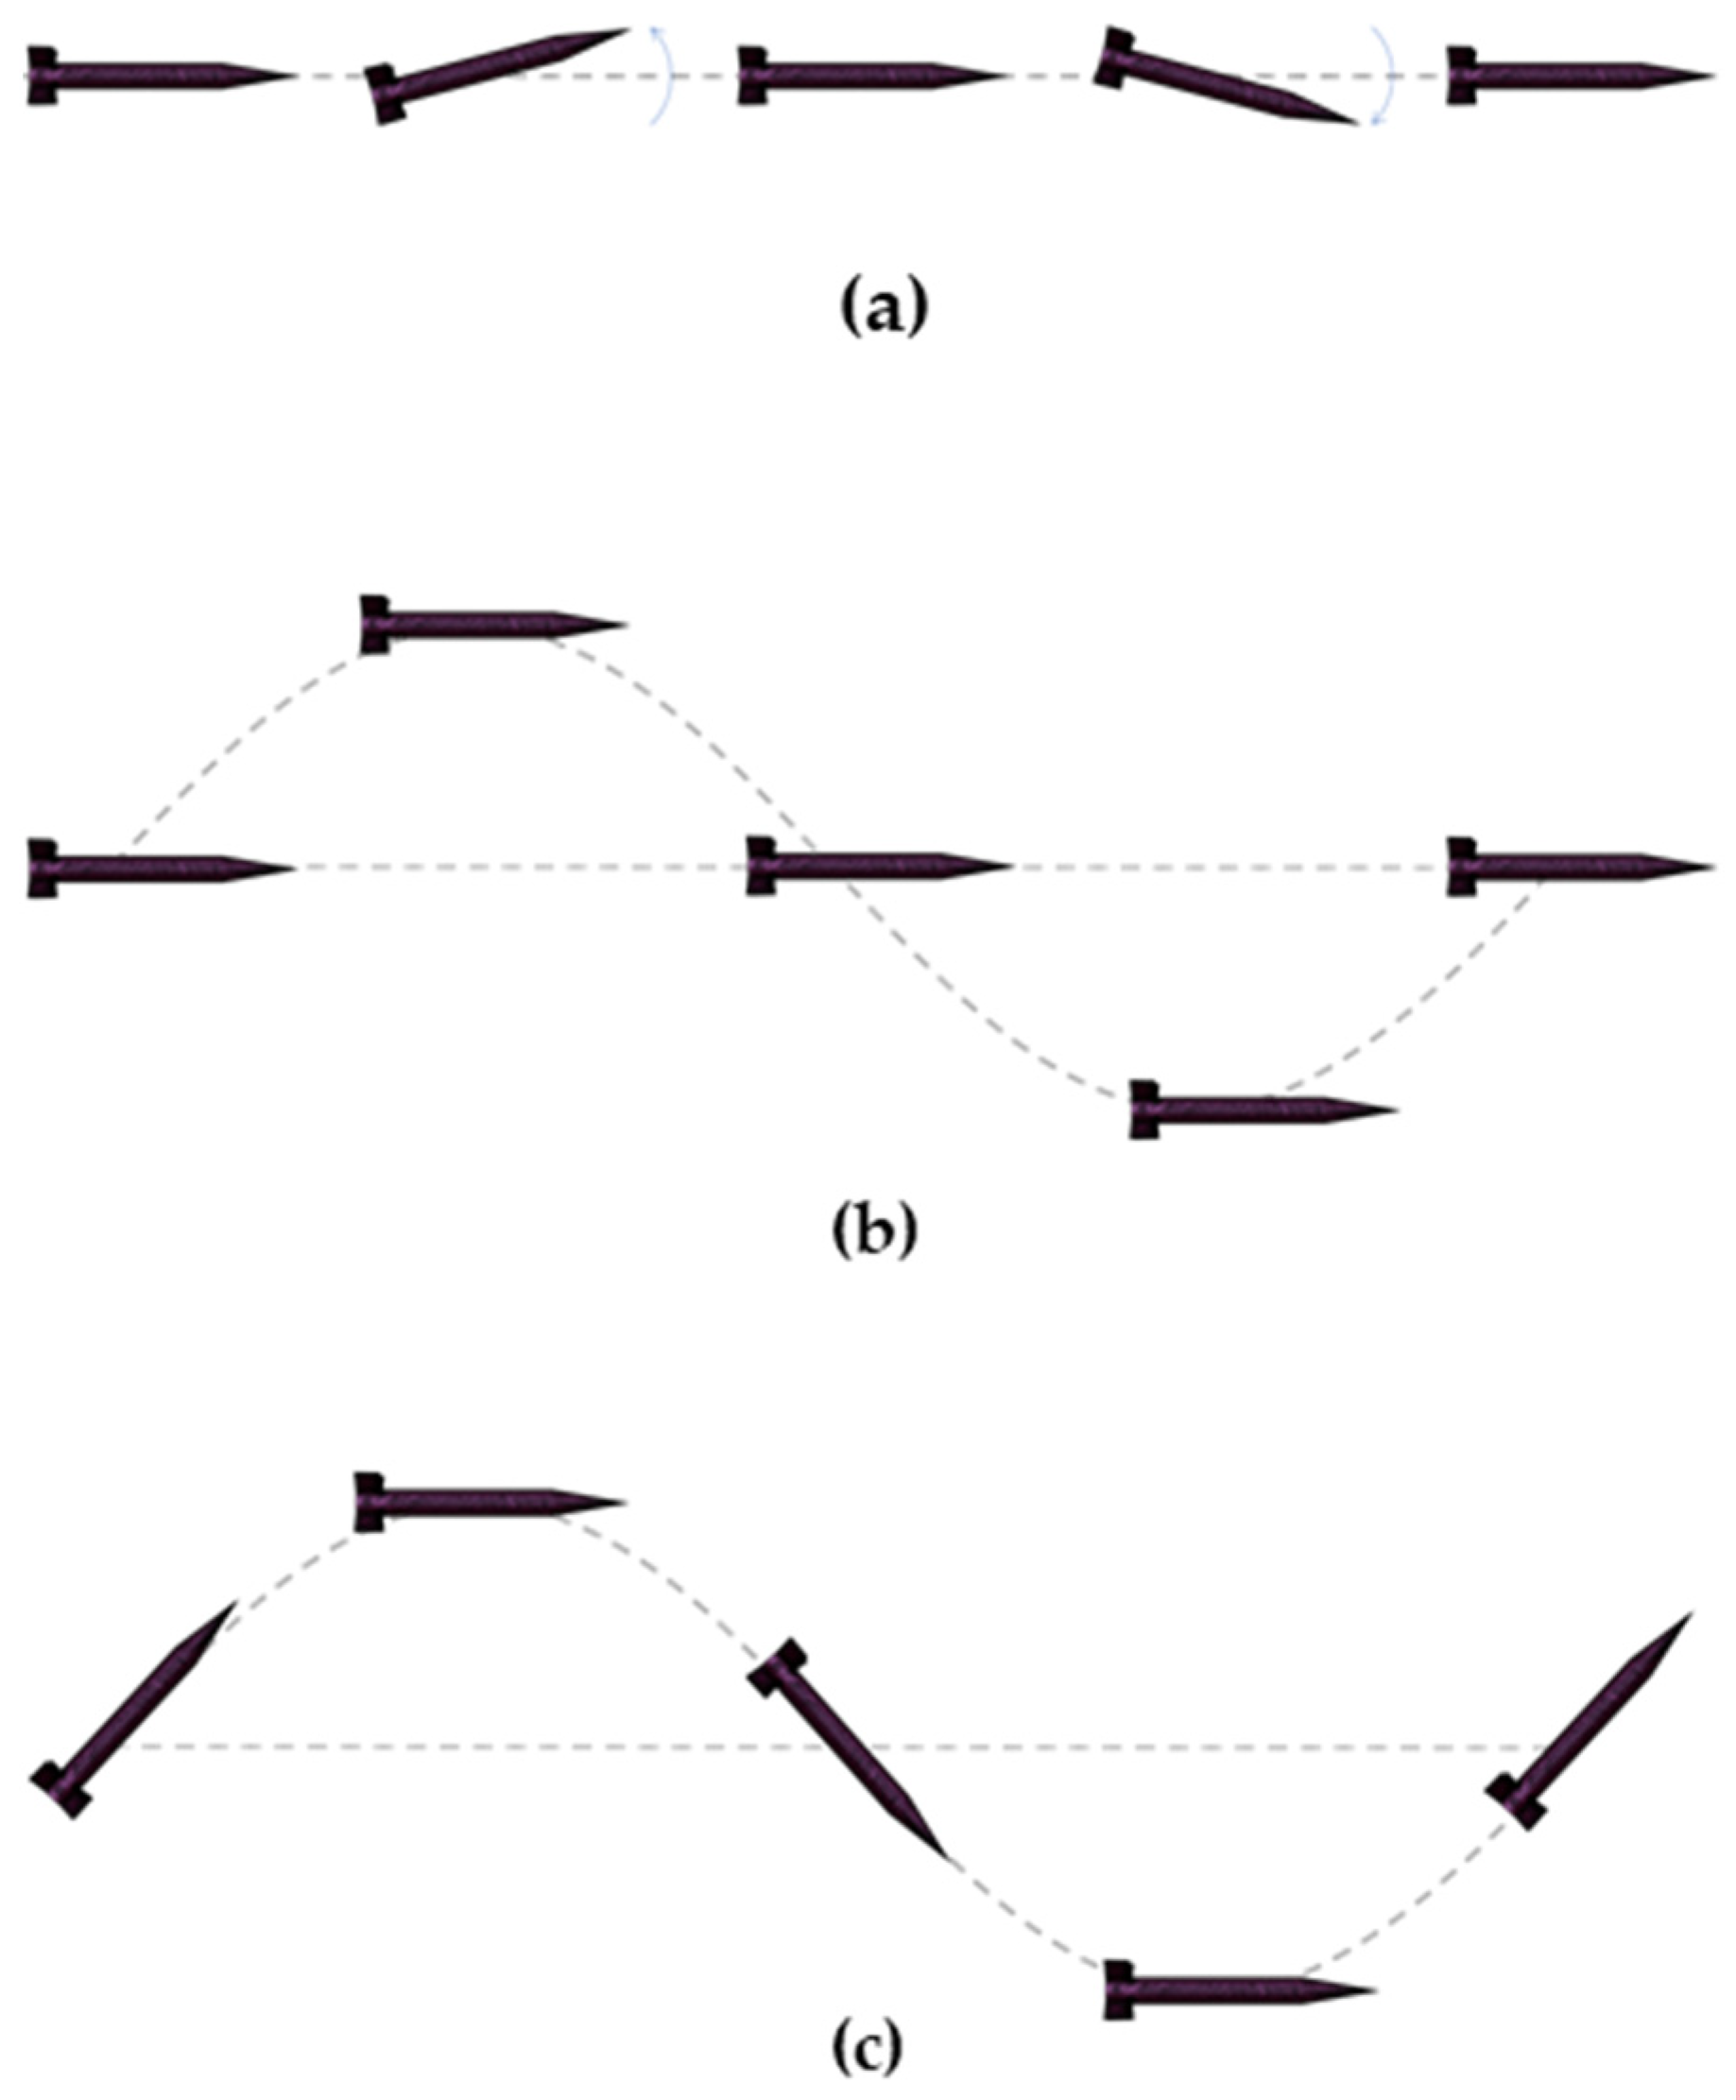
Figure 1. Simple harmonic oscillation methods: (a) pitching mode; (b) plunging mode; (c) flapping mode. Reproduced with permission from Baigang Mi et al, Review of Numerical Simulations on Aircraft Dynamic Stability Derivatives; published by Springer Nature, 2019 [25].
Aerospace 08 00354 g001
Figure 2. (a) Axis system on unstructured surface mesh of ANF missile; (b) 45 deg missile rotation along x-axis for tests-conduct condition.
Aerospace 08 00354 g002
Figure 3. Army-Navy Finner (ANF) missile configuration: l/d = 10.
Aerospace 08 00354 g003
Figure 4. Unstructured Meshing details: (a) Nose section; (b) Fin section.
Aerospace 08 00354 g004
Figure 5. (a) Yplus distribution contour; (b) Yplus distribution plot along directional symmetry plane.
Aerospace 08 00354 g005
Figure 6. Details of: (a) Prism boundary layer at nose-body conjunction; (b) far-field with small dynamic mesh sphere zone in the middle.
Aerospace 08 00354 g006
Figure 7. Mesh convergency test for coarse, medium, and fine mesh model; (a) angle of attack 0 to 10 deg; (b) detailed view of angle of attack of 5 deg.
Aerospace 08 00354 g007
Figure 8. Dynamic mesh set-up: (a) static zone (far field), (b) moving zone.
Aerospace 08 00354 g008
Figure 9. Comparison between turbulence model SA and kω-SST for steady and unsteady cases.
Aerospace 08 00354 g009
Figure 10. Static pressure (P) profile of (a) circumferential pressure at c.g.; (b) Axial pressure from nose to base along with the symmetry plane cut.
Aerospace 08 00354 g010
Figure 11. Moment coefficient value for steady analysis alpha sweep from 0 to 85 deg: (a) C m vs. α; (b) C m α vs. α.
Aerospace 08 00354 g011aAerospace 08 00354 g011b
Figure 12. Filtered data using the last two cycles of the computational fluid dynamics (CFD) analysis.
Aerospace 08 00354 g012
Figure 13. History plot for (a) C m C m o vs. θ; (b) C m C m o vs. pitch rate.
Aerospace 08 00354 g013
Figure 14. Dynamic stability derivatives of forced pitching simple harmonic oscillation: (a) ( C m q + C m α ˙ ) vs. α; (b) C m α vs. α; (c) C m o vs. α.
Aerospace 08 00354 g014
Figure 15. Comparison between Steady case Cm plot and Unsteady Cm history hysteresis.
Aerospace 08 00354 g015
Figure 16. Comparison of combined dynamic stability derivatives of forced plunging and forced pitching simple harmonic oscillation.
Aerospace 08 00354 g016
Figure 17. Comparison of C m α of forced plunging and forced pitching simple harmonic oscillation.
Aerospace 08 00354 g017
Figure 18. Comparison of C m o value from all analysis methods.
Aerospace 08 00354 g018
Table 1. Oscillation user-defined input (UDF) for pitching, plunging, and flapping modes.
ModePitchingPlungingFlapping
y-axis rotation (t) α A sin ( ω t ) - α A cos ( ω t ) *
z-axis translation (t)- z A sin ( ω t ) z A sin ( ω t )
α ( t ) α 0 + α A sin ( ω t ) α 0 + α A sin ( ω t ) α 0
θ ( t ) θ A sin ( ω t ) 0 θ A sin ( ω t )
* modified initial position.
Table 2. Flow condition based on AEDC wind tunnel test report.
R e d M P 0 T 0 q V
(Pa)(K)(Pa)(m/s)
0.086 × 1061.9622,753306.118342.7516.97
Table 3. Comparison of dynamic stability derivatives of forced pitching (A), forced plunging (B), and forced flapping (C).
α C m α ˙ (B) C m q (C)Total (B + C) C m α ˙ + C m q (A)Error
047.231−316.149−268.918−268.700−0.08%
1027.708−369.019−341.311−331.720−2.89%
4514.321−600.932−586.611−570.105−2.90%
75−49.649−564.955−614.604−588.397−4.45%
Table 4. Comparison of C m α between forced pitching (A), forced plunging (B), and forced flapping (C).
α C m α (B) C m α (C)Total (B + C) C m α (A)Error
0−17.0990.655−16.444−16.4650.13%
10−16.115−1.356−17.470−17.375−0.55%
45−18.96523.7894.8243.234−49.18%
75−13.25928.01914.76013.550−8.93%
Publisher’s Note: MDPI stays neutral with regard to jurisdictional claims in published maps and institutional affiliations.