Article

COVID-19 Pandemic—Financial Consequences for Polish Airports—Selected Aspects

by
Agnieszka Barczak
Faculty of Economics, West Pomeranian University of Technology in Szczecin, ul. Janickiego 31, 71-270 Szczecin, Poland
Aerospace 2021, 8(11), 353; https://doi.org/10.3390/aerospace8110353
Submission received: 30 September 2021 / Revised: 8 November 2021 / Accepted: 16 November 2021 / Published: 18 November 2021

Abstract

:
The COVID-19 pandemic has reduced the mobility of urban residents on an international level. Tourist air traffic was suspended as one of many activities. As a result, the aviation industry has suffered losses at various levels. In addition to carriers, airports are also suffering due to the effects of the pandemic. Their income comes mainly from charges for take-offs and landings of airplanes, passenger charges, and commercial and restaurant activity. In this paper, the authors attempt to estimate the level of losses incurred by six Polish airports in relation to passenger charges. Based on the data for the years 2015–2019, the forecasts of passenger flows for the year 2020 were estimated using the seasonality indicator method, the method of one-name period trends, and models of linear trends with seasonality. Research has shown that the total losses of the examined airports for the year 2020 amounted to approximately 290 million EUR, and these are losses resulting only from the lack of fees charged for servicing passengers at the airports.

1. Introduction

On 11 March 2020, the World Health Organization (WHO) announced the outbreak of the COVID-19 pandemic [1]. As a result, many countries imposed restrictions on social life and human mobility. These restrictions included passenger air transport, considered by many to be a means of transport contributing to the spread of the pandemic around the world [2,3,4].
In Poland, the first case of a person who tested positive for COVID-19 was recorded on 4 March 2020. The same year, on 8 March, the Act on special solutions related to the prevention, counteracting and combating COVID-19, other infectious diseases and crisis situations caused by them entered into force [5]. On the same day, LOT Polish Airlines suspended all flights to Italy until 12 March 2020, and to China until 25 April. Wizz Air suspended connections to Bergamo from Warsaw, Gdańsk, and Katowice until 3 April. On 13 March 2020, Poland introduced a state of epidemic emergency. As a result, on the night of 14–15 March, international air connections were suspended. The only flights arranged served to allow Poles staying abroad to return home (the so-called “Flight Home” operation) [6].
In July and August 2020 (holiday months in Poland), after some of the restrictions on the use of air transport in international traffic were lifted, some Poles decided to travel abroad. However, there was only a partial recovery, which may have stemmed from concerns related to the risk of infection and the dynamically changing pandemic situation in the world (e.g., additional restrictions, the need for quarantine). Compared to the previous year, in July and in August, the number of passengers was lower by 64% and by 53%, respectively [
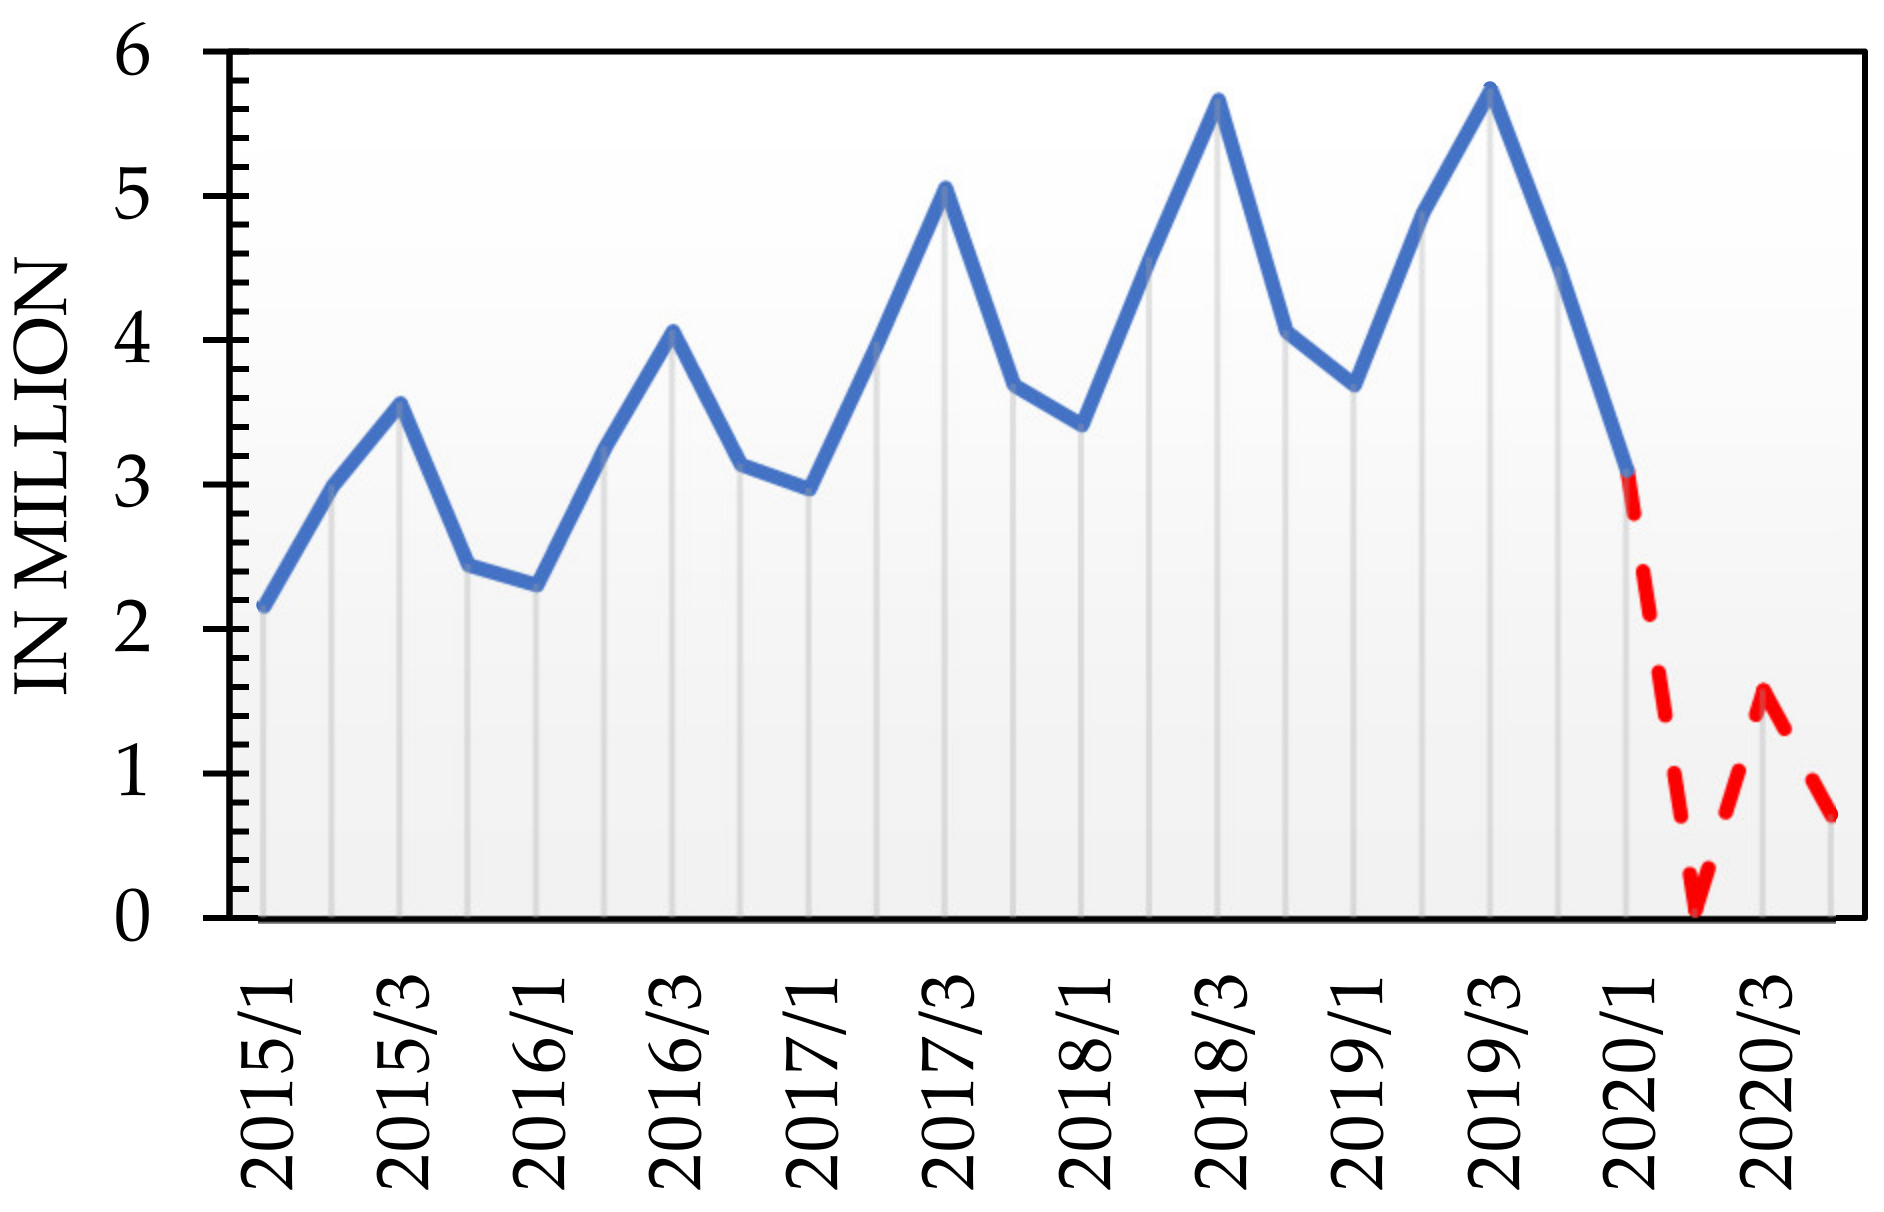
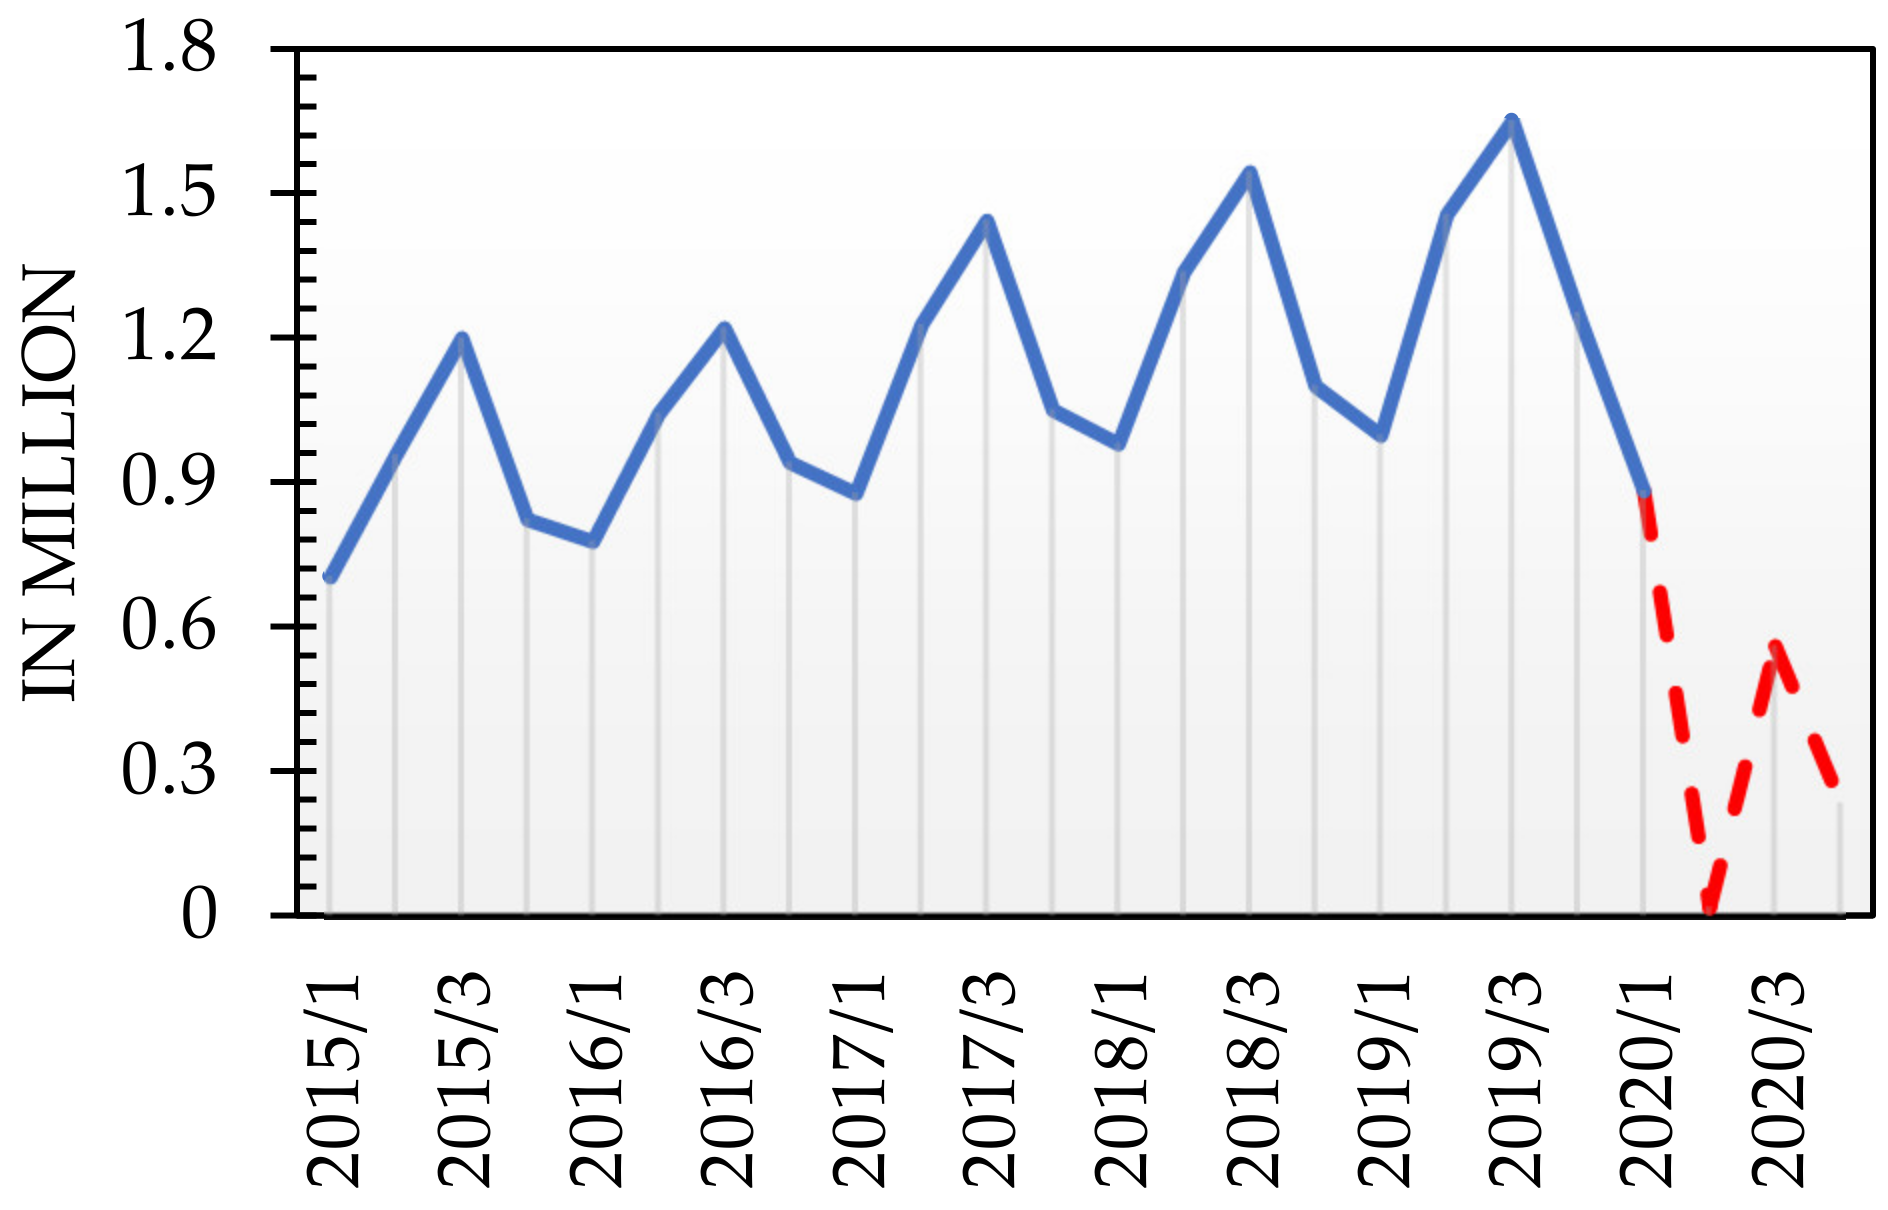
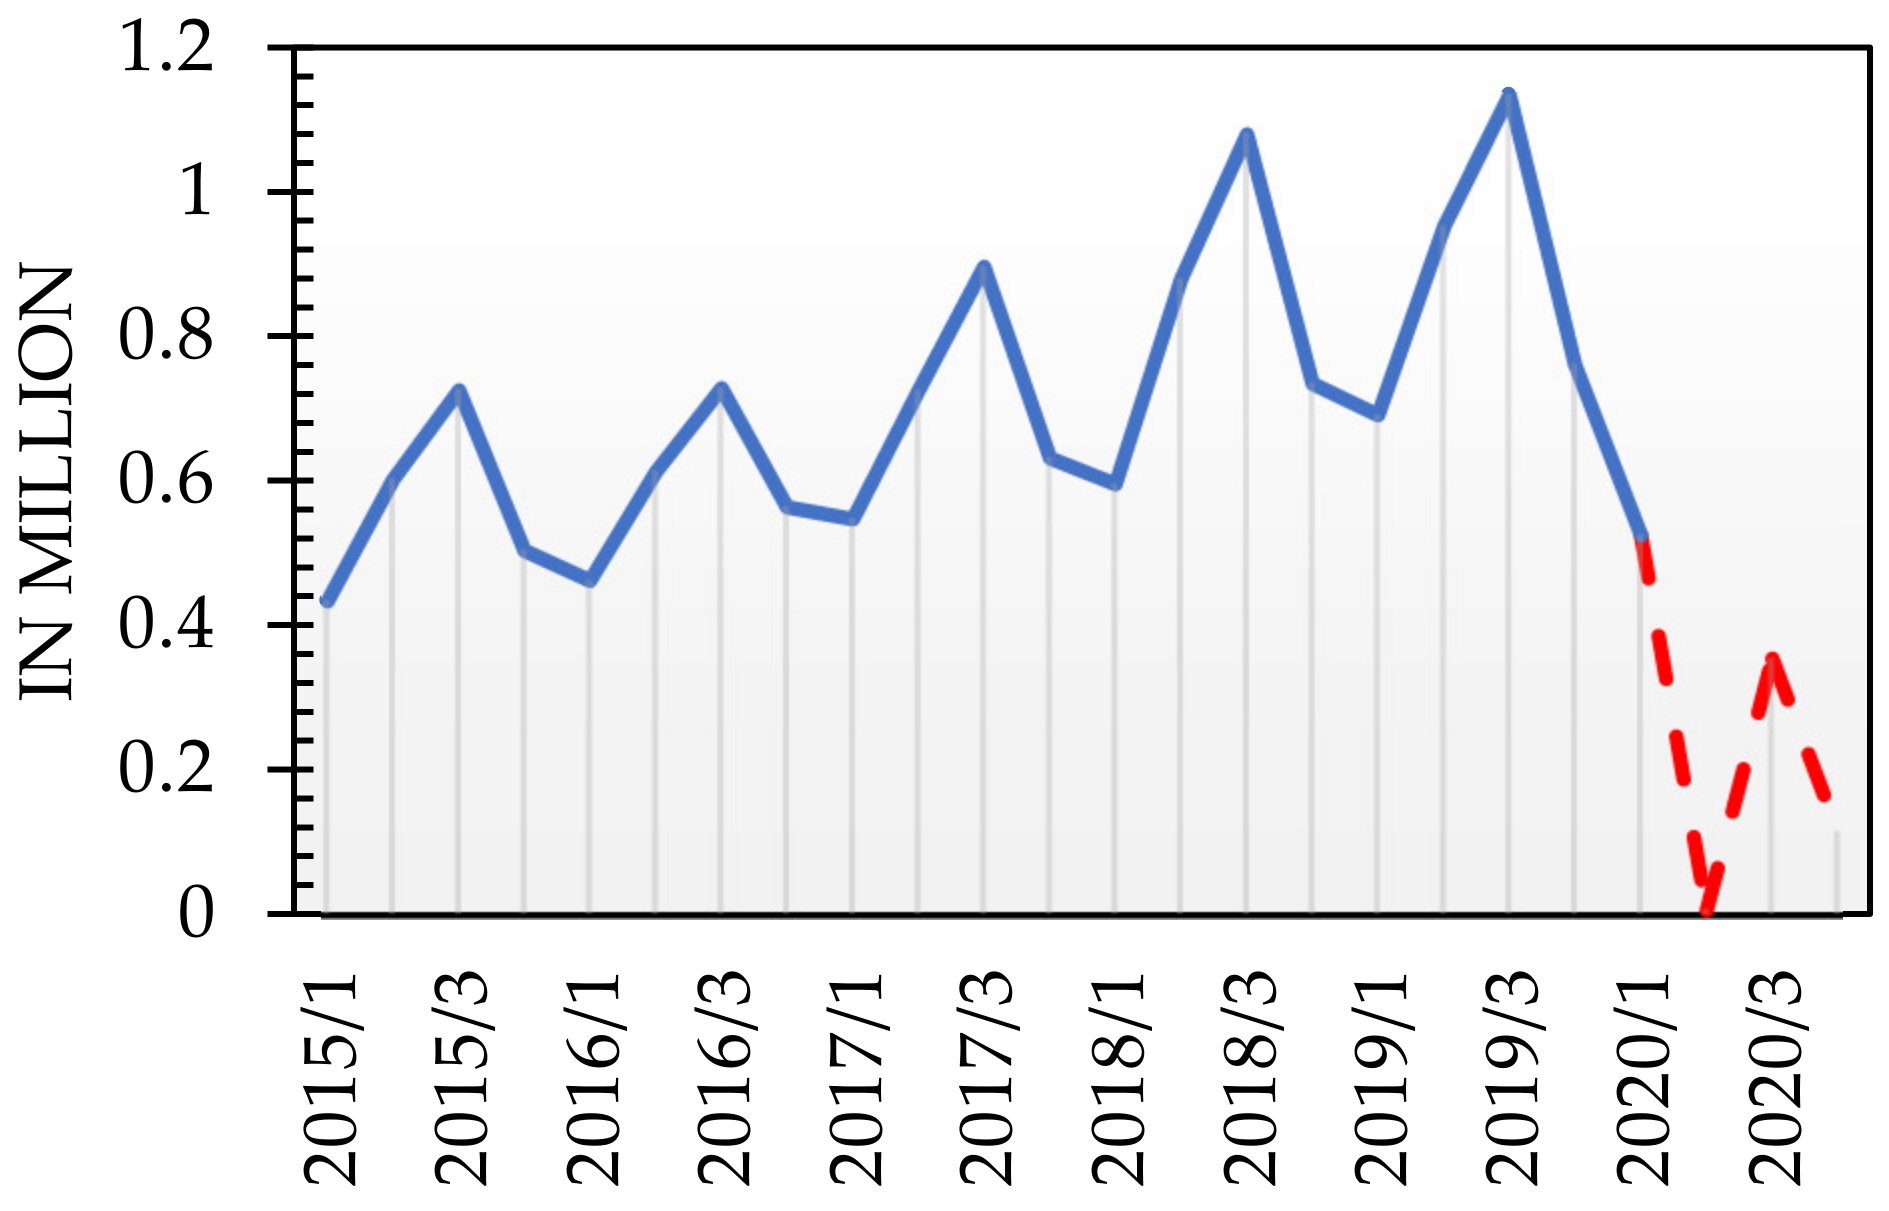
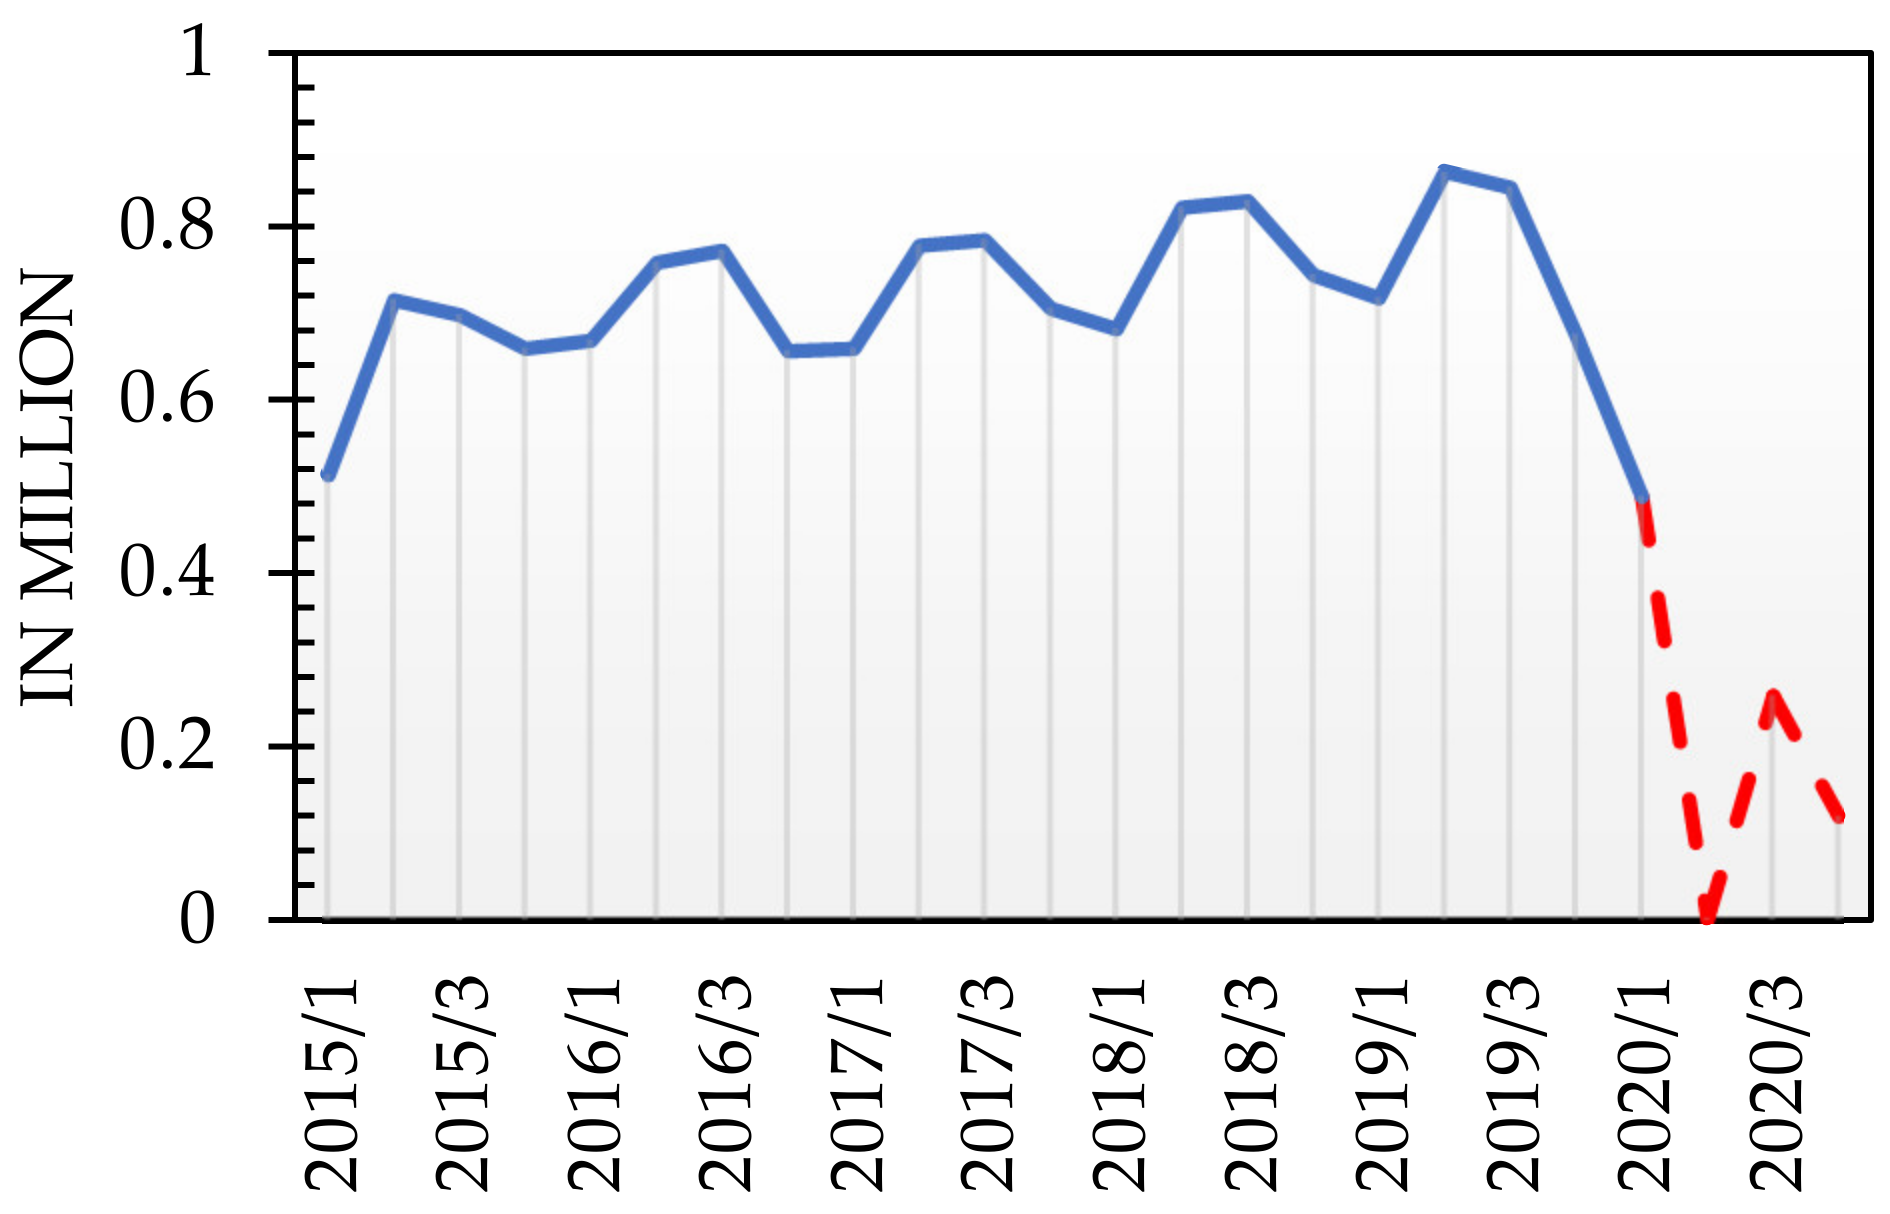
7]. In the following months, the number of passengers continued to decline. This tendency continues to date, and it is difficult to predict what the situation will look like in the near future. It is all the more difficult to assess as the fourth wave of the pandemic has already begun in many European countries, and all signs indicate that Poland will also be affected by said wave.
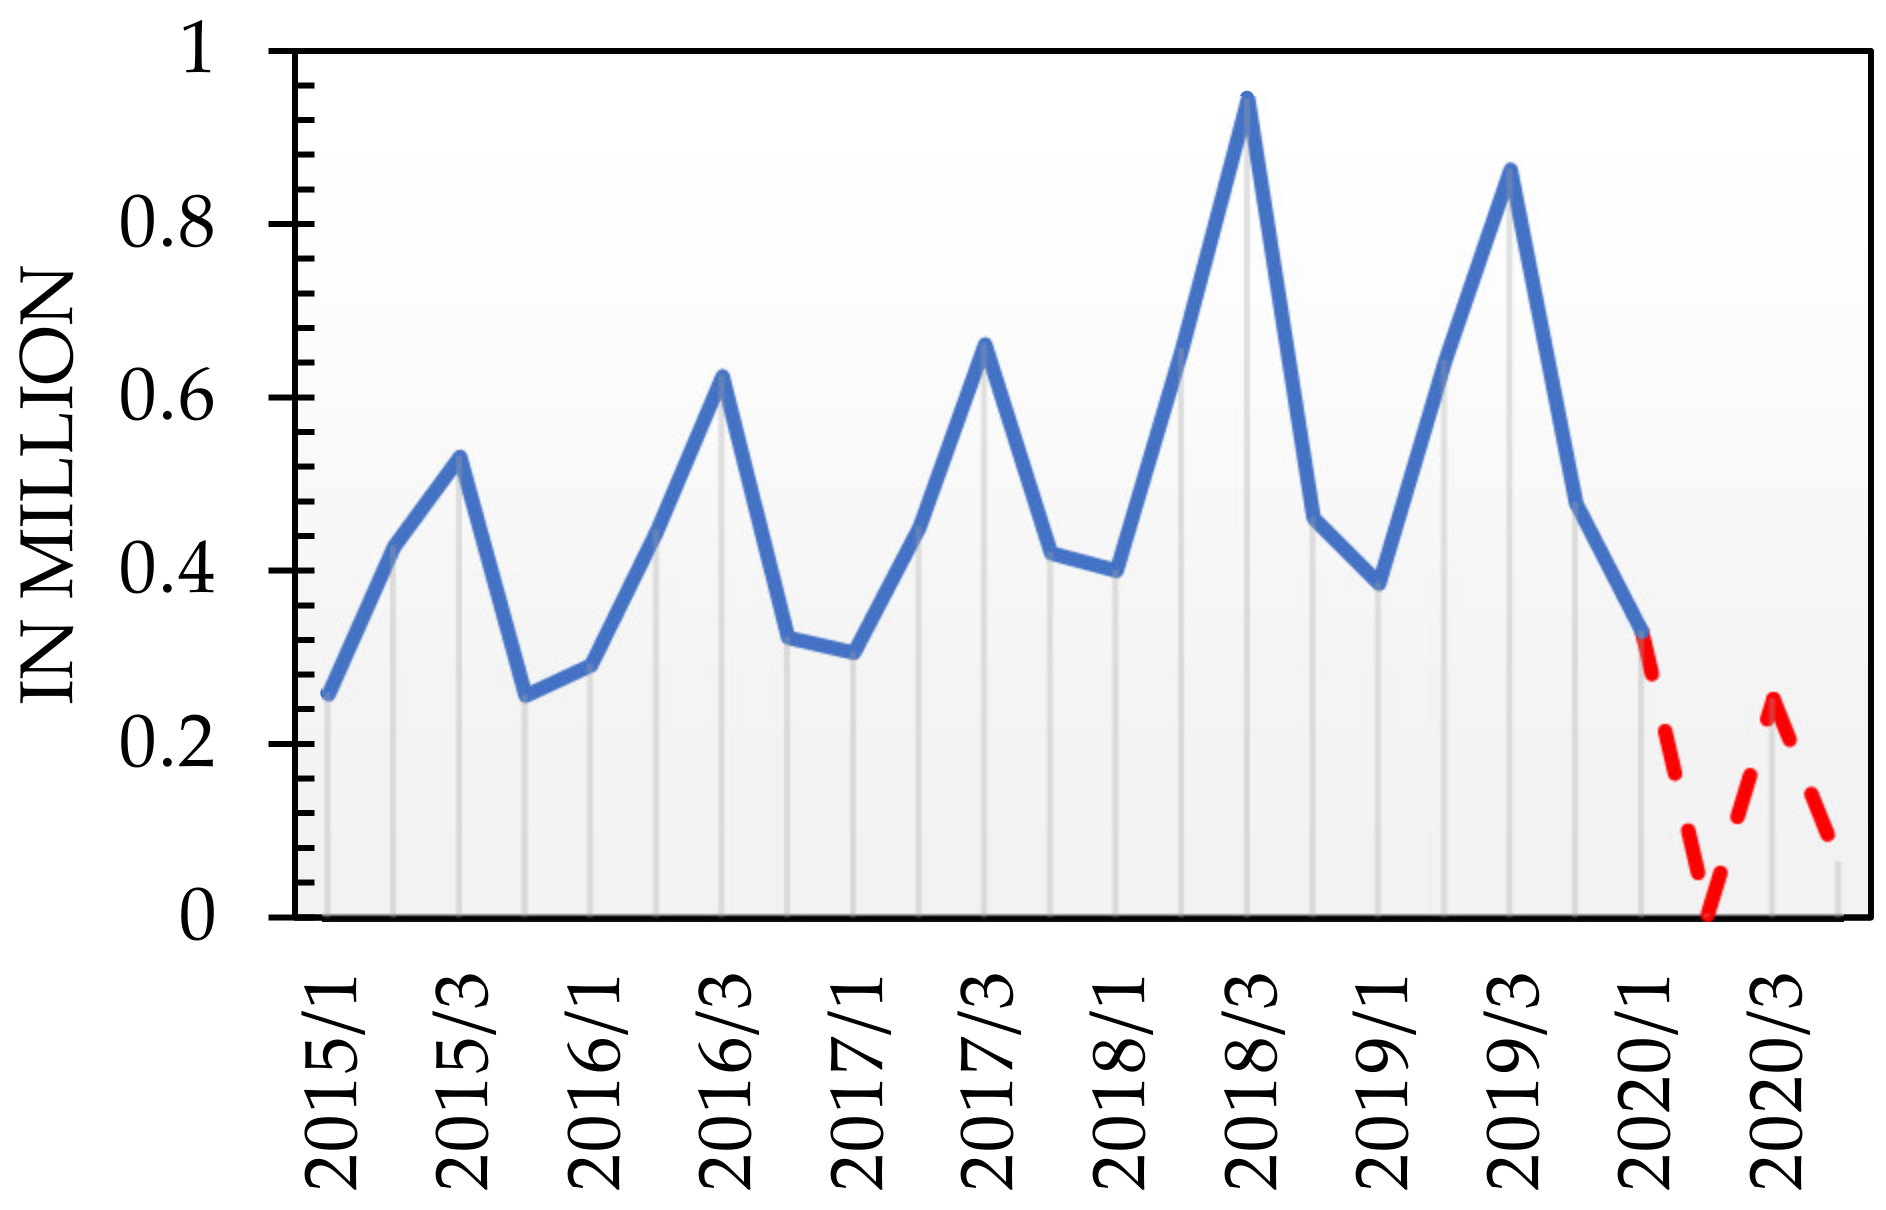
The impact of the COVID-19 pandemic on passenger flows at the surveyed airports by individual quarters is shown in Figure 1, Figure 2, Figure 3, Figure 4, Figure 5 and Figure 6. The red color marks the volume of air traffic since the beginning of the pandemic. Confirmation of a significant decrease in the number of passengers is also seen in the values presented in Table 1 [8].
The International Civil Aviation Organization (ICAO) draws attention to the significant drops in the number of passengers in international air transport [9]. Interestingly, one of the studies indicates that even before the restrictions were announced, the information about the spread of the virus caused unfavorable changes on the air services market [10].
Many studies on air transport in times of the COVID-19 pandemic analyze the overall consequences for the air transport market [11,12]. There are also national and regional studies [13,14]. Researchers are also focusing on the analysis of security measures taken at airports and in airplanes, emphasizing that the airport is a venue for the conditions for faster spread of the virus [15,16]. The impact of the pandemic on mobility in air transport, and thus on environmental pollution, is also analyzed [17,18]. The research also focuses on passengers’ perceptions of the uncertainty associated with air travel in the face of the pandemic [19,20,21,22].
In addition to the above, researchers also draw attention to the problems faced by air cargo transport, which, due to its specificity (use of free luggage space to transport goods), has also been largely limited [23,24]. However, some carriers did not record major losses only because they organized medical transport and there was a need to transport certain goods [17,25,26,27].
Researchers are trying to forecast the development of passenger flows in the coming years [28,29,30]. It is estimated that it will take two to four years for the demand for passenger air transport to recover. Research on the number of passengers at German airports and the impact of COVID-19 on their financial results is presented in Wolle [14]. He stated that a noticeable recovery in air passenger traffic was unlikely until mid-2022. Gudmundsson, Cattaneo, and Redondi predict Europe will witness a recovery after 2.7 years [30]. So far, no studies have been published on the impact of the decline in passenger flows on the finances of airports in Poland. There is also no study using a set of forecasting methods for this purpose. Therefore, this study will close this research gap. At the same time, it may indicate the mode of carrying out this type of analysis in other countries.
Summarizing the above, a quick review of the literature may tell us that airports earn, inter alia, from fees for take-offs and landings of airplanes, commercial and restaurant activity, and parking lots. Furthermore, charges for generating noise and passenger charges generate revenue as well.
Therefore, the aim of the study is an attempt to estimate the level of losses incurred by six Polish airports in relation to passenger charges. The airports with the largest passenger flows were selected for the study. Based on the data for 2015–2019, the forecasts of passenger flows for 2020 were estimated using the seasonality indicator method, the method of one-name period trends, and models of linear trends with seasonality.
The fees charged by airports for passenger service differ for domestic, international and transfer passengers. As the statistical data do not take into account the division into passenger types, for the purposes of this analysis, the authors adopted an average rate per passenger. There is also a lack of data on the number and types of aircraft using airport services. Therefore, this analysis only focuses on the passenger charge.

2. Materials and Methods

The study used quarterly data for the years 2015–2020 from the six Polish airports with the largest passenger flows: Warsaw Frederic Chopin Airport (Warsaw Okęcie), Kraków Jan Paweł II Airport (Krakow Balice), Gdańsk Lech Wałęsa Airport (Gdańsk Rębiechowo), Wrocław Airport, Warsaw Modlin Airport, and Poznań-Ławica Airport. The data come from the collections of the Polish Civil Aviation Authority.
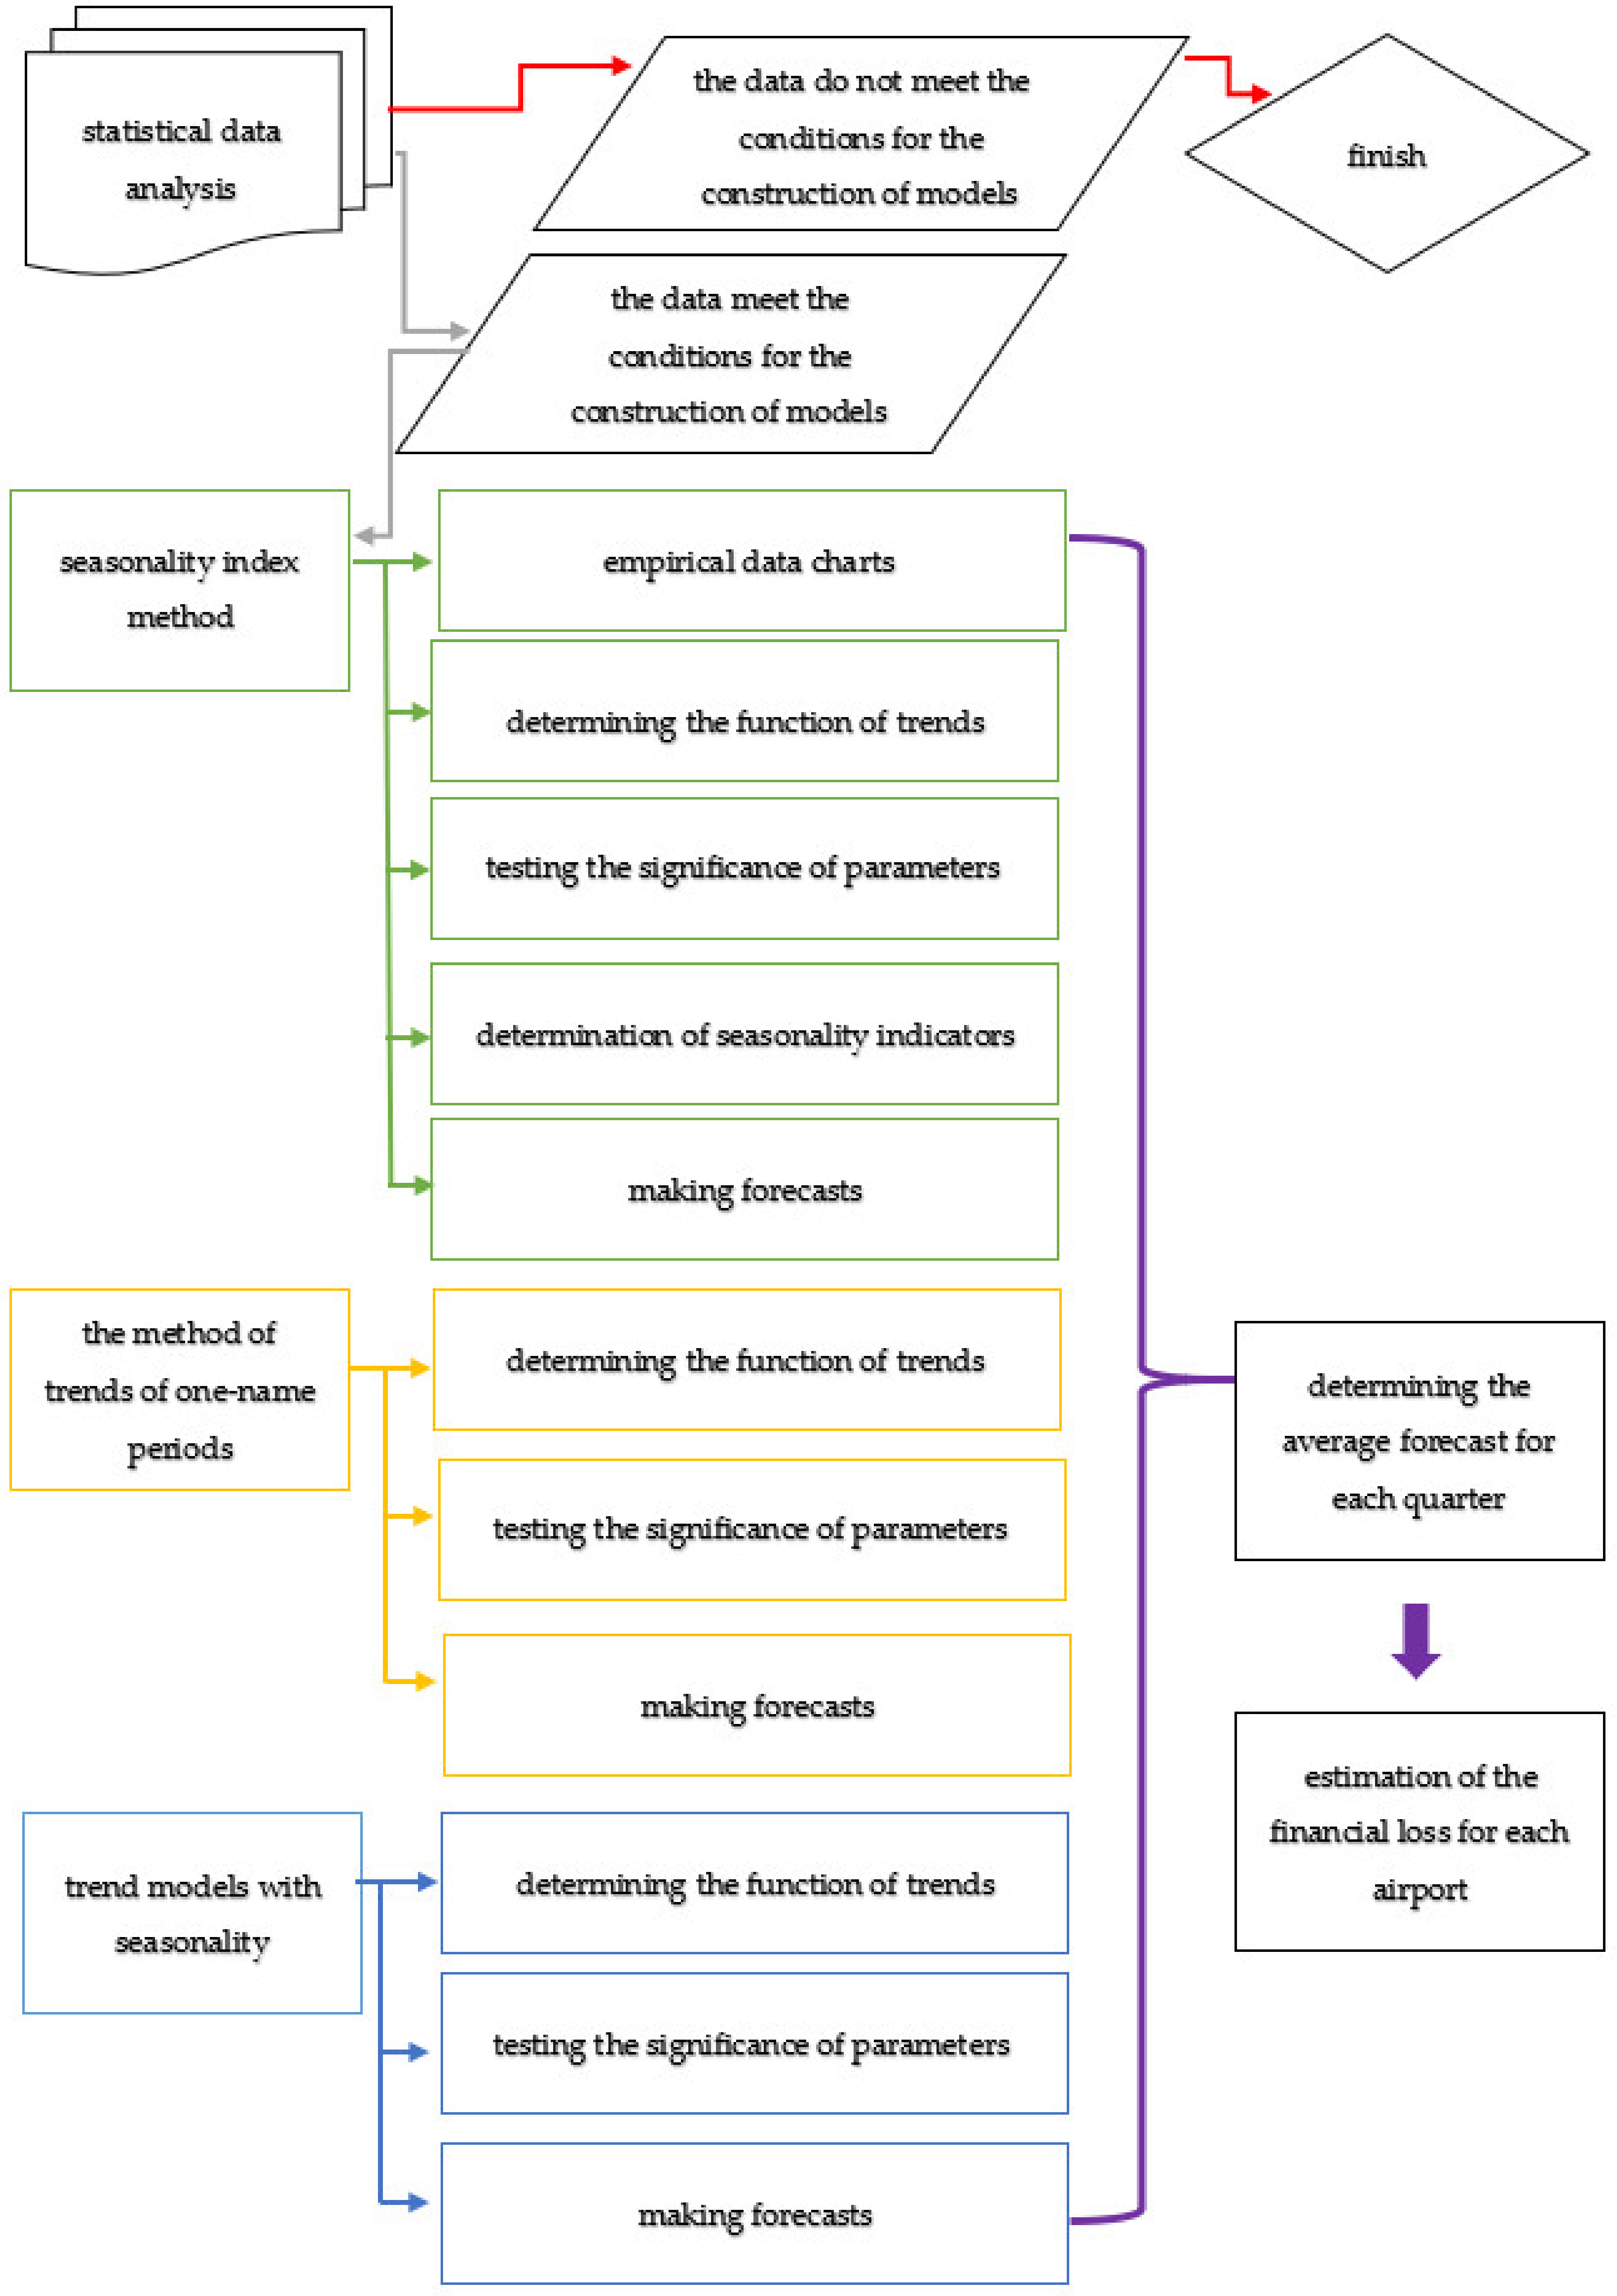
Three forecasting methods were used to obtain the forecasts for 2020: the method of seasonality indicators, the method of the trends of one-name periods, and the models of linear trends with seasonal fluctuations. The scheme of the procedure is presented in Figure 7.
First, the author-applied method used to forecast passenger flows was the method of seasonality indicators [31]. The method of determining the forecast depends on the type of seasonal fluctuations, which may be multiplicative or additive. Multiplication fluctuations occur when, in individual cycle sub-periods, the analyzed phenomenon deviates from the average level or trend by a certain constant relative value. Additive fluctuations refer to a situation in which there are constant in terms of absolute value deviation of the level of the analyzed phenomenon from the average level or trend in individual seasonality cycle sub-periods [32]. The applied method of determining the seasonality indicators is based on the quotient of empirical values and the value of the trend. The average index for homonymous periods is determined successively; otherwise, the quotient of the mean homonymous periods by the average trend value of the homonymous periods is used [33].
S i = y i y ^ i n · 100
or
S i = y ¯ i y ¯ ^ i · 100 = y ¯ i y ^ i · 100
where:
  • S i —seasonality index for the ith seasonality cycle subperiod.
  • y i —empirical value of the period variable i.
  • y ¯ i —mean empirical value of the variable of the homonymous periods.
  • y ^ i —the value of the trend of the period i.
  • y ¯ ^ i —the average value of the trend of the homonymous periods.
  • n —number of homonymous periods.
i = 1 d S i = d
It is necessary to determine the correction factor:
k = d i = 1 d S i ,
where:
  • d —number of sub-periods in the cycle.
This coefficient allows for the transformation of raw (uncleaned) seasonal indicators into indicators purified using the formula:
S k i = k · S i
If known, the measures of seasonal fluctuations and the trend function of the studied phenomenon allows for obtaining forecasts. For multiplicative seasonal fluctuations (data from airports are characterized by multiplicative fluctuations), in order to obtain a forecast for the period t = T , the following formula is applied:
y T P = y ^ T · S k i
where:
  • y T P —forecast for the period t = T .
  • y ^ T —value of the estimated trend function.
Of note, however, due to the forecasting method not being based on a formal model, it is not possible to determine the forecast error [34].
The second method is the one-name period trend method [35]. This method is based on the estimation of the parameters of the analytical trend function with division into individual cycle phases. The forecast is obtained by extrapolating an estimated trend function for each phase of the cycle [36].
Before starting the construction of an endogenous variable forecast using the method of same-period trends, in order to maintain the correctness of the prediction process, the following assumptions are to be made [37]:
  • The stability of the model structure will be maintained in the period covered by the forecast.
  • Only regular changes take place in the analyzed economic process; there are no clearly abrupt changes with a size far exceeding the order of magnitude of random fluctuations.
  • The estimated basic characteristics of the analyzed economic process will not change significantly in the forecast period.
Each time series that relates to a specific phase of the cycle is described with a trend model selected depending on the analyzed data. The selection of the appropriate trend form was carried out by means of graphical analysis and an analysis of increases in numerical data. Then, the form of the trend function was estimated using the least squares method.
The last of the methods used in the analysis is the linear trend method with the seasonality [38]. Some dummy variables are introduced in econometric models of seasonal fluctuations; they correspond to the distinguished phases of the cycle. The estimated coefficients located at these variables are therefore measures of cyclical effects [39]. The general record of the model with the linear trend and the periodic seasonal component is as follows:
y ^ = α 0 + α 1 t + k = 1 m d 0 k Q k t + U t
under the condition that:
k = 1 m d 0 k = 0
where:
  • α 0 ,   α 1 —model parameters.
  • d 0 k —model parameters reflecting fixed parts of seasonal effects in individual phases of the cycle.
  • Q k t —a dummy variable taking values equal to 1 in periods/moments corresponding to the kth phase of the cycle and equal to 0 in periods/moments corresponding to other phases of the cycle.
  • k —variable specifying the number of the seasonal cycle.
  • U t —a random component.
For all estimated econometric models of seasonal fluctuations and for trends of homologous periods, the type of model was selected based on graphical analysis and the analysis of increments for numerical data on passenger traffic. The basis for adopting the models for further analysis was to meet the following conditions:
  • A determination coefficient in the range (0.5625, 1),
  • A random variation coefficient not exceeding 15%, and
  • Randomness of the other estimated models (tested using a series test).
Ex ante forecast errors are based on unknown values of the dependent variable or the explanatory variables. These future values may be determined by applying various methods. However, in the case of the number of passengers in air transport in the COVID-19 condition, this task is difficult, if not impossible. Ex post forecast errors are based on the known values of the explanatory variables. However, due to the COVID-19 pandemic, these values significantly differ from the forecast data; therefore, the determination of these errors seems unjustified. For this reason, the study did not identify both ex ante and ex post forecast errors.

3. Results

For each airport, empirical data charts with a quarterly breakdown were created. On this basis, it was possible to make conclusions about the course of seasonal fluctuations. For all airports, the analysis showed that these are series with periodic fluctuations. Their amplitude increases with time, which indicates multiplicative properties. The real-world data show a development trend with seasonality; therefore, an exponential trend function was determined for each airport (Table 2). The parameters of all the models set out in the table are statistically significant at the level of significance α = 0.05 .
The tables contain numbers rounded to 2 significant figures.
After separating the trend function, the seasonality indicators for individual airports were determined (Table 3). In all cases, it was necessary to determine a correction factor.
As can be seen in Table 3, the largest increases in the number of passengers were seen in the second and third quarters. This is due to the summer holidays in Poland.
Based on the above seasonality indicators, forecasts of the number of passengers at airports for individual quarters of the year 2020 were determined (Table 4). Notably, all forecast results obtained in the study have been rounded to nearest 1000 persons.
Another method used to build forecasts is the method of trends of the same-name periods. Table 5 presents the estimated trend models for individual periods with their adjustment to the real-world data.
Based on the above models, forecasts for individual quarters of the year 2020 have been determined (Table 6).
The third method that has been used to forecast passenger flows at airports is the linear trend method with seasonality. Table 7 presents the estimated functions with the parameters of their adjustment to the real-world data.
Based on the above models, forecasts for individual quarters of the year 2020 have been determined (Table 8).
As the forecast values generated using each of the methods have different values, they were averaged (Table 9). The table has been completed with the average passenger charge charged by airports.
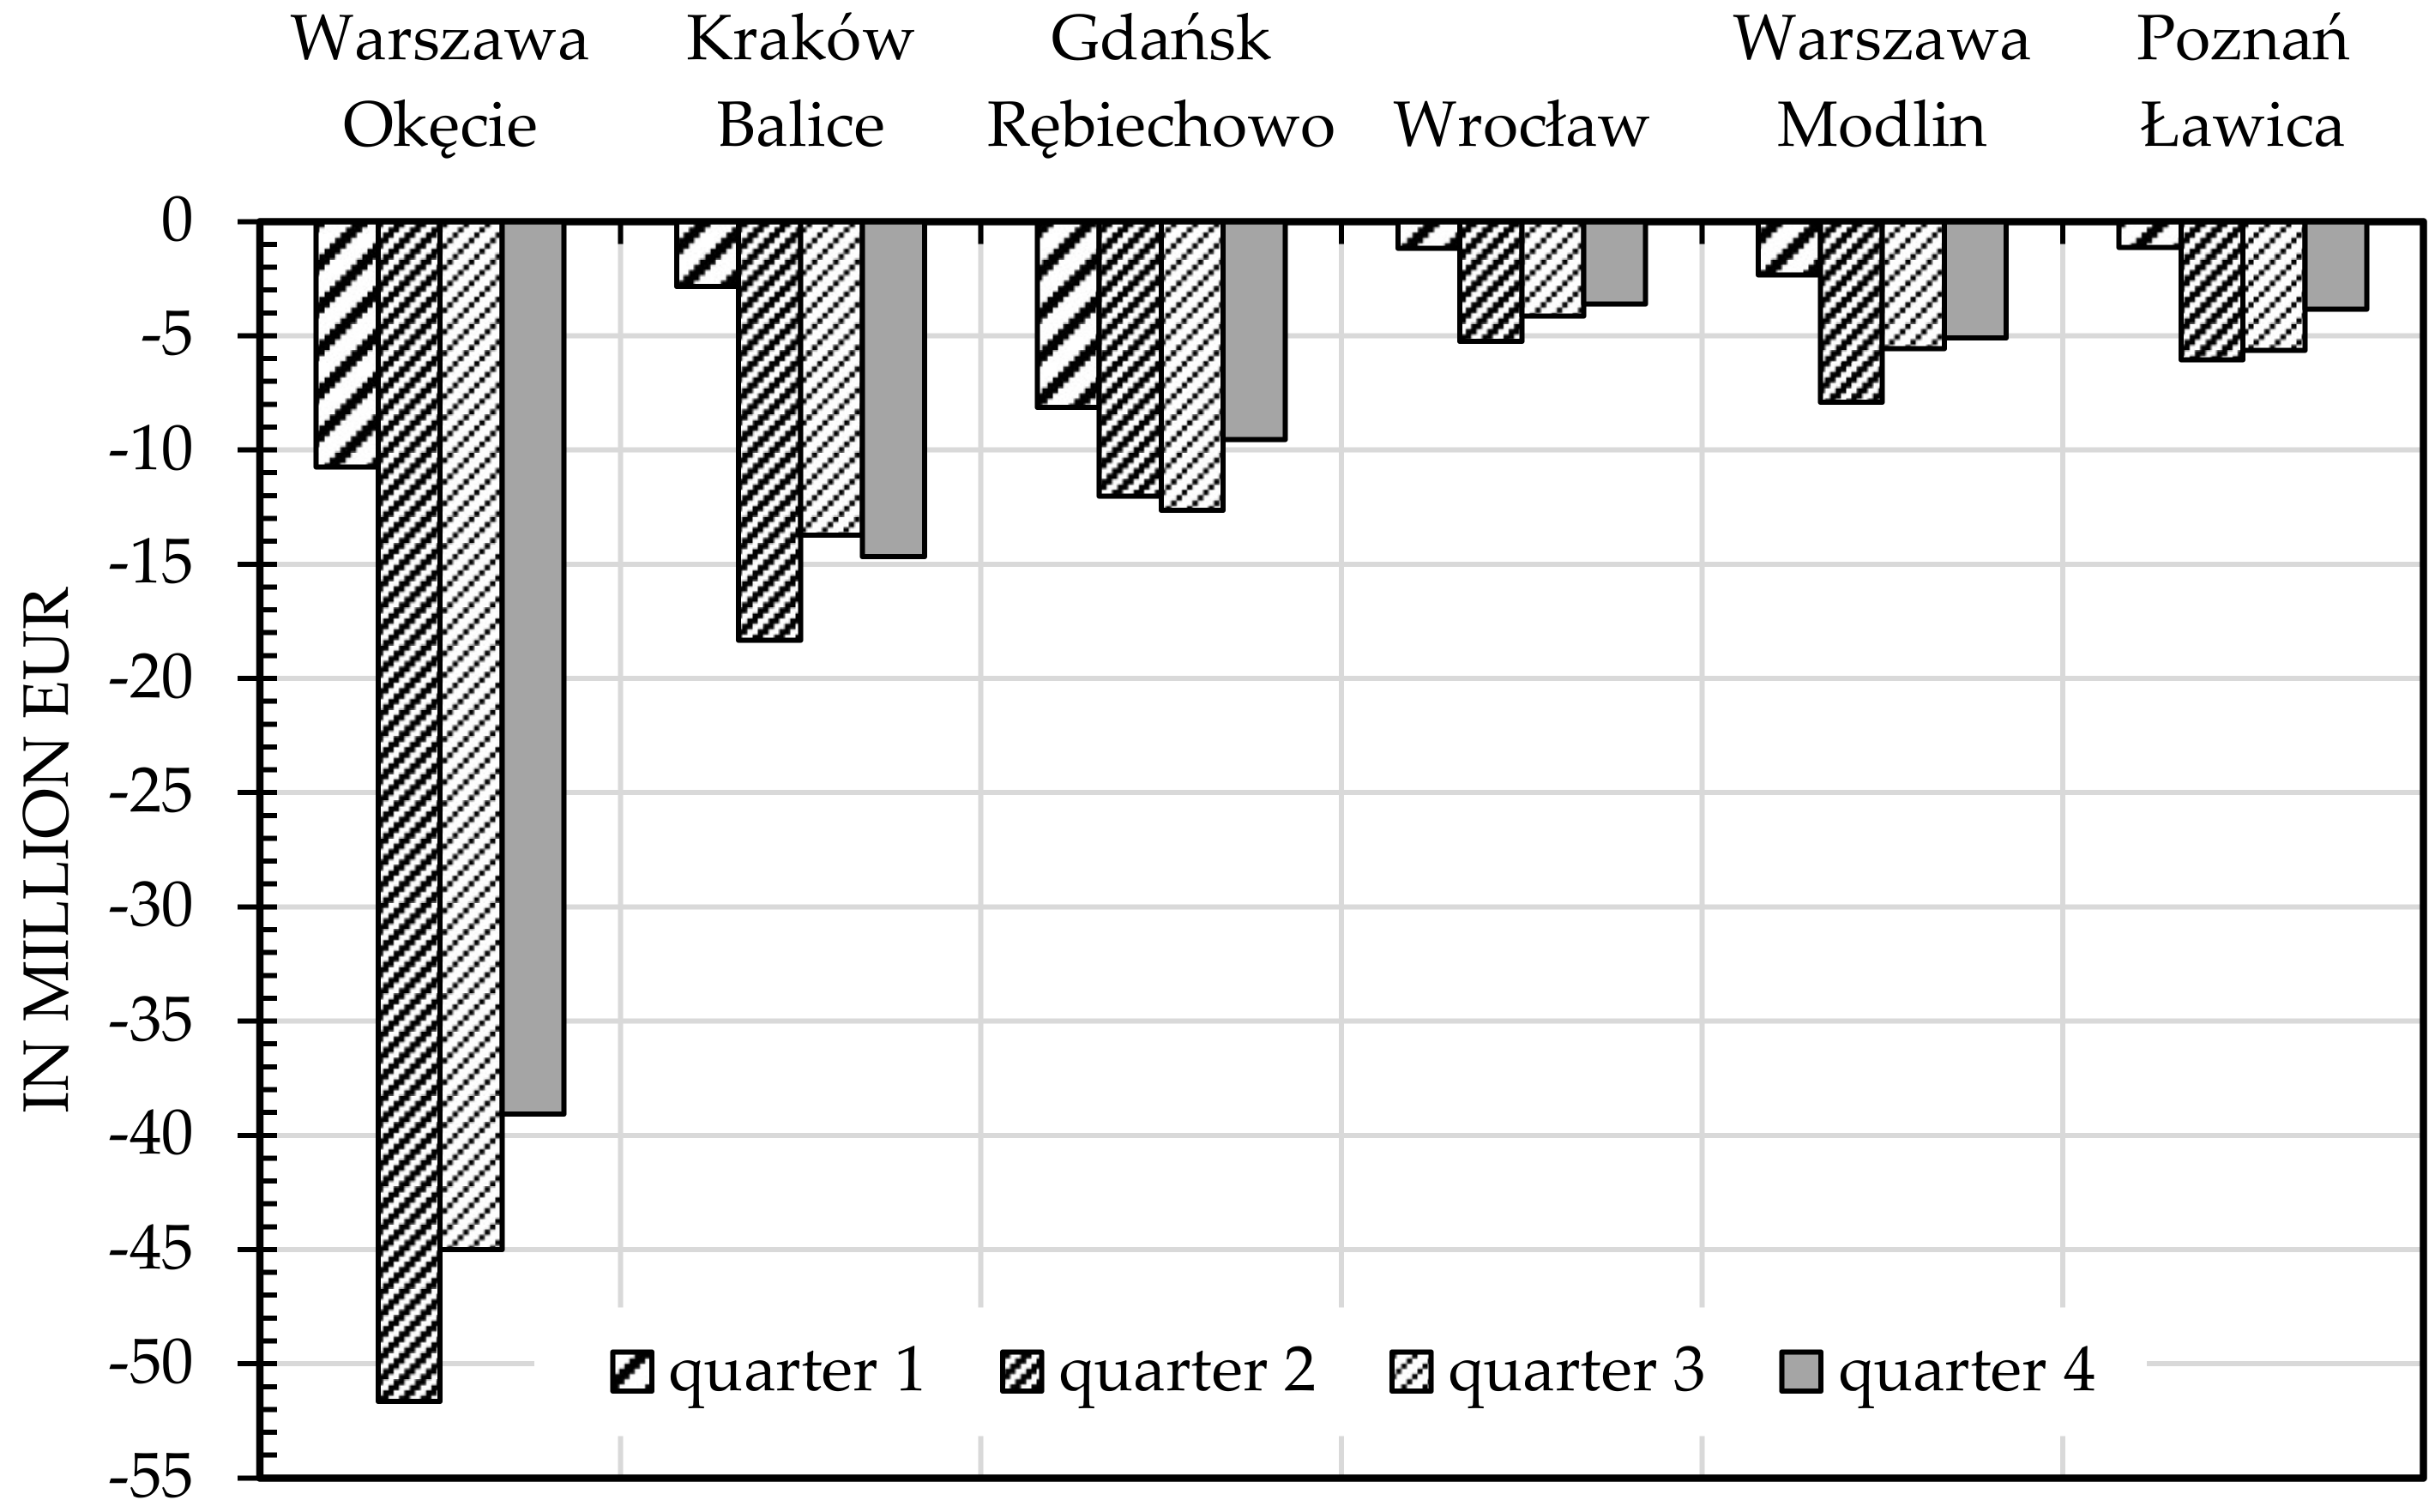
Average losses by airports in individual quarters of 2020 are presented in 
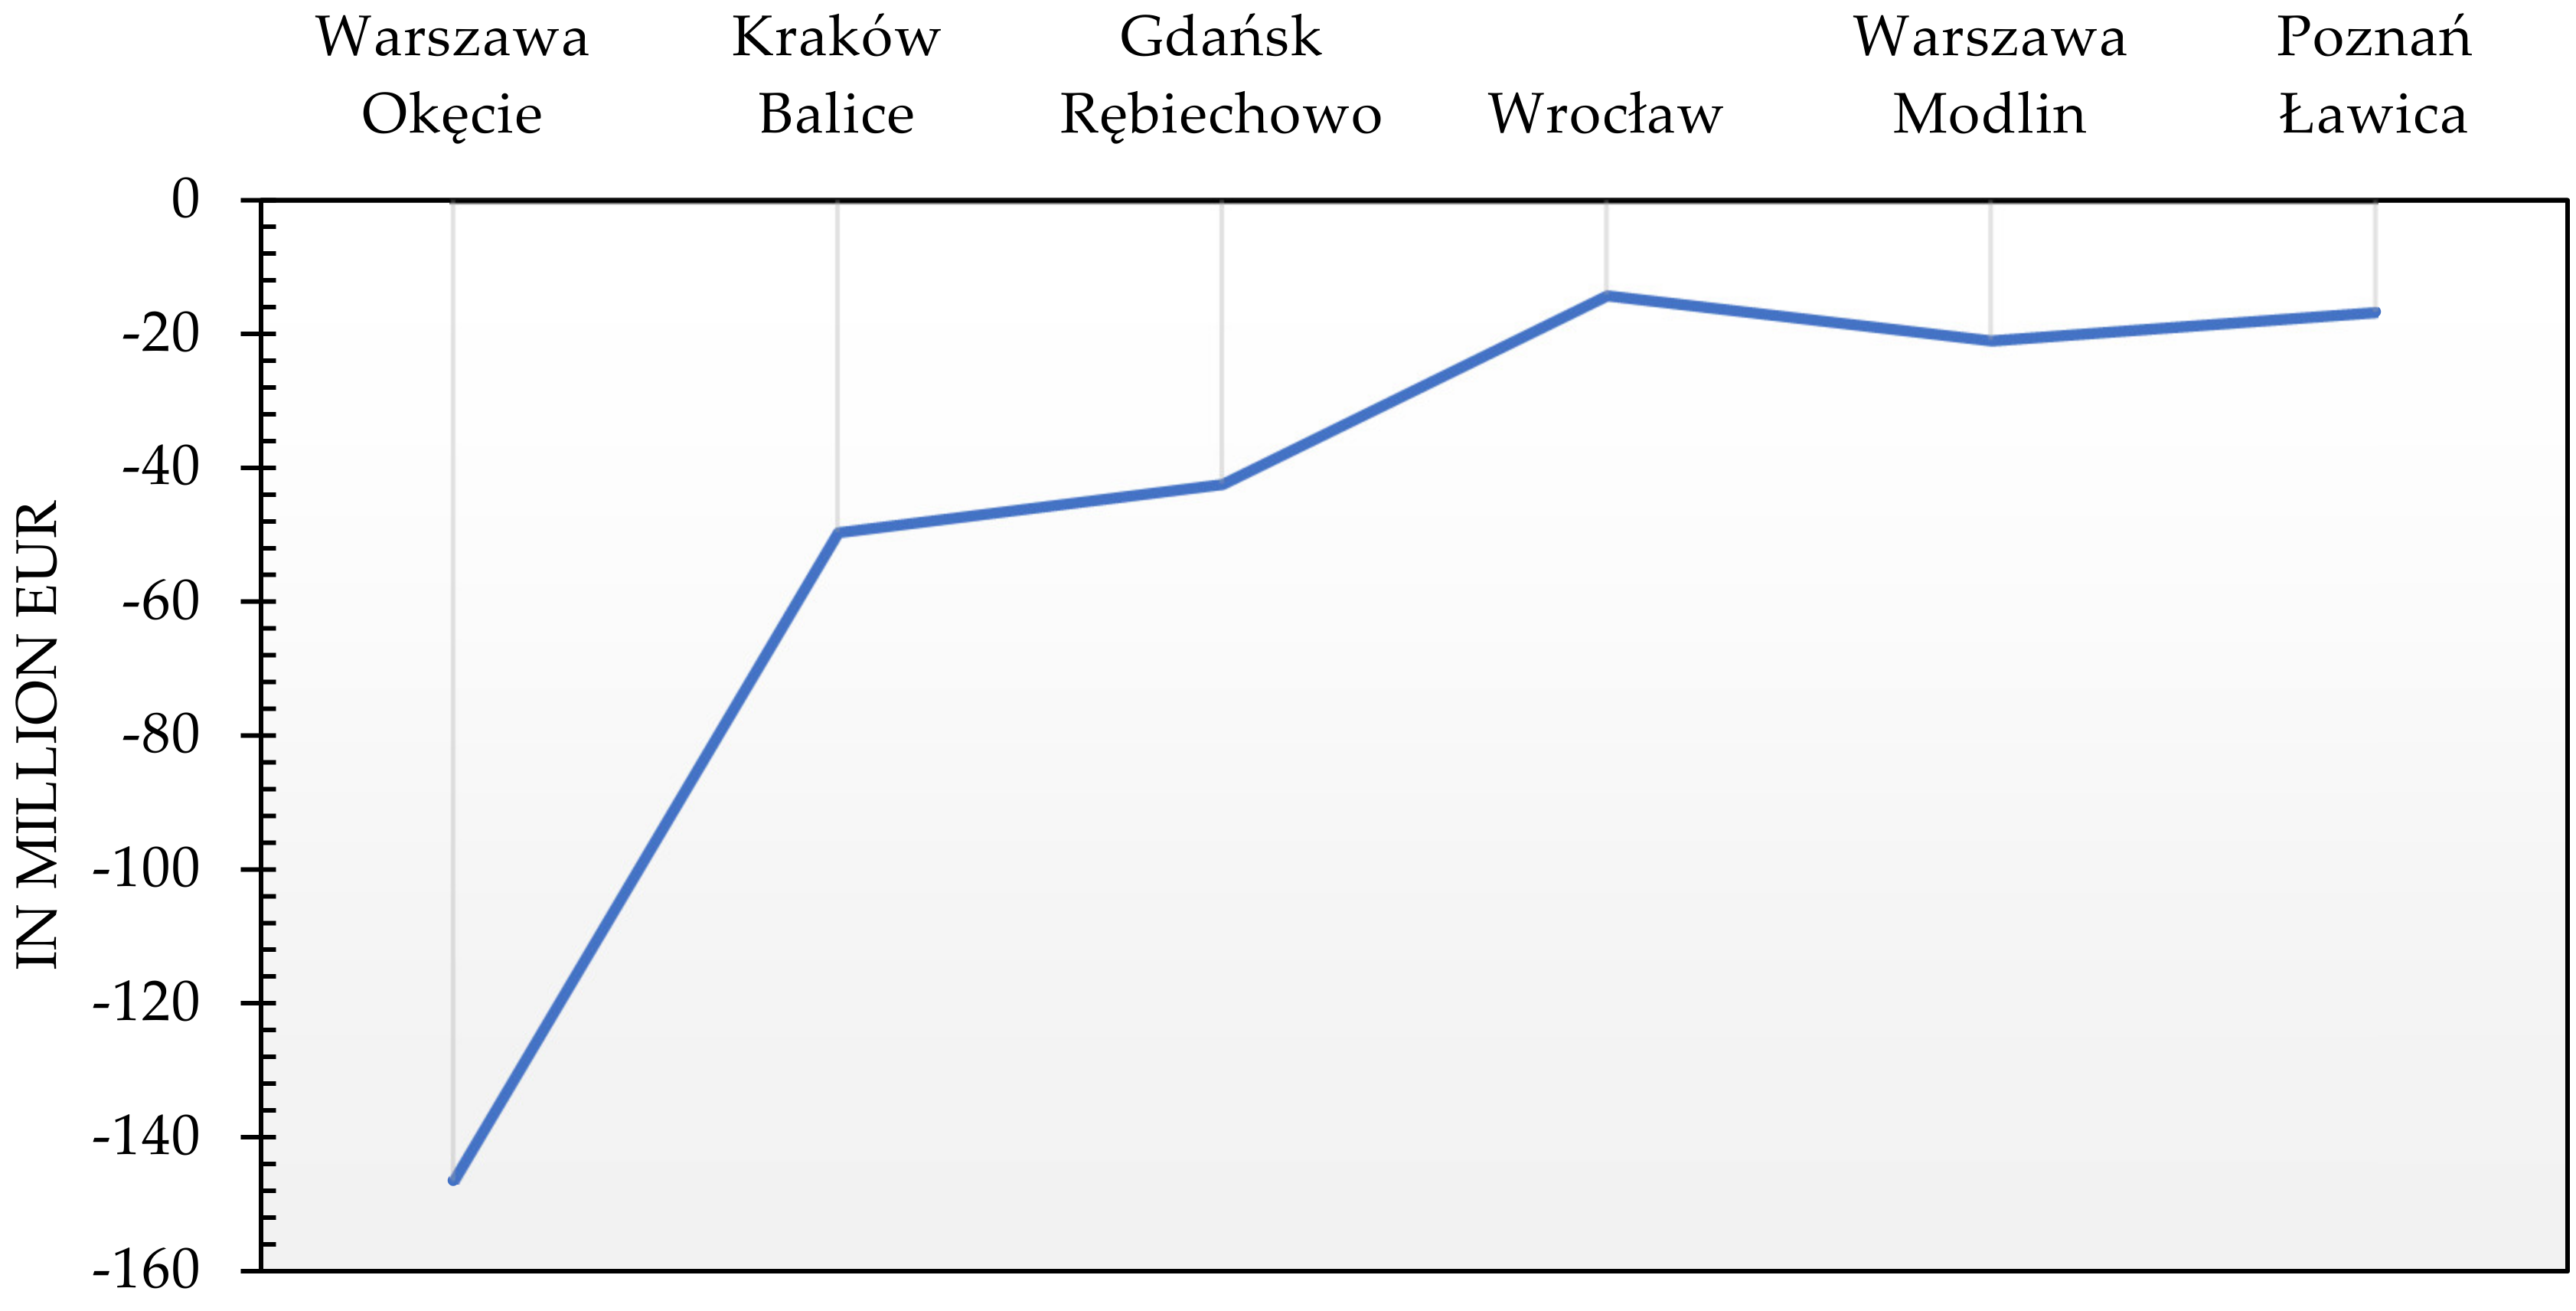
Figure 8, while the estimated annual losses are presented in Figure 9.
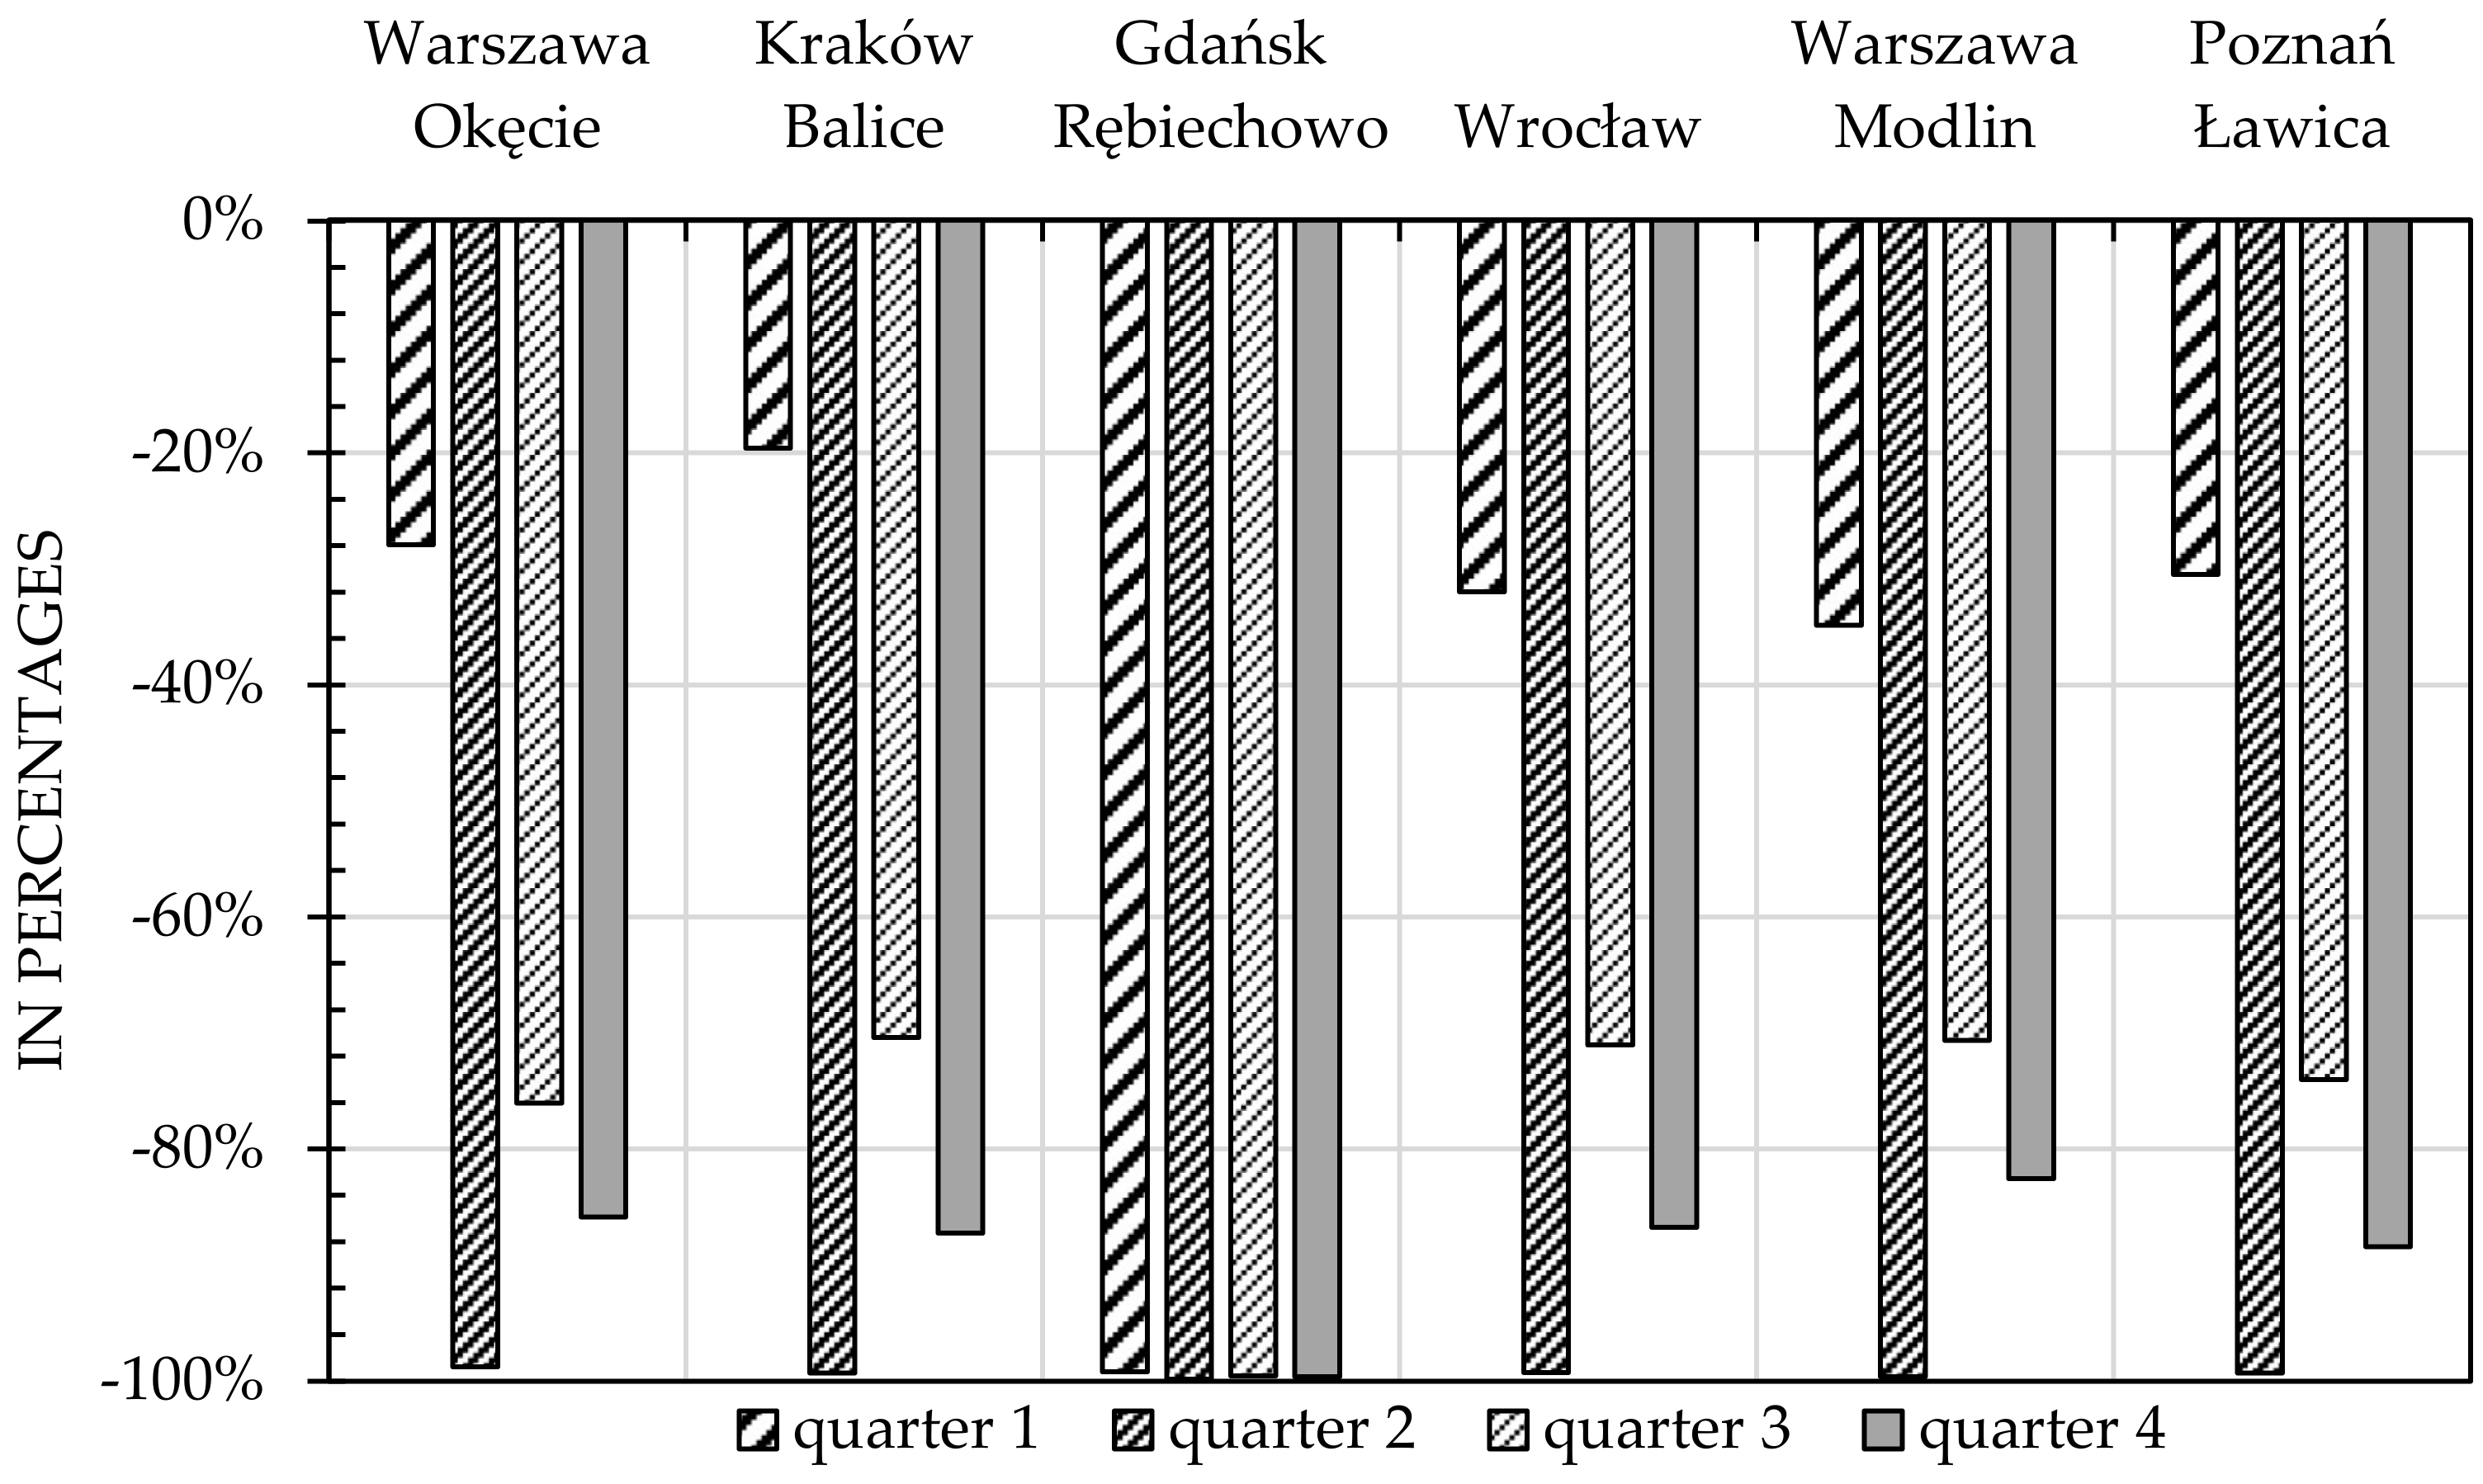
The smallest losses of airports were recorded in the first quarters due to the fact that the airports basically operated until mid-March 2020 without any obstacles. The biggest losses are noticeable in the second quarter (excluding Gdańsk Rębiechowo) and in the third quarter (excluding Kraków Balice).
In order to better illustrate the magnitude of losses, Figure 10 presents the losses in the form of percentage differences.
Both in quarterly and annual terms, the greatest losses were recorded by Warsaw Okęcie Airport, as it serves the largest passenger flow in air transport in Poland. On an annual basis, this loss was estimated at EUR 146.46 million. The lowest losses on an annual basis were estimated for the Wrocław Airport—EUR 14.17 million.

4. Conclusions

In 2020, Polish airports handled 14.5 million passengers, which is a 70% decrease compared to the previous year. The last time so few passengers were handled per year was 15 years ago [40]. The pandemic had the biggest impact on the results in the first and second quarters of 2020. However, despite the lifting of the ban on travel by air, passenger traffic recorded a slight recovery only in the summer. The next wave of the pandemic that began in October 2020 significantly reduced the interest in travel by air transport.
The main factors causing the slow recovery in air transport are travel restrictions, the lack of predictability of the restrictions (constant changes regarding, for example, the need to undergo quarantine), and the lack of international cooperation in determining the restrictions, as well as the travelers’ fear of getting sick.
The research results indicate that the examined airports lost about EUR 290 million due to the COVID-19 pandemic alone. Of note, in addition to losses resulting from the lack of passenger service charges, airports have lost revenue from non-airport activities. It is estimated that they account for approximately 40–60% of the airport’s revenues.

Funding

This research received no external funding.

Institutional Review Board Statement

Not applicable.

Informed Consent Statement

Not applicable.

Data Availability Statement

Not applicable.

Conflicts of Interest

The author declares no conflict of interest.

References

  1. World Health Organization. WHO Director-General’s Opening Remarks at the Media Briefing on COVID-19. 2020. Available online: https://www.who.int/dg/speeches/detail/who-director-general-s-opening-remarks-at-the-mission-briefing-on-covid-19-13-march (accessed on 30 November 2020).
  2. Sun, X.; Wandelt, S.; Zhang, A. How did COVID-19 impact air transportation? A first peek through the lens of complex networks. J. Air Transp. Manag. 2020, 89, 101928. [Google Scholar] [CrossRef]
  3. Chinazzi, M.; Davis, J.; Ajelli, M.; Gioannini, C.; Litvinova, M.; Merler, S.; Pastore y Piontti, A.; Mu, K.; Rossi, L.; Sun, K.; et al. The effect of travel restrictions on the spread of the 2019 novel coronavirus (COVID-19) outbreak. Science 2020, 368, 6489. [Google Scholar] [CrossRef] [Green Version]
  4. Yang, Y.; Zhang, H.; Chen, X. Coronavirus pandemic and tourism: Dynamic stochastic general equilibrium modeling of infectious disease outbreak. Ann. Tour. Res. 2020, 83, 102913. [Google Scholar] [CrossRef] [PubMed]
  5. O Szczególnych RozwiąZaniach ZwiąZanych Z Zapobieganiem, PrzeciwdziałAniem I Zwalczaniem COVID-19, Innych Chorób ZakaźNych Oraz WywołAnych Nimi Sytuacji Kryzysowych, Dz.U poz. 374. 2020. Available online: http://isap.sejm.gov.pl/isap.nsf/download.xsp/WDU20200000374/U/D20200374Lj.pdf (accessed on 15 June 2021).
  6. Minął Miesiąc od Pierwszego Potwierdzonego Przypadku COVID-19 w Polsce. Co się Przez Ten Czas Wydarzyło? Available online: https://www.medonet.pl/koronawirus/koronawirus-w-polsce,minal-miesiac-od-pierwszego-potwierdzonego-przypadku-covid-19-w-polsce--co-sie-przez-ten-czas-wydarzylo-,artykul,29387875.html (accessed on 15 June 2021).
  7. Puste Lotniska, Odwołane Rejsy. Pandemia Pogrążyła Transport Lotniczy. Available online: https://forsal.pl/transport/artykuly/8165238,transport-lotniczy-wplyw-pandemii-liczba-lotow-ruch-na-lotniskach-2021.html (accessed on 15 June 2021).
  8. Statystyki i Analizy Rynku Transportu Lotniczego. Available online: https://ulc.gov.pl/_download/regulacja_rynku/statystyki/4kw2020/wg_portow_lotniczych_4kw2020.pdf (accessed on 15 June 2021).
  9. International Civil Aviation Organization (ICAO). Effects of Novel Coronavirus (COVID-19) on Civil Aviation: Economic Impact Analysis Air Transport Bureau Contents. Available online: https://www.icao.int/sustainability/Documents/COVID-19/ICAO_Coronavirus_Econ_Impact.pdf (accessed on 27 August 2021).
  10. Maneenopa, S.; Kotcharin, S. The impacts of COVID-19 on the global airline industry: An event study approach. J. Air Transp. Manag. 2020, 89, 101920. [Google Scholar] [CrossRef] [PubMed]
  11. Arena, M.; Aprea, C. Impact of Covid-19 Pandemic on Air Transport: Overview and Implications. Adv. Environ. Eng. Res. 2021, 2. [Google Scholar] [CrossRef]
  12. Sun, X.; Wandelt, S.; Zheng, C.; Zhang, A. COVID-19 pandemic and air transportation: Successfully navigating the paper hurricane. J. Air Transp. Manag. 2021, 94, 102062. [Google Scholar] [CrossRef]
  13. Warnock-Smith, D.; Graham, A.; O’Connell, J.F.; Efthymiou, M. Impact of COVID-19 on air transport passenger markets: Examining evidence from the Chinese market. J. Air Transp. Manag. 2021, 94, 102085. [Google Scholar] [CrossRef] [PubMed]
  14. Wolle, B. Stochastic modelling of air passenger volume during the COVID-19 pandemic and its financial impact on German airports. Inst. Für Integr. Nat. (IfIN) Tech. Rep. 2021. [Google Scholar] [CrossRef]
  15. Blišťanová, M.; Tirpáková, M.; Brůnová, Ľ. Overview of Safety Measures at Selected Airports during the COVID-19 Pandemic. Sustainability 2021, 13, 8499. [Google Scholar] [CrossRef]
  16. Hassan, T.H.; Salem, A.E. The Importance of Safety and Security Measures at Sharm El Sheikh Airport and Their Impact on Travel Decisions after Restarting Aviation during the COVID-19 Outbreak. Sustainability 2021, 13, 5216. [Google Scholar] [CrossRef]
  17. Nižetić, S. Impact of coronavirus (COVID-19) pandemic on air transport mobility, energy, and environment. A case study. Int. J. Energy Res. 2020, 44, 10953–10961. [Google Scholar] [CrossRef]
  18. Jiménez-Crisóstomo, A.; Rubio-Andrada, L.; Celemín-Pedroche, M.S.; Escat-Cortés, M. The Constrained Air Transport Energy Paradigm in 2021. Sustainability 2021, 13, 2830. [Google Scholar] [CrossRef]
  19. Christidis, P.; Christodoulou, A. The Predictive Capacity of Air Travel Patterns during the Global Spread of the COVID-19 Pandemic: Risk, Uncertainty and Randomness. Int. J. Environ. Res. Public Health 2020, 17, 3356. [Google Scholar] [CrossRef]
  20. Song, K.-H.; Choi, S. A Study on the Behavioral Change of Passengers on Sustinable Air Transport after COVID-19. Sustainability 2020, 12, 9207. [Google Scholar] [CrossRef]
  21. Song, K.-H.; Choi, S. A Study on the Perception Change of Passengers on Sustainable Air Transport Following COVID-19 Progress. Sustainability 2021, 13, 8056. [Google Scholar] [CrossRef]
  22. Graham, A.; Kremarik, F.; Kruse, W. Attitudes of Ageing Passengers to Air Travel Since the Coronavirus Pandemic. J. Air Transp. Manag. 2020, 87, 101865. [Google Scholar] [CrossRef] [PubMed]
  23. Bartle, J.R.; Lutte, R.K.; Leuenberger, D.Z. Sustainability and Air Freight Transportation: Lessons from the Global Pandemic. Sustainability 2021, 13, 3738. [Google Scholar] [CrossRef]
  24. Choi, J.H.; Park, Y.H. Investigating Paradigm Shift from Price to Value in the Air Cargo Market. Sustainability 2020, 12, 10202. [Google Scholar] [CrossRef]
  25. Nhamo, G.; Dube, K.; Chikodzi, D. Impact of COVID-19 on the Global Network of Airports; Springer International Publishing: Cham, Switzerland, 2020; pp. 109–133. [Google Scholar]
  26. Li, T. A swot analysis of China’s air cargo sector in the context of covid-19 pandemic. J. Air Transport. Manag. 2020, 88, 101875. [Google Scholar] [CrossRef] [PubMed]
  27. Bombelli, A. Intrators’ global networks: A topology analysis with insights into the effect of the COVID-19 pandemic. J. Transport Geogr. 2020, 87, 102815. [Google Scholar] [CrossRef] [PubMed]
  28. Abate, M.; Christidis, P.; Purwanto, A.J. Government support to airlines in the aftermath of the COVID-19 pandemic. J. Air Transport. Manag. 2020, 89, 101931. [Google Scholar] [CrossRef] [PubMed]
  29. Gallego, I.; Font, X. Changes in air passenger demand as a result of the COVID-19 crisis: Using Big Data to inform tourism policy. J. Sustain. Tourism 2020, 29, 1470–1489. [Google Scholar] [CrossRef]
  30. Gudmundsson, S.V.; Cattaneo, M.; Redondi, R. Forecasting Recovery Time in Air Transport Markets in the Presence of Large Economic Shocks: COVID-19. SSRN Electron. J. 2020, 3623040. [Google Scholar] [CrossRef]
  31. Barczak, A. Pomiar wahań sezonowych ruchu pasażerskiego na przykładzie Portu Lotniczego Gdańsk. Folia Pomeranae Univ. Technol. Stetinensis. Oeconomica 2015, 321, 3. [Google Scholar]
  32. Sobczyk, M. Statystyka, Aspekty Praktyczne i Teoretyczne; Wydaw; UMCS: Lublin, Poland, 2006; pp. 231–232. [Google Scholar]
  33. Krzysztofiak, M.; Urbanek, D. Metody Statystyczne; PWN: Warszawa, Poland, 1981; pp. 393–394. [Google Scholar]
  34. Jóźwiak, J.; Podgórski, J. Statystyka od Podstaw; PWE: Warszawa, Poland, 2009; pp. 441–442. [Google Scholar]
  35. Barczak, A. Metoda trendów jednoimiennych okresów jako narzędzie prognozowania ruchu pasażerskiego na przykładzie Portu Lotniczego Gdańsk. In Wybrane Zagadnienia Logistyki Stosowanej; Feliks, J., Ed.; AGH University of Science and Technology Publisher: Cracow, Poland, 2016; pp. 13–24. [Google Scholar]
  36. Zeliaś, A.; Pawełek, B.; Wanat, S. Prognozowanie Ekonomiczne. Teoria, Przykłady, Zadania; PWN: Warszawa, Poland, 2003; p. 88. [Google Scholar]
  37. Jędrzejczyk, Z. Predykcja na podstawie modeli jednorównaniowych. In Wprowadzenie do Ekonometrii w Przykładach i Zadaniach; Kukuła, K., Ed.; PWN: Warszawa, Poland, 2004; p. 136. [Google Scholar]
  38. Barczak, A. Models of time series with seasonal fluctuations in the forecasting of passenger traffic in air transport based on the study of Wrocław Airport. Transp. Econ. Logist. 2018, 80, 18–19. [Google Scholar] [CrossRef]
  39. Pawłowski, Z. Ekonometria; PWN: Warszawa, Poland, 1966; p. 161. [Google Scholar]
  40. Przewozy PasażErskie W Transporcie Lotniczym. Available online: https://www.ulc.gov.pl/pl/aktualnosci/5632-przewozy-pasazerskie-w-transporcie-lotniczym-w-2020-roku. (accessed on 27 August 2021).
Figure 1. Number of passengers at Warsaw Okęcie Airport.
Aerospace 08 00353 g001
Figure 2. Number of passengers at Kraków Balice Airport.
Aerospace 08 00353 g002
Figure 3. Number of passengers at Gdańsk Rębiechowo Airport.
Aerospace 08 00353 g003
Figure 4. Number of passengers at Wrocław Airport.
Aerospace 08 00353 g004
Figure 5. Number of passengers at the Warsaw Modlin Airport.
Aerospace 08 00353 g005
Figure 6. Number of passengers at Poznań Ławica Airport.
Aerospace 08 00353 g006
Figure 7. Research methodology diagram.
Aerospace 08 00353 g007
Figure 8. Average quarterly losses in millions of EUR.
Aerospace 08 00353 g008
Figure 9. Average annual losses in millions of EUR.
Aerospace 08 00353 g009
Figure 10. Average annual losses in percentage.
Aerospace 08 00353 g010
Table 1. The dynamics of changes in the number of passengers year to year.
Airport2020/20182020/2019
Warszawa Okęcie−69.1%−71.0%
Kraków Balice−61.7%−69.2%
Gdańsk Rębiechowo−65.8%−68.3%
Wrocław−69.5%−71.7%
Warszawa Modlin−71.7%−71.9%
Poznań Ławica−73.5%−72.5%
Table 2. Estimated functions of trends.
AirportTrend Function
Warszawa Okęcie y ^ t = 2,500,000 e 0.036 t
Kraków Balice y ^ t = 920,000 e 0.044 t
Gdańsk Rębiechowo y ^ t = 840,000 e 0.026 t
Wrocław y ^ t = 495,000 e 0.032 t
Warszawa Modlin y ^ t = 640,000 e 0.011 t
Poznań Ławica y ^ t = 320,000 e 0.035 t
The tables contain numbers rounded to 2 significant figures.
Table 3. Seasonality indicators.
AirportSeasonality Indicator
Quarter IQuarter IIQuarter IIIQuarter IV
Warszawa Okęcie−19.31%5.72%24.85%−11.26%
Kraków Balice−15.00%8.80%12.51%−6.31%
Gdańsk Rębiechowo−19.96%7.91%23.88%−11.84%
Wrocław−19.48%7.51%26.04%−14.07%
Warszawa Modlin−9.52%8.86%7.42%−6.76%
Poznań Ławica−29.01%9.27%45.08%−25.33%
Table 4. Forecasts for individual quarters of the year 2020—the method of seasonality indicators.
AirportForecasts
Quarter IQuarter IIQuarter IIIQuarter IV
Warszawa Okęcie4,353,0005,915,0006,985,0005,149,000
Kraków Balice1,953,0002,611,0002,700,0002,349,000
Gdańsk Rębiechowo1,157,0001,600,0001,837,0001,342,000
Wrocław775,0001,068,0001,252,000881,000
Warszawa Modlin738,0008,98,000886,000778,000
Poznań Ławica471,000751,000997,000531,000
Table 5. Trend models for homonymous periods.
PeriodTrend ModelCoefficient of Determination R 2 Coefficient of Variation V s
Warszawa Okęcie
Quarter I y ^ t = 416,679.9 t + 1,664,496.3 0.974.03%
Quarter II y ^ t = 509,752.0 t + 2,415,086.8 0.983.03%
Quarter III y ^ t = 594,746.8 t + 3,040,622.2 0.944.91%
Quarter IV y ^ t = 504,589.4 t + 2,061,329.6 0.982.78%
Kraków Balice
Quarter I y ^ t = 204,772.9 t + 584,964.5 0.992.42%
Quarter II y ^ t = 250,264.8 t + 844,179.2 0.983.87%
Quarter III y ^ t = 274,088.3 t + 901,294.1 0.946.63%
Quarter IV y ^ t = 288,214.3 t + 652,555.1 0.984.73%
Gdańsk Rębiechowo
Quarter I y ^ t = 79,094.1 t + 630,720.7 0.972.68%
Quarter II y ^ t = 129,263.5 t + 817,104.7 0.991.72%
Quarter III y ^ t = 12,2691.3 t + 1,045,236.3 0.962.97%
Quarter IV y ^ t = 101,654.8 t + 729,699.2 0.982.08%
Wrocław
Quarter I y ^ t = 64,876.3 t + 352,316.7 0.973.07%
Quarter II y ^ t = 96,687.9 t + 465,450.3 0.954.82%
Quarter III y ^ t = 116,878.1 t + 563,643.7 0.935.39%
Quarter IV y ^ t = 68,626.8 t + 434,196.2 0.982.53%
Warszawa Modlin
Quarter I y ^ t = 42,164.2 t + 522,463 0.726.38%
Quarter II y ^ t = 36,016.4 t + 680,260.4 0.990.78%
Quarter III y ^ t = 35,055.7 t + 681,557.3 0.931.99%
Quarter IV y ^ t = 11 , 912.7 t + 653,263.5 0.564.58%
Poznań Ławica
Quarter I y ^ t = 36,442.7 t + 219,679.1 0.876.82%
Quarter II y ^ t = 63,787.7 t + 334,258.5 0.7810.10%
Quarter III y ^ t = 98,172.9 t + 431,492.5 0.8110.25%
Quarter IV y ^ t = 58,191.7 t + 214,140.9 0.946.13%
Table 6. Forecasts for individual quarters of the year 2020—the one-name period trend method.
AirportForecasts
Quarter IQuarter IIQuarter IIIQuarter IV
Warszawa Okęcie4,165,0005,474,0006,609,0005,089,000
Kraków Balice1,814,0002,346,0002,546,0002,382,000
Gdańsk Rębiechowo1,105,0001,593,0001,781,0001,340,000
Wrocław742,0001,046,0001,265,000846,000
Warszawa Modlin775,000896,000892,000725,000
Poznań Ławica438,000717,0001,021,000563,000
Table 7. Trend models with seasonality.
AirportTrend Model R 2 V s
Warszawa Okęcie y ^ t = 2,678,237.74 + 126,610.51 t 903,196.29 Q 1 + 771,753.012 Q 2 + 753,909.29 Q 3 622,466.012 Q 4 0.973.23%
Kraków Balice y ^ t = 754,192.78 + 63,583.77 t 127,163.49 Q 1 + 204,943.14 Q 2 + 269,944.77 Q 3 347,724.41 Q 4 0.964.05%
Gdańsk Rębiechowo y ^ t = 934,455.39 + 27,043.98 t 309,848.22 Q 1 + 352,796.76 Q 2 + 181,371.019 Q 3 224,319.56 Q 4 0.982.50%
Wrocław y ^ t = 538,595.81 + 21,691.82 t 186,876.58 Q 1 + 208,625.44 Q 2 + 137,072.18 Q 3 158,821.038 Q 4 0.954.06%
Warszawa Modlin y ^ t = 595,139.85 + 7821.81 t 16,580.56 Q 1 + 114,951.63 Q 2 + 105,544.61 Q 3 203,915.68 Q 4 0.873.04%
Poznań Ławica y ^ t = 365,249.73 + 16,037.19 t 180,577.21 Q 1 + 165,204.78 Q 2 + 184,352.41 Q 3 168,979.98 Q 4 0.927.49%
where R 2 —Coefficient of determination, V s —Coefficient of variation.
Table 8. Forecasts for individual quarters of the year 2020—the linear trend method with seasonality.
AirportForecasts
Quarter IQuarter IIQuarter IIIQuarter IV
Warszawa Okęcie4,434,0006,235,0006,344,0005,094,000
Kraków Balice1,962,0002,358,0002,487,0001,932,000
Gdańsk Rębiechowo1,193,0001,882,0001,738,0001,359,000
Wrocław807,0001,224,0001,175,000900,000
Warszawa Modlin743,000882,000881,000579,000
Poznań Ławica521,000883,000918,000581,000
Table 9. Average values of forecasts for individual quarters of 2020 with the average amount of charges per passenger (in EUR).
AirportAverage ForecastAverage Fare Per Passenger
(EUR)
Quarter IQuarter IIQuarter IIIQuarter IV
Warszawa Okęcie4,317,0005,875,0006,646,0005,111,0008.89
Kraków Balice1,909,0002,438,0002,577,0002,221,0007.56
Gdańsk Rębiechowo1,151,0001,692,0001,785,0001,347,0007.11
Wrocław775,0001,113,0001,230,000876,0004.74
Warszawa Modlin752,000892,000886,000694,0008.89
Poznań Ławica477,000784,000979,000559,0007.78
Publisher’s Note: MDPI stays neutral with regard to jurisdictional claims in published maps and institutional affiliations.

