Article

Effect of Joint Clearance on Landing Gear Retraction Failure

1
Aero Technology Research Institute, Republic of Korean Air Force (ROKAF), Daegu 41052, Korea
2
Department of Defense Science, Korea National Defense University, Nonsan 33021, Korea
*
Author to whom correspondence should be addressed.
Aerospace 2021, 8(11), 329; https://doi.org/10.3390/aerospace8110329
Submission received: 17 September 2021 / Revised: 29 October 2021 / Accepted: 29 October 2021 / Published: 2 November 2021

Abstract

:
A simple method of investigating the effect of joint clearances on landing gear retraction failure is presented and applied to the main landing gear with a single sidestay and a hydraulic actuator. A geometric model is presented with assumptions of each link as a rigid body and their relative positions geometrically determined by considering the size of the clearances. We conducted a sensitivity analysis based on a geometric model of the main landing gear. The model was calibrated using the data from the technical order. A Monte Carlo simulation (MCS) was conducted, and whose input was the distance of each clearance based on the experimental design that combined the modified Latin hypercube sampling (LHS) and central composite design (CCD). As a result, we were able to find that the joint had a high potential to operate abnormally. We validated the model by using the actual failure data. Finally, the physical meaning of the sensitivity analysis results was interpreted by comparing them with the values obtained through an amplification index method that is a modified linearization method.

1. Introduction

Structures that move in a predetermined and controlled manner are mechanisms [1]. One important example is an aircraft’s landing gear, having a retraction function. The landing gear needs to be stored in a small space and therefore has a complex mechanism with nonlinear movement [2]. The links of the landing gear need to be arranged into a specific position for each cycle of the retraction and extension processes. The retraction and extension processes are conducted by hydraulic power, and single or multiple valves control the oil path. The arrangement of the links determines the position of the valve plunger. If the links are not arranged in their proper positions due to errors in the joints connecting the links, an abnormal operation can occur, and the landing gear can fail to retract.
The absolute errors of landing gears are both geometric and non-geometric [3,4,5,6,7]. A geometric error may result from imprecise manufacturing and degradation of the landing gear links and joints or the deviation of the encoder offsets. Increased joint clearance due to wear is likely for systems showing typical wear-out behavior (increasing failure rate as operation time increases.) Non-geometric errors are the non-ideal motion of joints and deflections of the structure and joints due to external loading, gravity, backlash, etc. In robot manipulators, the geometric errors are the most influential rather than the non-geometric errors [8,9,10].
The study of the effect of joint clearance or tolerance on the position and orientation deviation of linkages and manipulators attracts many researchers [10,11,12,13,14,15]. The joint clearance is the difference between the centers of the pin and the hole at the joint. Positional deviation due to the magnitude and direction of a clearance vector is random and difficult to predict [10]. The joint clearance is conveniently modeled as a virtual link and there are two ways to handle the virtual link. Firstly, the virtual link has a deterministic length in the radial direction, and it can rotate to certain angles with an assumed distribution in the circumferential directions [13]. Secondly, the virtual link is in a particular circumferential direction determined by external loading [14]. In the current study, we used the virtual link differently. The circumferential direction to maximize the probability of failure was selected sequentially from the most remotely located joint to the nearest joint. One reason for this is that the target of this study is complex, and there is difficulty in making an accurate determination of the direction of the virtual link considering the complex loads and interlocking state. In addition, only the worst case is needed to draw appropriate recommendations. By doing so, we could identify the worst case of a complex system.
This paper identifies important joints that affect the retraction cycle of the landing gear through a sensitivity analysis. We have developed a direct geometric model that represents the movements of the landing gear mechanism for this sensitivity analysis. We calibrated the model so that the variables identified in the technical order for each retraction cycle of the landing gear can be realized, i.e., the plunger moves as described in the technical order as a result of calibration. We obtained a sensitivity index by conducting an MCS using the calibrated model. We validated the model by comparing it to an actual in-service failure. Finally, we verified the physical meaning of the results from our sensitivity analysis by comparing the values obtained using an amplification index method that is a modified linearization method [16].

2. Backgrounds

2.1. Target System and Retraction/Extension Cycles

The target system in this study is the main landing gear of a Hawker 800XP aircraft. Figure 1 and Figure 2 show the structure for the main landing gear of a Hawker 800XP aircraft. Since the 2000s, the interval for retraction failure in the Hawker 800XP fleet operated by the Republic of Korea Air Force (ROKAF) has become shorter because of the short air-ground cycle period and complex working conditions. When a retraction failure occurs, for safety reasons the affected aircraft extends its landing gear and aborts the mission. Therefore, this fault seriously affects aircraft operations. For the Hawker 800XP aircraft, the retraction and extension cycles of the landing gear are controlled by a single reversing valve. The displacement of the valve has a non-linear movement, and the links connecting the landing gear are designed to provide a specific displacement to the plunger during retraction and extension cycles. The retraction reliability can be affected in two aspects [2]. One is the mechanism, including friction, abrasion, clamping stagnation, and aerodynamic force. The other is the hydraulics, including the damping orifice, oil leak, air content of oil, and the actuator friction. Troubleshooting by line maintenance personnel was carried out and it was assumed that the clearances in the main components of the landing gear caused the failure, possibly due to wear or a maintenance error, for example. The problem was that the root cause was not readily identified despite a large amount of time spent on troubleshooting.
Figure 2 shows the retraction cycle schematically. By extending the retraction actuator, the lower sidestay rotates almost 300° to retract the main landing gear. There are four steps as described below for the retraction/extension cycles of the main landing gear:
  • Down Lock: process of locking or releasing while the main landing gear is fully down,
  • Moving Up: process of raising of the main landing gear while its full extension locking is released,
  • Moving Down: process of lowering of the main landing gear while its full extension locking is released,
  • Up Lock: process of locking or releasing while the main landing gear is fully up.
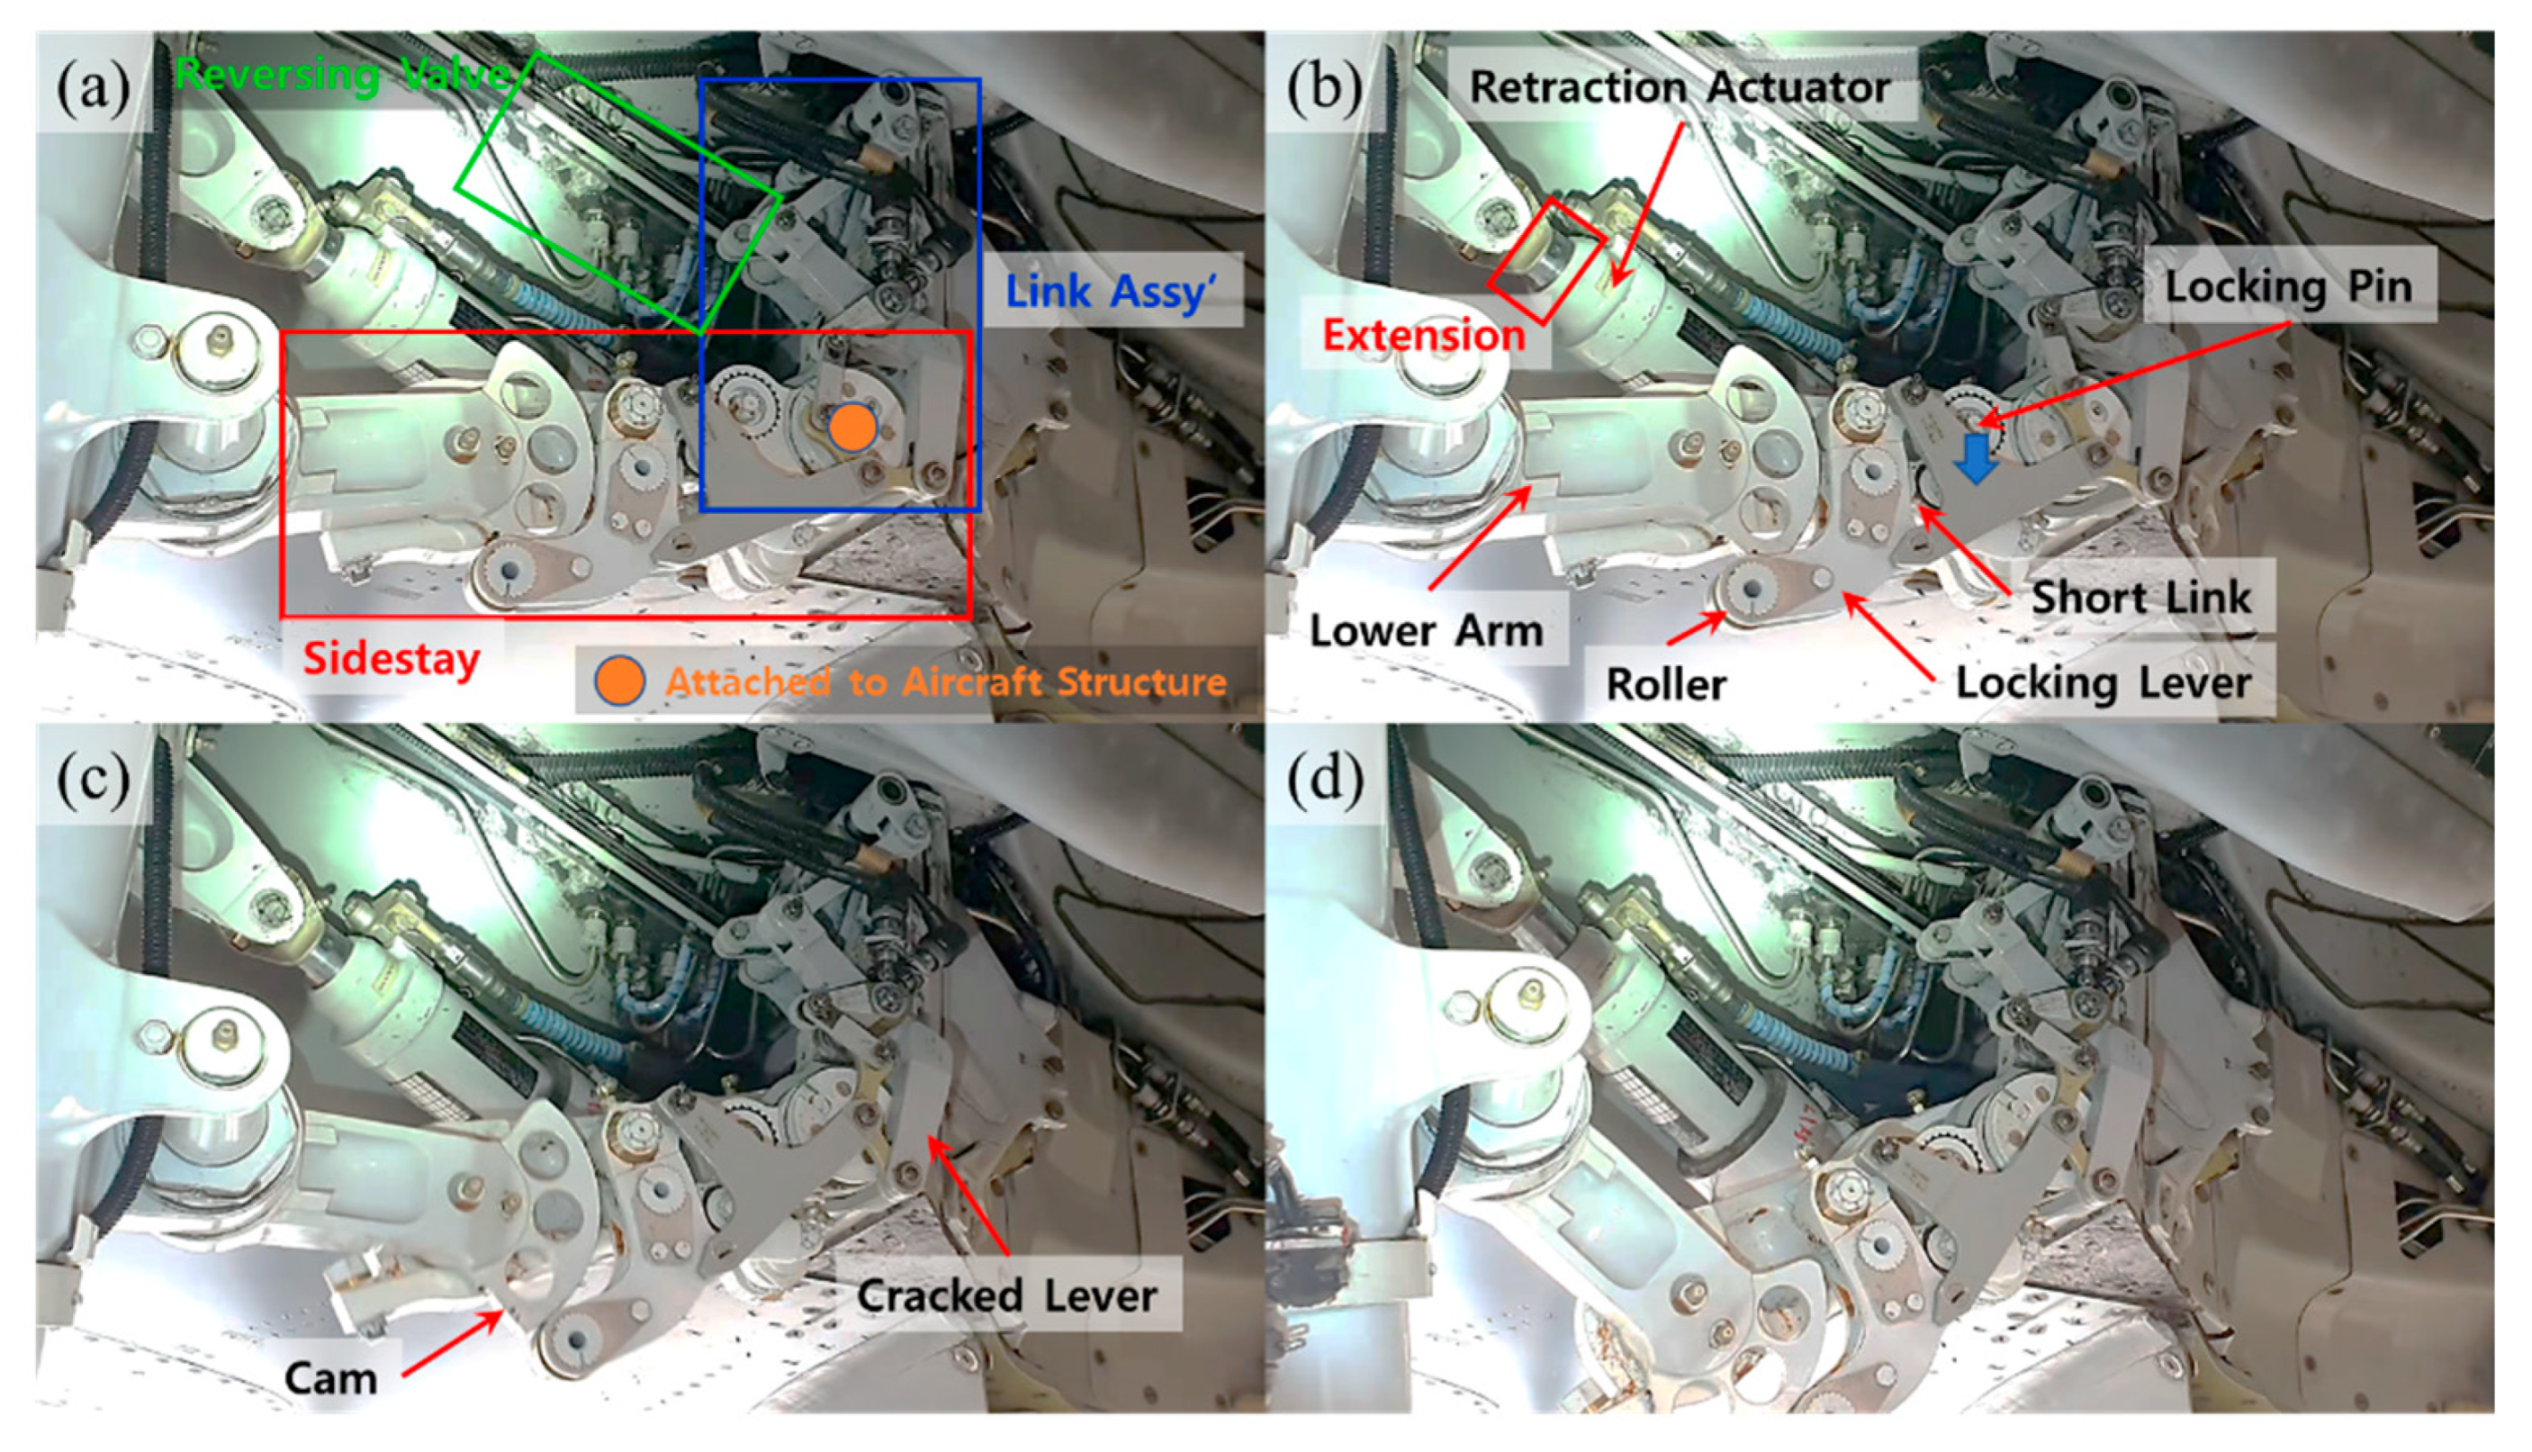
What we have observed in this research is the transition process from the Down Lock state (Figure 3a) to the Moving Up state (Figure 3d), which is the release process of the Down Lock (Figure 3b,c). The length of the retraction actuator is the most reduced when in the Down Lock state. The following mechanism operates in the process of releasing the Down Lock:
  • The retraction actuator extends slightly,
  • At the same time, the locking pin travels down the locking slot (Figure 3b),
  • As a result, the short link is pulled, which in turn pulls the locking lever (Figure 3b),
  • The cam of the lower arm is placed on the roller of the locking lever, enabling it to roll, and finally the down lock is released (Figure 3c) and the Moving Up cycle is possible (Figure 3d).
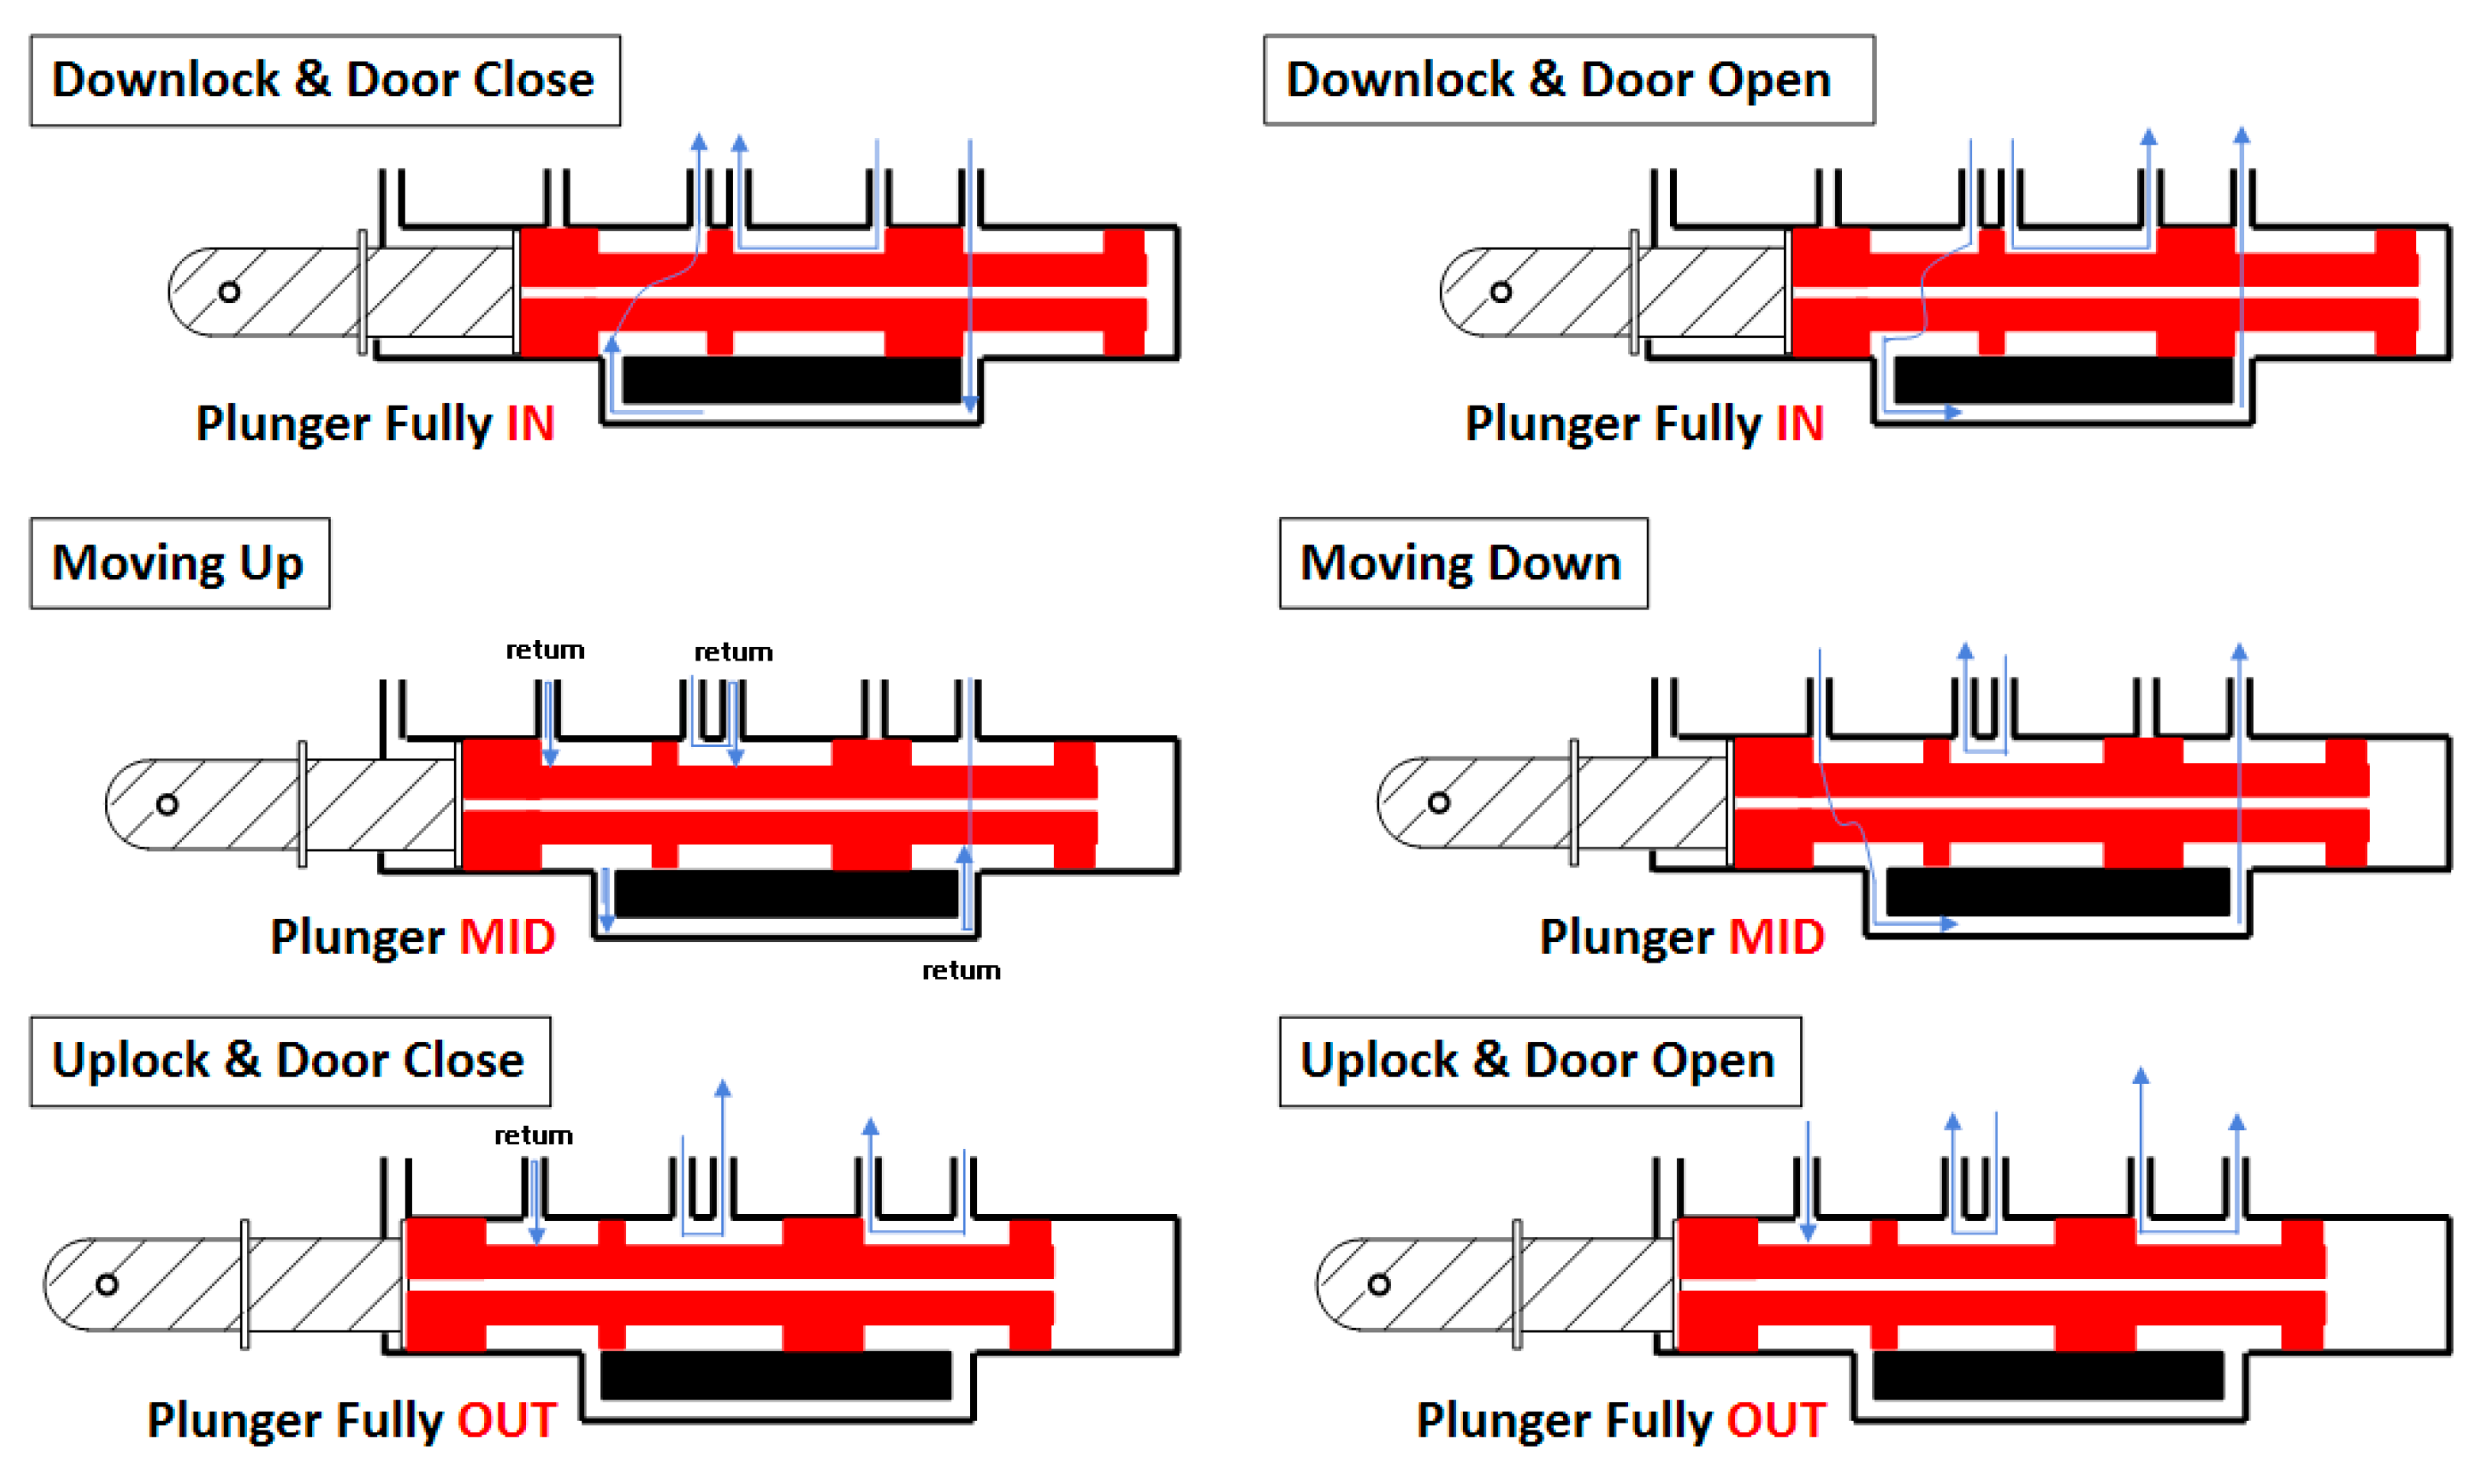
For retraction and extension of the main landing gear of the Hawker 800XP aircraft, we should consider the state of each cycle aforementioned, as well as the order of the opening and closing of the door. For instance, the door needs to be opened first for the main landing gear to be lowered. When the main landing gear is retracted, the door needs to be closed last. For this kind of cycle, it is necessary to sequentially adjust the oil path of the hydraulic system. Adjusting the oil path also depends on the mechanical structure. Depending on the arrangement of the sidestay and the link assembly, the plunger position of the reversing valve changes, and this change adjusts the oil path (Figure 4). In the Down Lock state, the plunger is in the in-position, and in the Moving Up/Down state, it is in the mid-position. In the Up Lock state, the plunger is placed in the out-position. There are six possible combinations when we consider the two directions that the hydraulic oil can move. In the process of retraction and extension of the main landing gear, when the Down Lock is released, the locking lever is pulled, and the extension lever moves accordingly. The end of the extension lever is linked to the link assembly. Therefore, the structure of the link assembly changes as the Down Lock becomes released, and this change of structure pushes the plunger from the in-position to the mid-position.

2.2. Monte Carlo Simulation

A MCS is a method used to analyze a function that is complex or difficult to interpret. It is a method of uncertainty quantification using samples extracted from the probability distribution of each variable. The probability can be estimated by dividing a certain number of samples by the total number of samples. The greater the number of samples applied, the more accurate the calculation results become. For extracting samples, we used a combination of the Latin hypercube sampling (LHS) design and the central composite design (CCD). LHS divides each variable by the number of levels with grids with a certain space, and it selects a point on a hyperplane which has the same number of dimensions as the number of variables. Conducting an MCS using the LHS design can extract results in a more condensed way than the usual uniform distribution method (extracting from all points with the same probability) when running the same number of simulations. However, the LHS design has a relatively lower number of samples that are at the boundary of each variable range. In cases where these samples (at the boundary of the variable range) produce a significant resulting value, the existence of such samples can affect the result of the sensitivity analysis. Therefore, it is possible to extract samples that can produce relatively more mathematical results if the CCD, which can extract samples at the boundary of the variable range, is combined with the LHS design. This research calculated the sensitivity using LHS only, LHS with CCD, and CCD only, and then compared them.

2.3. Sensitivity Analysis

A sensitivity analysis can figure out which variable of a system has the greatest impact on the system, or how much impact each variable has [19]. This means that input variables with high sensitivity have a relatively greater impact on the output of the system than the other input variables. In such a sensitivity analysis, defining the index that represents sensitivity quantitatively is important. In a variance-based sensitivity analysis, the distribution of results corresponding to the variation in input variables is determined, and the index is calculated based on the variance of such a distribution [19]. In this research, two indexes were used—first-order index: Si and total-order index: Sti. The difference between the two indices represents the interaction between a variable and all other variables. Total-order index is a value that considers the interaction, and first-order index is the one that does not. The greater the difference between these two values, the greater the interaction with the other variables for the resulting values of the system.
The first-order index is defined as following:
S i = V [ E ( Y | X i ) ] V ( Y )
where Si is the i-th first-order index, E(Y|Xi) is the average of the resulting values when Xi is fixed and others are distributed, V[E(Y|Xi)] is the variance of E(Y|Xi) corresponding to the variation of Xi, and V(Y) is the variance of the resulting values for the entire samples. The total-order index can be expressed as below:
S t i = E [ V ( Y | X ~ i ) ] V ( Y ) = 1 V [ E ( Y | X ~ i ) ] V ( Y )
where Sti is the i-th total-order index, V(Y|X~i) is the dispersion of the resulting values when Xi is fixed and others are distributed, and E[V(Y|X~i)] is the average of V(Y|X~i) corresponding to the variation of variables other than Xi.
Samples were extracted from the distribution of variables and entered into the model to conduct the MCS. The combination of LHS and CCD was used for sample realization. Some modifications were made in the LHS design to improve the efficiency of the sensitivity analysis. Defining n2 as the number of levels for each variable of LHS design and n1 as the number of repetitions at each level, the size of the sample matrix is the total number of repetitions multiplied by the number of input variables (n1 × n2 × 10). When calculating the first-order index, we need a group with a fixed variable (Xi) and others changing. Therefore, we edited the LHS design matrix for calculating the first-order index, as shown in Figure 5a [20]. For the total-order index, we need a group with a changing variable (Xi) and others fixed. Therefore, we edited the LHS design matrix for calculating the total-order index, as shown in Figure 5b. Finally, for the first-order index, the total number of simulations is n1 × n2, while it is n12 × n2 for the total-order index.
A combination of the CCD and LHS was only used when calculating the first-order index. In this case, we added samples (nCCD) extracted through the CCD every time the sampling at each level was repeated (n2 + nCCD), after which we edited them in the same way as shown in Figure 5a. In this case, the total number of simulations was n1 × (n2 + nCCD). We then analyzed the sensitivity to each of the variables based on the results.

3. Modeling Approach

3.1. Representation of a Point

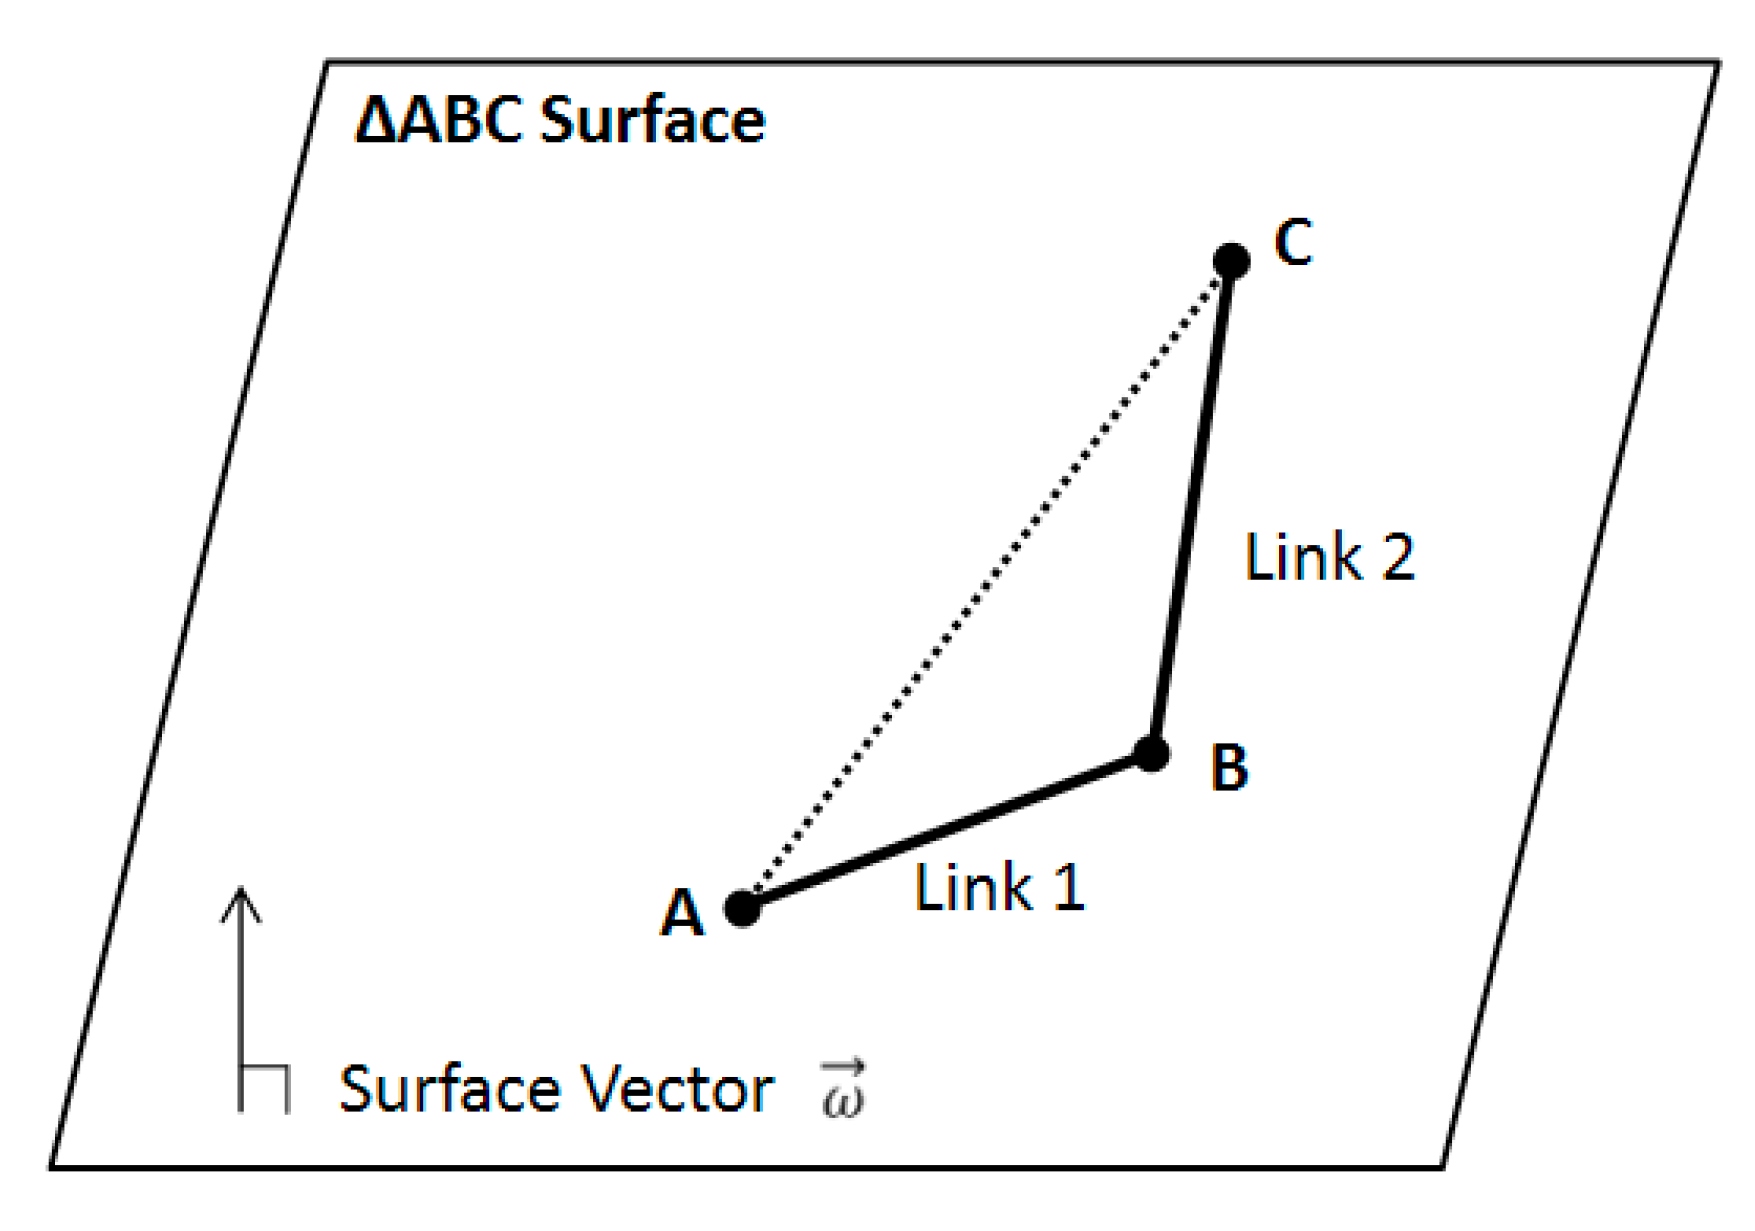
A joint connects two successive links, thus limiting the number of degrees of freedom between them. Normally a link can be represented by a line that connects two joints. Two adjacent links can be represented by three dots and two lines as they share a joint. These three dots are placed on a plane. If we know the normal vector ( ω ) of the plane where these links are placed, both nodes A and B of one of the links are coordinated, and if we know the distance between these points, then we can coordinate the last node C, which is the other node of the second link that is connected (Figure 6). Using such a method, we can coordinate a certain mechanical structure on the basis of the joints.
The following describes how to calculate the coordinates of point C when we know the plane that Δ A B C belongs to, the coordinates of points A and B, and the distances between points A, B, and C (Figure 6). The normal vector of the plane can also be calculated from the plane that Δ A B C belongs to. There are two normal vectors, above and below the plane. The direction we need to configure is the direction of the axis that can arrange A B in the direction of A C after rotating it by C A B . The value of C A B can be obtained by using the second law of cosines:
C A B = cos 1 [ | A B | 2 + | C A | 2 | B C | 2 2 | A B | | C A | ]
If the normal vector of the plane is ω , the vector component can be represented as below with a rectangular coordinate system:
ω = ( ω 1 , ω 2 , ω 3 ) T
Using the values that make up this unit vector, the following 3 × 3 skew symmetric matrix is obtained:
[ ω ] = [ 0 ω 3 ω 2 ω 3 0 ω 1 ω 2 ω 1 0 ]
At this point, the coordinates of point C can be finally obtained from the following formula [21]:
C = A + ( | A C | | A B | ) ( I + [ ω ] sin θ + [ ω ] 2 ( 1 cos θ ) ) A B
where θ is the C A B , and I is the 3 × 3 unit matrix.

3.2. Technique of Considering Joint Clearances

Based on the mechanical structure at the critical moment that causes a mechanical malfunction, we placed all joints of the structure on a Cartesian coordinate system. At this time, the points on the coordinates were assigned an order number based on their mechanism and then placed on the coordinates. Therefore, if it is closer to the input, it receives an earlier number, and if it is closer to the output, it receives a later number. The mechanism of the main landing gear of the Hawker 800XP aircraft consists of a retraction actuator, locking pin, short link, locking lever, extension lever, link assembly and reversing valve in the order of process, and they are numbered as shown in Figure 7.
Assuming that the clearance of each joint is increased by frictional contact wear, we selected a total of ten clearance input points, mainly joints with a high potential of wear (the green circles in Figure 7). To calculate the plunger displacement corresponding to the clearances, we coordinated by sequentially adding virtual links to each joint of the sidestay and link assembly. As for the virtual links, we entered them as two-dimensional vectors on the plane containing adjacent links to express the length and direction of the clearances. If there was no clearance, the two points became one as the ends of the adjacent links overlap. However, if the virtual links were added, they stayed separated without overlapping at one point. At this time, under the assumption that the distance between the joints at both ends of one link was constant, we gradually calculated the coordinates of the new configurations. Because the joints were numbered corresponding to the order of the mechanisms, clearances of later numbered joints did not affect the coordinates of earlier numbered joints.
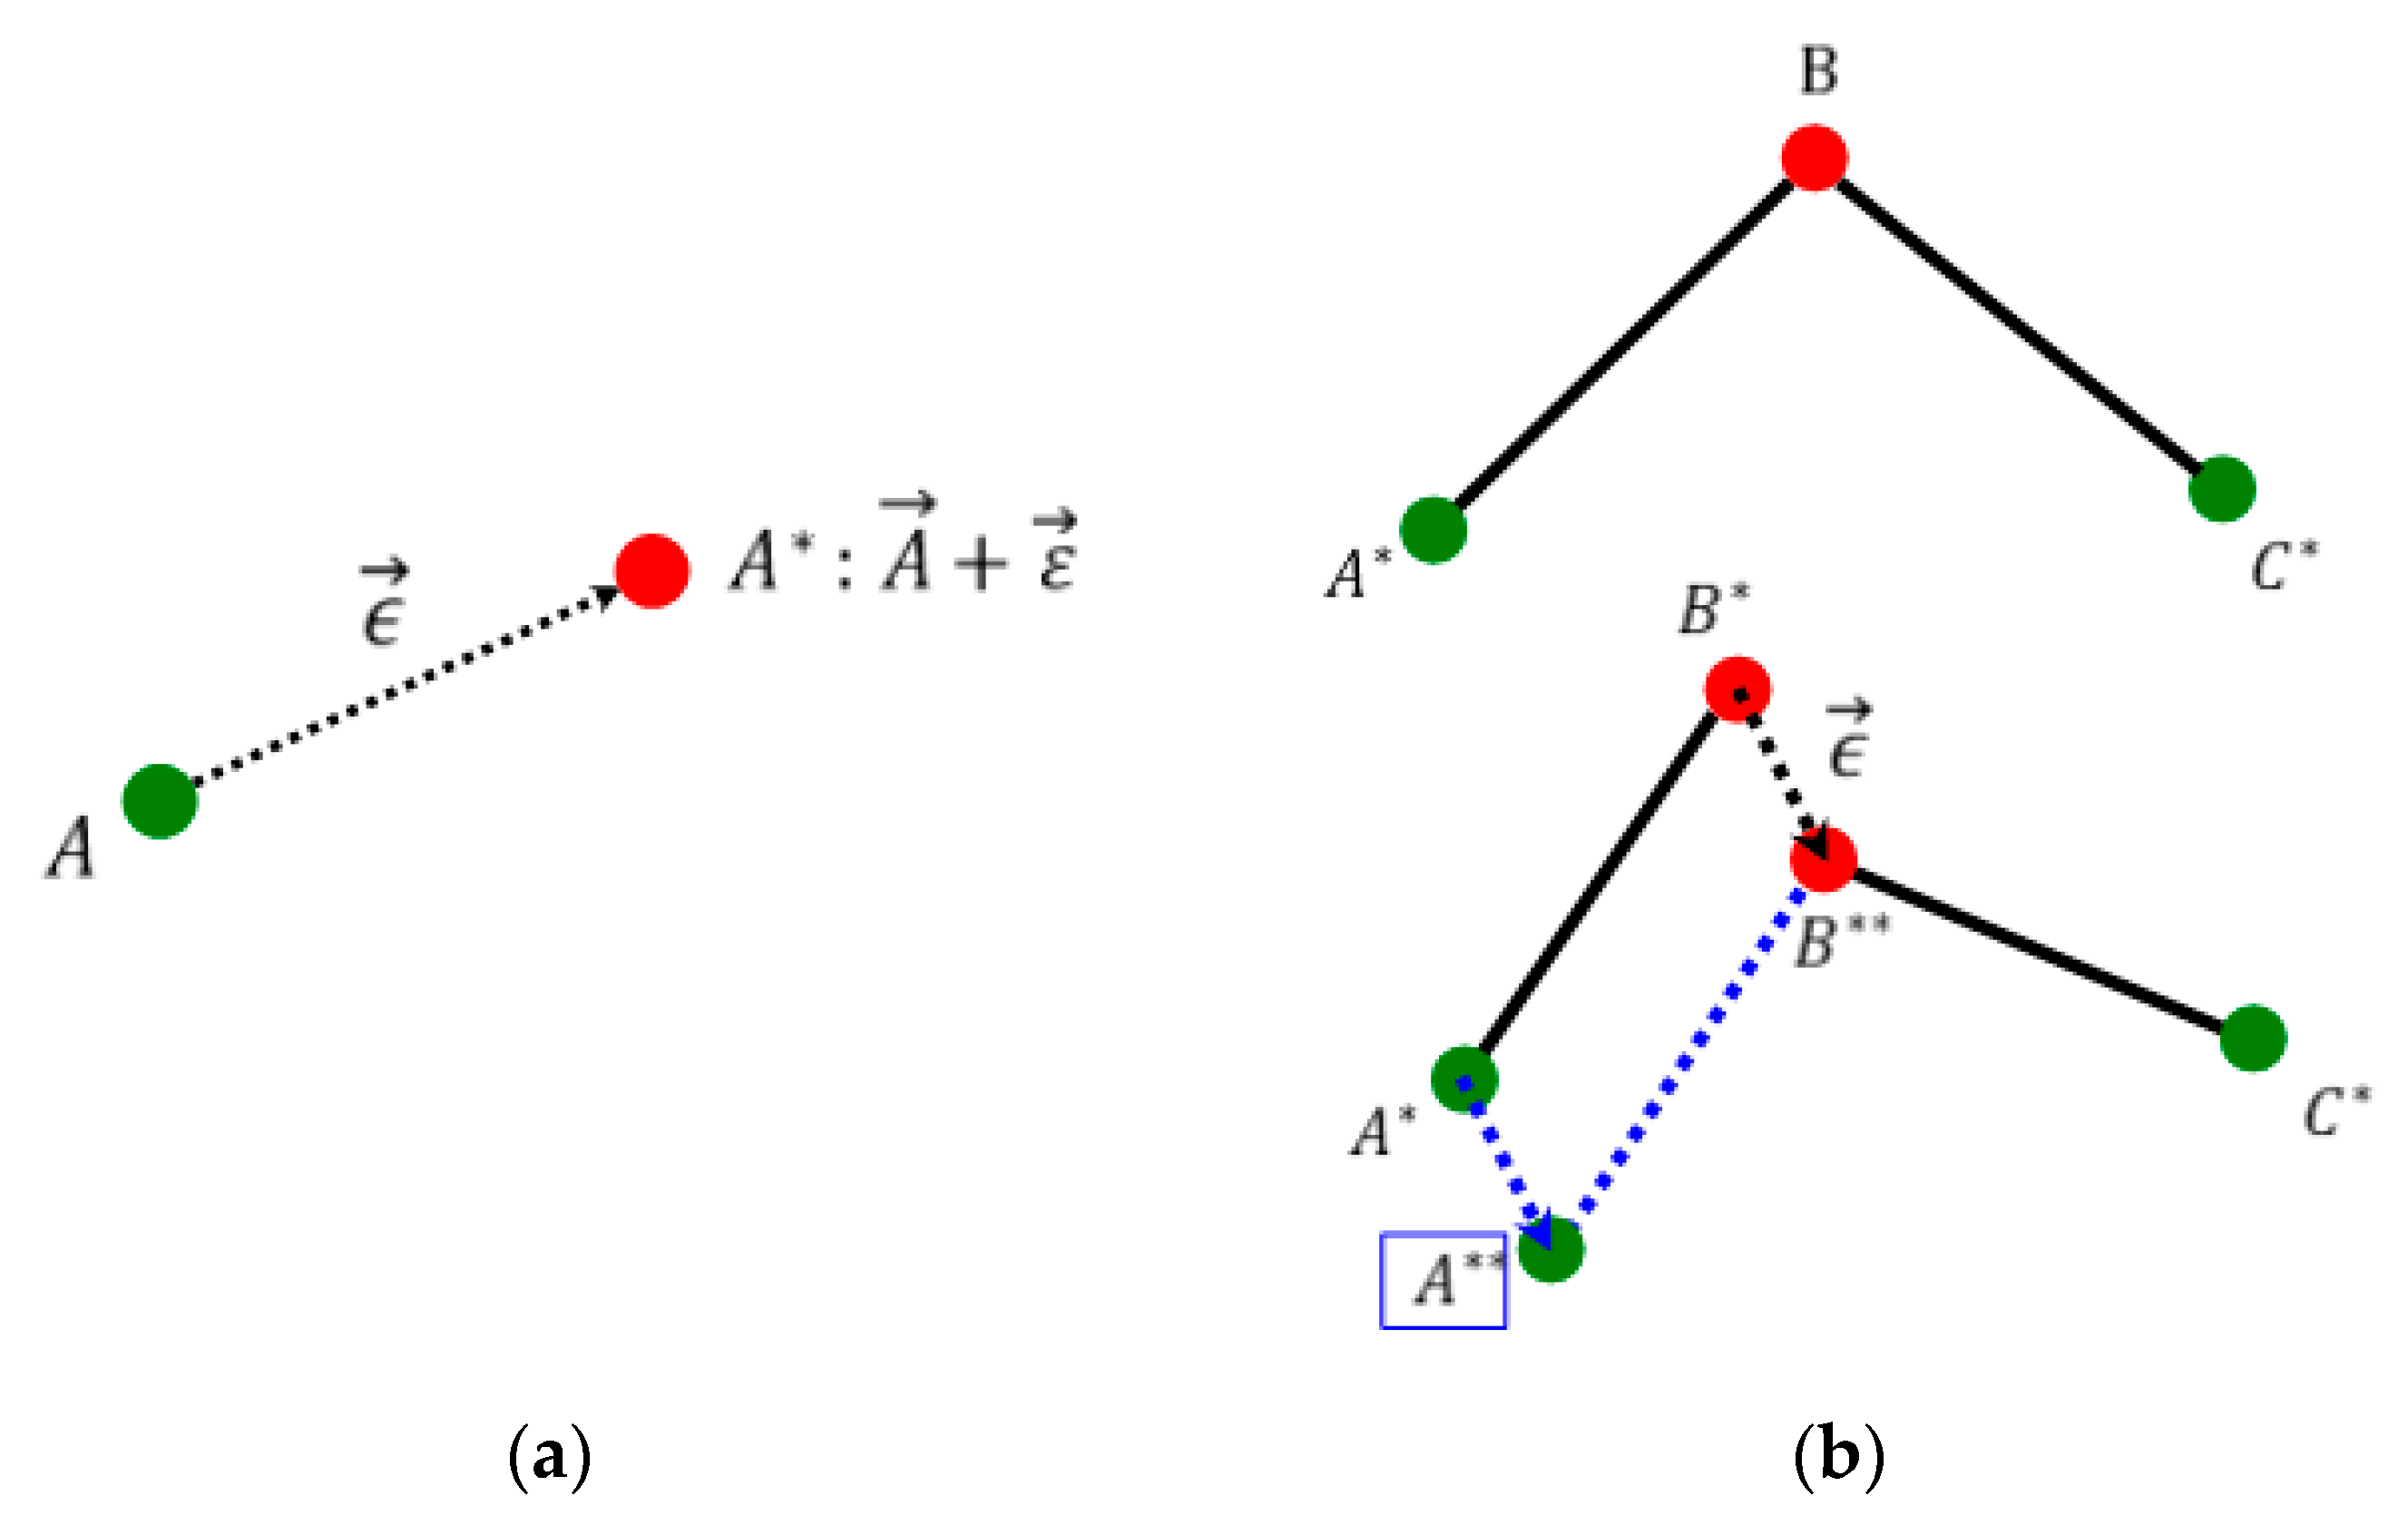
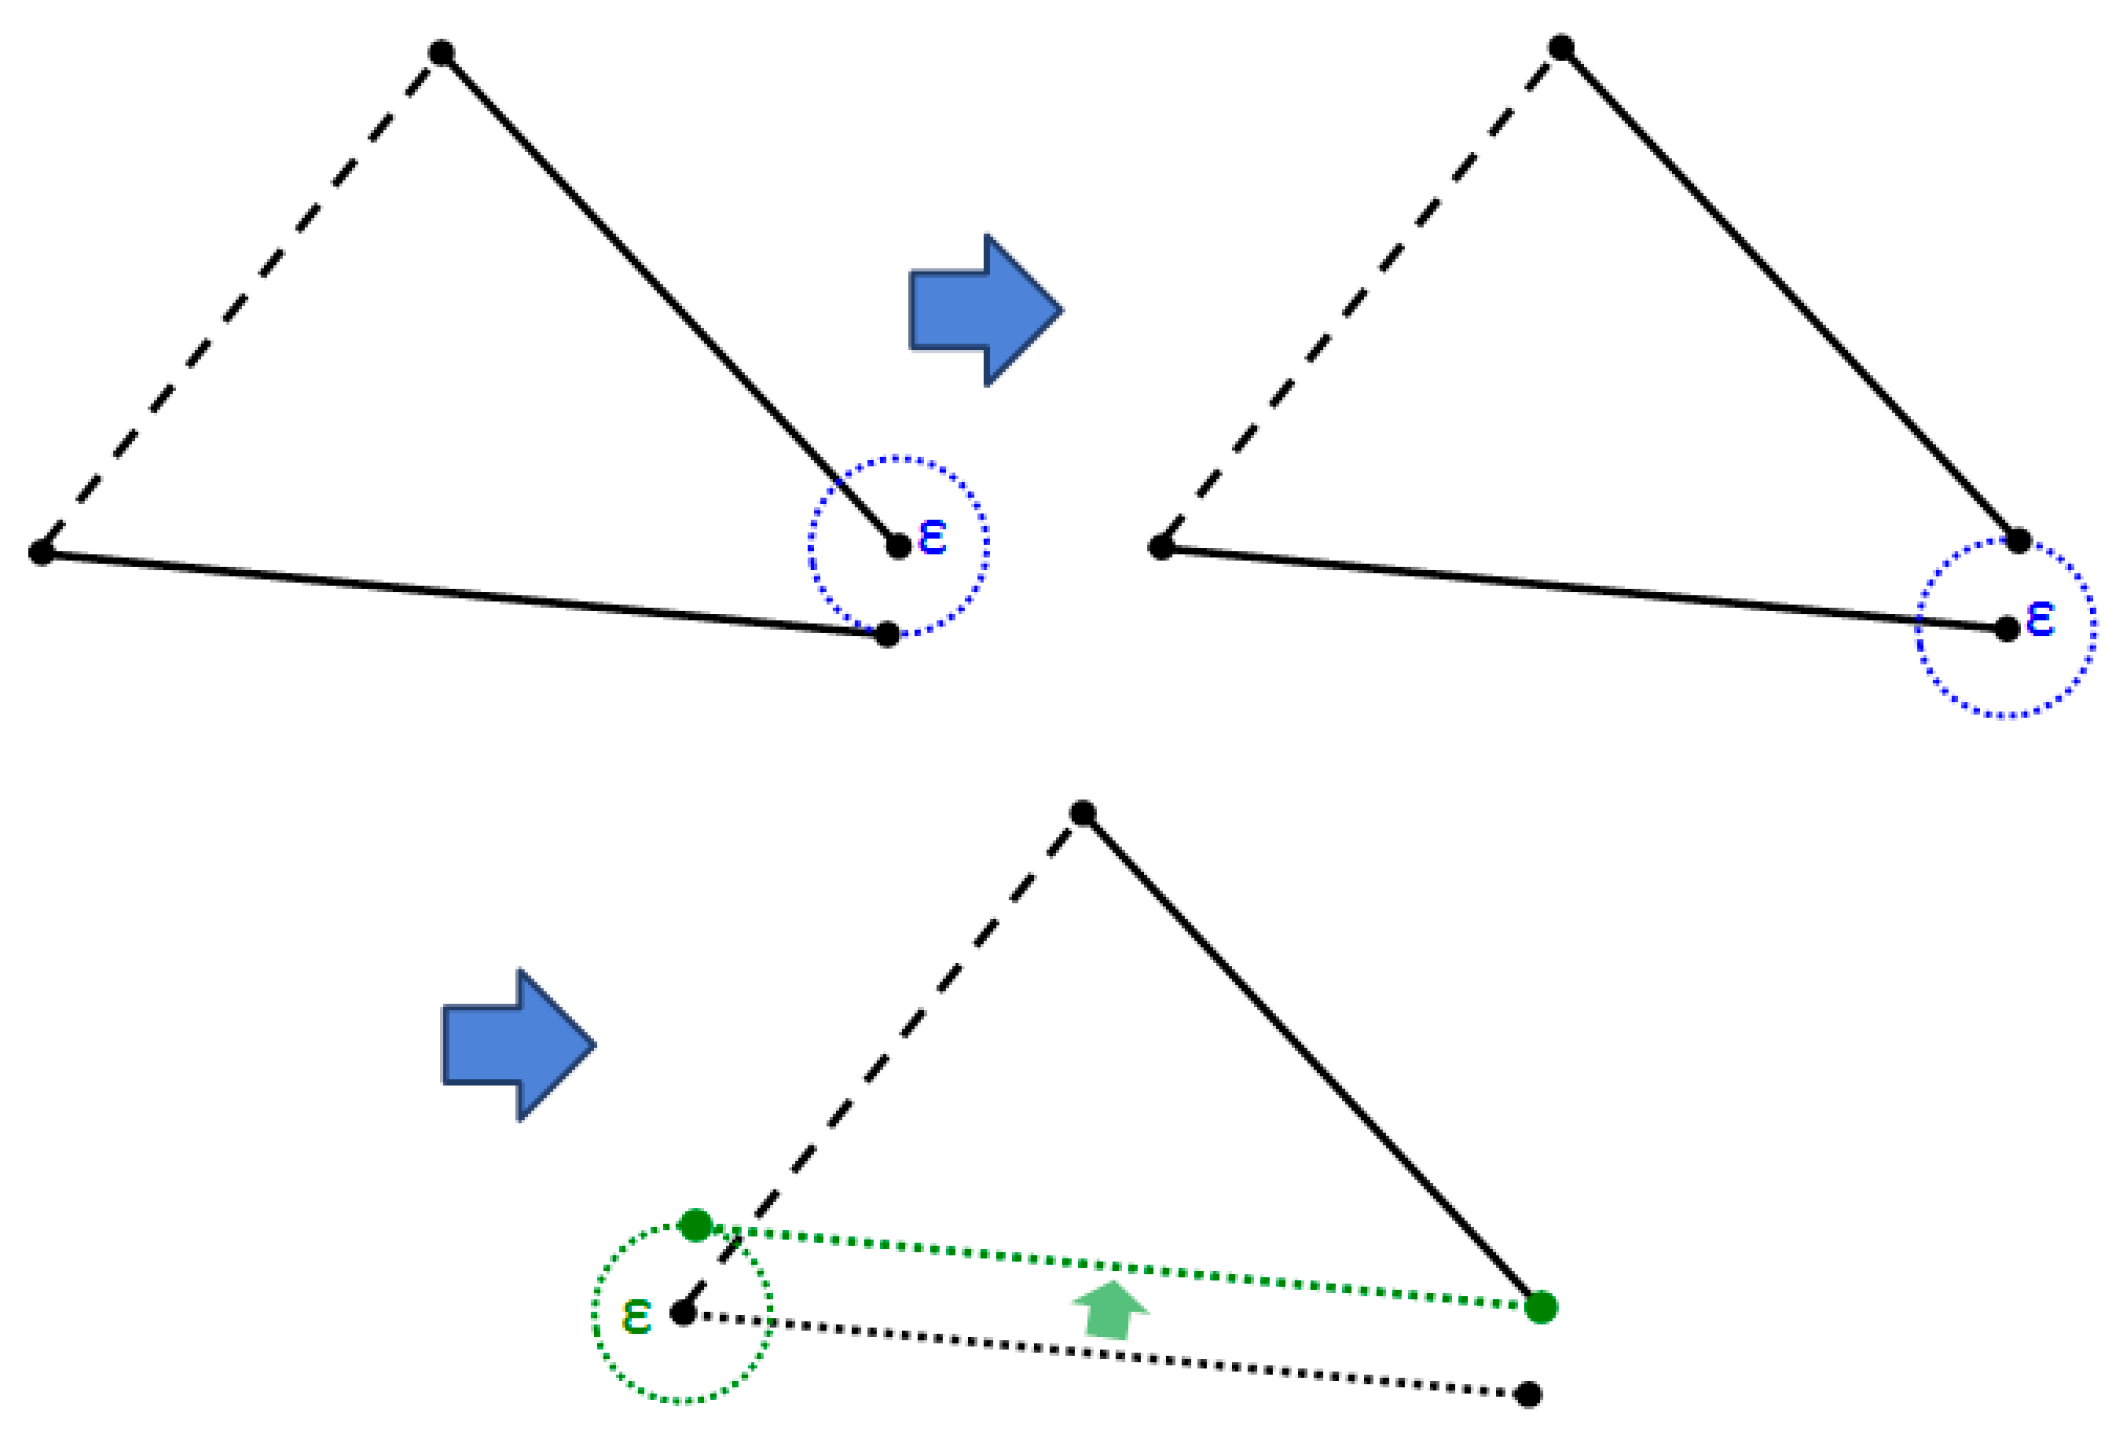
There were two cases when we added clearances. The first case involved joints fixed to the aircraft fuselage (Figure 8a). Fixed joints were coordinated preferentially, with the virtual links added. The existing coordinates were A, and the new coordinates after adding a clearance was A*. The second case concerned the joints between points fixed to the aircraft fuselage (Figure 8b). The order of mechanisms was A, B, and C. Since A and C were fixed to the aircraft fuselage, we entered virtual links to them before B (A*, C*). When a virtual link was entered into B, it split into B*, linked to A*, and B**, linked to C*. To find the coordinates in the order of mechanisms, we must know how link BC moved through the coordinates of B**. We defined A** as the new coordinates to which A* moved parallel by the virtual link. We observed that B** was at a distance of link AB from A** and at a distance of link BC from C*. Similar to this, through coordinating with the clearances added, we could see how each link moved minutely and finally calculated the reversing valve plunger movement.

3.3. Amplification Index Method

We calculated linearly how a movement of one joint moved the next joint when movements of a geometric model with clearances are propagated in the order of mechanism operation. The next joint moves as a proportion of the distance the previous joint moves, and the rate of movement is expressed as the amplification index. The amplification index is defined as the ratio of displacement of joint k − 1 and joint k when there is a clearance in joint i:
A i k = ϵ i k ϵ i k 1
where Aik is the amplification index of joint k corresponding to the clearance of joint i. εik and εik−1 are the displacement of joint k and joint k − 1, respectively, when there is a clearance in joint i. The amplification index of the plunger is the ratio of the plunger displacement and the clearance in joint i:
A i P = Δ P ϵ i i
where ΔP is the displacement of the plunger, and εii is the size of the clearance in joint i. As clearances propagate from the joint they belong to in the order of the mechanisms, we can see as below the proportional relationship between the clearances and the movement of the plunger if we calculate (the clearances) by multiplying amplification indices suitable for the order of mechanisms.
A i P = β A i i + 1 A i i + 2 A i n
where AiP is the plunger amplification index corresponding to the clearance of joint i, n is the number of joints of the geometric models, and β is the correction factor for the change in the amplification rate in the course leading to the plunger after the n-th joint. Behaviors after the n-th joint are not correlated to i, the joint where all clearances start, therefore β is a constant.
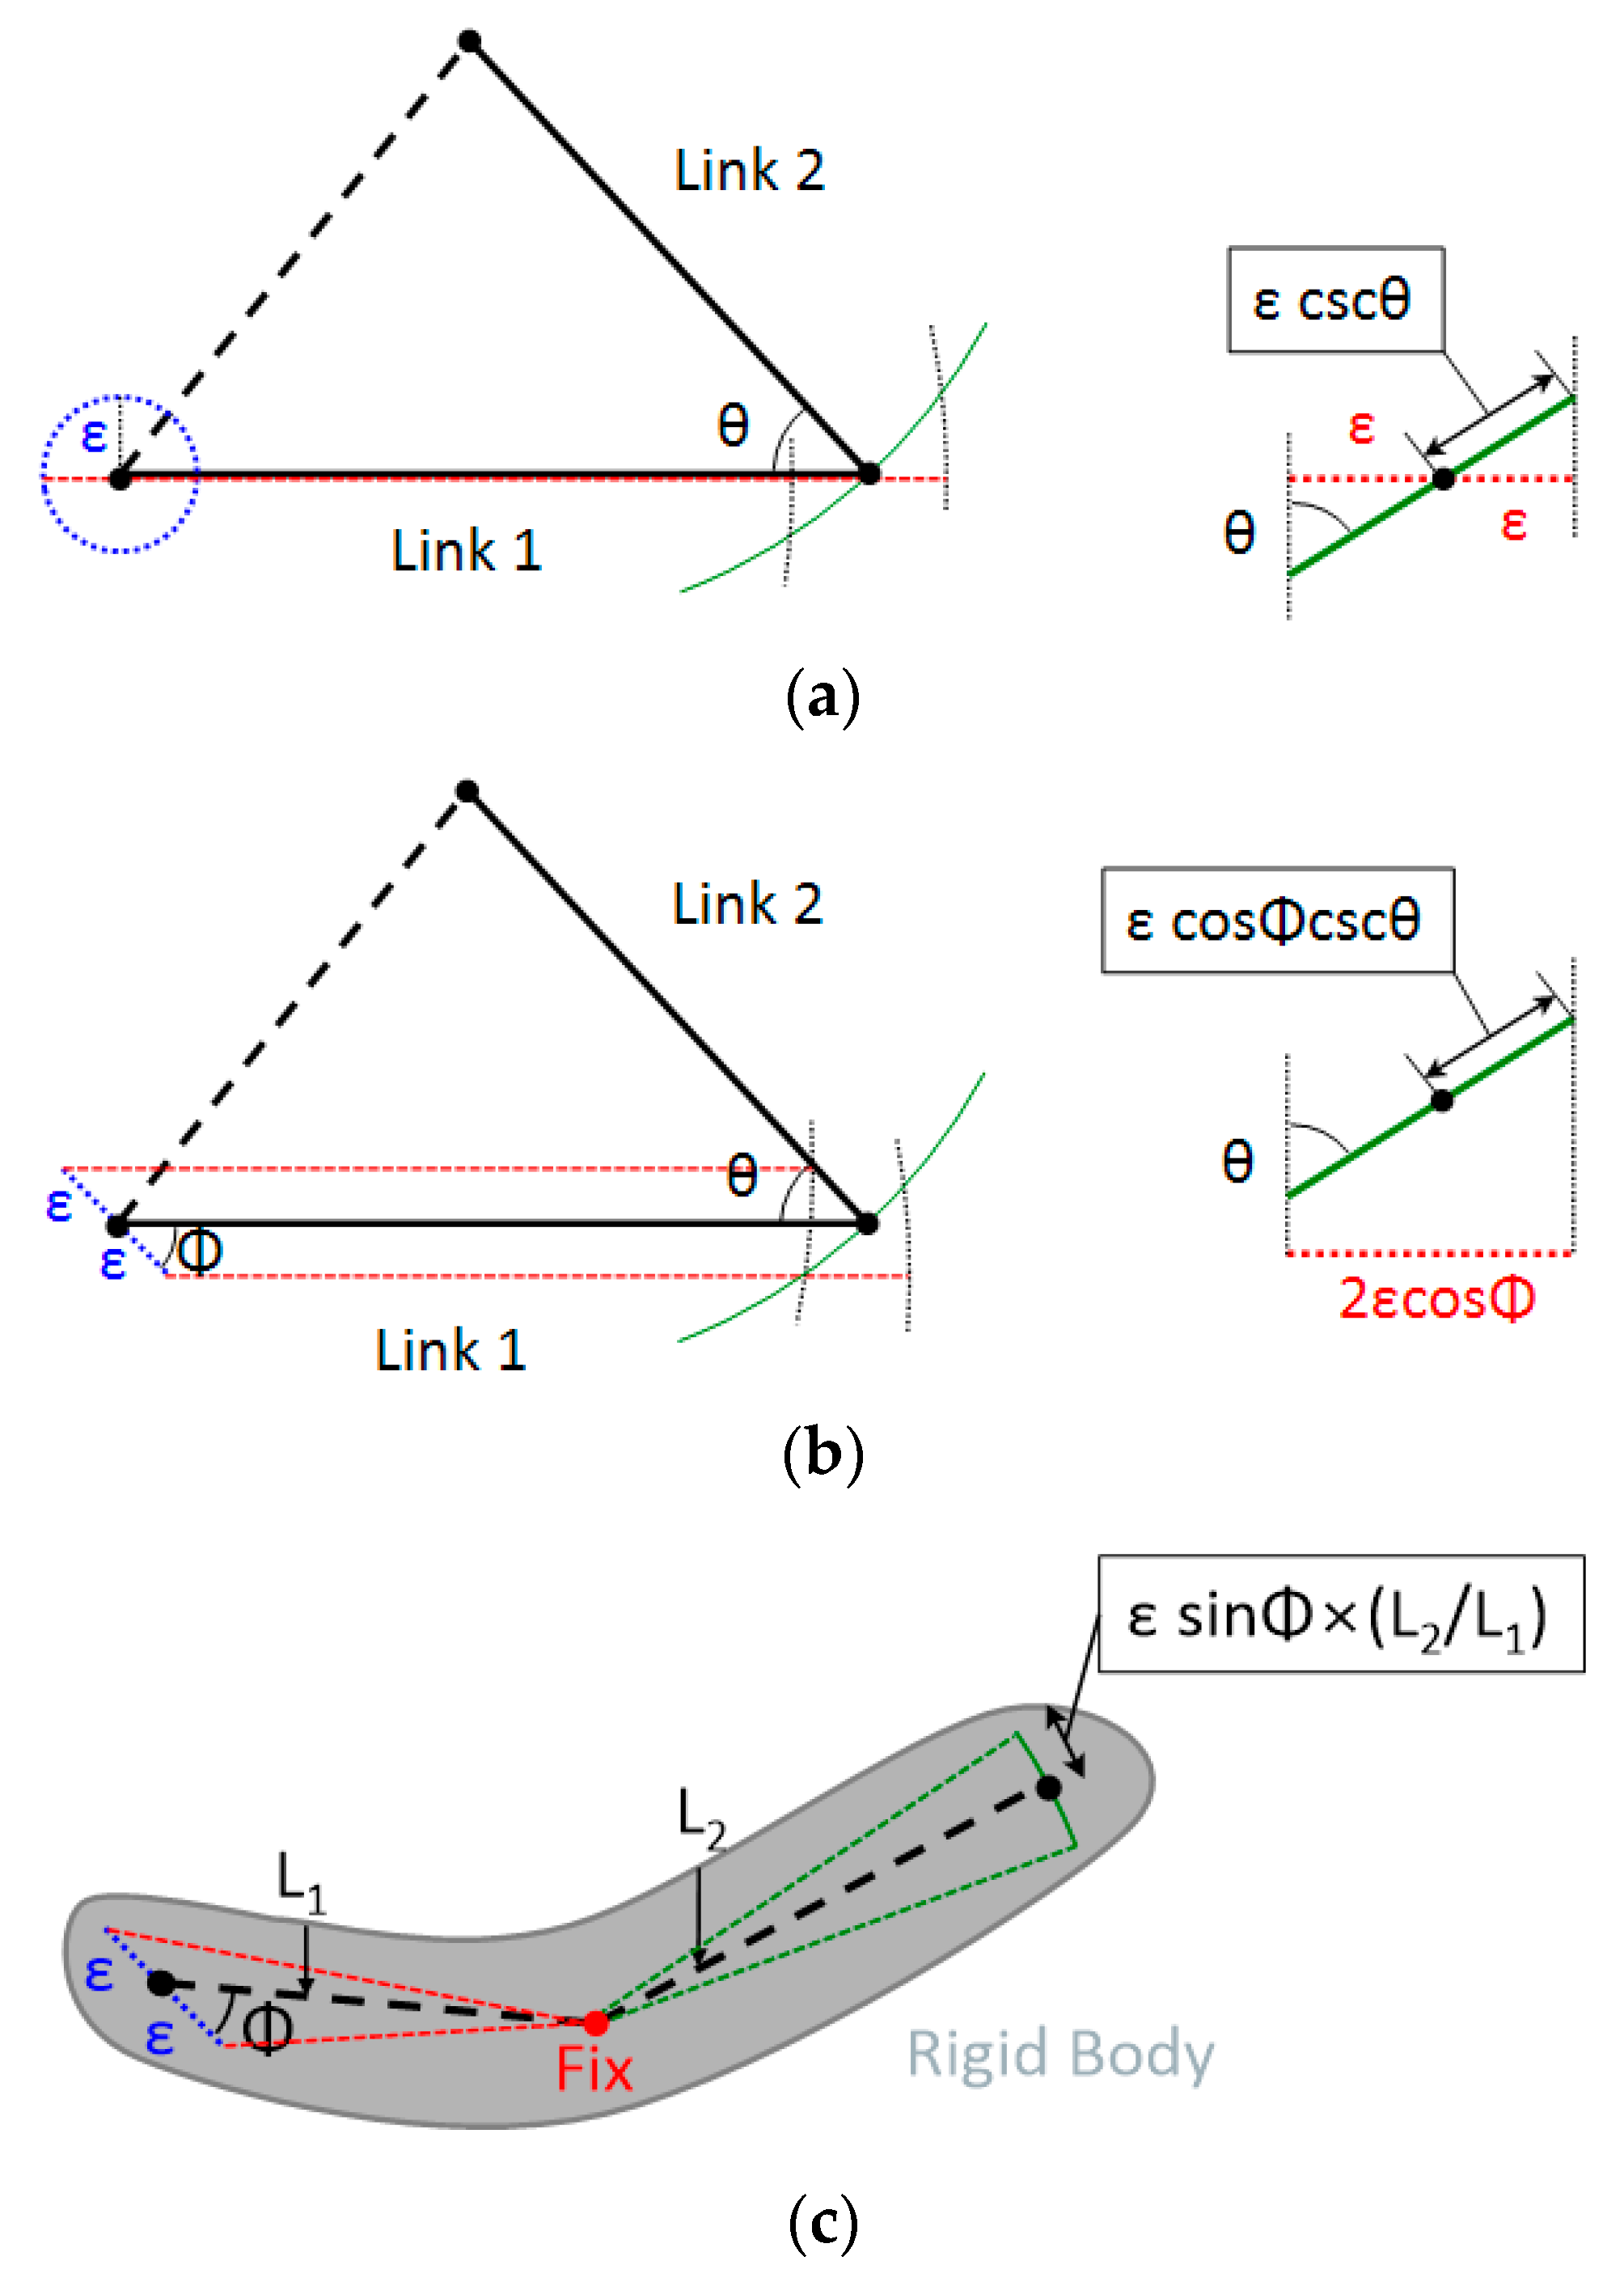
There are three main circumstances where we calculate amplification indices in the case where the clearance is transferred from link 1 to the next link, namely link 2. First is when a clearance starts in link 1 (Figure 9a). If the length of the link is very large compared to the clearance or the displacement corresponding to the clearance, we can approximate the minute part of the curve as a line. Therefore, the amplification index can be approximated as csc θ . The clearance at the point where links 1 and 2 meet also has the same amplification link by the geometric symmetry (Figure 10). The second is the case in which link 1 moves with a clearance which has occurred in the previous link (Figure 9b). If you calculate the amplification Index for this case, it is cos φ csc θ . The last instance is the case in which a rigid link has three joints, and the middle joint is fixed to the aircraft body (Figure 9c). If we calculate the Amplification index considering the rigid body rotation at the same angle from the joint fixed to the aircraft body, it is sin φ ( L 2 / L 1 ) :
A i k = { csc θ , i f   c u r r e n t   c l e a r a n c e cos φ csc θ , i f   p r e v i o u s   c l e a r a n c e sin φ ( L 2 L 1 ) , i f   r i g i d   b o d y   c l e a r a n c e
The amplification index was calculated using Equation (9), and a sensitivity analysis was conducted by calculating the amplification index for the plunger. We compared the results from the sensitivity analysis through the amplification index method and those of the computational method. We then conducted a root cause analysis for the joints with the greatest effects based on the results from the two sensitivity analyses.

4. Results and Discussion

4.1. Coordinating Joints

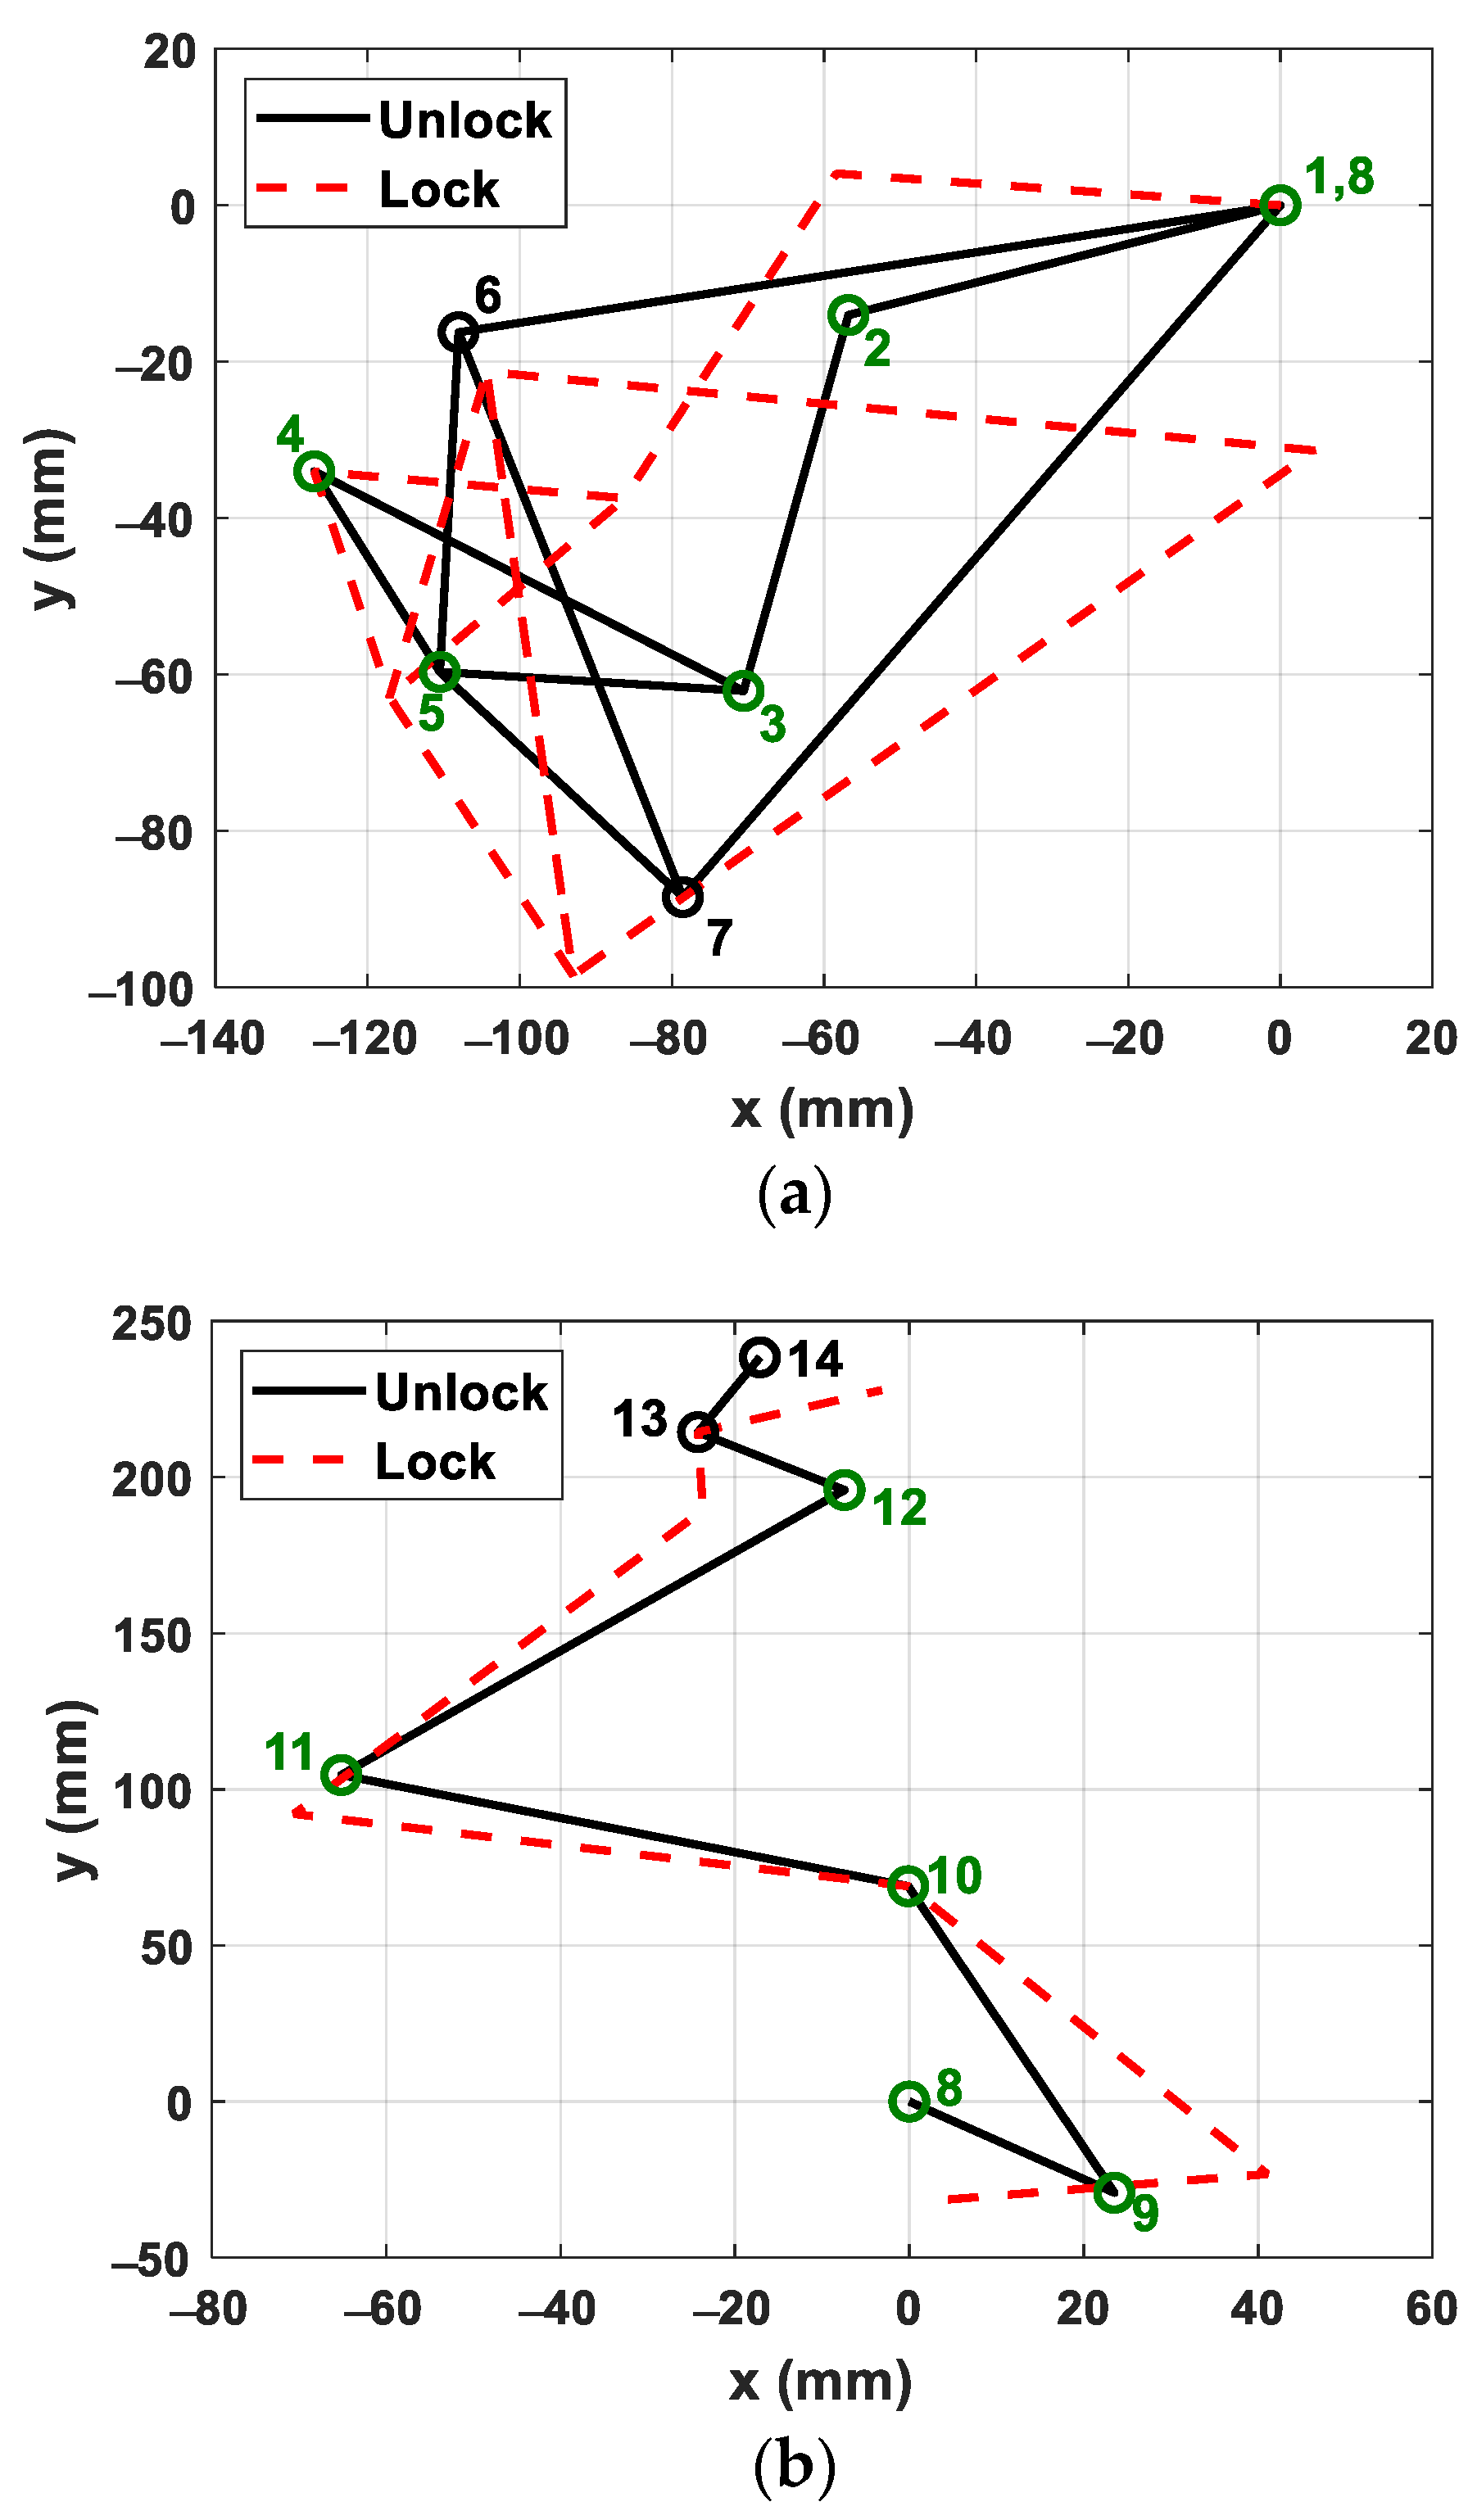
A critical moment where a failure occurs during the opening and closing of the door, before the Hawker 800XP aircraft main landing gear retracts, is right after the Down Lock is released. The plunger must be within the tolerance range around the mid-position when the Down Lock is released. If it exceeds this range, a failure occurs. The coordinates of the sidestay and link assembly in the Down Lock state and right after it is released are as shown in Figure 11.

4.2. Calibration

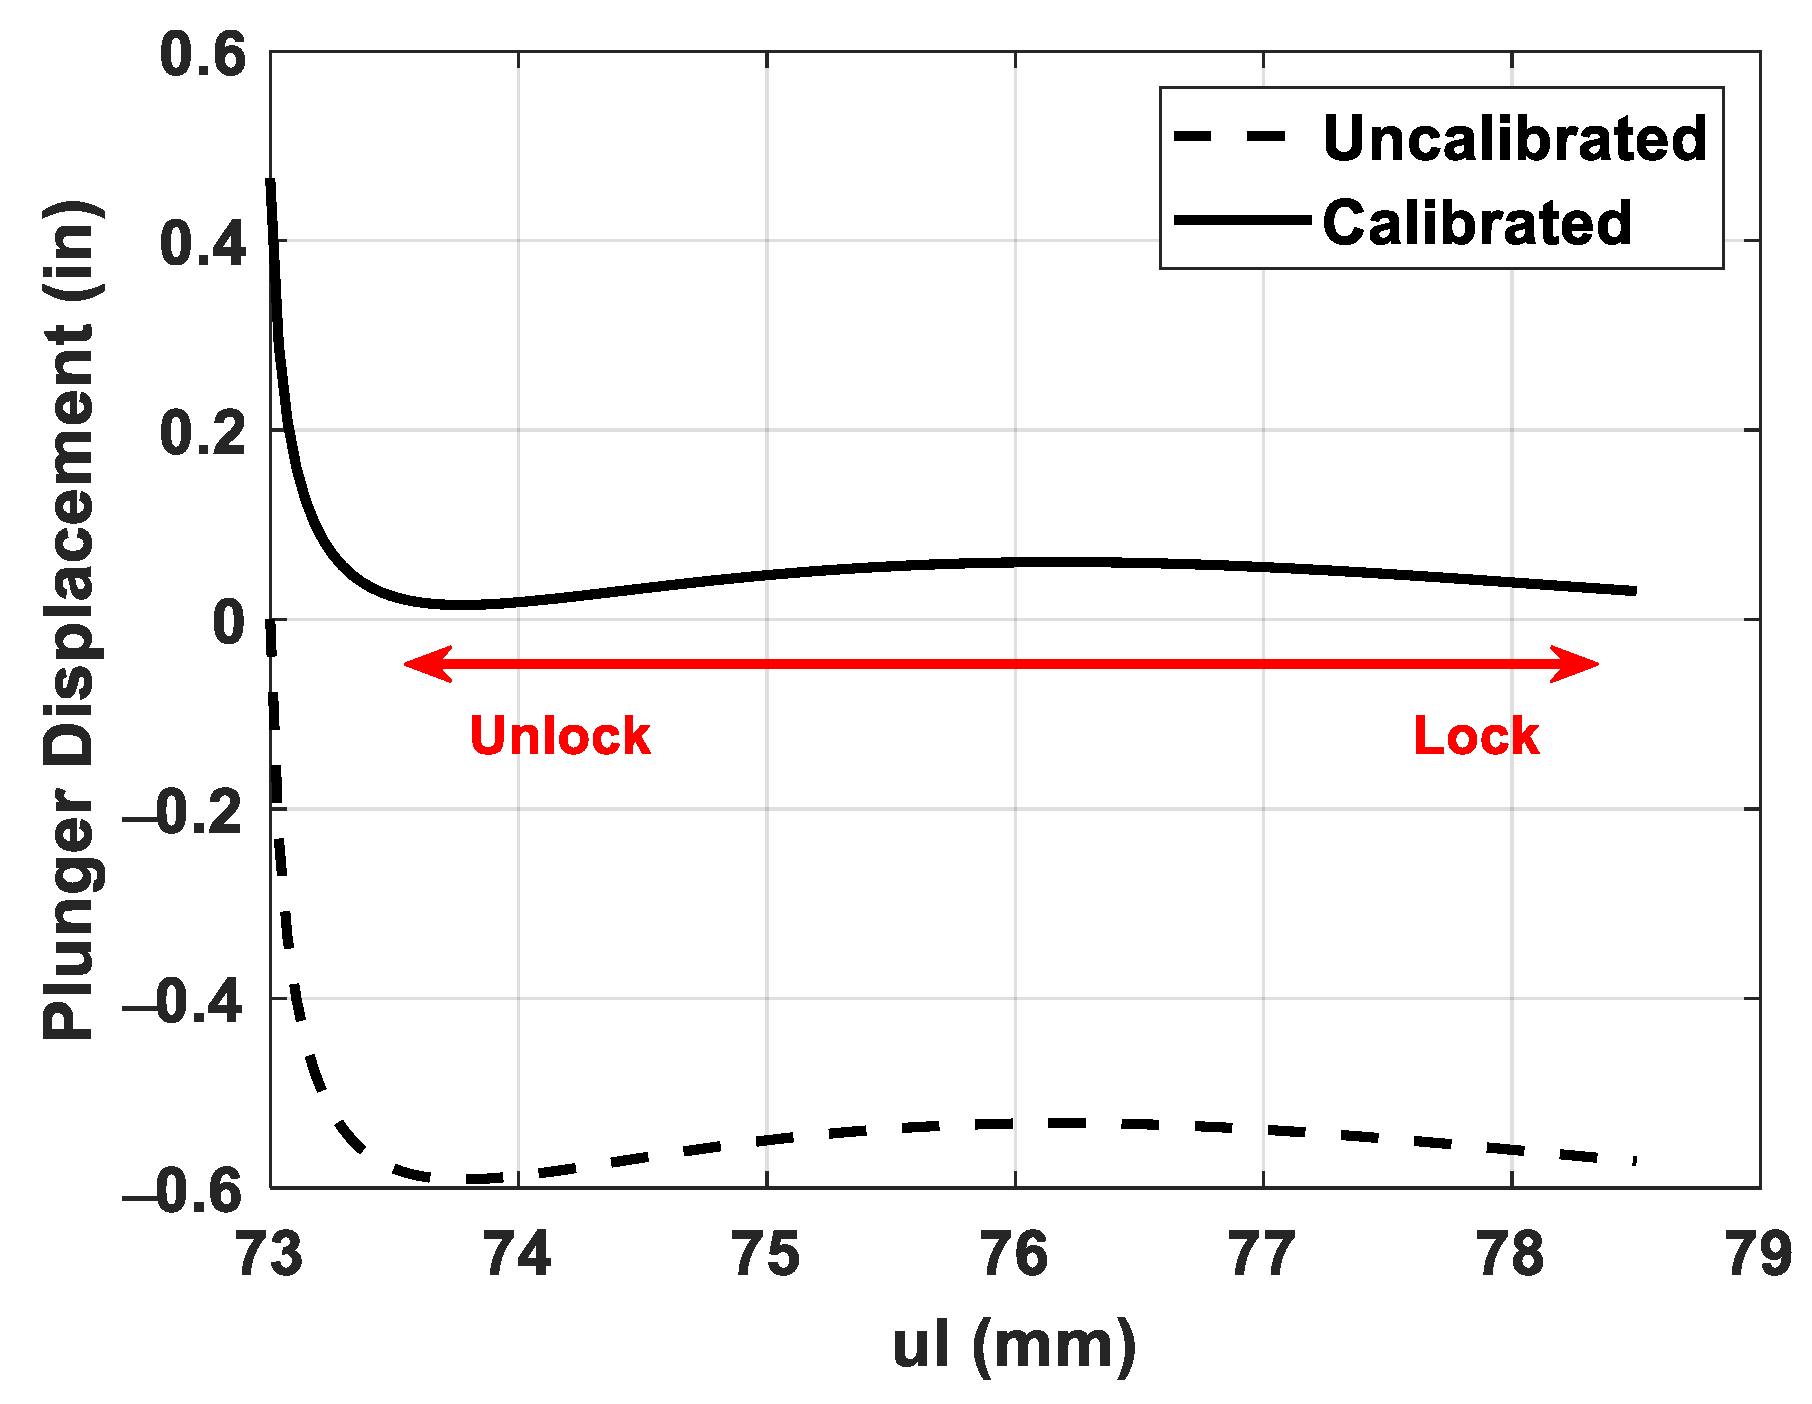
The goal of the calibration is to ensure that the reading from a joint model yields the correct joint displacement [4]. We calibrated the model in a linear way according to the plunger displacement specified in the technical order. The normal plunger displacement in the Down Lock state is 0.01~0.05 in. We adjusted parallel to 0.03 in, which is the mean of the normal displacement. Considering that a half of the maximum travel between the in-position and out-position is 0.45 in for the reversing valve plunger, we adjusted the displacement rate for the plunger so that the difference between the plunger displacement in its mid-position and its minimum displacement in the process of releasing the Down Lock was 0.45 in. Figure 12 shows the plunger displacement during the process of releasing the Down Lock after calibration.

4.3. Sensitivity Analysis

In order to apply a sensitivity analysis to the system, we needed to model the system and choose variables that represented elements that make up the model. We conducted a sensitivity analysis on the geometric model by assigning the distance of the virtual link for each joint (point) as a variable (there were ten input variables). Because of the difficulty in an accurate determination of the direction of the virtual link considering the complex loads and interlocking state, we set the direction of the virtual link to maximize the likelihood of system failure. We assumed that the length of the virtual link was uniformly distributed between 0 and 0.0075 in, as 0.0075 in is the maximum clearance allowed [24]. Because the purpose of this research was to find the joint (point) with the greatest impact when the same length of clearance was given, we assigned a relatively smaller range for the length of clearance.
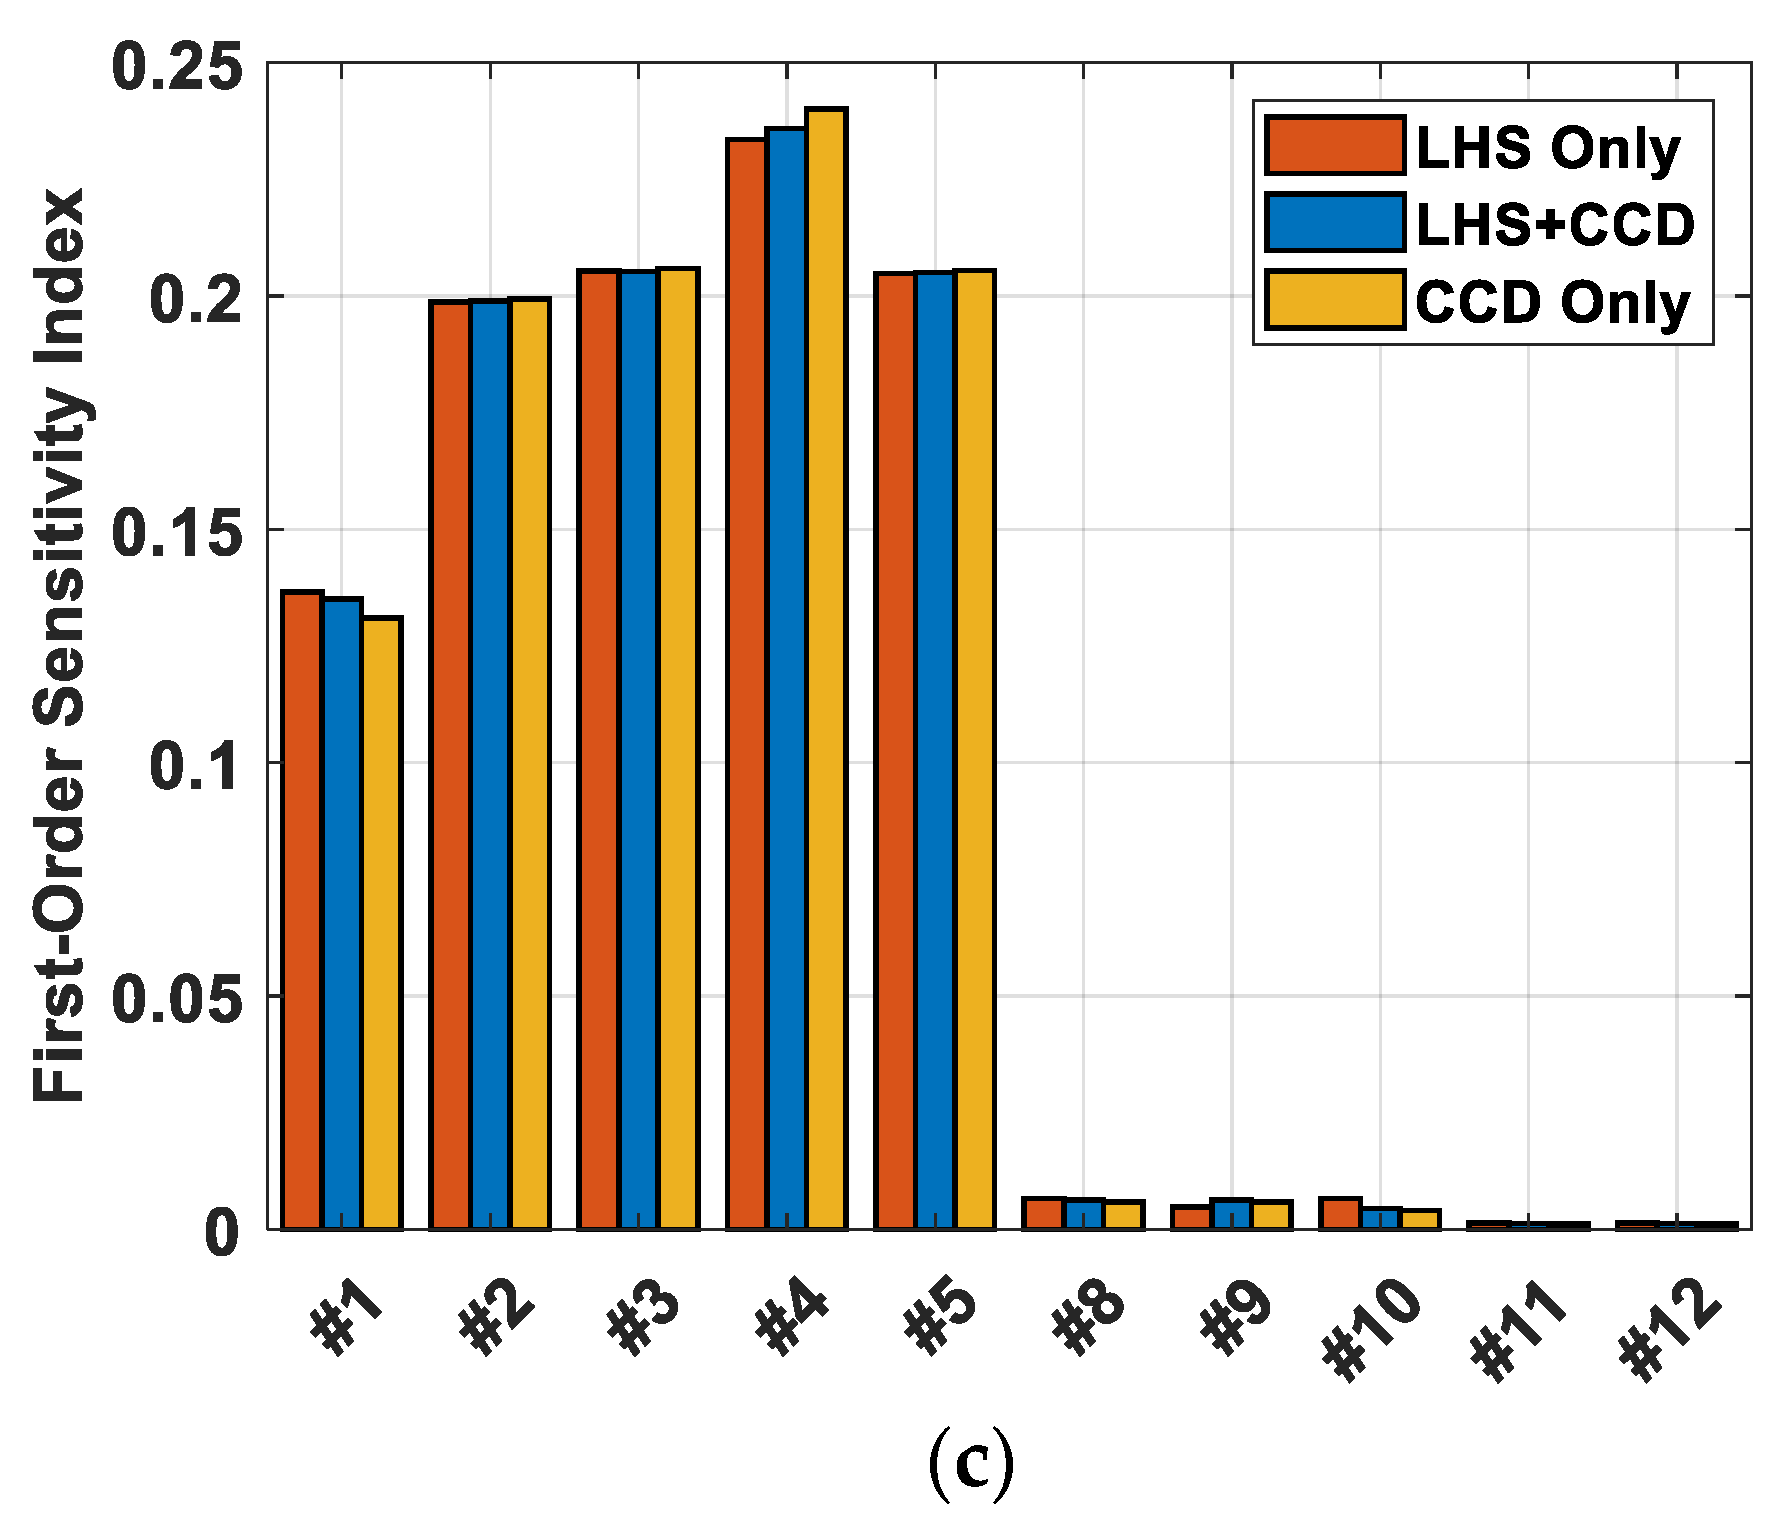
We set the direction of the clearances so that the plunger would have the maximum number of failures. We set the clearance of each joint as a variable and conducted a sensitivity analysis with the movement of the plunger as a result. When we used only the LHS, we repeated the experiment 100 times (n1 = 100) for each level and 1000 times for level sampling (n2 = 1000). When we used only the CCD, we conducted it after setting n1 = 100, n2 = 0, and nCCD = 138. When the LHS and CCD were combined, we conducted it after setting n1 = 100, n2 = 862, and nCCD = 138. We took the average from the ten iterations of analysis as the sensitivity index.
When we used only the LHS, the first-order index and the total-order index for each joint are as shown in Figure 13a. We can see that the sensitivity index of joints closer to the starting point on the sensitivity graph is higher than the other joints. Joints #1 to #5 have a sensitivity index higher than 95%, and the rest of the joints have insignificant sensitivity. There were two cases where joints had high sensitivity indices. Firstly, a joint located at a geometrically sensitive point has a high sensitivity index. In this case, the amplification index (Ai+1) is high. Secondly, joints preceding joints that have a high sensitivity index also have a high sensitivity index because clearances in those joints would be amplified by the following joints. Joints #1 and #2 correspond to the second case, and the maximum amplification indices are 0.84 and 1.488, respectively. Joints #3, #4, and #5 correspond to the first case, and the maximum indices are greater than 5. Amplification indices of the remaining joints are less than 2. Joints #2, #3, #4, and #5 have a sensitivity index nearly 20% or over in percentile. We can see that these joints belong to a group of joints with a great impact on operational failure. Below are descriptions for each joint:
  • #2: Locking pin,
  • #3: Short link inner bearing,
  • #4: Rotating part where sidestay upper arm and locking lever interlock,
  • #5: Short link outer bearing.
The result show that joints #2, #3, #4, and #5 have a significant impact and a kind of butterfly effect. For joints close to the plunger, the values from the arrangements of links ultimately transfer, and the clearance is propagated without much change; however, clearances in joints far from the plunger geometrically can be amplified along with the mechanism, possibly having a significant impact on the plunger.
The results from the amplification index method show that joints #2, #3, #4, and #5 have a great impact similar to that found by the computational method, except that joint #2 recorded a higher sensitivity (Figure 13b). For joint #2 (locking pin), the clearance was transferred to joint #3 as a form of a rigid body clearance propagation. At this time, we determined that the apparent high sensitivity of joint #2 was due to errors caused by treating minute curves as lines. Figure 13c shows a comparison according to experimental design. When the experimental design method changes from LHS to CCD, i.e., the number of samples increases at the boundary of the variable range, the sensitivity index that is relatively great becomes greater, and sensitivity index that is relatively small becomes smaller. A phenomenon like this can be explained with a movement graph for the plunger as in Figure 12. Because the movement of the plunger is represented as a fast-moving, convex downward function as it approaches near the end of the cycle, it was determined that the difference in the sensitivity index increased as there were more samples at the boundary of the variable range.
From the overall sensitivity results, what needs to be taken note of is that the sensitivity index is not at all great just because it was measured close to the starting point according to the order of the mechanism operation. Arrangement of the links is not a series of arrangements according to joint numbers, but a complex structure. Therefore, for adjacent joints, the order of their sensitivity index size might be different from the order of mechanisms, depending on their initial amplification index. When we look at Figure 13a, which shows the difference between the first-order index and the total-order index, the difference is greater for the links close to the starting point. This is due to the fact that the clearance of the sidestay changes the geometric structure (angles of the links, etc.), affecting the amplification index of the posterior joints (link assembly); however, posterior joints cannot affect anterior joints, therefore the difference turned out to be small. As a result, the more a joint can change the geometric model, the greater its impact on the clearance, which is the result. Therefore, the relevant inspections need to be carried out more thoroughly for such joints, i.e., #1, #2, #3, #4, and #5.

4.4. Validation

When we look at the clearance of the component joints on the technical order from the manufacturer, the inspection criteria for the sidestay joints, which are close to the starting point, are stricter than the ones for the link assembly joints, which are far from the starting point [24]. The clearance is a gap that necessarily exists before joint wear occurs due to the operation of the main landing gear. Stricter criteria for this value may represent that the clearance in those joints has a greater impact on the plunger. During the sidestay rigging, the displacement of the plunger causing failure is identified by manually moving the plunger from its mid-position and then making sure there is some extra room between the displacement identified and the actual mid-position plunger displacement. The sidestay part has a greater impact on the displacement of the plunger because the sidestay rigging is related to joints #2 and #4. Therefore, we can see that the main inspection areas as selected according to the results from the sensitivity analysis can be reasonably concluded to agree with the actual areas of concern.
In order to validate the geometric model of the main landing gear, we checked whether the plunger displacement exceeded the displacement margin using clearances that caused previous failure. When a similar retraction failure occurred in the past, we found clearances in joints #3 and #5 (#3: 0.013 in, #5: 0.007 in). When the clearances were applied to the geometric model for our research, we verified that the displacement (0.0472 in) of the plunger caused by the clearances exceeded the minimum extra displacement (0.03 in). This means that even if there is an inspection procedure with some margin, retraction failure can still happen during operation of the aircraft if there is a circumstance exceeding that margin. Therefore, we determine that the geometric model of the main landing gear from this paper is valid.

5. Conclusions

Through the geometric analysis of the mechanism and the sensitivity analysis using an MCS, we identified main joints that can cause malfunction of the main landing gear with a single sidestay and a hydraulic actuator. We assumed each link from the model was a rigid body and decided on the relative positions by considering the size of the clearances. Before the sensitivity analysis, we adjusted the model using the data from the technical order. For the sensitivity analysis, we conducted an MCS, with lengths of the clearances in each joint as the input, based on an experimental design that combined Latin hypercube sampling and central composite design. The results from the MCS showed similar results to values obtained through an analytical method using an amplification index. We verified the validity of the model with a method checking the reproduction of failures, i.e., by applying the actual failure data to the geometric model. As a result of the sensitivity analysis, we saw that the clearances in joints #2, #3, #4, and #5 had the greatest impact on the plunger displacement that determines the oil path. The joints concerned were near the connecting point of the hydraulic actuator, and it was determined that the errors amplified as the joints went through other links and had a great impact on the plunger displacement. We conclude that more rigid inspection is required on the clearance of the joints concerned during inspection of the aircraft’s main landing gear. Additionally, these joints should be inspected with priority when there is a failure. In this study, we considered only in-plane clearance accumulation and will consider failure due to an out-of-plane movement of the linkage as future work. In addition, more advanced algorithms such as a genetic algorithm will be used to compare the results from a simple MCS.

Author Contributions

Conceptualization, H.C.; Writing—original draft, S.C.; Writing—review & editing, D.L. All authors have read and agreed to the published version of the manuscript.

Funding

This research received no external funding.

Institutional Review Board Statement

Not applicable.

Informed Consent Statement

Not applicable.

Data Availability Statement

Not applicable.

Conflicts of Interest

The authors declare no conflict of interest.

Nomenclature

AikAmplification index of joint k corresponding to the clearance of joint i
AiPplunger amplification index corresponding to the clearance of joint i
Iunit matrix
nnumber of joints of geometric models
n1number of repetitions at each level
n2number of levels for each variable of LHS design
Sii-th first-order index
Stii-th total-order Index
βcorrection factor for the change in the amplification rate in the course leading to the plunger after the n-th joint
εikdisplacement of joint k when there is a clearance in joint i
θangle between two links
ω normal vector of the plane

References

  1. Knowles, J.A.C.; Krauskopf, B.; Lowenberg, M.H. Numerical Continuation Applied to Landing Gear Mechanism Analysis. J. Aircr. 2011, 48, 1254–1262. [Google Scholar] [CrossRef] [Green Version]
  2. Yin, Y.; Hong, N.; Huajin, N.; Ming, Z. Reliability Analysis of Landing Gear Retraction System Influenced by Multifactors. J. Aircr. 2016, 53, 713–724. [Google Scholar] [CrossRef]
  3. Whitney, D.E.; Lozinski, C.A.; Rourke, J.M. Industrial Robot Forward Calibration Method and Results. J. Dyn. Syst. Meas. Control. Trans. ASME 1986, 108, 1–8. [Google Scholar] [CrossRef]
  4. Roth, Z.; Mooring, B.; Ravani, B. An Overview of Robot Calibration. IEEE J. Robot. Autom. 1987, 3, 377–385. [Google Scholar] [CrossRef]
  5. Khalil, W.; Caenen, J.L.; Enguehard, C. Identification and Calibration of the Geometric Parameters of Robots. In Experimental Robotics I; Springer: Berlin/Heidelberg, Germany, 1990; pp. 528–538. [Google Scholar]
  6. Jang, J.H.; Kim, S.H.; Kwak, Y.K. Calibration of geometric and non-geometric errors of an industrial robot. Robotica 2001, 19, 311–321. [Google Scholar] [CrossRef] [Green Version]
  7. Qiao, G.; Weiss, B.A. Quick health assessment for industrial robot health degradation and the supporting advanced sensing development. J. Manuf. Syst. 2018, 48, 51–59. [Google Scholar] [CrossRef] [PubMed]
  8. Judd, R.; Knasinski, A. A technique to calibrate industrial robots with experimental verification. IEEE Trans. Robot. Autom. 1990, 6, 20–30. [Google Scholar] [CrossRef]
  9. Duelen, G.; Schröer, K. Robot calibration—Method and results. Robot. Comput. Manuf. 1991, 8, 223–231. [Google Scholar] [CrossRef]
  10. Jawale, H.P.; Thorat, H.T. Investigation of Positional Error in Two Degree of Freedom Mechanism With Joint Clearance. J. Mech. Robot. 2012, 4, 011002. [Google Scholar] [CrossRef]
  11. Chase, K.W.; Gao, J.; Magleby, S.P. Generalized 2-D Tolerance Analysis of Mechanical Assemblies with Small Kinematic Adjustments. J. Des. Manuf. 1995, 5, 263–274. [Google Scholar] [CrossRef]
  12. Ting, K.-L.; Zhu, J.; Watkins, D. The effects of joint clearance on position and orientation deviation of linkages and manipulators. Mech. Mach. Theory 2000, 35, 391–401. [Google Scholar] [CrossRef]
  13. Tsai, M.-J.; Lai, T.-H. Kinematic sensitivity analysis of linkage with joint clearance based on transmission quality. Mech. Mach. Theory 2004, 39, 1189–1206. [Google Scholar] [CrossRef]
  14. Tsai, M.-J.; Lai, T.-H. Accuracy analysis of a multi-loop linkage with joint clearances. Mech. Mach. Theory 2008, 43, 1141–1157. [Google Scholar] [CrossRef]
  15. Liu, T.; Li, Z.-M.; Jin, S.; Chen, W. A Variation Analysis Method for Linkage Mechanism with Consideration of Joint Clearance and Deformation. Int. J. Precis. Eng. Manuf. 2018, 19, 1495–1506. [Google Scholar] [CrossRef]
  16. Shapiro, S.S.; Gross, A.J. Statistical Modeling Techniques; Marcel Dekker: New York, NY, USA, 1981. [Google Scholar]
  17. Beechcraft Corporation. Hawker 800XP Aircraft Maintenance Manual: Main Gear, Fairings and Doors—Description and Operation; TO XP-32-10-01-001; Beechcraft Corporation: Wichita, KS, USA, 2014; p. 2. [Google Scholar]
  18. Beechcraft Corporation. Hawker 800XP Aircraft Maintenance Manual: Reversing Valves—Description and Operation; TO XP-32-30-31-001; Beechcraft Corporation: Wichita, KS, USA, 2014; p. 1. [Google Scholar]
  19. Saltelli, A.; Ratto, M.; Andres, T.; Campolongo, F.; Cariboni, J.; Gatelli, D.; Saisana, M.; Tarantola, S. Global Sensitivity Analysis: The Primer; John Wiley & Sons: Chichester, UK, 2008. [Google Scholar]
  20. Cho, S.; Kwon, H.J.; Lee, D.; Cho, H. Study of the Effect of Joint Gap on Malfunction of Aircraft Main Landing Gear through Sensitivity Analysis. Trans. Korean Soc. Mech. Eng. A 2020, 44, 689–698. [Google Scholar] [CrossRef]
  21. Lynch, K.M.; Park, F. Modern Robotics—Mechanics, Planning, and Control; Cambridge University Press: Cambridge, UK, 2017. [Google Scholar]
  22. Beechcraft Corporation. Hawker 800XP Aircraft Maintenance Manual: Reversing Valves—Removal/Installation; TO XP-32-30-31-401; Beechcraft Corporation: Wichita, KS, USA, 2014; p. 1. [Google Scholar]
  23. Beechcraft Corporation. Hawker 800XP Aircraft Maintenance Manual: Side Stay Assembly—Removal/Installation; TO XP-32-10-25-401; Beechcraft Corporation: Wichita, KS, USA, 2014; pp. 1–2. [Google Scholar]
  24. Raytheon Aircraft Company. Hawker 800 Component Maintenance Manual: Fits and Clearnaces; TO 32-10-05; Raytheon Aircraft Company: Waltham, MA, USA, 2014; pp. 801–804. [Google Scholar]
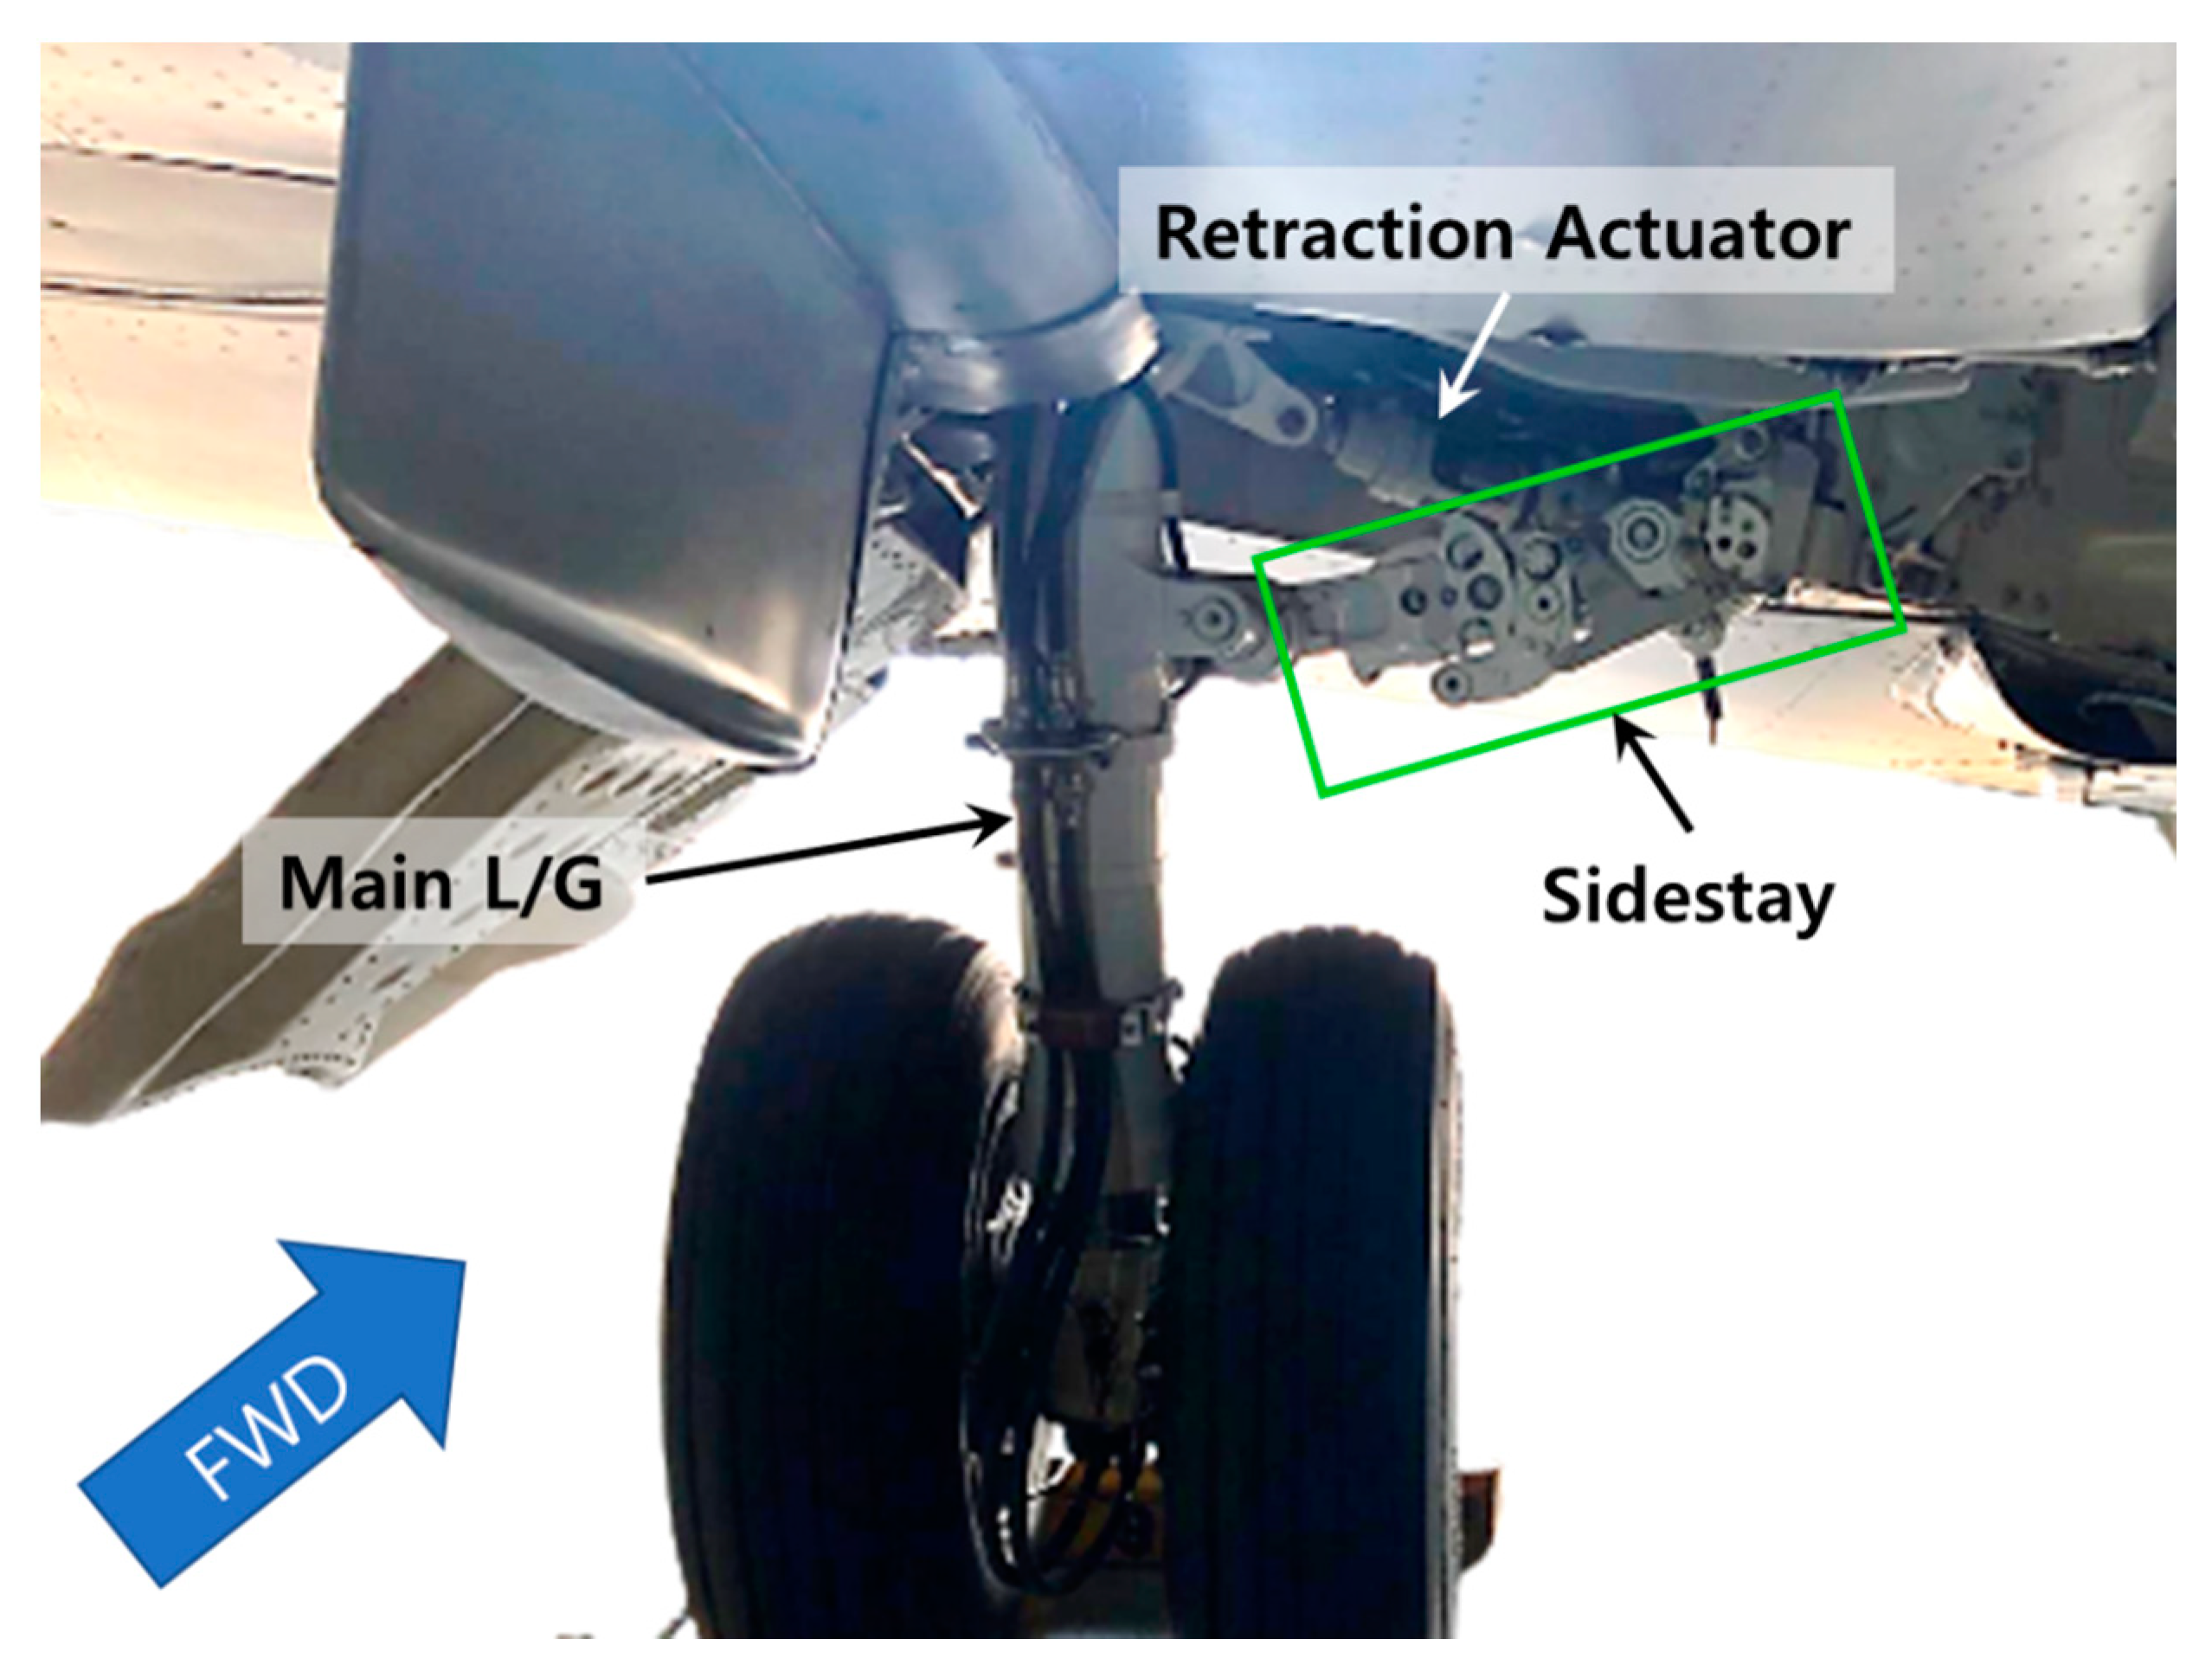
Figure 1. Hawker 800XP aircraft main landing gear structural components.
Aerospace 08 00329 g001
Figure 2. Structure diagram of Hawker 800XP aircraft main landing gear.
Aerospace 08 00329 g002
Figure 3. Hawker 800XP aircraft main landing gear sidestay, link assembly, and reversing valve in (a) Down Lock state, (b,c) initial unlock state, and (d) Moving Up state [17].
Aerospace 08 00329 g003
Figure 4. Hawker 800XP aircraft main landing gear reversing valve operational states [18].
Aerospace 08 00329 g004
Figure 5. Modified LHS design. (a) For first-order index calculation. (b) For total-order index calculation.
Aerospace 08 00329 g005
Figure 6. Simple linkage model of two links.
Aerospace 08 00329 g006
Figure 7. Hawker 800XP aircraft main landing gear joints with clearance [22,23].
Aerospace 08 00329 g007
Figure 8. Applying joint clearances. (a) Fixed point (A). (b) Point (B) between fixed points.
Aerospace 08 00329 g008
Figure 9. Amplification index. (a) Current clearance propagation. (b) Previous clearance propagation. (c) Rigid body clearance propagation.
Aerospace 08 00329 g009
Figure 10. Geometrical symmetry.
Aerospace 08 00329 g010
Figure 11. Joint coordinates of Down Lock state and initial unlock state during retraction. (a) sidestay link coordinates. (b) Link assembly coordinates.
Aerospace 08 00329 g011
Figure 12. Plunger displacement from Down Lock to Up Lock.
Aerospace 08 00329 g012
Figure 13. Sensitivity analysis results. (a) Sensitivity index (LHS) by computational method. (b) Comparison of first-order indices by computational and amplification index methods. (c) Comparison of first-order indices by experimental designs.
Aerospace 08 00329 g013aAerospace 08 00329 g013b
Publisher’s Note: MDPI stays neutral with regard to jurisdictional claims in published maps and institutional affiliations.