1. Introduction
During the Great East Japan Earthquake of March 2011, communication between the disaster response headquarters and the aircraft was through voice wireless communication devices [
1]. Then, information was collected and aggregated on the whiteboard in the disaster response headquarters. Finally, mission assignment and aircraft operation were performed based on personal judgment and experience. This kind of information sharing hinders quick and effective execution of mission assignments. Moreover, in widespread disaster areas, obstacles such as mountains could obstruct communication between the operation base and the aircraft, thus hindering relief activities. In addition, during the Sendai Airport disaster, which was at the operating base, lead response headquarters could not receive information about the affected areas; this made air relief more difficult.
Based on the experience of the 2011 earthquake in Japan, the Japan Aerospace Exploration Agency (JAXA) developed the Disaster Relief Aircraft Information Sharing Network (D-net) in 2012. This network can share necessary information between the rescue aircraft and the response headquarters during disasters to foster rescue activities via aircraft such as helicopters [
2].
This example indicates that new communication technologies are being applied in air relief activities. However, even in Japan, not all relief helicopters can be equipped with new communication devices. Communication technologies and devices are very different over different regions and may even differ in same disaster-affected areas, according to the damages caused by different scales of the disaster level.
As communication devices are updated, relief aircraft dispatch strategies differ, and geographical factors and population distribution may affect aircraft dispatch strategies. Therefore, after the development of new communication devices, it is necessary to train new devices in different strategies and places [
3].
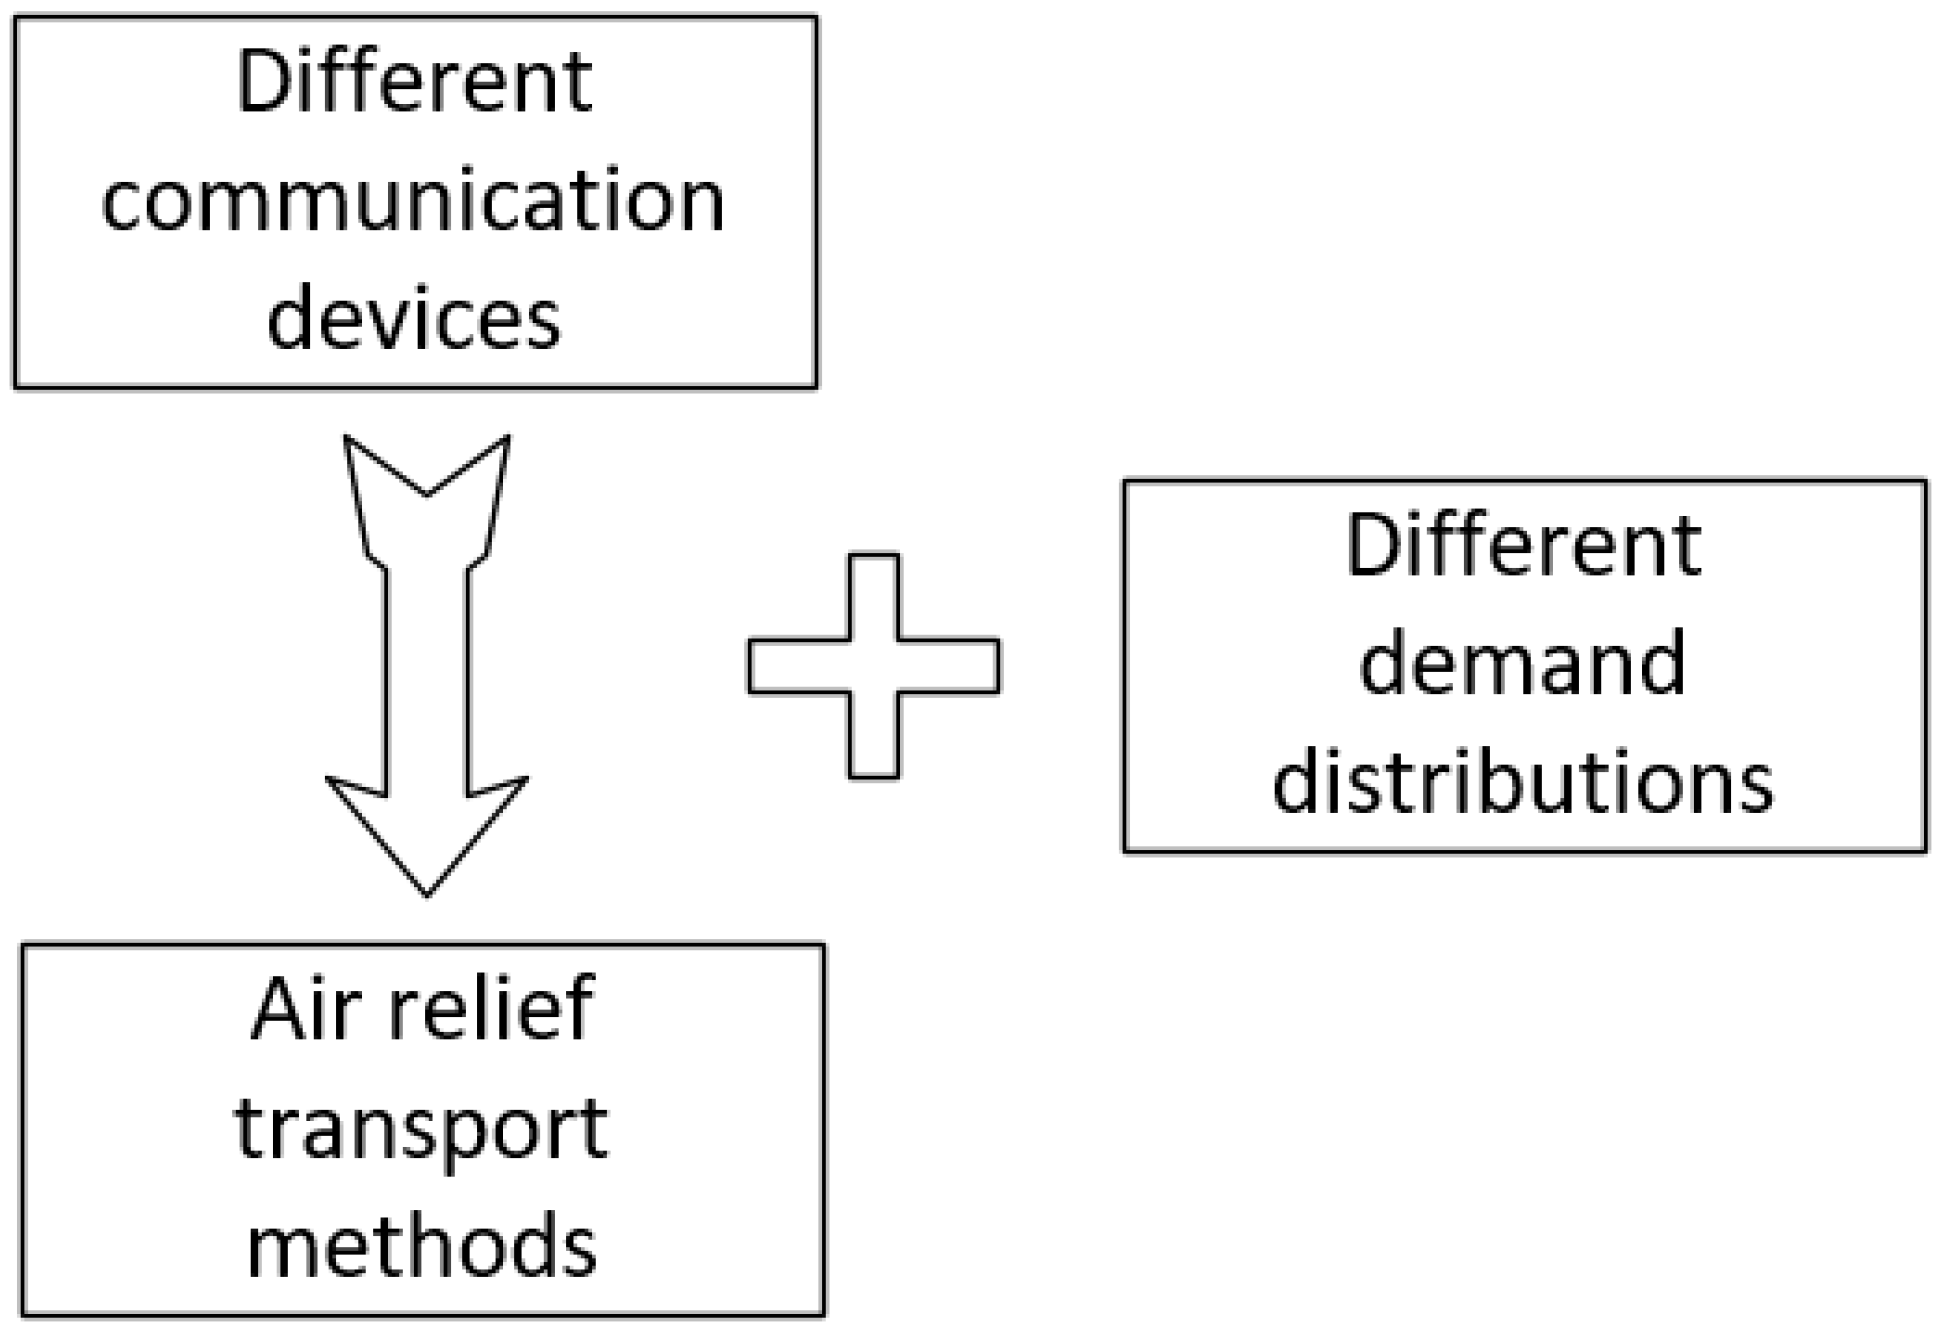
There are different communication devices applied in relief activities, and dispatch strategies can be affected by both the different communication devices and demand characteristics when disaster occurs. In this research, we plan to establish a framework for analyzing the effect of different communication devices on relief activities by combining the factor of demand distribution, as shown in
Figure 1. The purpose of our study is to assist in determining the optimal dispatch strategy based on the different levels of communication and demand characteristics in disaster relief.
Our research aims to analyze the effects of different communication methods on relief aircraft dispatch, the efficiency improvements of new communication devices for relief activities, and the effectiveness of the communication devices in dealing with different relief scenarios. We first define different information sharing levels in air relief activities and then propose aircraft dispatch methods based on these sharing levels. Finally, we analyze the effect of different transport methods in different disaster relief scenarios.
The application of communication technology has a role in all four distinct phases of disaster management: mitigation, preparedness, response, and recovery. However, in this research, we focus specifically on the response phase, which has a direct relationship with aircraft operations and is also the most critical phase for rescue activities.
We define the information sharing levels based on three main types of information used in air relief activities, as shown in
Figure 2.
Information about injuries from shelters: the information about injuries in shelter sites should be sent to response headquarters in a timely manner.
Information about injuries and corresponding flight routing before takeoff (at the airport): this information is the flight routing plan that response headquarters design for aircraft, based on received information regarding injuries.
Information about injuries and dynamic routing (in the air): this information is the dynamic flight plan that response headquarters design for aircraft, based on updated information regarding injuries.
Three typical information sharing levels were used in our research, the criterion for which are outlined in
Table 1.
If devices for the different relief agents are unavailable or damaged by a disaster, communication among different entities such as aircraft dispatchers, shelter sites, and aircraft pilots is hindered. Consequently, aircraft dispatchers will be unaware of the extent of the damage in the disaster-affected area or the number of injured persons in shelters. In such cases, relief aircraft dispatchers must send aircraft to collect information on the shelter site. Flight missions would therefore include reconnaissance missions and transportation of injured persons. In this research, we refer to the information and communication level in this kind of air rescue activity as “Level one”.
“Point to point” communication can be established and ensured through means such as equipping shelter sites and response centers with satellite telephones [
4,
5]. In this case, when a disaster (earthquake) occurs, communication between the shelter site and relief response center can be established; thus, information on the rescue shelters can be reported rapidly to relieve the response center. Based on this information, aircraft dispatchments can be performed with more explicit destinations, that is, pilots are informed about the centers before they take off. We refer to this stage of information and communication as “Level two”.
If real-time communication among different agents can be established, such as using satellite broadcasting to develop an integrated disaster information service platform [
2,
6], real-time connections among relief agents such as aircraft dispatchment centers, shelters, and pilots can be made available to support real-time rescue activities. In this case, the pilot will be aware of the destination before takeoff and can also make dynamic routing during the flight mission. We refer to this phase of information sharing as “Level three”.
Most of the demands from the affected area include food, medical aid, and injury transportation. According to Hanaoka et al. [
1], aircraft usually embark on injury transportation missions by considering the advantages of speed and the ability to easily overcome ground obstacles. Therefore, the flight mission in our model aimed at injury transportation or personnel evacuation.
The remainder of this paper is organized as follows:
Section 2 reviews existing literature on air relief activities.
Section 3 formally defines and presents a mathematical formulation of the aircraft dispatch problem.
Section 4 describes three information-sharing systems and their corresponding assignment strategies.
Section 5 briefly describes the agent-based simulation framework employed to model the dynamic system of injury centers, aircraft, and dispatch centers in airports.
Section 6 lists the experiments designed to compare different dispatch strategies and presents the computational results. Finally,
Section 7 presents the conclusion
2. Literature Review
Our research focuses on air relief activities and establishing a model that can employ different transportation strategies to dispatch aircraft based on demand requests. Hence, we refer to research and methods for real-time dispatching and route planning or dynamic route planning.
In dealing with real-time dispatchment questions, some researchers use Markov decision processes (MDPs). To improve the computational efficiency, Goodson et al. [
7] improved the traditional one-step rollout policy in the MDP by developing a pre- and post-decision state. Concerning the allocation question of emergency medical vehicles, Yoon et al. [
8] formulated an MDP model that dynamically determines the type of vehicle(s) to be dispatched. Aiming at the military medical aircraft dispatchment question, Robbins et al. [
9] presented an MDP model to optimize sequential resource allocation decisions under demand uncertainties (severity, number, and location) and service times. Several MDP models have been presented for dispatching emergency management system assets to spatially distributed patients that maximizes the fraction of patients who responded within a fixed time frame [
10,
11,
12].
Other researchers have used the framework of agent-based simulation to manage real-time dispatchment questions in different fields. This framework is widely used in researching autonomous vehicles (AVs), taxis, and rideshares. Hyland et al. [
13] utilized the framework of an agent-based simulation to model different agents, such as autonomous vehicles, travelers, and intelligent fleet operators, to compare different AV-traveler assignment strategies (control policies). Agent-based models have been designed and applied to simulate the performance and estimate the potential benefits of a sharing AV (SAV) system with dynamic ridesharing [
14,
15]. They used an agent-based simulation model to estimate different system operation scenarios to investigate the potential impact of the SAV system on urban parking demand. Fagnant et al. [
16] designed an agent-based simulation to investigate the effect of combing ridesharing programs and AVs on the total fleet size, travel distance, and emissions, similar to Martinez et al. [
17]. Regarding taxi dispatchment, Grau et al. [
18] developed a tool to understand the behavior of taxi markets to policy regulations and support decision-makers using this framework. Bischoff et al. [
19] simulated the situation of electric taxicab fleets in an inner-city. Maciejewski et al. [
20] proposed and evaluated efficient real-time taxi dispatching strategies using an agent-based simulation. Similar models have also been proposed in the literature [
21,
22,
23].
From the analysis of the literature, MDP has an advantage in the sequential resource allocation question, whereas agent-based simulation is good at comparing different strategies using different indexes. Our research is aimed at comparing various transportation methods under different information and communication systems. Hence, we select the agent-based simulation framework, which can easily calculate different indexes and combine different routing planning methods that can solve the local routing problem repeatedly.
To propose a dynamic flight method, we refer to a similar model used in taxi-dispatching or ambulance fleet management in this section.
Regarding the taxi dispatchment, Ozbaygin et al. [
24] assumed that customer itineraries may change during the execution of the planned delivery schedule and then proposed an iterative solution framework in which an active delivery schedule is re-optimized whenever a customer itinerary update is revealed. Billhardt et al. [
25] presented a new heuristic algorithm for assigning taxis to customers; the algorithm considers taxi reassignments, which may lead to globally better solutions, and an economic compensation scheme, to incentivize private drivers to agree with the proposed modifications in their assigned clients. Liao et al. [
26] proposed a two-stage framework to solve the dynamic vehicle routing problem. In the second stage, the original plan was improved by considering real-time information, similar to Liao et al. [
27]. Mahmassani et al. [
28] considered not only the nearest idle taxi to travelers but also idle and enroute drop-off AVs in the assignment to manage dynamic planning. Ma et al. [
29] designed ridesharing schedules to serve dynamic requests. Andersson et al. [
30] proposed a nearest-idle ambulance policy for ambulance dispatchment. Haghani et al. [
31] jointly considered ambulance dispatch and relocation. Schmid et al. [
32] employed approximate dynamic programming methods to solve ambulance dispatching and relocation.
These taxi and ambulance dispatching models are similar to real-time air-relief dispatchments. However, taxi dispatch considers the changes in demand or traffic information to make some changes to the planned routing. Moreover, ambulance dispatchers usually consider the change in the spatial distribution of the patients to re-optimize the dispatching and location of ambulances. Herein, we focus on the continuous effect of different transport strategies handling real-time demand requests in relief activities based on the different levels of information sharing systems. We believe that the integration of these transport methods with different information-sharing systems is meaningful to the objective of this study.
3. Model Establishment
In this research, our main aim is to compare the efficiency of different information sharing levels in air relief activities. To facilitate the modeling, we analyze the efficiency of different dispatch strategies, based on the different information sharing levels. This is a sequential optimization problem, which includes demand inputs to inform aircraft dispatchment decisions based on received information in real-time. We take an iterative approach to optimization, incorporating new information to obtain the optimal result. In this section, the characteristics of our aims are analyzed and an overall model is proposed. Different transport strategies for iterative optimization are proposed based on different information sharing levels in
Section 4.
Section 5 introduces the simulation structure used in this research.
Based on past relief activities (Hanaoka et al. [
1]), the demand requests from affected areas are generally reported to local authorities or relief response centers. Then, the authorities or centers transfer these requests to aircraft dispatchment centers in the airport to arrange relief aircraft transportation of persons to hospitals or designated locations. In this research, we simplify this process as follows: demand requests (injuries or personnel) can be reported from the shelter sites to aircraft dispatchment centers in airports; then, aircraft dispatchers can send aircrafts to these shelter sites and transport the injured to the airport. Besides, in actual air relief activities, the demand is usually greater than the actual transportation capacity. Thus, prediction of future demand is not usually considered.
Therefore, this study considers an aircraft fleet transporting the injured back to the airport based on the requests from rescue centers that are updated throughout a finite horizon. Moreover, aircraft dispatchers cannot determine or forecast future requests.
Figure 3 shows an overview of the temporal nature of the problem. At the instance “now,” the fleet operator has complete information about past injury requests, and the dispatchment center could assign the aircraft based on the injury requests and available aircraft. However, they have no information about future injury requests.
Our model is a type of sequential optimization problem [
13,
33]. Here, we use the Bellman equation to provide a solution approach:
where
St is the state of the system at time
t, which contains the states of all the agents such as demand reports, aircraft, and dispatch centers,
xt is the decision variable, which denotes the assignment of the aircraft to the demand request,
C(
St,
xt) is the summary objective value of the system in state
S at time
t,
Vt(
s) represents the objective value of the system in state
S at time
t and
s* is the state of a part of the system at time
t + 1.
Based on this, we can compare several policies that differ in their method used in solving the local optimization problem
Min{
C(
St,xt)}. These different policies are implemented when the system finds unprocessed reported requests and available aircraft simultaneously:
where
x is the decision variable at time
t,
At is the set of available aircraft at time
t and
Rt is the set of requests at time
t.
Equation (2) minimizes the overall distance covered in transporting the injured, which is the objective whenever the policy is implemented. Equation (3) indicates that any chosen aircraft can be assigned to one shelter. Equation (4) indicates that any chosen shelter can be dispatched to one aircraft.
4. Dispatch Strategy Based on the Information Sharing System
In this section, we introduce different information-sharing systems and the corresponding dispatching strategies. In our model, the information sharing system includes three main agents: rescue shelters, aircraft, and aircraft dispatchment centers. Different information-sharing systems mean different information structures among different agents. This section introduces the mutual reaction of agents in different information-sharing systems and proposes corresponding transported strategies. These strategies are embedded in the simulation.
4.1. Level One and Corresponding Transportation Method
In Level one, there is no information sharing among aircraft dispatchers, shelters, and aircraft pilots. This means that aircraft dispatchers and pilots do not know any information beforehand. Moreover, the shelters have no device to report the number of injuries to the aircraft dispatchment centers. In this case, the information about injuries can be obtained if the dispatchment center sends aircraft to a random rescue shelter to conduct “reconnaissance and rescue” [
1,
34], as shown in
Figure 4.
Under this condition, the dispatch center could dispatch the aircraft to perform two kinds of missions: First, the center could assign all the available aircraft to obtain information about the rescue shelters, and if any injuries are present, the aircraft could transport the injured back to the airport. The second is that the dispatch center could dispatch aircraft to undertake rescue missions.
4.2. Level Two and Corresponding Transportation Method
In Level two, there is communication between the shelters and airports. In this case, the shelters could report the number of injuries to the airport operation center, as shown in
Figure 5. Then, dispatchers could assign the aircraft based on the reported request from the rescue shelters.
In this case, the dispatchment center has information on the number and location of injuries. The dispatchment center can design a flight route before take-off. Hence, we propose two dispatch methods: “one-destination” and “multiple-destinations”.
4.2.1. One-Destination Strategy
Here, one flight has only one destination (one rescue shelter). It is a common dispatch method for disaster relief activities [
1,
35]. According to the reported injury request, the dispatchment center assigns one aircraft to one rescue shelter. Upon arrival at the rescue center, the aircraft collects as many injured persons as possible and returns to the airport directly. This method is a traditional and conservative dispatchment method. It is easy and quick to assign and recycle aircraft.
However, each aircraft has only one destination, and the aircraft capacity might not be utilized fully if the number of injuries in some rescue centers is less than the aircraft capacity. Therefore, a multiple-destination strategy is proposed.
4.2.2. Multiple-Destination Strategies
Considering the shortcomings of the one-destination strategy, one flight can be assigned with several rescue shelters. Each time requests are received from the disaster area, all the available aircraft are identified, and then a flight route is designed considering all of them. This method can be referred to as a split delivery vehicle routing problem.
For this local objective, it is necessary to determine the number of aircraft At and number of requests Rt of the local optimization through the reported requests and available aircraft. If the reported requests are larger than the total capacity of the available aircraft, requests are selected by the principle of first-come and first-serve. The remaining requests are not assigned until there are available aircraft. If the total capacity of the aircraft is larger than the reported requests, the number of aircraft could be the rounded-up value of (total requests/capacity of a single aircraft):
where
CapacityA is the capacity of all the available aircraft,
CapacityS is the capacity of a single aircraft,
Rreport denotes the set of all the unprocessed reported requests and
R* denotes the set of requests that would be considered as local question.
To solve this optimization model, simulated annealing is utilized. For details, please refer to
Appendix A.
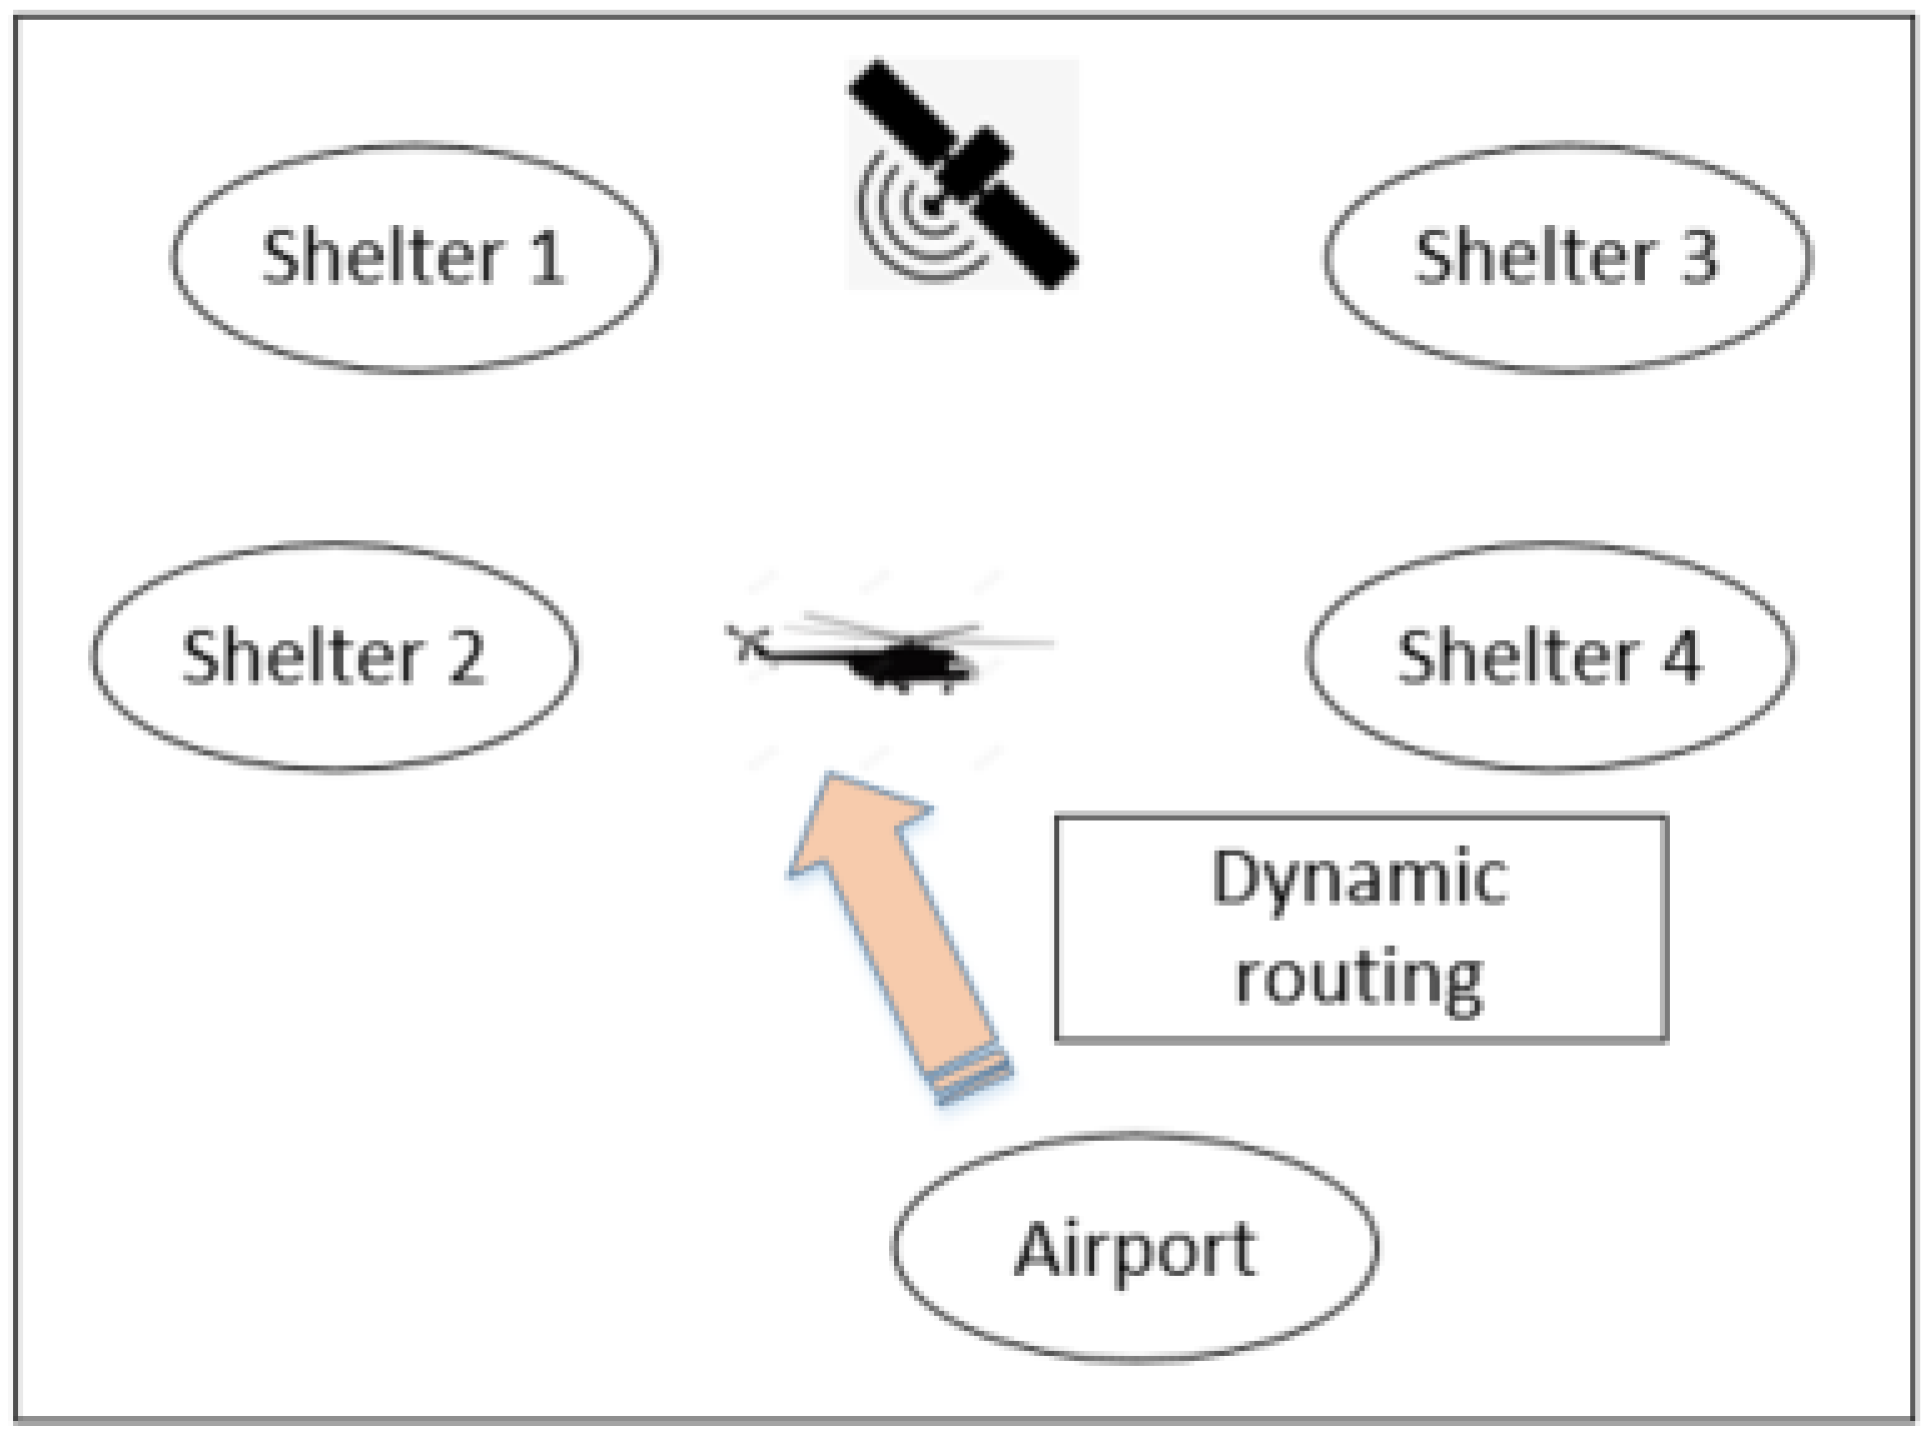
4.3. Level Three and Corresponding Transportation Method
In Level three, not only can the shelters report the number of injuries to the airport, but pilots can also access real-time information about the rescue shelters, as shown in
Figure 6. In this case, the aircraft can perform dynamic routing based on real-time demand information. This means that the aircraft could be assigned to another shelter if it still has sufficient capacity left after severing the first shelter.
In the dynamic routing planning strategy, first, aircraft are assigned to a shelter based on requests, similar to the “one-destination” method. Then, after severing the planned shelter, the aircraft pilot determines whether there is any remaining capacity. If so, the pilot connects to the dispatch center and identifies another shelter. Considering the fuel and injured already on board, dynamic routing in this study is performed only once in one flight mission.
From the description, we can consider that this method is more flexible than the “one-destination” and “multiple-destination” strategies. If there is remaining capacity after servicing one shelter, the pilot can report to the headquarters to take-off to another shelter, which is better than the “one destination” method. If the aircraft arrives at one shelter and finds that the injured are more than the reported request, it serves to full capacity at that location. However, in the same situation, the “multiple-destination” method would have to collect persons and travel to the next planned shelter. Thus, this is better than the “multiple-destinations” strategy. Although we did not conduct numerical experiments, from the analysis above we can conclude that the “dynamic routing” is more flexible and effective in managing the uncertainty between the reported requests before takeoff and the actual mission at the shelter.
In fact, we proposed transport methods based on the characteristic of corresponding level of information sharing. Some methods are being used in relief activities, such as “reconnaissance and rescue” and “one flight one destination”. Others, such as “multiple destinations” and “dynamic”, have been used in practice in ground transport or discussed in literature [
36]. Further, the reason we choose these methods is that they represent the characteristics of different levels of sharing information. We want to compare different information systems by comparing different transport methods, which is the main purpose of this research.
5. Simulation
In this study, we compared different strategies by utilizing an agent-based simulation framework. In agent-based modeling, we can identify individual active components of a system, define their behaviors, and establish connections between them. The global dynamics of the system can emerge from the interactions of the many individual behaviors. Besides, it is also convenient to obtain various indicators for analysis.
Therefore, we adopted an agent-based simulation tool to model the dynamic system of relief aircraft, rescue shelters, and dispatchment centers. The different strategies are embedded in the simulation to compare the effect of the relief activities using different indexes.
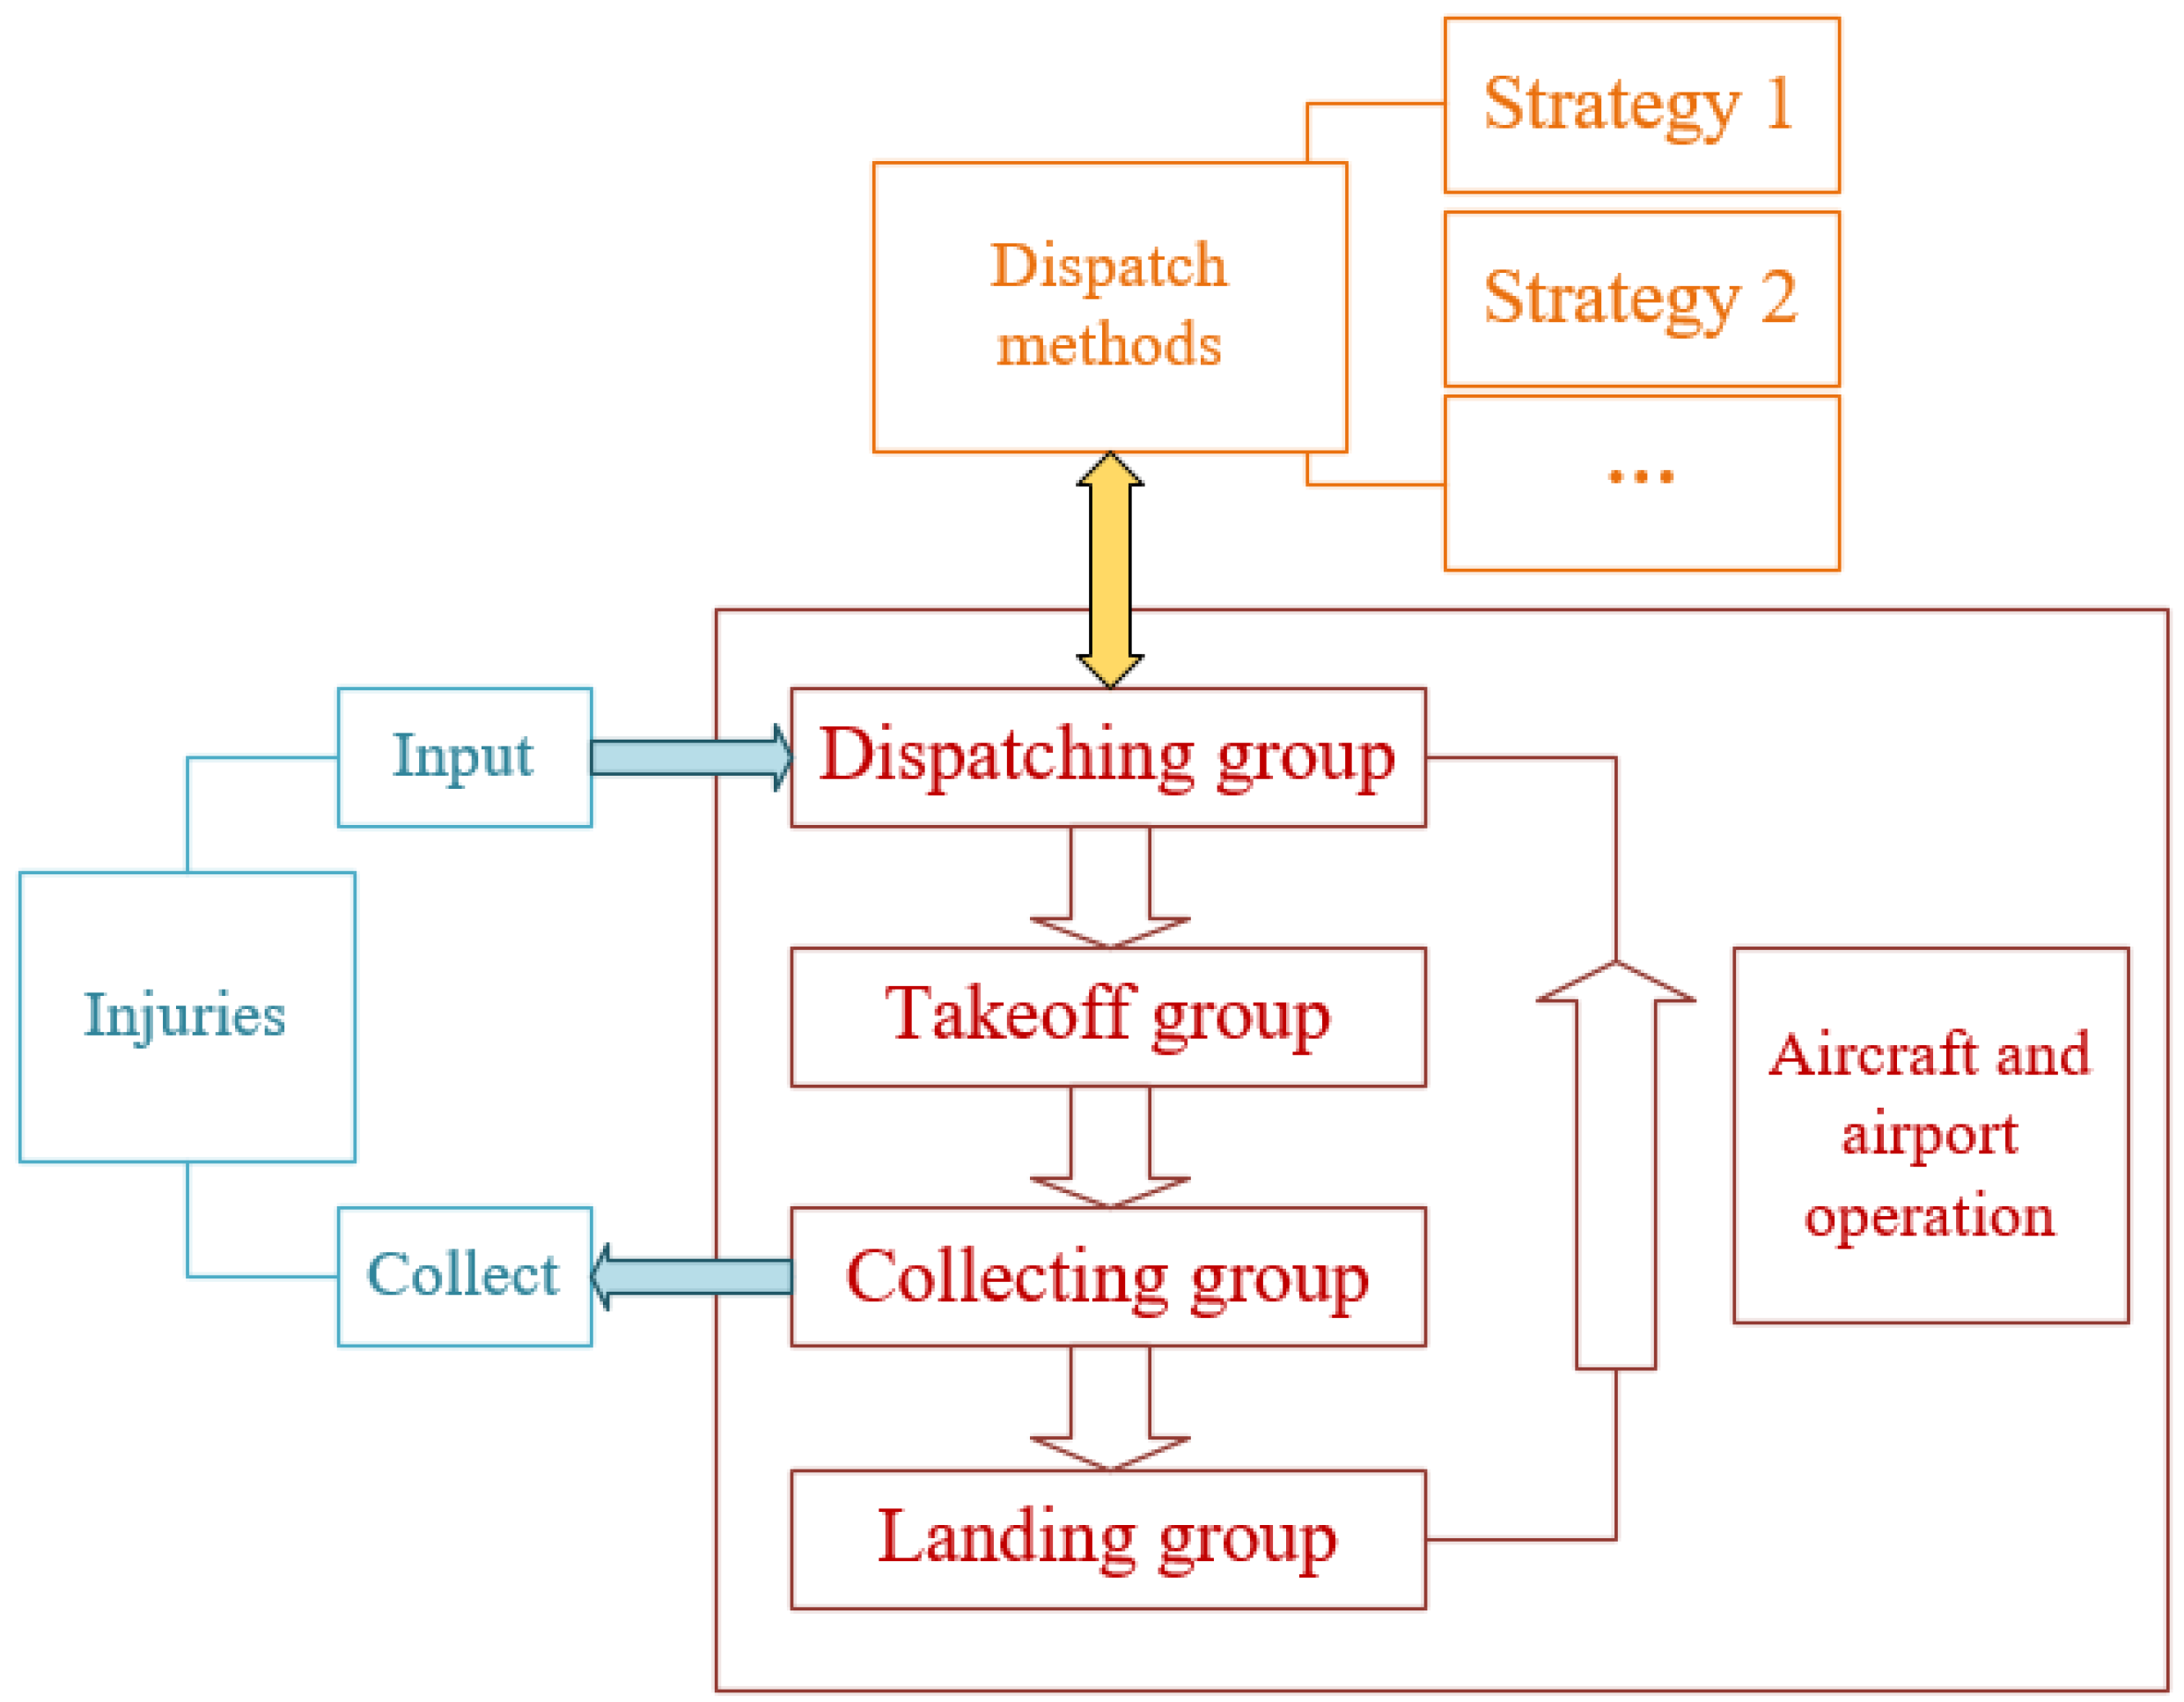
This simulation has several components, as shown in
Figure 7: injury data, airport operation, and dispatch strategies. The injury data are the input requests from the shelter, which are introduced in the numerical section. The dispatch strategies, which were embedded in this simulation, have been explained in the previous section. This section focuses on the aircraft operation process.
In this simulation, each aircraft has four states: take-off, updating the injuries, landing, and dispatching. Hence, we set four corresponding aircraft groups and place the aircraft with similar states in the same group. This simulation determines the state of the aircraft in each group and updates these groups every minute. The following is a description of the different aircraft groups:
Takeoff group:
The simulation first updates the takeoff group. In this group, the aircraft have been assigned both the planned flight routing and time from the dispatch group (which is explained later). Each minute, the simulation simultaneously checks the planned takeoff time and the runway slot. If the aircraft’s planned takeoff time is appropriate with any vacant runway slot, then the aircraft enters the next aircraft group, collecting group, and is removed from the takeoff group. If the aircraft’s planned takeoff time is not appropriate in the runway slot, its planned time could be delayed to wait for the next check.
Collecting group:
In this group, each aircraft takes off and travels to the planned rescue center according to the planned routing. Upon arrival at a rescue shelter, the aircraft collects the injured. When it completes the various planned destinations, it enters the landing group and is removed from the collecting group.
Landing group:
The simulation checks the planned landing time and runway slot. If the planned landing time is suitable in the runway slot, the aircraft is removed from the landing group and enters the dispatching group. If there is no suitable runway slot for the landing time, it is delayed until the next check.
Dispatching group:
This part embeds different modules according to the different strategies. Each aircraft in this group is waiting to be assigned a planned routing and flight time. When a new injury request comes into the simulation system, the system checks the available aircraft and then employs different strategies to arrange a planned routing and flight time to the aircraft. After this, the aircraft is removed from this group into the takeoff group.
6. Numerical Experiments
This section presents a numerical experiment to compare different transportation strategies based on the metrics. In this research, we used three metrics: total flight time, finished time, and average waiting time. The total flight time is the total time of all flight missions in the relief activities. The finished time is the landing time of the last relief flight in the relief activities. The average waiting time is the average duration time from arrival at the shelter to the injured boarding.
6.1. Artificial Designed Demand
From past relief activities, all data on transportation injury constituted the number of total rescued injuries in all relief activities or on some days. Most of the relief data are confidential and unavailable to the public. It is, thus, difficult to access the injury information. Hence, in this study, we used more general artificial data.
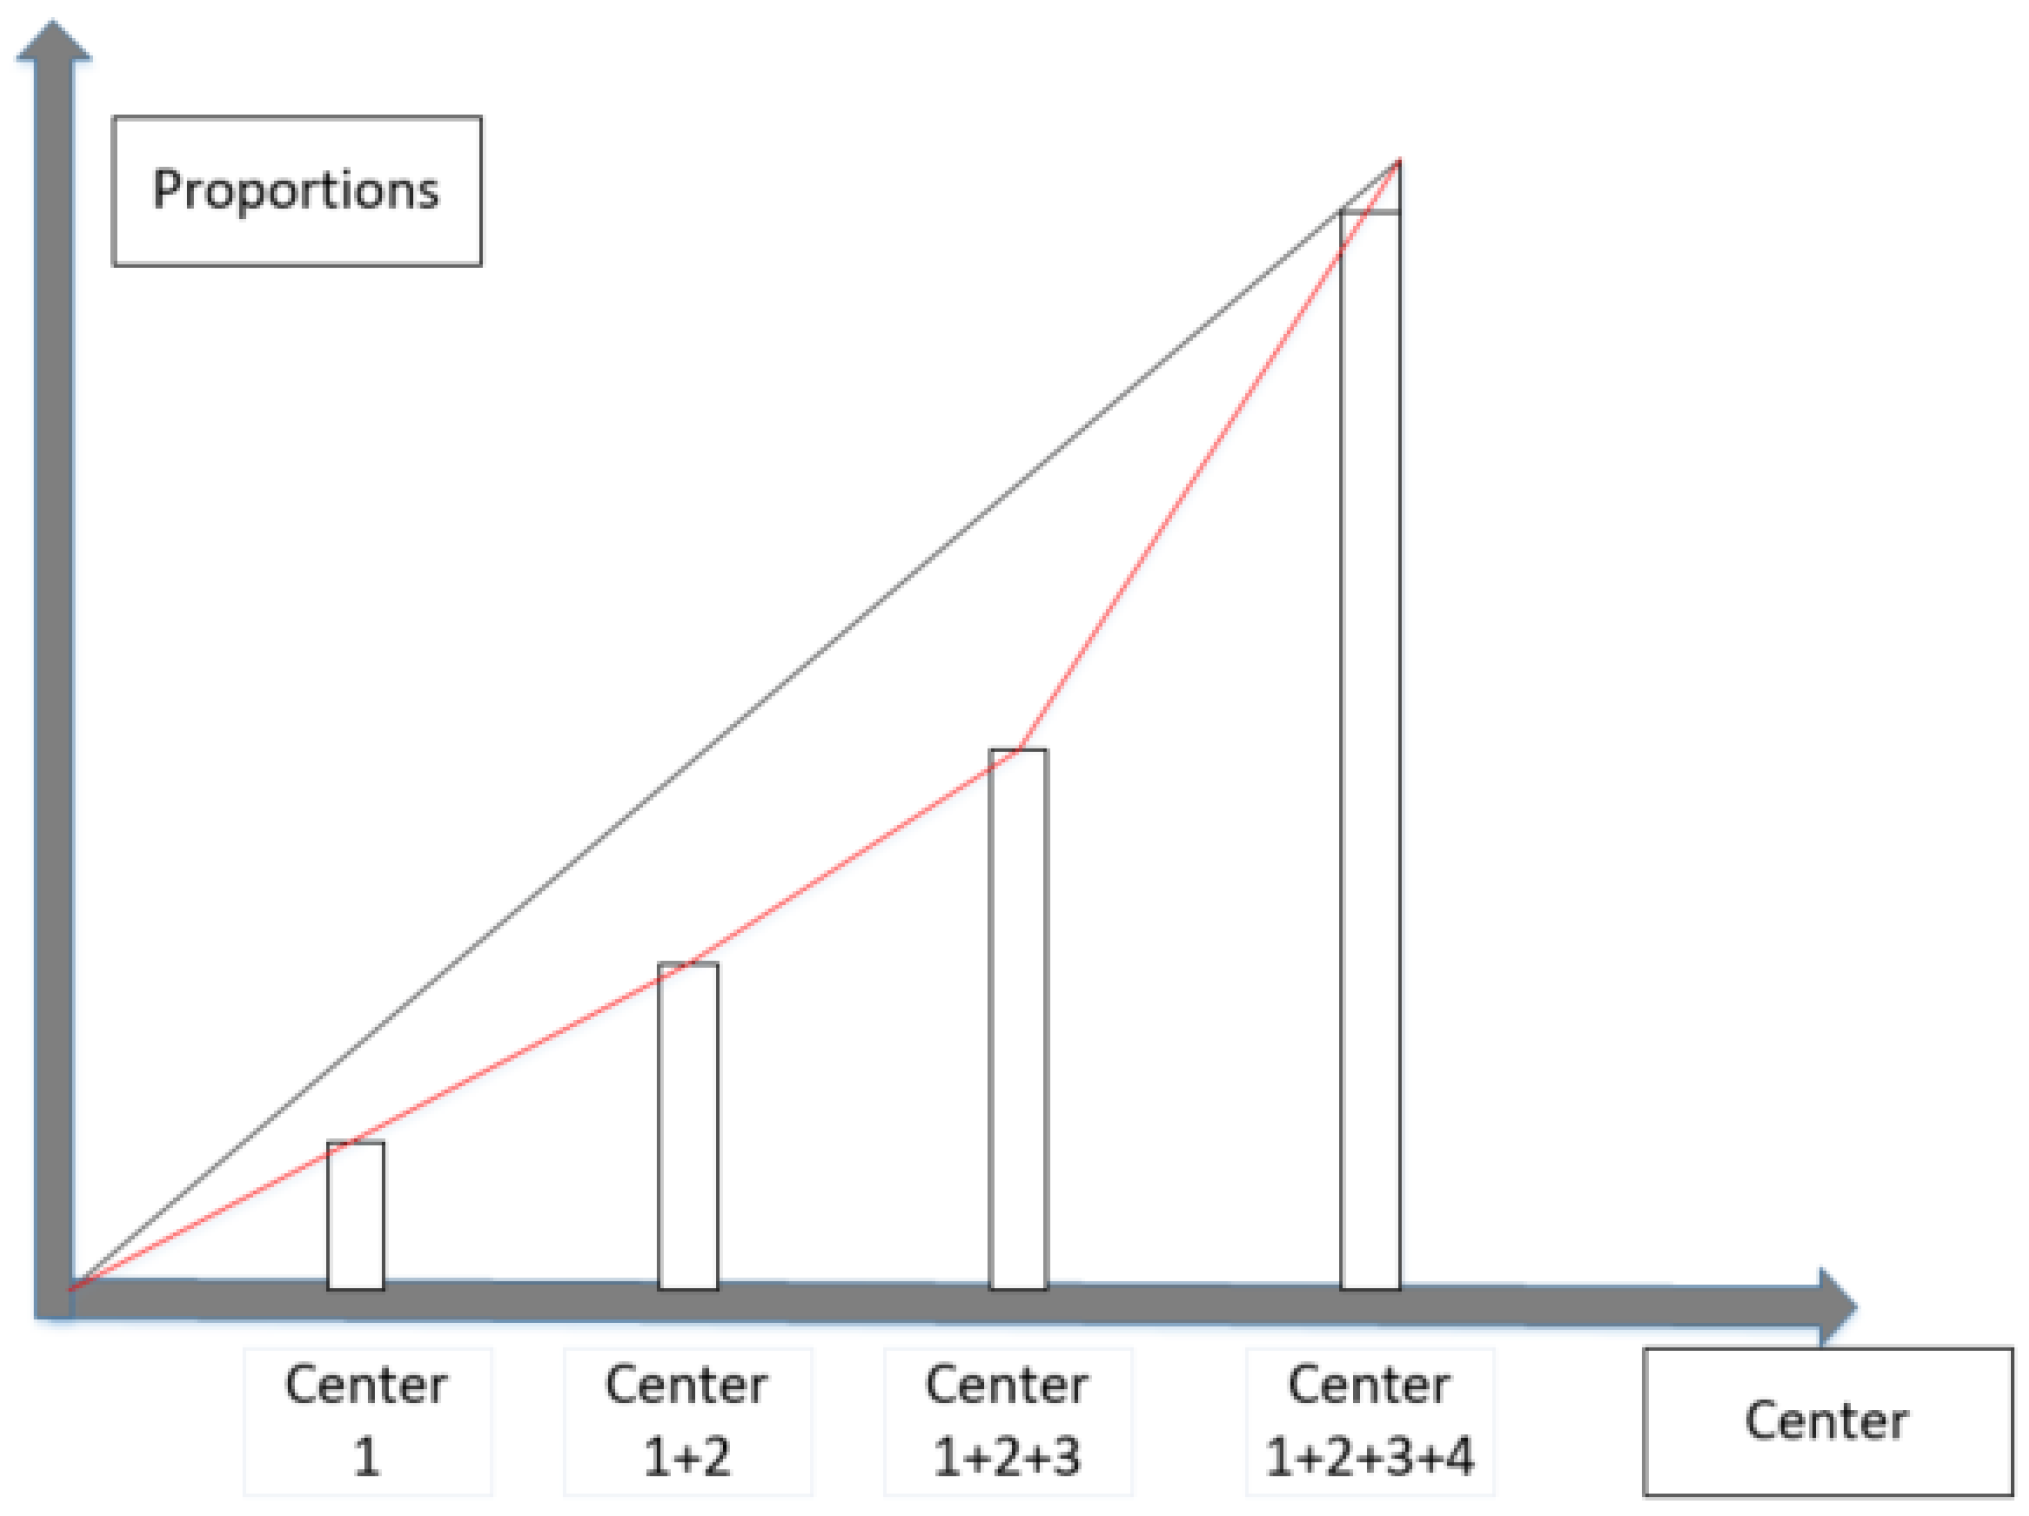
We update the injured every time interval, and each time the inputs in each shelter are determined by the demand/capacity (D/C) and the Gini coefficient, as shown in
Figure 8. D/C is the proportion of the total number of injured (demand) in all shelters and the capacity of all the aircraft that can satisfy the total demands of all shelters for each time input. The Gini coefficient indicates the degree of imbalance among shelters, which can determine the proportion of each shelter. The demand of each shelter for each time input can be determined based on the total demand of all shelters and the proportion of each shelter. The Gini coefficient is defined as follows:
In
Figure 8, there are four shelters.
I1,
I2,
I3, and
I4 (in ascending order) that indicate the number of injured in each shelter. The Gini coefficient can be calculated as follows:
A larger Gini coefficient indicates a significant unbalanced demand distribution among these shelters. By setting different D/C and Gini coefficients, we can simulate different general situations to test our model.
6.2. Result of Numerical Experiment
In this section, we performed simulations using different Gini coefficients and D/C ratios. To make our experiment more representative, we designed 20 cases, including different demand imbalance degrees and different demand/capacity ratios, as shown in
Table 2. For each case, we simulated our four transport methods (three different information sharing levels) and analyzed the result using three indicators (total flight time, relief activities finishing time, and waiting time per injury). In this simulation, the injuries in each case are listed in
Appendix B. For each case, the input was unchanged. From the beginning of the simulation, the increase in injuries for each shelter was input at 60-min intervals until the simulation had run for 5 h. At this point, the injuries stopped updating, but the simulation did not stop until all the injured persons were transported. The parameters used in the simulation are listed in
Table 3. The results of the simulation are summarized in
Table 4.
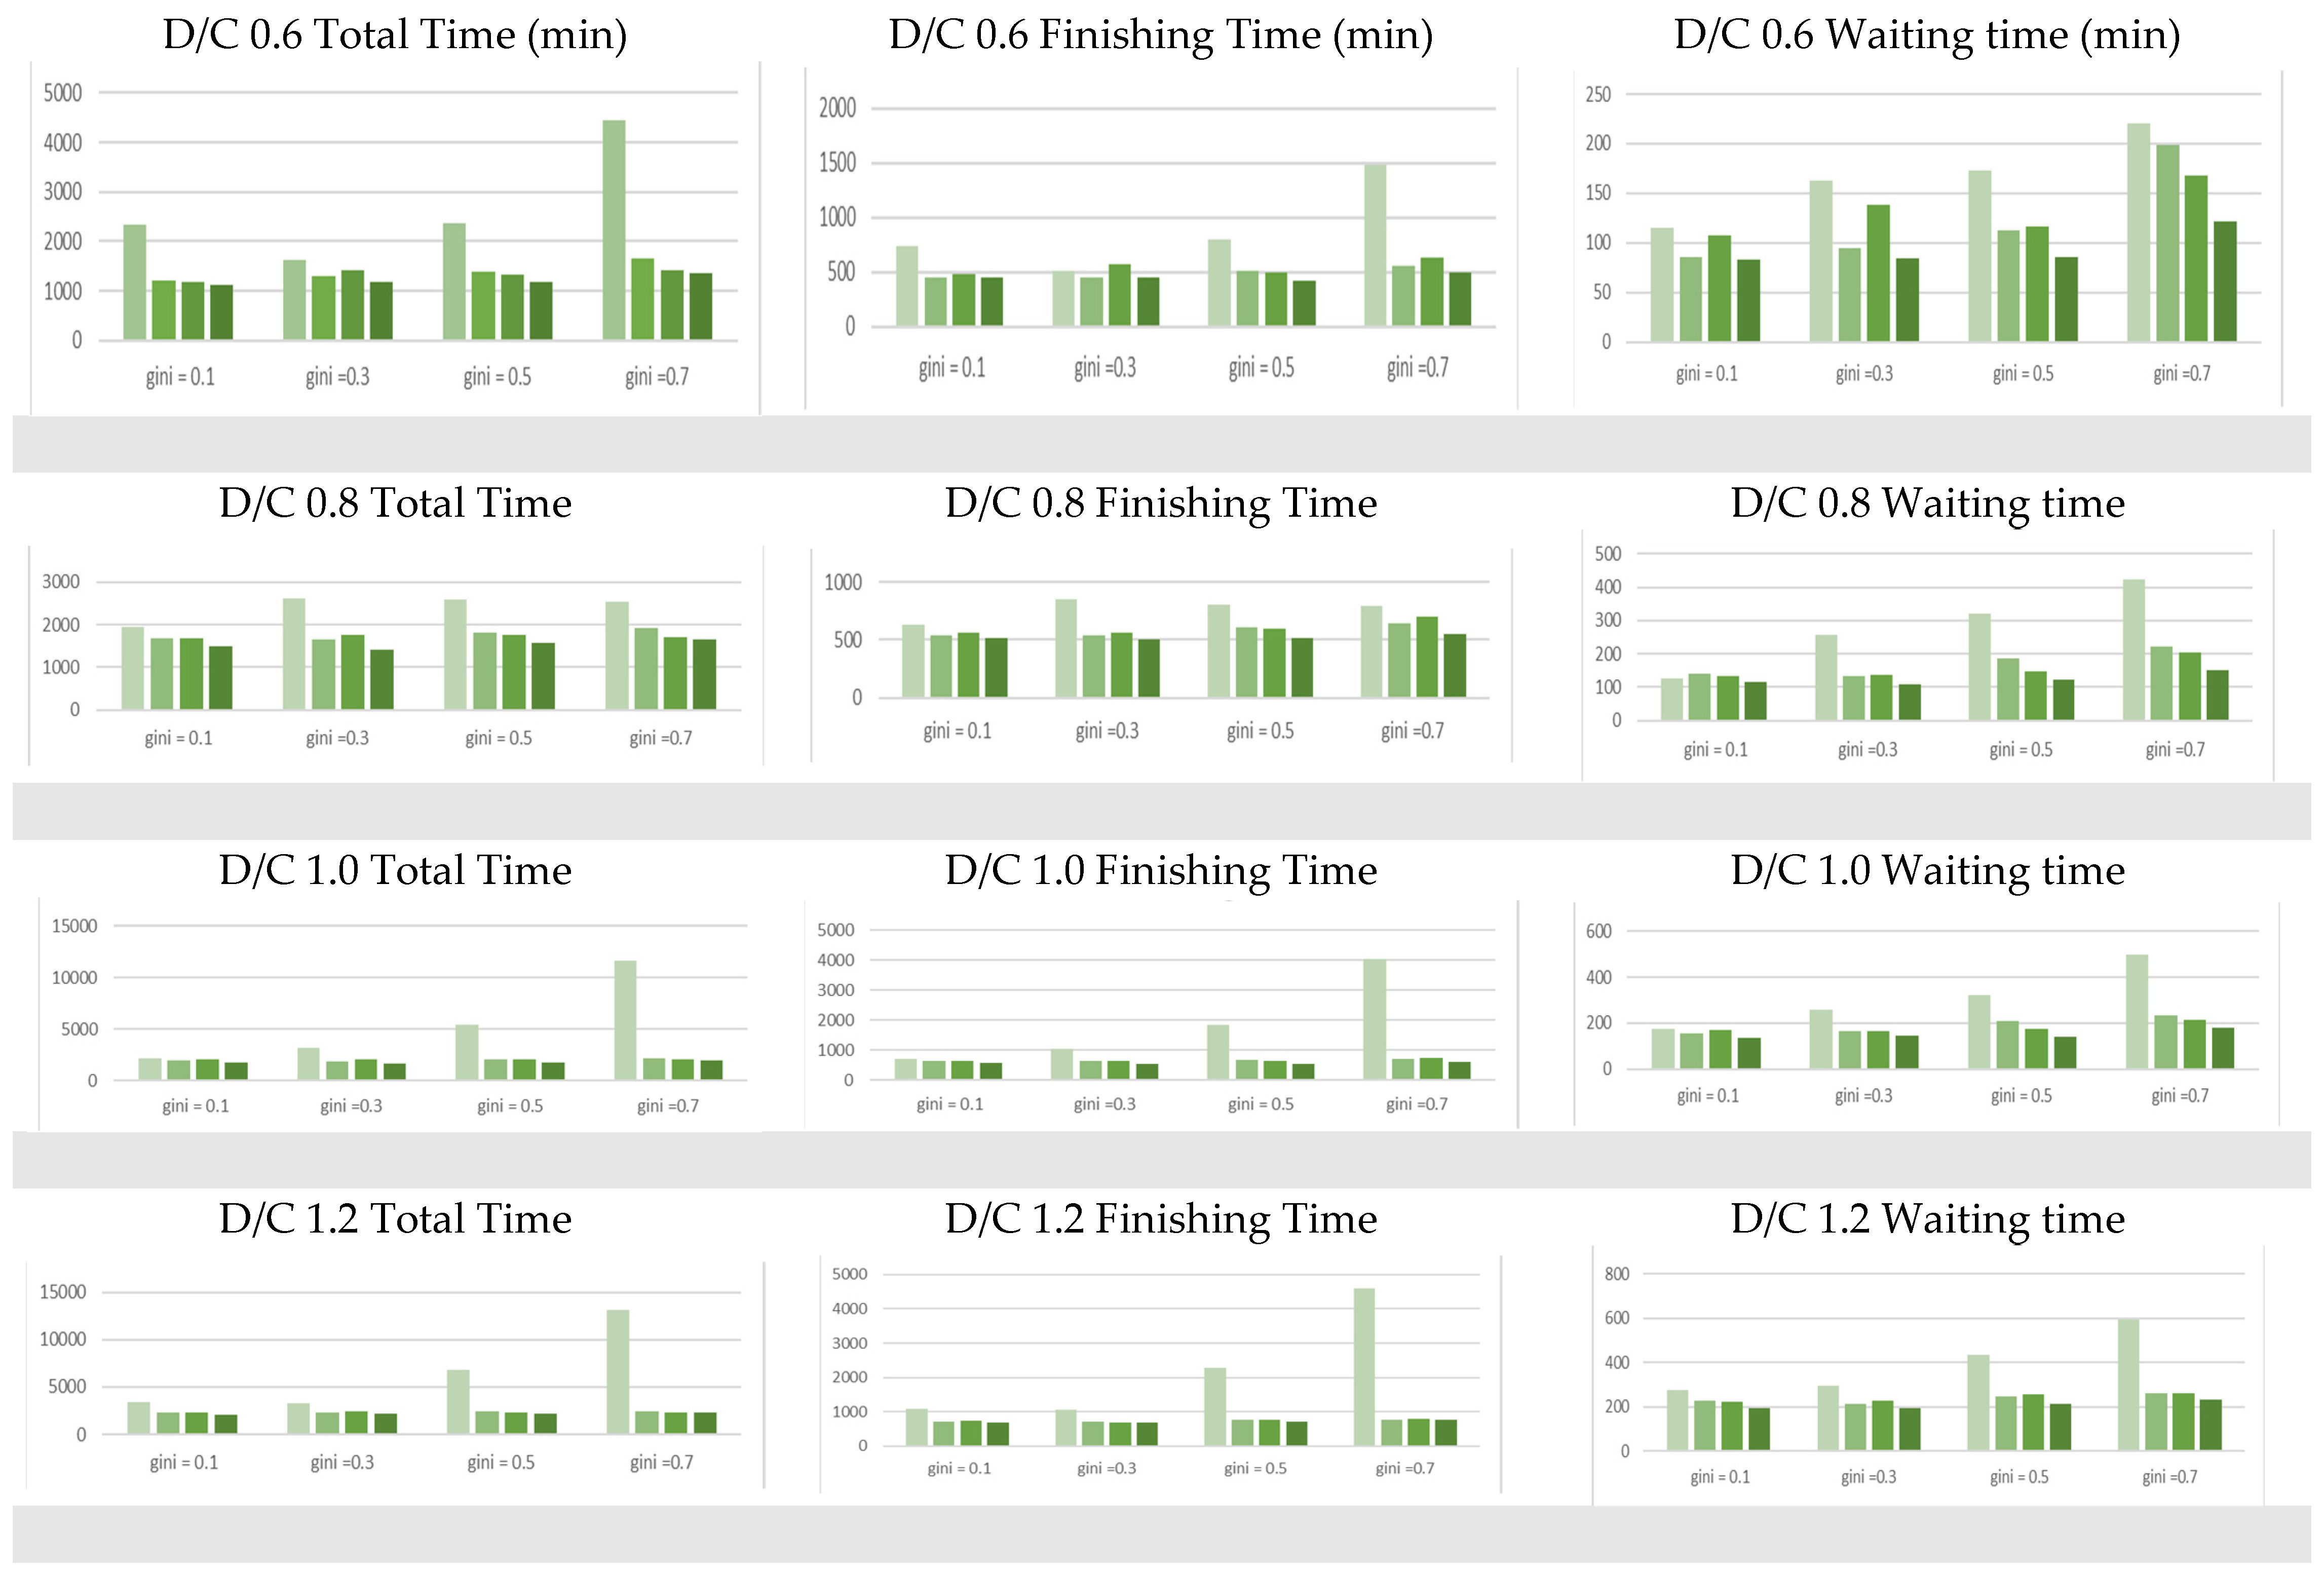
To simplify the interpretation of the results, we converted the data from a tabular form into the charts shown in
Figure 9. The left column indicates the total time (in minutes) of the different methods using different D/Cs and Gini coefficients, the middle column shows the finishing time (in minutes), and the right column shows the waiting time (in minutes). Each row represents a different D/C ratio. In each figure, there are four categories representing different Gini coefficients. In each Gini histogram, different shades of green bars represent different transport methods. Based on
Table 4 and
Figure 9, alongside previous analysis, we can now answer the questions posed in
Section 1.
6.2.1. Effects of Different Communication Methods on Relief Aircraft Dispatch
In
Section 4, we proposed corresponding transport methods based on different information sharing levels. The dispatchment methods are based on the characteristics of different information sharing levels.
Based on the simulation result, we can further analyze the most suitable scenario for each transport method. From
Figure 9, we can see that the “reconnaissance and rescue” method is better when the Gini coefficient is 0.1 or 0.3. In this case, almost all the shelters have injuries to be evacuated. Even if there is no information from the shelter sites, as long as aircraft are dispatched to a shelter, they can bring some injuries back.
The “one destination” method in level two is more suitable to scenarios where D/C is smaller than 1 and the Gini coefficient is 0.1 or 0.3. In these cases, the available aircraft exceed the demand, and the distribution of injuries is even. Although this is a simple method, it remains efficient.
The “multiple destinations” method in level two is more suitable to scenarios where D/C is smaller than 1 and the Gini coefficient is 0.5 or 0.7. Due to the extremely uneven distribution of injuries, some shelters may have more injuries than the capacity of the aircraft, while others may have few injuries. Therefore the “multiple destinations” method is more suitable for this extreme distribution.
The “dynamic transport” method is best in every scenario. In fact, this method combines the advantages of the two methods in level two. In particular, it has the best performance for waiting times.
6.2.2. Improvements in Information Sharing for the Efficiency of Relief Activities
- (1)
“Reconnaissance and rescue” (the one-level method) always has the worst transportation efficiency in the total flight time, finishing time, and waiting time, especially when the Gini coefficient is large. This is because in “reconnaissance and rescue,” there is no information communication between the aircraft dispatchers and shelters. In this case, aircraft dispatchers need to keep sending aircraft to collect information. There are some cases where the aircraft travels without any injured persons, which leads to worse total flight time, finishing time, and waiting time. When the Gini coefficient is large enough, although there may be very few injured in some shelters, dispatchers still need to keep sending aircraft for further updates on the situation in the shelter. This results in a greater waste in the flight resources.
- (2)
Dynamic routing (Level three) is better than both methods in Level two, especially when the D/C is smaller and the Gini coefficient is larger. This is because, in this case, a single flight to a destination cannot make the best use of the aircraft capacity, and the total number of injured does not match the total capacity of the aircraft fleet. Moreover, the multiple-destination method is not very flexible. Thus, dynamic routing is the best option.
6.2.3. Effectiveness of Different Levels of Information for Dealing with Different Relief Scenarios
- (1)
The Gini coefficient and D/C affect the effectiveness of the transport methods.
Table 4 and
Figure 9 show that a larger Gini coefficient in the same D/C or larger D/C in the same Gini coefficient could increase the flight time, finishing time, and waiting time.
- (2)
When D/C is larger than 1 (such as 1.2 or 1.4), the methods in Level two and three mostly have the same performance. In this case, when the Gini coefficient is smaller, the demand in each shelter is often larger than the aircraft capacity; thus, the injured in one shelter can be transported by a single aircraft. When the Gini coefficient is larger, most demand is focused on one or two shelters, and thus, other shelters do not consume as much flight resources. Hence, when D/C is larger than 1, regardless of the Gini coefficient, the methods in Level two and Level three have the same performance.
- (3)
When D/C is smaller than 1, the difference between the two methods can be seen at Level two. One destination (two-I) is better than multiple destinations when the Gini coefficient is smaller (such as 0.1 or 0.3), whereas multiple destinations are better when the Gini coefficient is larger (such as 0.5 or 0.7). This is because when D/C is smaller than 1 and the Gini coefficient is small, there are sufficient flight resources and the injured in each shelter may be less than the capacity of the aircraft. Under these conditions, the one-destination method is fast and efficient. When D/C is smaller than 1 and the Gini coefficient is large, more flight resources are available, but the distribution of the demand is imbalanced. In some shelters, the injured might exceed the capacity of the aircraft. In this condition, multiple destinations could be better.
6.2.4. Implications for Air Rescue Operations
From the results of the numerical experiment, we can provide the following implications for achieving more efficient operations on air rescue:
- (1)
The information-sharing level or communication system in air relief activities is extremely important, and the level of the information-sharing system determines the optimal aircraft dispatch strategies. Based on this numerical experiment, different agents (aircraft, airports, and shelters) and involved organizations (medical teams, fire departments, response headquarters, etc.) could be connected by an integrated information-sharing system that could improve relief efficiency.
- (2)
To determine which strategies must be implemented, it is necessary to consider the information sharing level, demand distribution, and disaster level. Our simulation has proved that the total amount and distribution of demands could affect the result of dispatch strategies. Therefore, a suitable strategy must be employed according to different scenarios.
- (3)
In a single relief activity, the demand distributions and communication systems could vary with the relief phases. For example, at the beginning of the relief, the information system used is “Level one”. After communication devices recovering, the information sharing level is improved.
7. Conclusions
In air rescue activities during a large-scale disaster, different communication devices among the different stakeholders, such as whiteboard, satellite telephone, and real-time devices (D-net), are utilized for sharing information. This study aimed to quantify the effect of the different information-sharing systems on the efficiency of air relief activities.
First, we defined an information-sharing system in three levels: no communication among different entities; part of the entities could be in contact (usually rescue shelters and rescue centers), and real-time communication among all entities. Second, based on the properties of different information-sharing levels, we proposed different transportation methods. Third, we utilized an agent-based simulation to embed different aircraft dispatchment methods into air relief activities. Finally, by comparing different methods under different scenarios of the D/C ratio and Gini coefficient (demand imbalance), we analyzed the influence of the different communication systems on relief activities.
The key findings of this study are:
- (1)
The higher the level of the information-sharing system, the better the efficiency of relief activities. This is proved by quantitative analysis.
- (2)
Even if the total distribution of demand affects the effectiveness of transportation methods, when handling an imbalanced distribution of demand, the more flexible methods, such as multiple destinations or dynamic routing, have a higher performance, especially for the indicator of waiting time.
- (3)
The total demand number can also affect the effectiveness of transportation methods. For example, when the D/C ratio is larger than 1, the methods in levels two and three have an almost identical performance. In this case, the simple and commonly used method “one flight one destination” is sufficient.
All three findings are demonstrated for the first time in published scientific literature.
Hence, we suggest:
- (1)
To improve the preparedness for disaster response, advanced communication devices should be used in relief activities as much as possible, especially in some areas where the population distribution is uneven.
- (2)
Considering the possibility of an uneven injury distribution, a disaster relief authority or local government can design optimal transport methods in advance to make the best use of relief resources.
- (3)
Our results show that when the number of injuries is evenly distributed and either equal to slightly more than the total injuries, the basic and commonly used method “one destination” is also effective. Therefore, to reduce the complexity of rescue whilst maintaining efficiency, it is recommended that the location distribution of rescue shelters should be designed considering the population distribution.
In this study, for the overall model, the process of air rescue was simplified, and the flight routing only included airport and rescue shelters, without considering aircraft refueling in the airport and other missions. Only one transport method was called for each simulation, without considering the combination of different transport methods; For the input data, although we used different coefficients to simulate the different scenarios of demands in the affected area; in each scenario the input of demand was uncharged for several hours. These constitute the limitations of our research. In our future work, we plan to introduce practical disaster data and demand variations with time to analyze the optimal air transport method in more complex practical situations.


