
Air Traffic Prediction as a Video Prediction Problem Using Convolutional LSTM and Autoencoder


Abstract
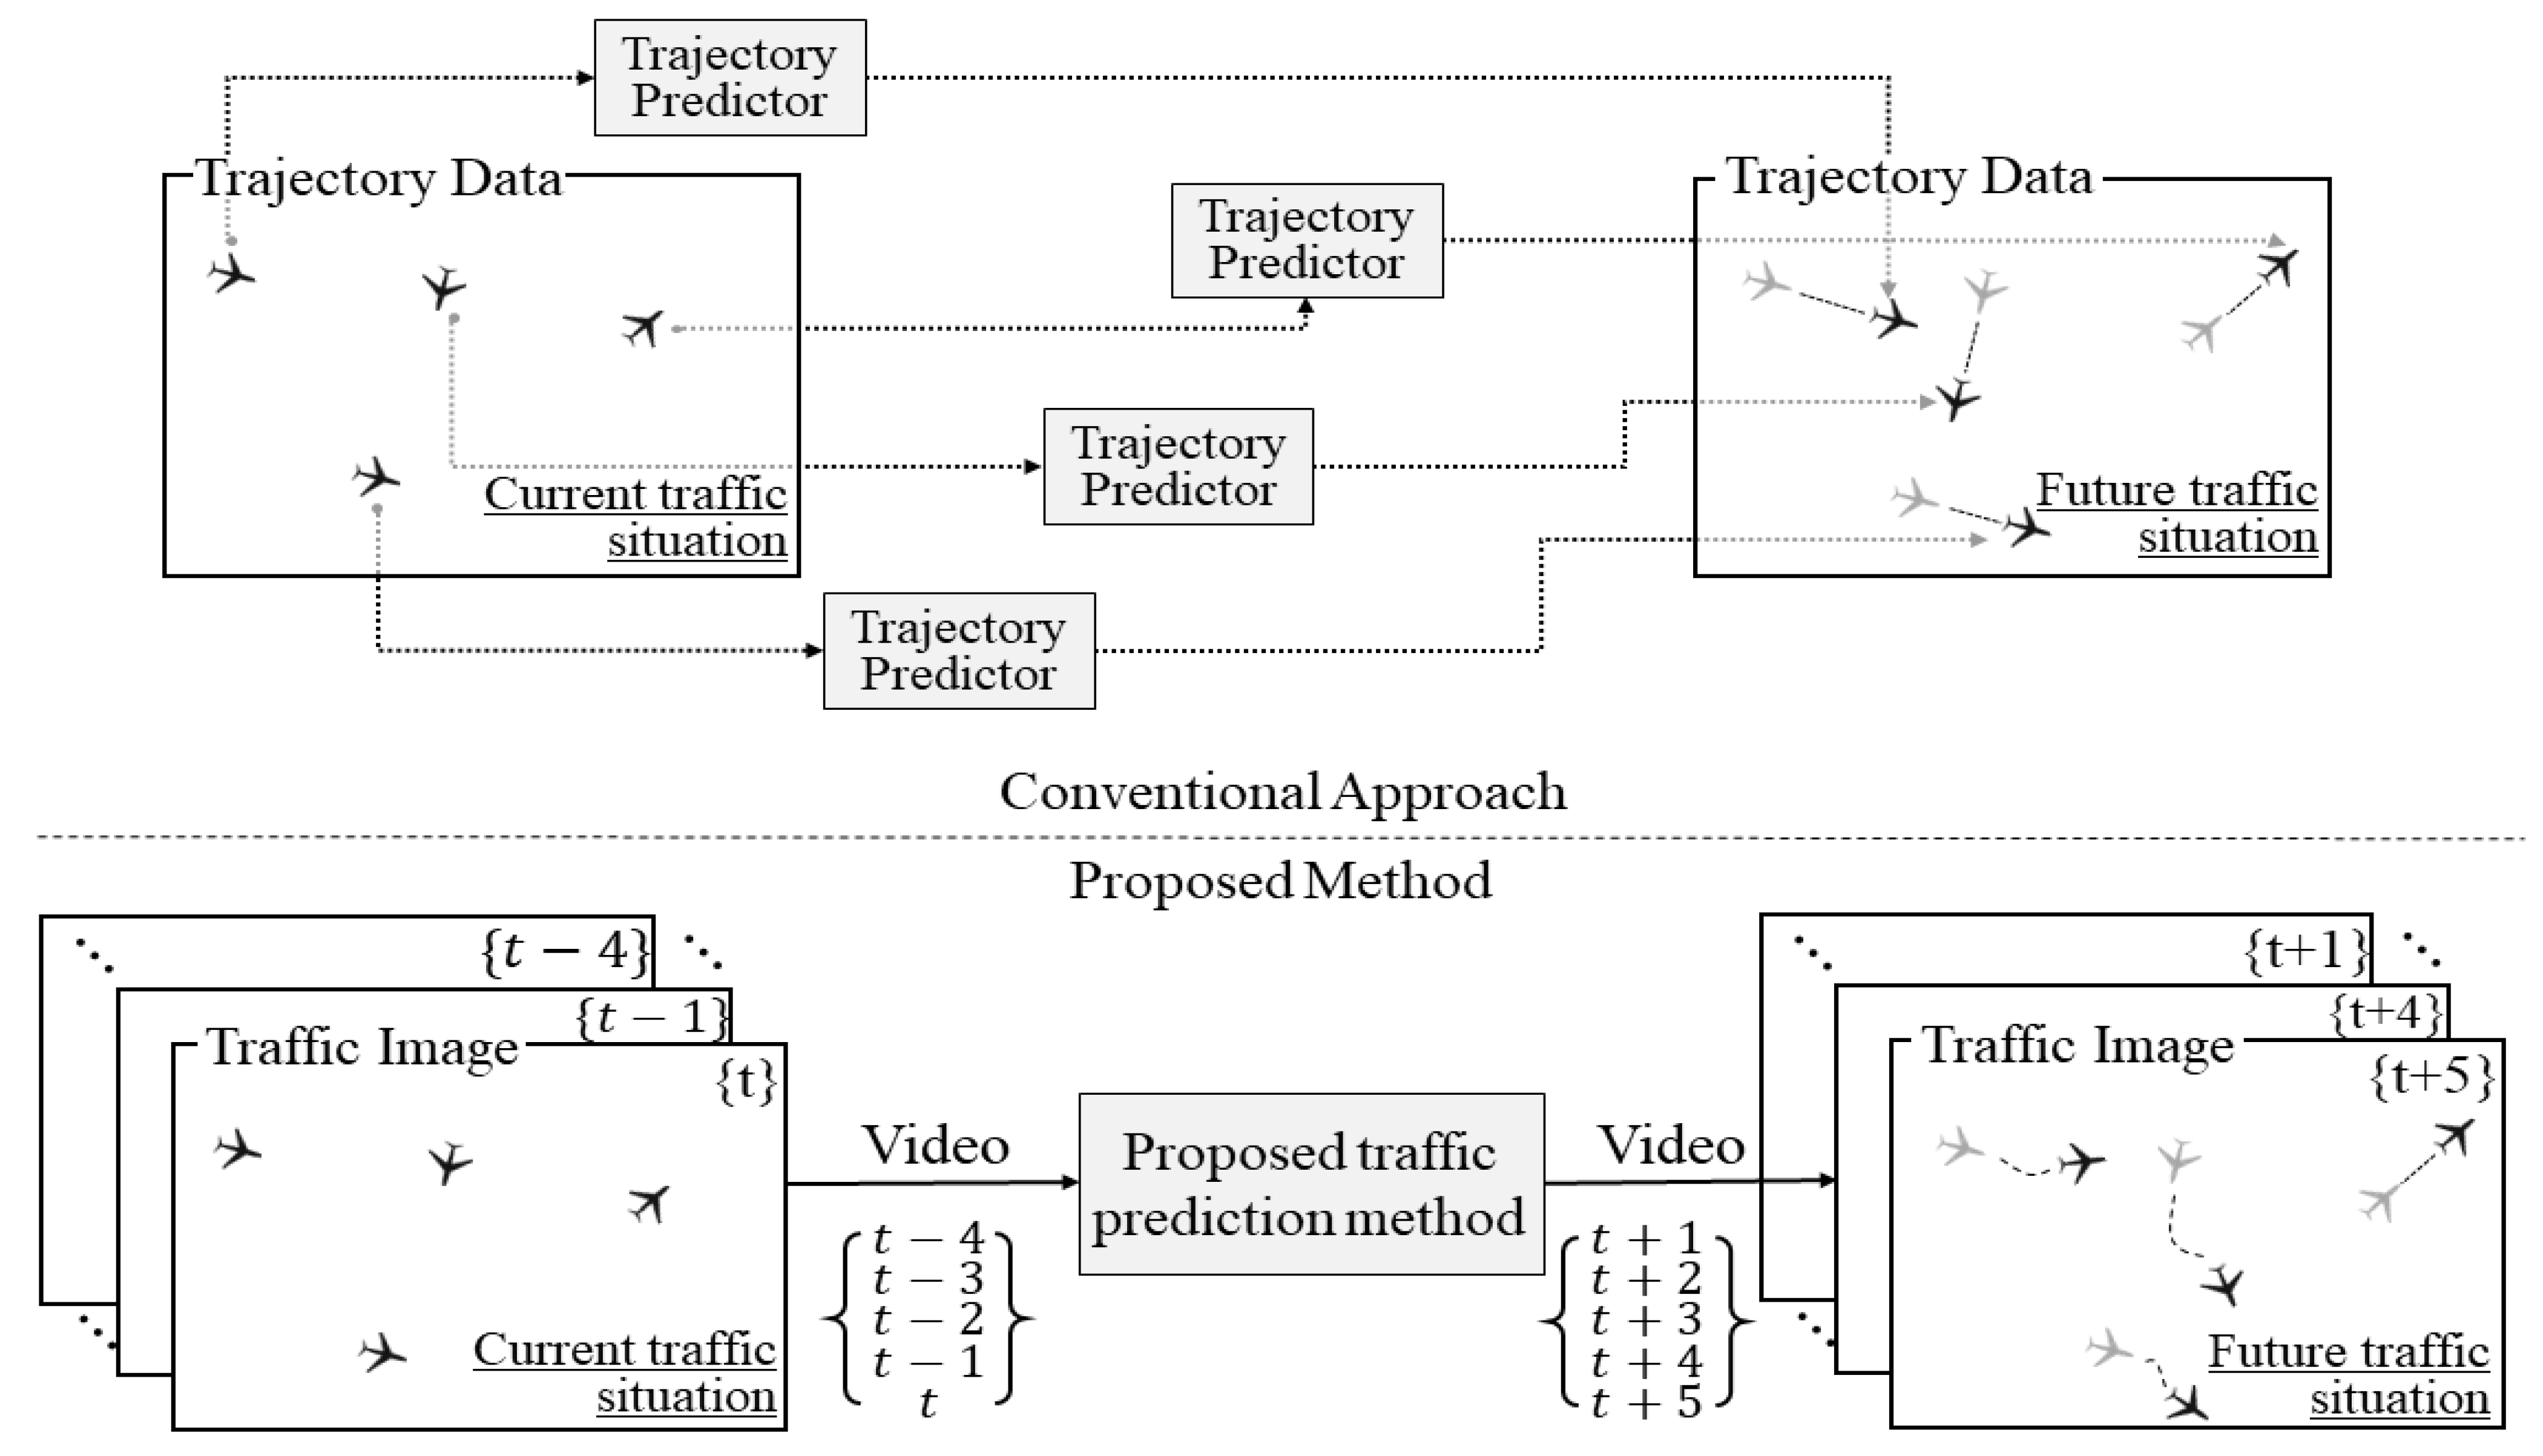
1. Introduction
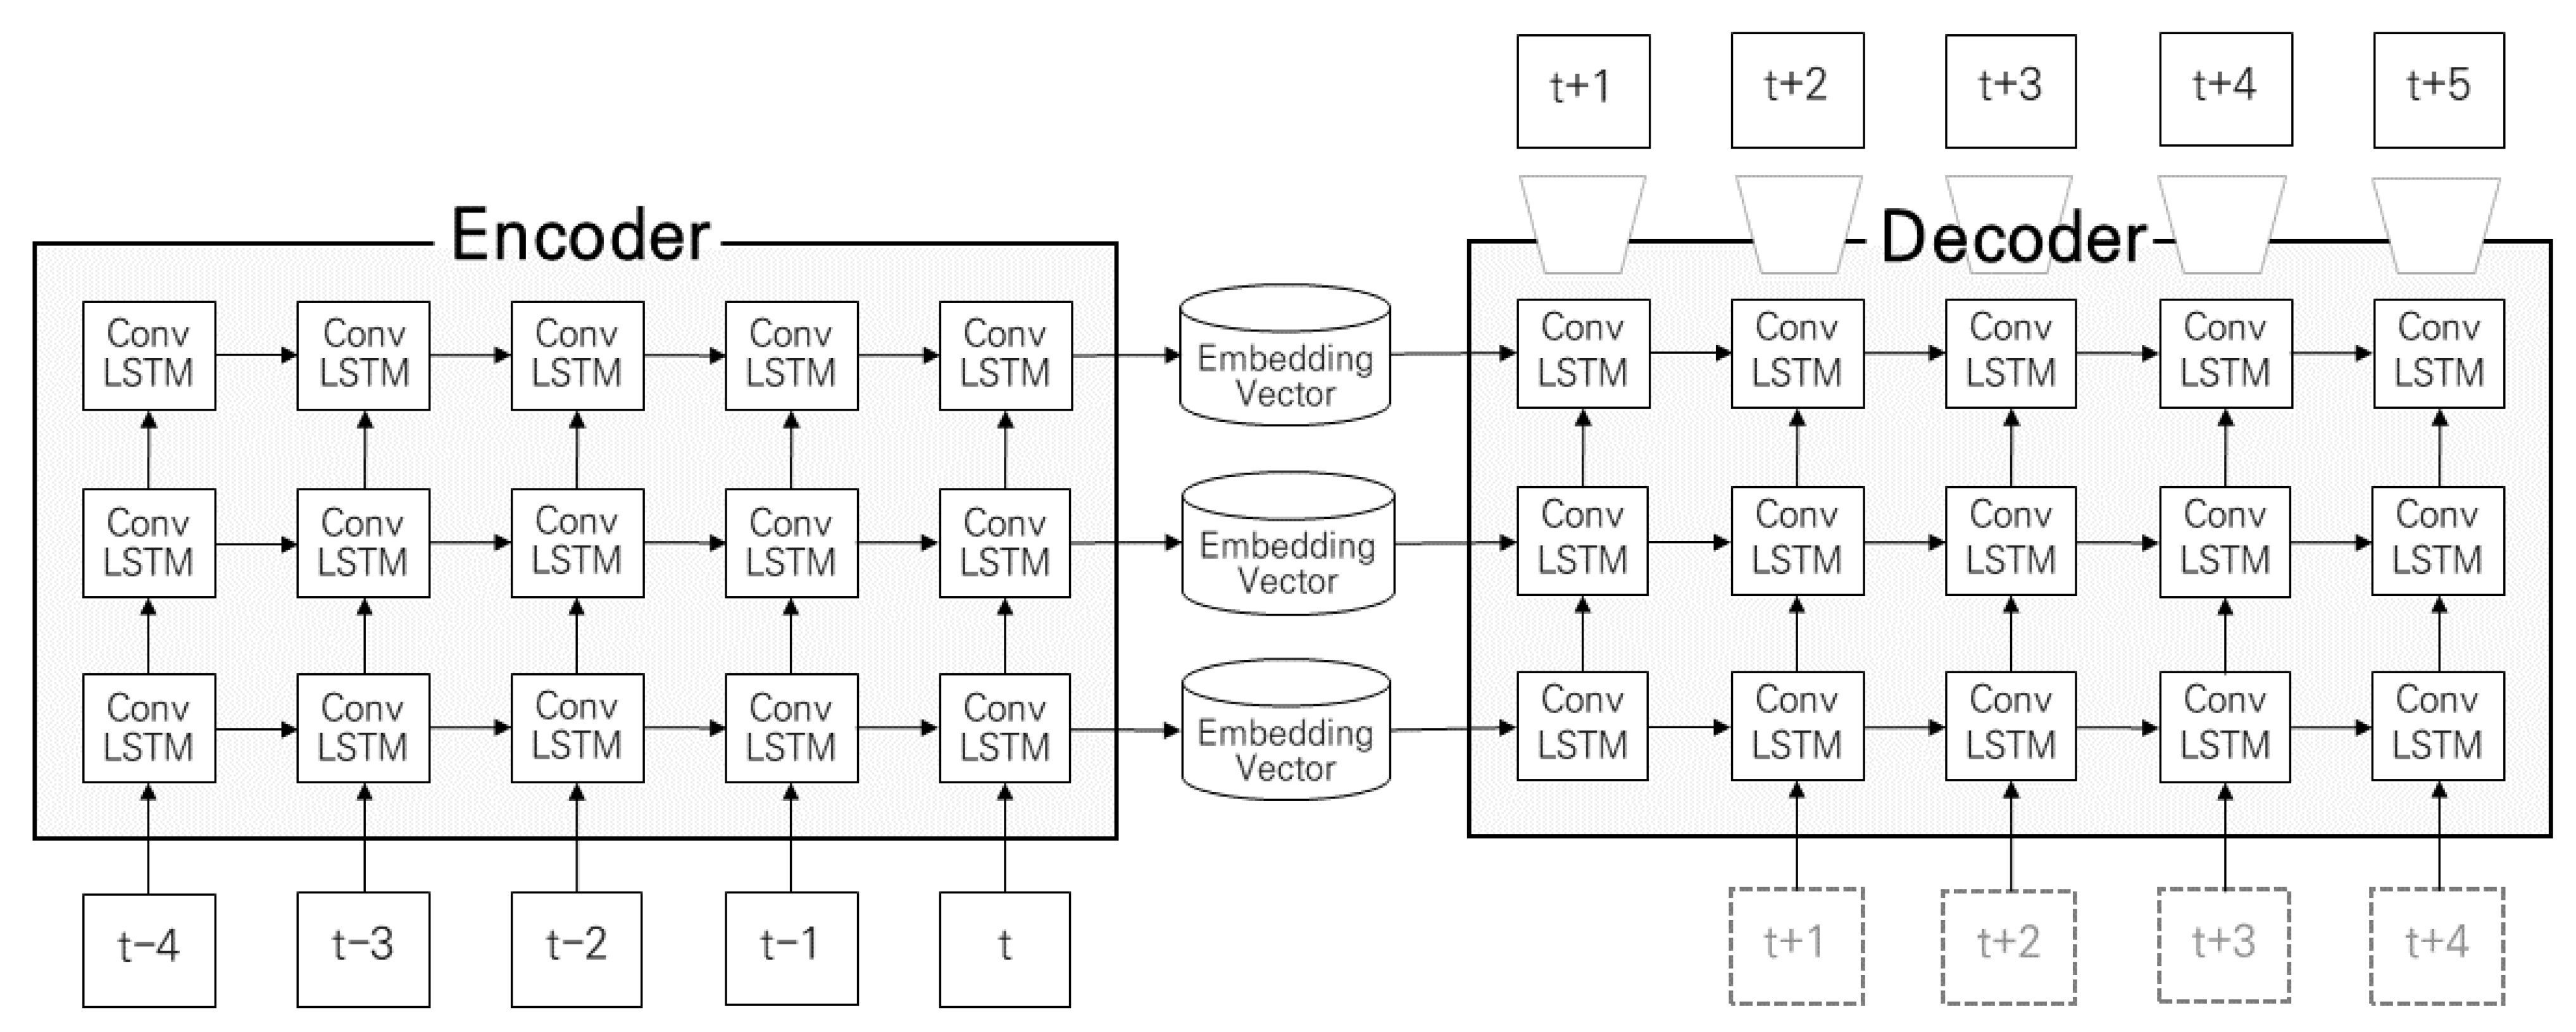
2. Methodology
3. Numerical Example
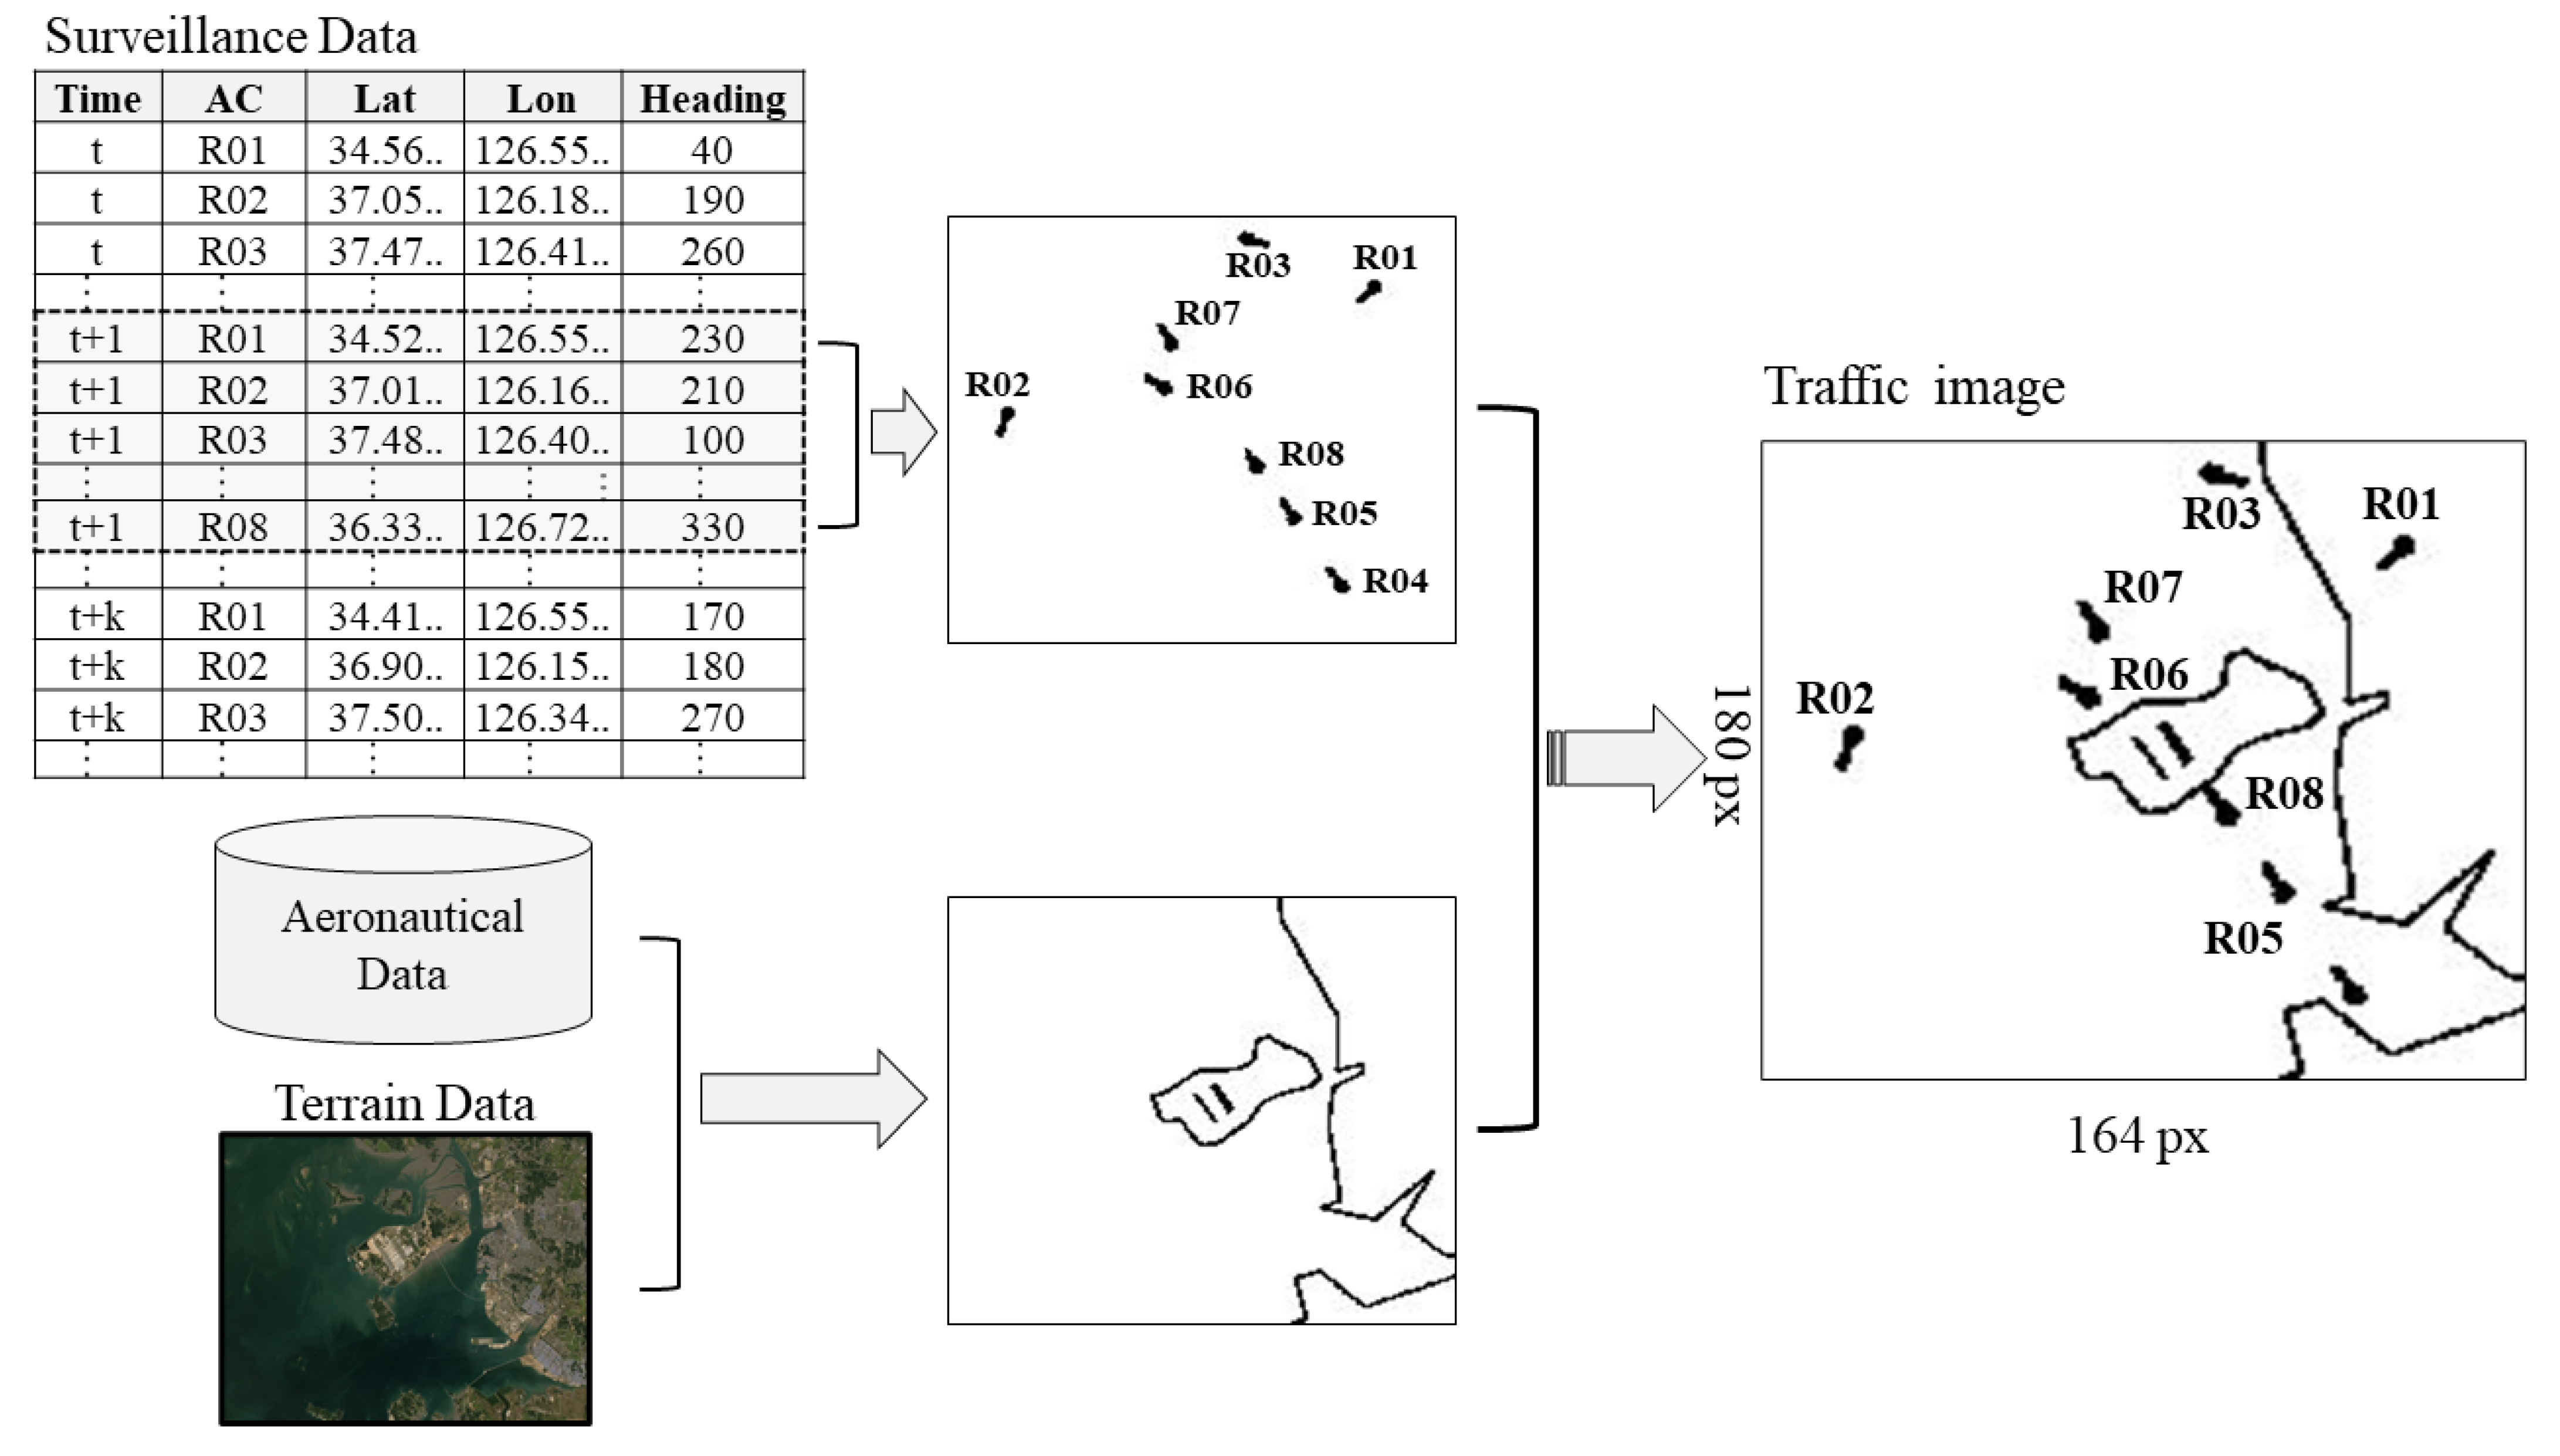
3.1. Air Traffic Image Data
3.2. Constructing the Autoencoder Model
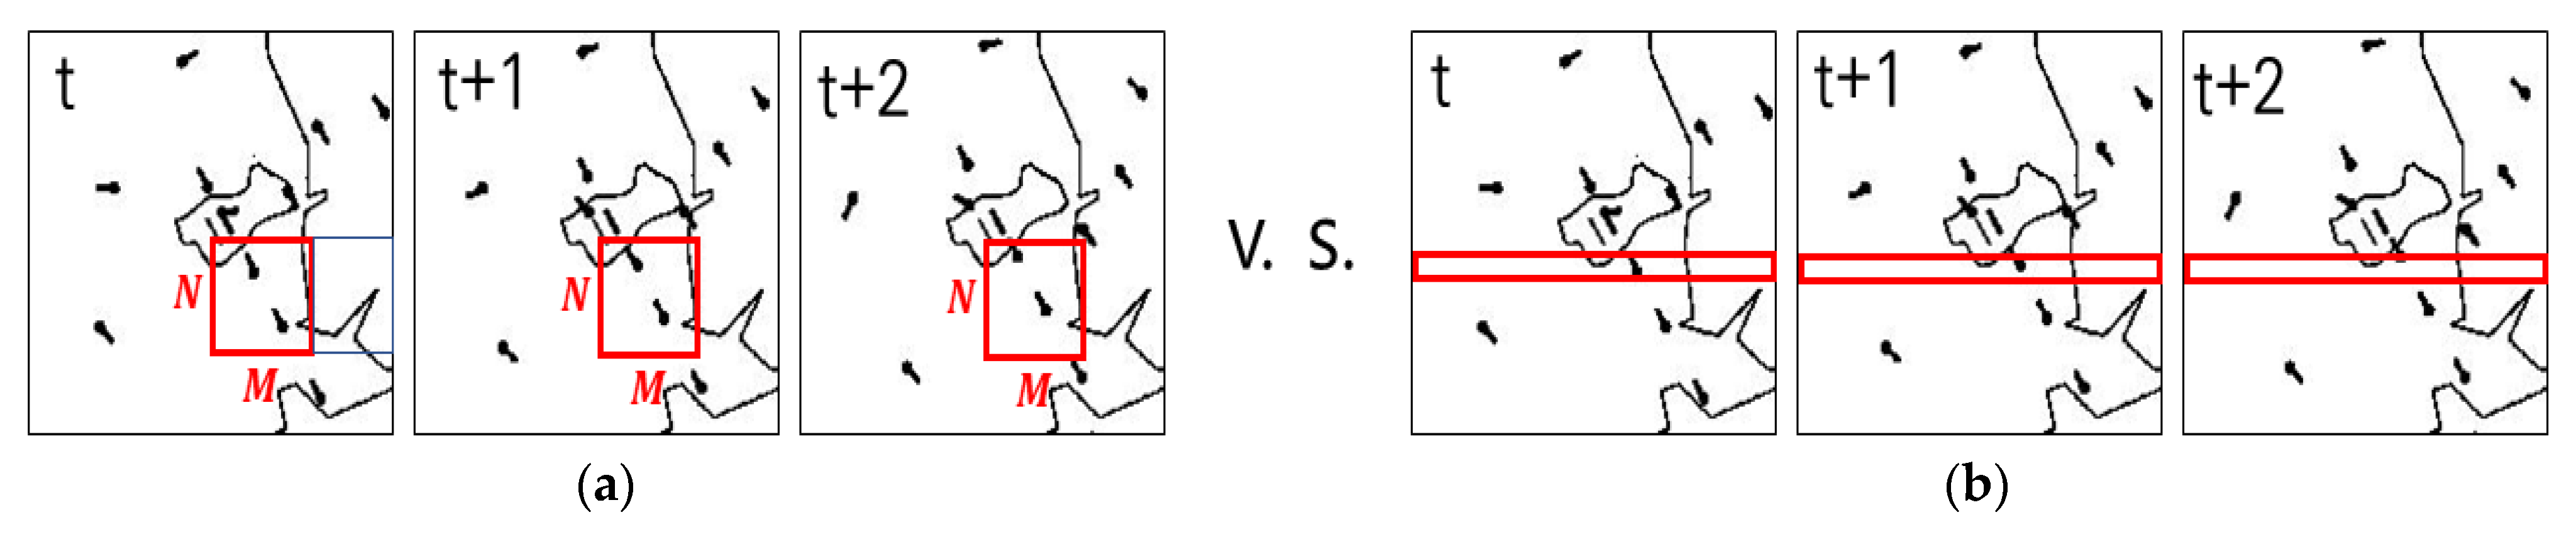
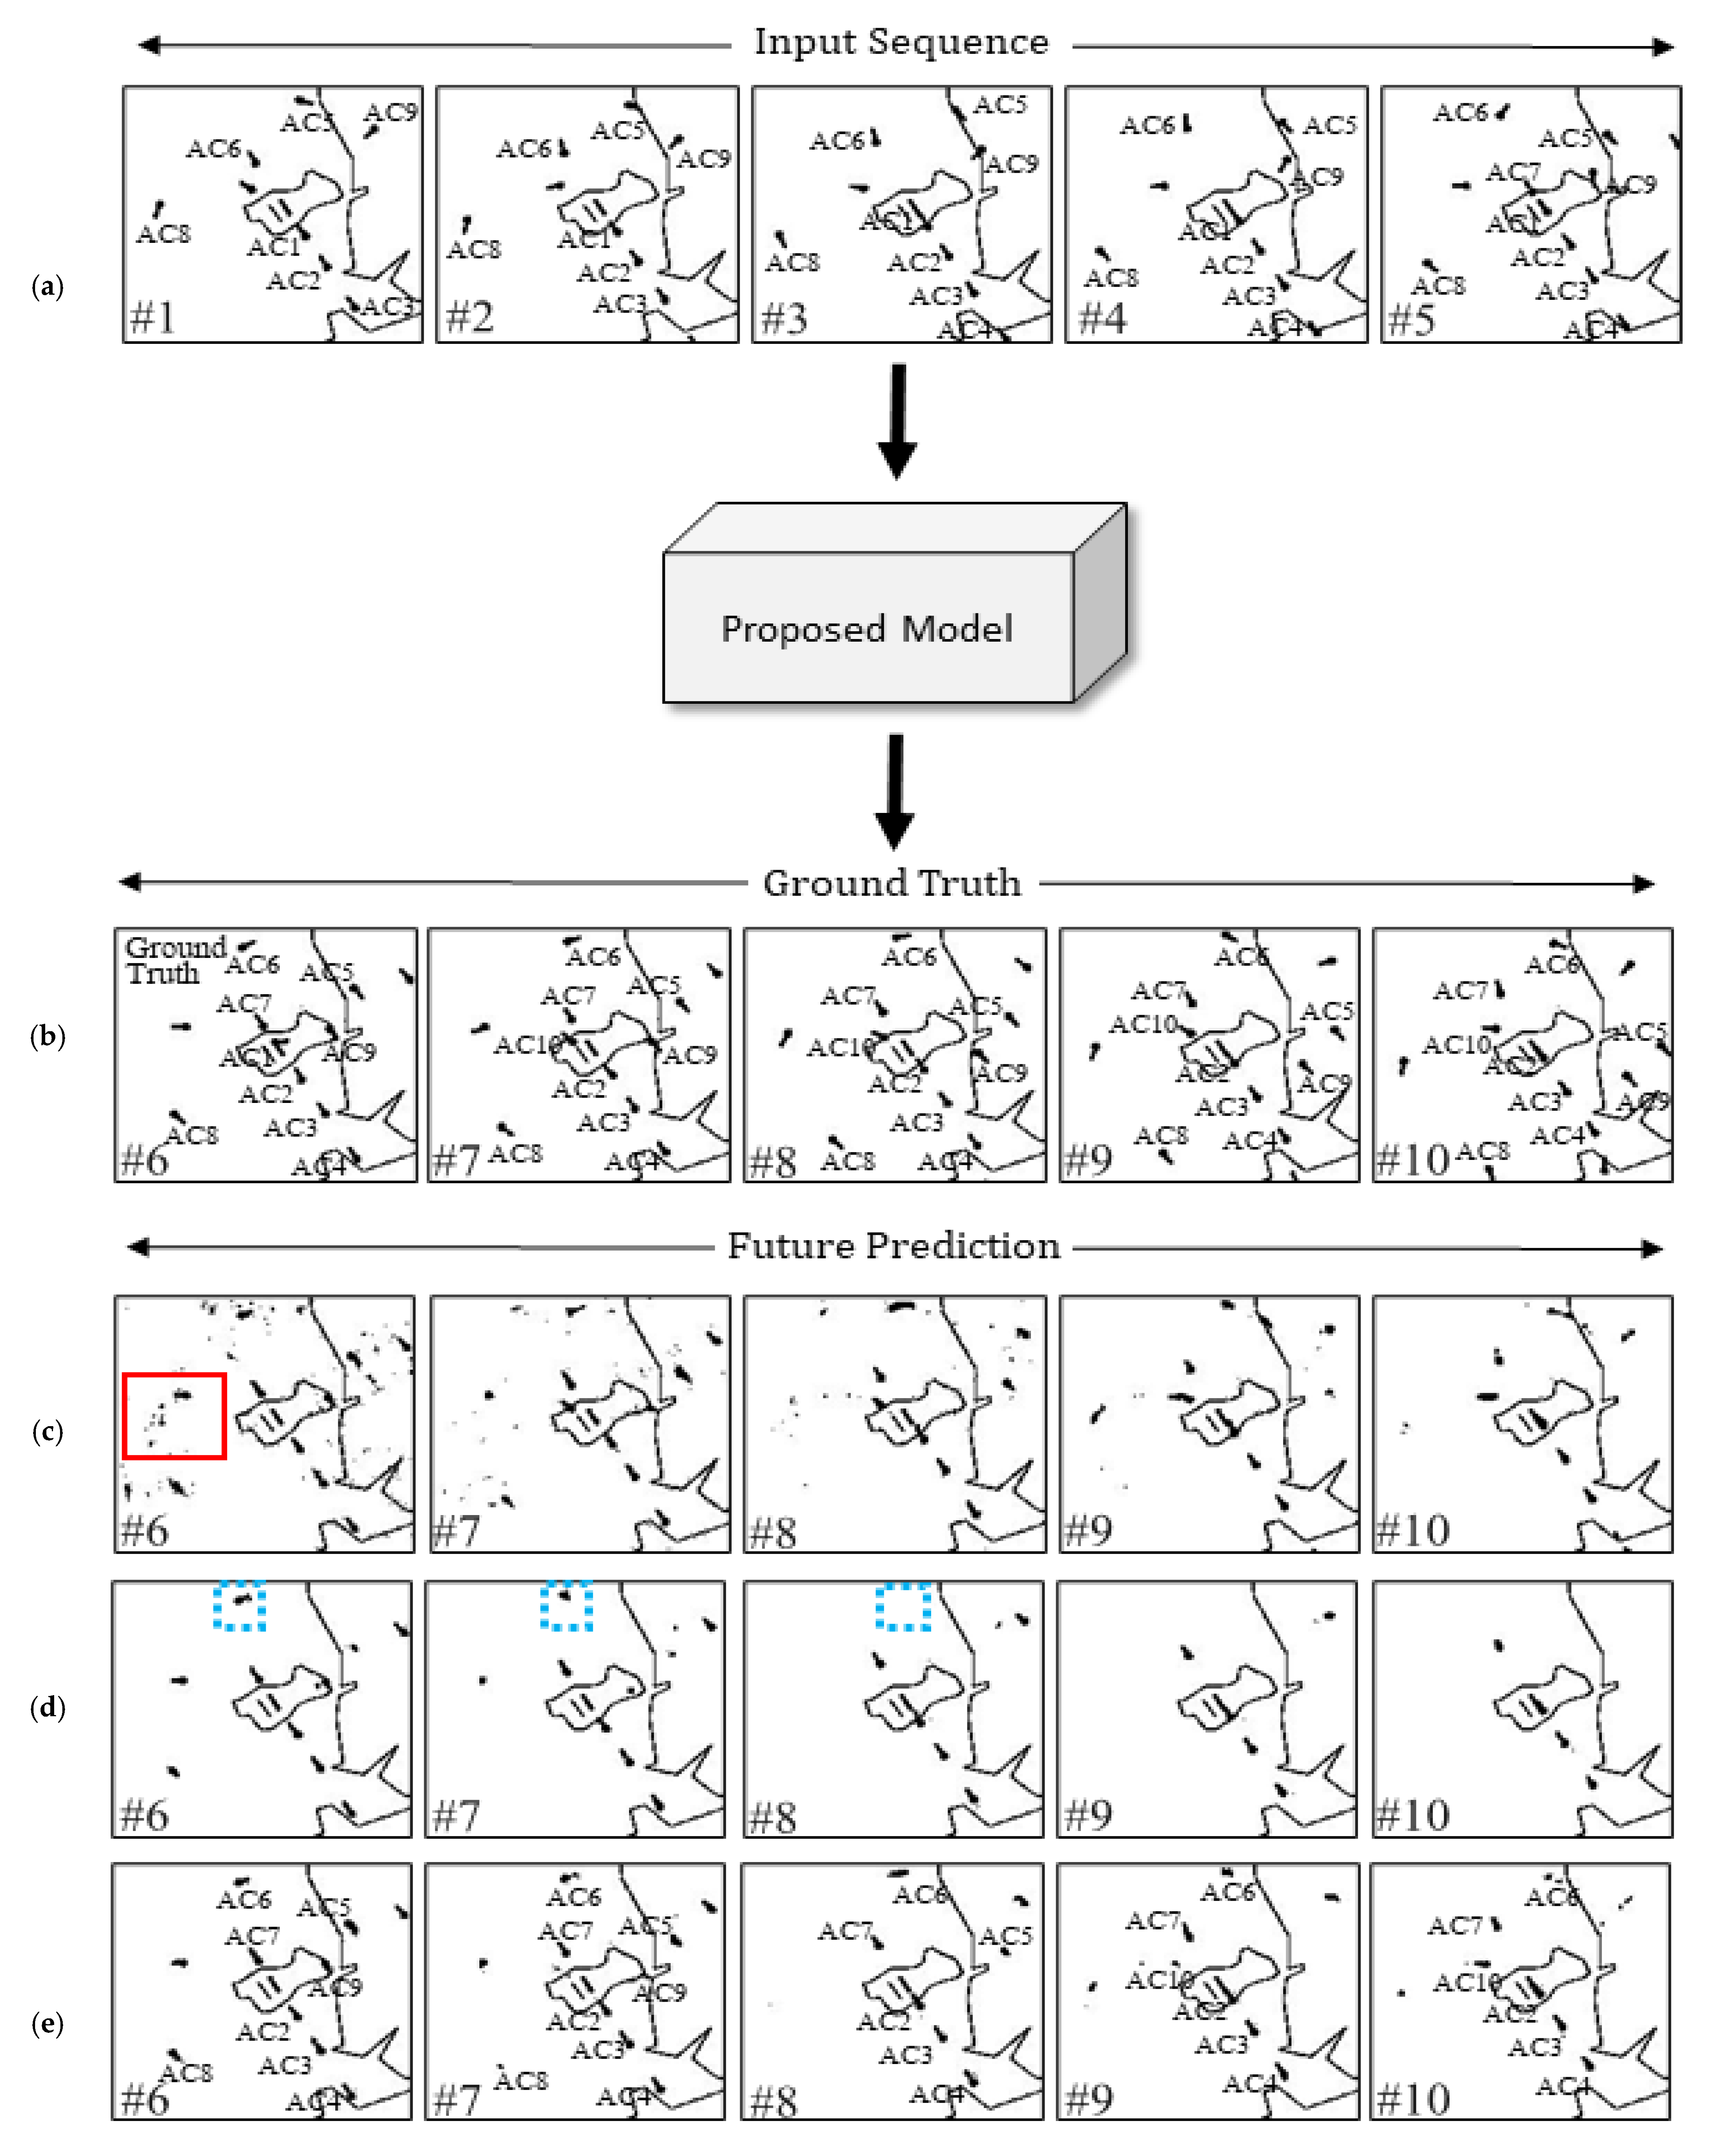
3.3. Results and Discussion
4. Conclusions
Author Contributions
Funding
Institutional Review Board Statement
Informed Consent Statement
Data Availability Statement
Conflicts of Interest
References
- Warren, A. Trajectory prediction concepts for next generation air traffic management. In Proceedings of the 3rd USA/Europe Air Traffic Management R&D Seminar, Napoli, Italy, 13–16 June 2000. [Google Scholar]
- Liu, W.; Hwang, I.S. Probabilistic Trajectory Prediction and Conflict Detection for Air Traffic Control. J. Guid. Control Dyn. 2011, 34, 1779–1789. [Google Scholar] [CrossRef]
- Gallo, E.; Lopez-Leones, J.; Vilaplana, M.A.; Navarro, F.A.; Nuic, A. Trajectory computation infrastructure based on BADA aircraft performance model. In Proceedings of the IEEE/AIAA 26th Digital Avionics Systems Conference, Dallas, TX, USA, 21–25 October 2007. [Google Scholar] [CrossRef]
- Musialek, B.; Munafo, C.F.; Ryan, H.; Paglione, M. Literature Survey of Trajectory Predictor Technology; National Technical Information Service: Springfield, VA, USA, 2010; pp. 1–31. [Google Scholar]
- Swierstra, S. Common Trajectory Predictor Structure and Terminology in Support of SESAR and NextGen; Federal Aviation Administration: Washington, DC, USA, 2010; pp. 1–25. [Google Scholar]
- Chai, H.; Lee, K. En-route arrival time prediction via locally weighted linear regression and interpolation. In Proceedings of the IEEE/AIAA 38th Digital Avionics Systems Conference, San Diego, CA, USA, 8–12 September 2019; pp. 1–6. [Google Scholar] [CrossRef]
- Vourous, G. Data-Driven Aircraft Trajectory Prediction Exploratory Research; NASA: Washington, DC, USA, 2017; pp. 9–13. [Google Scholar]
- Rudnyk, J.; Ellerbroek, J.; Hoekstra, J. Trajectory Prediction Sensitivity Analysis Using Monte Carlo Simulations Based on Inputs’ Distributions. AIAA JAT 2019, 27, 181–198. [Google Scholar] [CrossRef][Green Version]
- Mondoloni, S.; Bayraktutar, I. Impact of Factors, Conditions and Metrics on Trajectory Prediction Accuracy. In Proceedings of the 6th USA/Europe ATM R&D Seminar, Baltimore, MD, USA, 27–30 June 2005. [Google Scholar]
- Yepes, J.; Hwang, I.; Rotea, M. New Algorithms for Aircraft Intent Inference and Trajectory Prediction. AIAA JGCD 2007, 30, 370–382. [Google Scholar] [CrossRef]
- Roy, K.; Levy, B.; Tomlin, C.J. Target tracking and Estimated Time of Arrival (ETA) Prediction for Arrival Aircraft. In Proceedings of the AIAA Guidance, Navigation and Control Conference and Exhibit, Keystone, CO, USA, 21–24 August 2006. [Google Scholar] [CrossRef]
- Hong, S.; Lee, K. Trajectory Prediction for Vectored Area Navigation Arrivals. AIAA JAIS 2015, 12, 490–502. [Google Scholar] [CrossRef]
- Jung, S.; Hong, S.; Lee, K. A Data-Driven Air Traffic Sequencing Model Based on Pairwise Preference Learning. IEEE Trans. Intell. Transp. Syst. 2019, 20, 803–816. [Google Scholar] [CrossRef]
- Akerman, S.; Habler, E.; Shabtai, A. VizADS-B: Analyzing Sequences of ADS-B Images Using Explainable Convolutional LSTM Encoder-Decoder to Detect Cyber Attacks. arXiv 2019, arXiv:1906.07921. [Google Scholar]
- Xie, H.; Zhang, M.; Ge, J.; Dong, X.; Chen, H. Learning Air Traffic as Images: A Deep Convolutional Neural Network for Airspace Operation Complexity Evaluation. Complexity 2021, 2021, 6457246. [Google Scholar] [CrossRef]
- Shi, X.; Chen, Z.; Wang, H.; Yeung, D.Y.; Wong, W.K.; Woo, W.C. Convolutional LSTM Network: A Machine Learning Approach for Precipitation Nowcasting. NIPS 2015, 28, 802–810. [Google Scholar]
- Wang, Y.; Long, M.; Wang, J.; Gao, Z.; Yu, P.S. PredRNN: Recurrent Neural Networks for Predictive Learning using Spatiotemporal LSTMs. NIPS 2017, 30, 879–888. [Google Scholar]
- Jeon, H.; Kum, D.; Jeong, W. Traffic Scene Prediction via Deep Learning: Introduction of Multi-Channel Occupancy Grid Map as a Scene Representation. IEEE Intell. Veh. Symp. IV 2018, 1, 1496–1501. [Google Scholar] [CrossRef]
- Republic of Korea, Office of Civil Aviation (ROK). Aeronautical Information Publication; RKSI Aerodrome Chart 2-1; ROK: Seoul, Korea, 2020. [Google Scholar]
- Google Earth 7.3. 2021. Incheon International Airport 37°27′45″ N 126°26′21″ E. Available online: https://earth.google.com/web/@37.46021582,126.43471177,1.59991967a,24301.36507931d,34.99998106y,0h,0t,0r (accessed on 10 October 2021).
- Zhou, Y.; Dong, H.; Saddik, A. Deep Learning in Next-Frame Prediction: A Benchmark Review. IEEE Access 2020, 8, 69273–69283. [Google Scholar] [CrossRef]
- Zhao, H.; Gallo, O.; Frosio, I.; Kautz, J. Loss Functions for Image Restoration with Neural Networks. IEEE Trans. Comput. Imaging 2017, 3, 47–57. [Google Scholar] [CrossRef]
- Shouno, O. Photo-Realistic Video Prediction on Natural Videos of Largely Changing Frames. arXiv 2020, arXiv:2003.08635v1. [Google Scholar]
- Zhuang, R.; Qi, Z.; Duan, K.; Xi, D.; Zhu, Y.; Zhu, H.; Xiong, H.; He, Q. A Comprehensive Survey on Transfer Learning. arXiv 2019, arXiv:1911.02685. [Google Scholar] [CrossRef]
- Barron, J.T. A General and Adaptive Robust Loss Function. arXiv 2017, arXiv:1701.03077. [Google Scholar]
- Kingma, D.P.; BA, J.L. ADAM: A Method For Stochastic Optimization. arXiv 2014, arXiv:1412.6980. [Google Scholar]
- Paszke, A.; Gross, S.; Massa, F.; Lerer, A.; Bradbury, J.; Chanan, G.; Killeen, T.; Lin, Z.; Gimelshein, N.; Antiga, L.; et al. PyTorch: An Imperative Style, High-Performance Deep Learning Library. NIPS 2019, 32, 8024–8035. [Google Scholar]
- Pytorch Lightning. Available online: https://github.com/PyTorchLightning/pytorch-lightning (accessed on 10 October 2021).
- Johnson, J.; Alahi, A.; Fei-Fei, L. Perceptual Losses for Real-Time Style Transfer and Super-Resolution. arXiv 2016, arXiv:1603.08155. [Google Scholar]


| Network | Layer Type | Output Shape |
|---|---|---|
| Encoder | Input Layer | (5, 164, 180, 3) |
| ConvLSTM2D 1 (3 × 3 kernel, 1 × 1 padding, 1 stride) | (5, 164, 180, 64) | |
| ConvLSTM2D 2 (3 × 3 kernel, 1 × 1 padding, 1 stride) | (5, 164, 180, 64) | |
| ConvLSTM2D 3 (3 × 3 kernel, 1 × 1 padding, 1 stride) | (5, 164, 180, 64) | |
| Decoder | ConvLSTM2D 1 (3 × 3 kernel, 1 × 1 padding, 1 stride) | (5, 164, 180, 64) |
| ConvLSTM2D 2 (3 × 3 kernel, 1 × 1 padding, 1 stride) | (5, 164, 180, 64) | |
| ConvLSTM2D 3 (3 × 3 kernel, 1 × 1 padding, 1 stride) | (5, 164, 180, 64) | |
| 3D CNN (3 × 3 kernel, 1 × 1 padding, 1 stride, tanh activation) | (5, 164, 180, 3) |
Publisher’s Note: MDPI stays neutral with regard to jurisdictional claims in published maps and institutional affiliations. |
© 2021 by the authors. Licensee MDPI, Basel, Switzerland. This article is an open access article distributed under the terms and conditions of the Creative Commons Attribution (CC BY) license (https://creativecommons.org/licenses/by/4.0/).
Share and Cite
Kim, H.; Lee, K. Air Traffic Prediction as a Video Prediction Problem Using Convolutional LSTM and Autoencoder. Aerospace 2021, 8, 301. https://doi.org/10.3390/aerospace8100301
Kim H, Lee K. Air Traffic Prediction as a Video Prediction Problem Using Convolutional LSTM and Autoencoder. Aerospace. 2021; 8(10):301. https://doi.org/10.3390/aerospace8100301
Chicago/Turabian StyleKim, Hyewook, and Keumjin Lee. 2021. "Air Traffic Prediction as a Video Prediction Problem Using Convolutional LSTM and Autoencoder" Aerospace 8, no. 10: 301. https://doi.org/10.3390/aerospace8100301
APA StyleKim, H., & Lee, K. (2021). Air Traffic Prediction as a Video Prediction Problem Using Convolutional LSTM and Autoencoder. Aerospace, 8(10), 301. https://doi.org/10.3390/aerospace8100301