Article

Selective Simulated Annealing for Large Scale Airspace Congestion Mitigation

1
ENAC—National School of Civil Aviation, Avenue Edouard Belin CS 54005, CEDEX 4, 31055 Toulouse, France
2
GISDAS—Geo-Informatics & Space Technology Development Agency, 88 Moo 9 Tambon Thung Sukala, Amphoe Siracha, Siracha 20230, Thailand
*
Author to whom correspondence should be addressed.
Aerospace 2021, 8(10), 288; https://doi.org/10.3390/aerospace8100288
Submission received: 20 June 2021 / Revised: 30 August 2021 / Accepted: 28 September 2021 / Published: 5 October 2021
(This article belongs to the Special Issue Aircraft Operations and CNS/ATM)

Abstract

:
This paper presents a methodology to minimize the airspace congestion of aircraft trajectories based on slot allocation techniques. The traffic assignment problem is modeled as a combinatorial optimization problem for which a selective simulated annealing has been developed. Based on the congestion encountered by each aircraft in the airspace, this metaheuristic selects and changes the time of departure of the most critical flights in order to target the most relevant aircraft. The main objective of this approach is to minimize the aircraft speed vector disorder. The proposed algorithm was implemented and tested on simulated trajectories generated with real flight plans on a day of traffic over French airspace with 8800 flights.

1. Introduction

Air traffic management (ATM) is a system that supports and guides aircraft from a departure airport to a destination airport in order to ensure its safety while minimizing delays and airspace congestion. It manages air traffic through the management of the three following complementary systems: airspace management (ASM), air traffic flow management (ATFM), and air traffic control (ATC). The ATC then controls the air traffic in real-time. It uses the flight plan information to predict the traffic situation, then issues necessary changes to the flight plan in order to ensure aircraft separation, and to maintain the order of air traffic flow, while satisfying as much as possible the pilot’s request. For this purpose, the airspace is partitioned into different sectors, each sector is assigned to a group of controllers monitoring the air traffic. In order to prevent overloaded controllers, the number of aircraft allowed to enter a given sector at any given time is limited. When the number of aircraft reaches this limit, the corresponding sector is said to be congested. Generally, congestion in air traffic management can be categorized into two groups according to the part of airspace it involves. Terminal congestion is the congestion that occurs around the terminal control area (TCA, or TMA outside the U.S. and Canada). A terminal control area (also known as a terminal maneuvering area) is controlled airspace surrounding major airports, generally designed as airspace with a cylindrical or upside-down wedding cake shape, 30 to 50 miles in radius and 10,000 feet high. En-route congestion is the congestion involved in the en-route section of the flight between TMAs. In the U.S., congestion occurs more often in terminal areas, whereas in Europe, en-route congestion is more critical due to the fragmented nature of its airspace where there are extra difficulties for coordinating air traffic over boundaries, in particular between two different countries. Air traffic regulations impose that aircraft must always be separated by some prescribed distance, noted as N v for the vertical separation and N h for the horizontal separation. Current ATC regulations require aircraft operating in the terminal maneuvering area (TMA) to be vertically separated by at least N v = 1000 feet and horizontally separated by a minimum of N h = 3 nautical miles. In the en-route environment, for aircraft operating up to (and including) FL410 the horizontal minimum separation is increased to 5 nautical miles (the flight level (FL) is a pressure altitude, expressed in hundreds of feet, for example, an altitude of 32,000 feet is referred to as FL320). Then, for aircraft operating above FL410, the vertical separation is increased to 2000 feet.
As air traffic demand keeps on increasing, the airspace becomes more and more congested. Over past decades, several methods have been proposed to address the air traffic management problem aiming at balancing air traffic demand and airspace capacity and preventing airspace congestion. There are two air traffic decongestion strategies frequently used. The first one adapts the airspace capacity to the increased demand. The second air traffic decongestion strategy is to regulate the air traffic demand to the current capacity. This strategy focuses on decongesting the ATM system through several approaches, such as: allocating delays to each aircraft in order to reduce congestion in sectors or at destination airports, re-routing flights, or changing flight levels in order to avoid congestion in sectors or airport TMAs, etc. More precisely, the strategic trajectory planning problem under consideration can be presented as follows:
  • We are given a set of flight plans for a given day, associated with nationwide- or continent-scale air traffic.
  • For each flight, f, we suppose that a set of possible departure times is given.
Based on these “alternate trajectories”, we propose to develop an optimization strategy in order to minimize the associated airspace congestion with a minimum deviation from the user preferences. To reach this goal an AI decision support tool based on a metaheuristics algorithm has been proposed.
Currently, the congestion (complexity) of the traffic is measured only as an operational capacity: the maximum number of aircraft that ATC controllers are able to manage is defined on a per sector basis and the complexity is assessed by comparing the real number of aircraft with the sector capacity. It must be noted that under some circumstances controllers will accept aircraft beyond the capacity threshold, while rejecting traffic at other times although the number of aircraft is well below the maximum capacity. This simple fact clearly shows that capacity as a raw complexity metric is not enough to represent the controller’s workload. In order to better quantify the complexity, geometric features of the traffic have to be included. As previously stated, depending on the traffic structure, ATC controllers will perceive situations differently, even if the number of aircraft present in the sector is the same. Furthermore, exogenous parameters, such as the workload history, can be influential on the perceived complexity at a given time (a long period of heavy load will tend to reduce the efficiency of a controller). Some reviews of complexity in ATC have been completed, mainly from the controller’s workload point of view [1,2], and have recognized that complexity is related to both the structure of the traffic and the geometry of the airspace. This tends to prove that the controller’s workload has two facets:
  • An intrinsic complexity related to traffic structure.
  • A human factor aspect related to the controller themself.
While most complexity metrics tend to capture these effects within a single aggregate indicator, the purpose of this work is to design a measure of intrinsic complexity only, since it is the most relevant metric for a highly automated ATC system (no human factors).
Section 2 of this paper will present the previous related works associated with this large-scale trajectory planning problem. Section 3 will develop the associated mathematical model in order to identify the decision variable, the objective function, and the associated constraint. Section 4 will present the resolution algorithm which has been developed to tackle such a problem. Section 5 will introduce the test cases used for validating our approach. Finally, Section 6 will conclude the paper.

2. State of the Art

This section describes, at first, the previous work related to large-scale airspace congestion mitigation. Secondly, the complexity metric is used to evaluate the controllers’ workload to manage the aircraft in a given airspace.

2.1. Previous Related Work

In this section, the existing strategies in the literature are presented to address large-scale airspace congestion mitigation. The first category includes trajectory deconfliction methods and the second one, air traffic decongestion methods.

2.1.1. Trajectory Deconfliction Strategies

Instead of only considering the capacity constraints, several research studies have looked at deconfliction of aircraft trajectories. Different conflict detection and resolution methods are described in the literature. Conflict detection methods are categorized into three types: nominal, worst-case, and probabilistic conflict detections. Nominal conflict means no error is considered in the aircraft’s trajectories. Worst-case is the largest envelope in which the aircraft might be. Probabilistic conflict detection is an improvement of the worst-case, by introducing a probability density function for the aircraft’s position inside the worst-case envelope.
Conflict resolution strategies are: 1-against-N, pair-wise, and global. The first strategy adds aircraft to the airspace following a priority order, and solves conflicts with all aircraft in the airspace. The pair-wise strategy considers each pair of aircraft and solves their conflict with each other. Finally, the global deconfliction strategy solves all air traffic situations, whereas the previous strategies do not, but it is computationally demanding.
The main research studies in the literature addressing trajectory deconfliction are presented in the following paragraph. Genetic algorithms, that deconflict aircraft trajectories, are considered in [3]. However, for large-scale air traffic, the memory required is too high. In [4,5], air traffic is deconflicted with ground holding and flight level alternates. The conflicts are solved by allocating alternative flight levels, and then by ground holding aircraft. However, for large-scale air traffic, some conflicts remain. Trajectory deconfliction, with the Light-Propagation Algorithm is described in [6,7]. The principle is to use the light-propagation model, with conflicts areas equivalent to high refractive-index areas. However, for large-scale air traffic, some conflicts are unsolved.
In the free-flight concept of operation, the strategies are based on Trajectory Based Operations (TBOs). TBO involves adapting the air traffic demand to the current air traffic capacity, with Trajectory Actions (TAs). Those TAs are changing the departure time, the flight level, or the route. To ensure the capacity is not exceeded, negotiated 4D trajectories are provided to each aircraft by influencing its TAs. In [8], time uncertainties have also been included in order to build robust large scale trajectory planning. When trajectory planning is done at a pre-tactical level, conflicts between aircraft are quite difficult to predict and a congestion reduction objective is used instead of conflict mitigation.

2.1.2. Air Traffic Decongestion Strategies

In this section, the existing strategies in the literature are presented that address air traffic decongestion problems. Congestion is a situation where the number of aircraft in a given airspace exceeds the maximum number of aircraft allowed to enter the airspace. Several research studies have been done to minimize air traffic congestion. Their main goal is to manage the air traffic demand as a function of the airspace’s capacity. In this case, the actions on aircraft are quite similar (flight level setting, delays, route assignment), but for an airspace congestion mitigation purpose.
Ground holding approaches are the simplest way to regulate air traffic demand in order to meet the airspace’s capacity. The method allocates a delay to the initially planned flight departure time. This strategy transfers air delays to ground delays at the departure airport, because it is safer and less expensive. The ground holding strategy was first studied in [9].
Many other extensions of this problem have been proposed in the literature ([10,11,12,13,14,15,16,17]).
Air traffic flow management approaches consider the departure and arrival time to regulate the air traffic demand. These approaches rely on branch-and-bound algorithms, mixed-integer programming solvers, genetic algorithms or other algorithms. Some other efforts have investigated airspace congestion reduction by using distributed approaches ([18,19]).
All the previous methods use some artificial trick in order to circumvent the underlying complexity (objective linearization, objective time–space separability, distributed algorithm approximation).
The current approach addresses the full complexity of airspace congestion mitigation by using a dedicated metaheuristic which is able to strongly reduce the overall congestion in the airspace.
In this paper, in a first approach, the proposed method is only changing the aircraft times of departure to reduce air traffic congestion. The congestion of the air traffic is measured with the speed covariance metric, described in the next section.

3. Mathematical Model

As for any real optimization problem, the modeling step is critical and has to be done carefully. It exhibits the state space (the definition of the decision variables), the objective function, and the associated constraints. The decision variables and the given data define the objective and the constraints.

3.1. Input Data

  • F: set of flights, noted f,
  • Γ : set of trajectories,
  • γ f Γ : trajectory corresponding to a flight f F ,
  • d t f + : upper bound of departure time shift, f F ,
  • d t f : lower bound of departure time shift, f F ,

3.2. Decision Variables

During the scheduling process, each flight may be scheduled at a different time of departure. The decision variable d t f indicates the difference between the scheduled and requested departure times. All those decision variables are grouped into the state space X.

3.3. Objective

In order to evaluate a solution, the following complexity metric will be used. This metric is based on the aircraft speed vector disorder. The main objective is to reduce air traffic complexity.
In controlled airspace, the higher the number of aircraft, the more the control workload increases. Hence, the controllers’ level of mental effort needed to manage those aircraft increases. A limit exists in terms of the maximum number of aircraft that can be managed by the controllers. This threshold is very difficult to estimate as it depends on the geometry of the air traffic, the distribution of aircraft inside the airspace, and so forth. A simple measurement of the number of aircraft is easy to evaluate, but not representative enough to consider disordered traffic. Disordered traffic is more demanding than ordered traffic for the controller.
Thus, a simple count of aircraft in a neighborhood is not enough. Therefore, traffic complexity metrics are developed. Traffic complexity is an intrinsic measurement of the complexity associated with a traffic situation. This measurement is only dependent on the geometry of the trajectories.
This approach consists of evaluating the covariance of the speed vectors for each vector in a neighborhood and evaluating the relative distance of each pair of points.
Each curvilinear trajectory is sampled in time into a 4D trajectory. Considering a 4D point of a 4D trajectory, a spatial neighborhood is considered, as shown in Figure 1.
Assuming there are N observations at a given time in a given neighborhood. Each observation is represented by a position measurement:
X i = x i y i z i
and a speed measurement:
V i = v x i v y i v z i
The observations are shown on Figure 1 as the blue points and the associated speed vector, plus the reference point (red point) and its speed vector.
Therefore, the speed covariance is described in Equation (3):
C o v = i = 1 N | v x i v x ¯ | + | v y i v y ¯ | + | v z i v z ¯ |
with the mean values computed as follows:
v x ¯ = i = 1 N v x i N v y ¯ = i = 1 N v y i N v z ¯ = i = 1 N v z i N
The speed covariance does not differentiate the proximity of aircraft. Hence, the evaluation of pair-wise distance enables it. It is computed as follows:
P r o x = i = 1 N j = i + 1 N 1 [ N v , N v ] ( z i z j ) · 1 [ 0 , 2 N h ] ( d i , j ) · 2 N h d i , j
with, d i , j = ( x i x j ) 2 + ( y i y j ) 2 , the distance in the horizontal plane between two points; 1 X ( x ) , the indicative function, that equals 1 if x is in the ensemble X and 0 if else.
The further the points are from themselves, the lower the evaluation has to be. Moreover, if the points are separated enough ( d i , j 2 N h ), the evaluation has to be null, since it does not create any congestion. Hence, the relative distance to the horizontal norm separation is evaluated, as 1 [ N v , N v ] ( z i z j ) · 1 [ 0 , 2 N h ] ( d i , j ) · 2 N h d i , j . The proximity evaluation is the sum of these relative distances for each pair of points in the neighborhood.
Finally, the metric evaluation is the sum of the speed covariance and the proximity. It is computed for a reference point p, and its neighborhood. Thus, it is noted c p . Its complete formula is described in Equation (6):
c p = i = 1 N | v x i v x ¯ | + | v y i v y ¯ | + | v z i v z ¯ | + i = 1 N j = i + 1 N 1 [ N v , N v ] ( z i z j ) · 1 [ 0 , 2 N h ] ( d i , j ) · 2 N h d i , j
The complexity evaluation y of the air traffic solution is the sum of all flights’ complexity, see Equation (7):
y = f F y f
The flight, f, is represented by its curvilinear trajectory. The trajectory, γ f , is sampled in time, with 4D points, p, represented in Figure 1. The congestion of the trajectory is the sum of complexity for each point in the curvilinear trajectory, see Equation (8):
y f = p γ f c p
The point’s congestion, noted c p , is computed using the speed covariance metric, and the point’s neighborhood. The formula of c p computing is detailed in Equation (6).
Besides the congestion, the algorithm must minimize the introduced delays to best suit the airlines’ requests. The evaluation of the total delays is the sum of all absolute gaps between the requested and allocated time of departure, see Equation (9):
f F | d t f |
The objective function f ( X ) , is described hereafter:
f ( X ) = y + w 1 f F | d t f | = f F p γ f c p + w 1 f F | d t f |
with w 1 , the weight to balance the evaluations.

3.4. Constraints

The problem is subjected to some constraints. In fact, the time shift of the departure time needs to be between the minimal and maximal bound of the time displacement for each flight.
d t f d t f d t f + f F
The evaluation of the objective function involves a high computation time. Moreover, the objective function may have multiple local optima. Therefore, the choice of a stochastic algorithm to optimize air traffic congestion is more valued. Hence, the algorithm chosen is a Simulated Annealing algorithm and is presented hereafter in Section 4.

4. Simulated Annealing

4.1. Standard Simulated Annealing

Simulated Annealing (SA) is one of the simplest and best-known metaheuristic methods for addressing difficult black box global optimization problems (those where the objective function is not explicitly given and can only be evaluated via some costly computer simulation). In real-life applications, Simulated Annealing is used massively. The expression “simulated annealing” yields over one million hits when searching through the Google Scholar web search engine dedicated to scholarly literature. In the early 1980s, three IBM researchers, Kirkpatrick, Gelatt, and Vecchi [20], introduced the concepts of annealing in combinatorial optimization. These concepts are based on a strong analogy with the physical annealing of materials. This process involves bringing a solid to a low energy state after raising its temperature. It can be summarized by the following two steps (see Figure 2):
  • Bring the solid to a very high temperature until “melting” of the structure;
  • Cool the solid according to a particular temperature decreasing scheme in order to reach a solid-state of minimum energy.
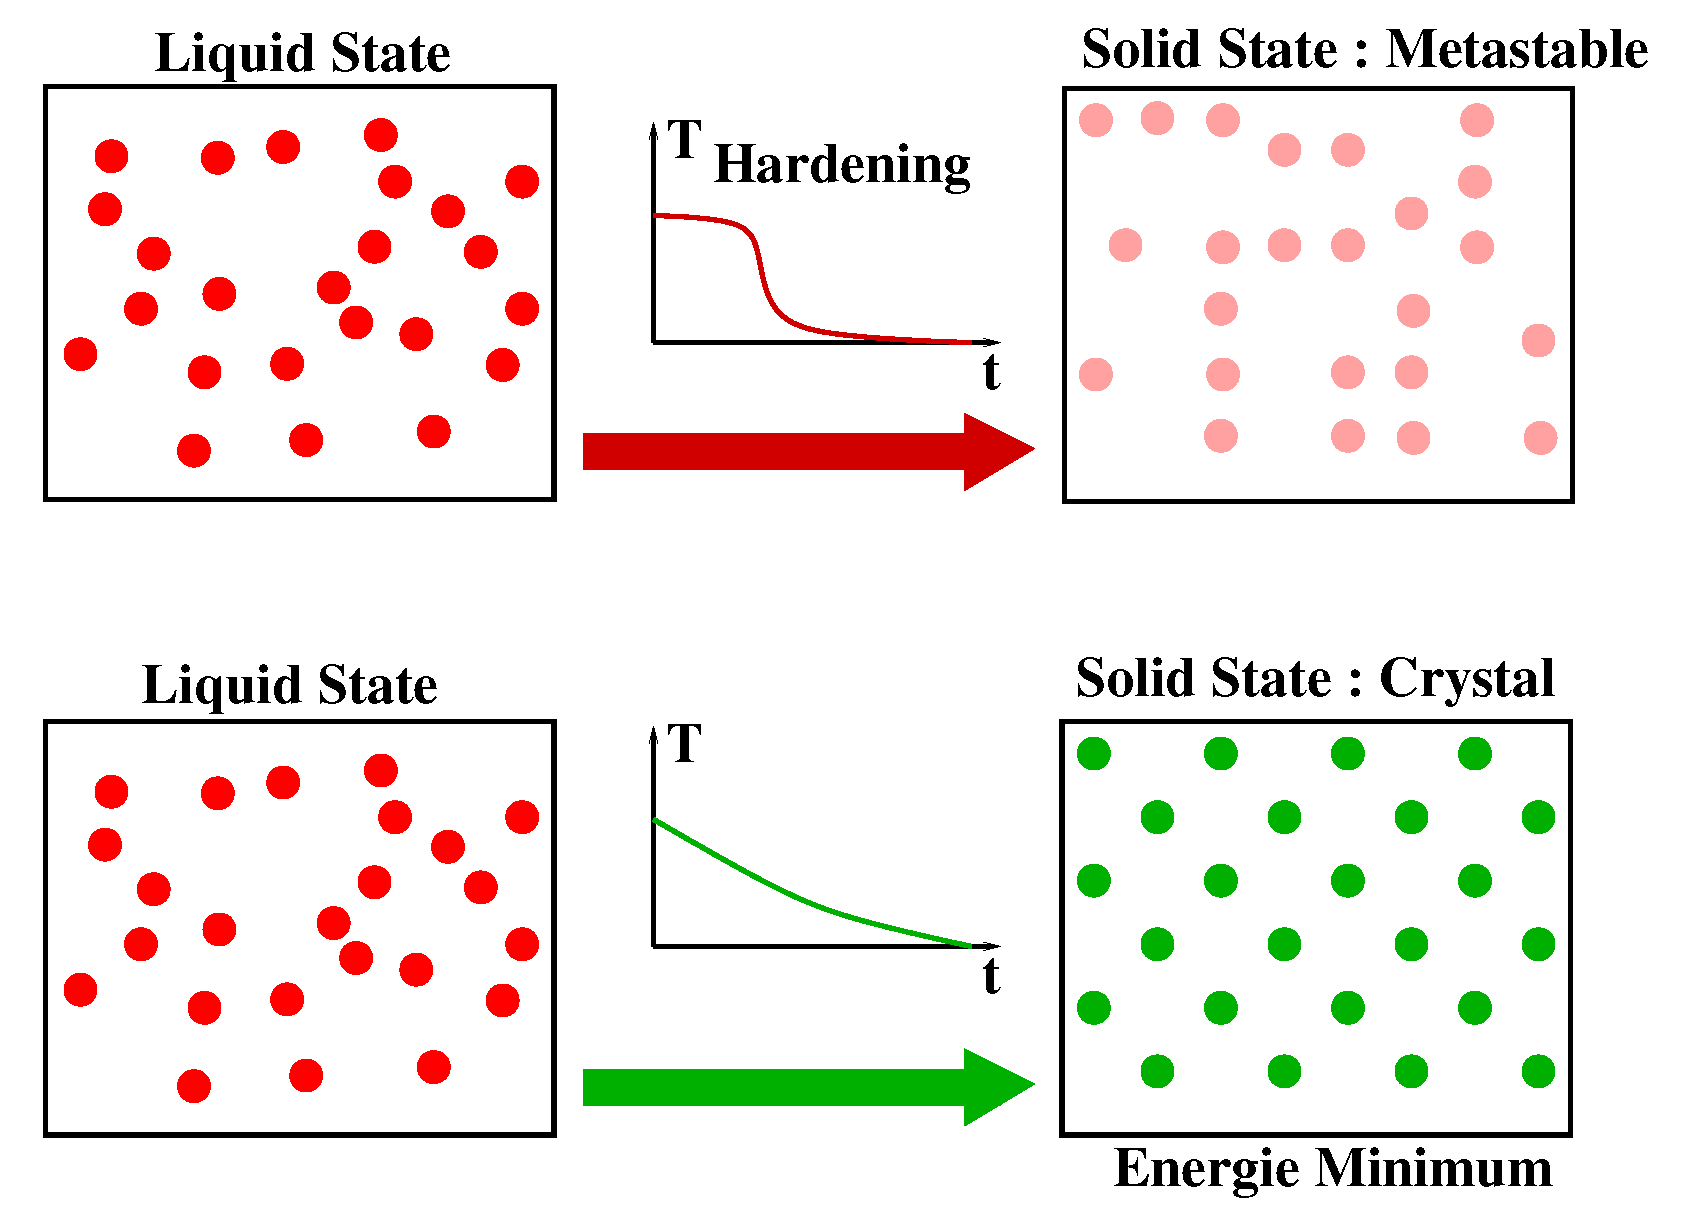
Figure 2. When the temperature is high, the material is in a liquid state (left). For a hardening process, the material reaches a solid state with nonminimal energy (metastable state; top right). In this case, the structure of the atoms has no symmetry. During a slow annealing process, the material also reaches a solid state, but one in which the atoms are organized with symmetry (crystal; bottom right).
Aerospace 08 00288 g002
In the liquid phase, the particles are distributed randomly. It is shown that the minimum energy state is reached provided that the initial temperature is sufficiently high and the cooling time is sufficiently long. If this is not the case, the solid will be found in a metastable state with nonminimal energy. This state is referred to as hardening, which consists of the sudden cooling of a solid.
In 1953, three American researchers (Metropolis, Rosenbluth, and Teller [21]) developed an algorithm to simulate physical annealing. They aimed to reproduce faithfully the evolution of the physical structure of a material undergoing annealing. This algorithm is based on Monte Carlo techniques, which generate a sequence of states of the solid in the following way.
Starting from an initial state i of energy E i , a new state j of energy E j is generated by modifying the position of one particle.
If the energy difference, E i E j , is positive (the new state features lower energy), the state j becomes the new current state. If the energy difference is less than or equal to zero, then the probability that the state j becomes the current state is given by:
P r { Current state = j } = exp E i E j k b . T
where T represents the temperature of the solid and k B is the Boltzmann constant ( k B = 1.38 × 10 23 joule/Kelvin).
The acceptance criterion of the new state is called the Metropolis criterion. If the cooling is carried out sufficiently slowly, the solid reaches a state of equilibrium at each given temperature T. In the Metropolis algorithm, this equilibrium is achieved by generating a large number of transitions at each temperature. The thermal equilibrium is characterized by the Boltzmann statistical distribution. This distribution gives the probability that the solid is in the state i of energy E i at the temperature T:
P r { X = i } = 1 Z ( T ) e E i k b T
where X is a random variable associated with the current state of the solid, Z ( T ) is the distribution function of X at temperature T. This allows the normalization:
Z ( T ) = j S e E j k b T .
The Metropolis algorithm is applied to generate a sequence of solutions in the state space S in the SA algorithm. To do this, an analogy is made between a multiparticle system and our optimization problem by using the following equivalences:
  • The state-space points represent the possible states of the solid;
  • The function to be minimized represents the energy of the solid.
A control parameter c, acting as a temperature, is then introduced. This parameter is homogeneous to the criterion that is optimized.
It is also assumed that the user provides for each point of the state space, a neighborhood, and a mechanism for generating a solution in this neighborhood. We then define the acceptance principle:
Definition 1.
Let ( S , f ) be an instantiation of a combinatorial minimization problem, and i, j be two points of the state space. The acceptance criterion for accepting solution j from the current solution i is given by the following probability:
P r { a c c e p t j } = 1 i f f ( j ) < f ( i ) exp f ( i ) f ( j ) c e l s e .
By analogy, the principle of generation of a neighbor corresponds to the perturbation mechanism of the Metropolis algorithm, and the principle of acceptance represents the Metropolis criterion.
The principle of SA can be summarized as follows:
1
Initialization ( i : = i s t a r t , k : = 0 , c k = c 0 , L k : = L 0 );
2
Repeat:
3
For l = 0 to L k do
  • Generate a solution j from the neighborhood S i of the current solution i;
  • If f ( j ) < f ( i ) then i : = j (j becomes the current solution);
  • Else, j becomes the current solution with probability e f ( i ) f ( j ) c k ;
4
k : = k + 1 ;
5
Compute( L k , c k );
6
Until c k 0 ;
One of the main features of simulated annealing is its ability to accept transitions that degrade the objective function.

4.2. Evaluation-Based Simulation

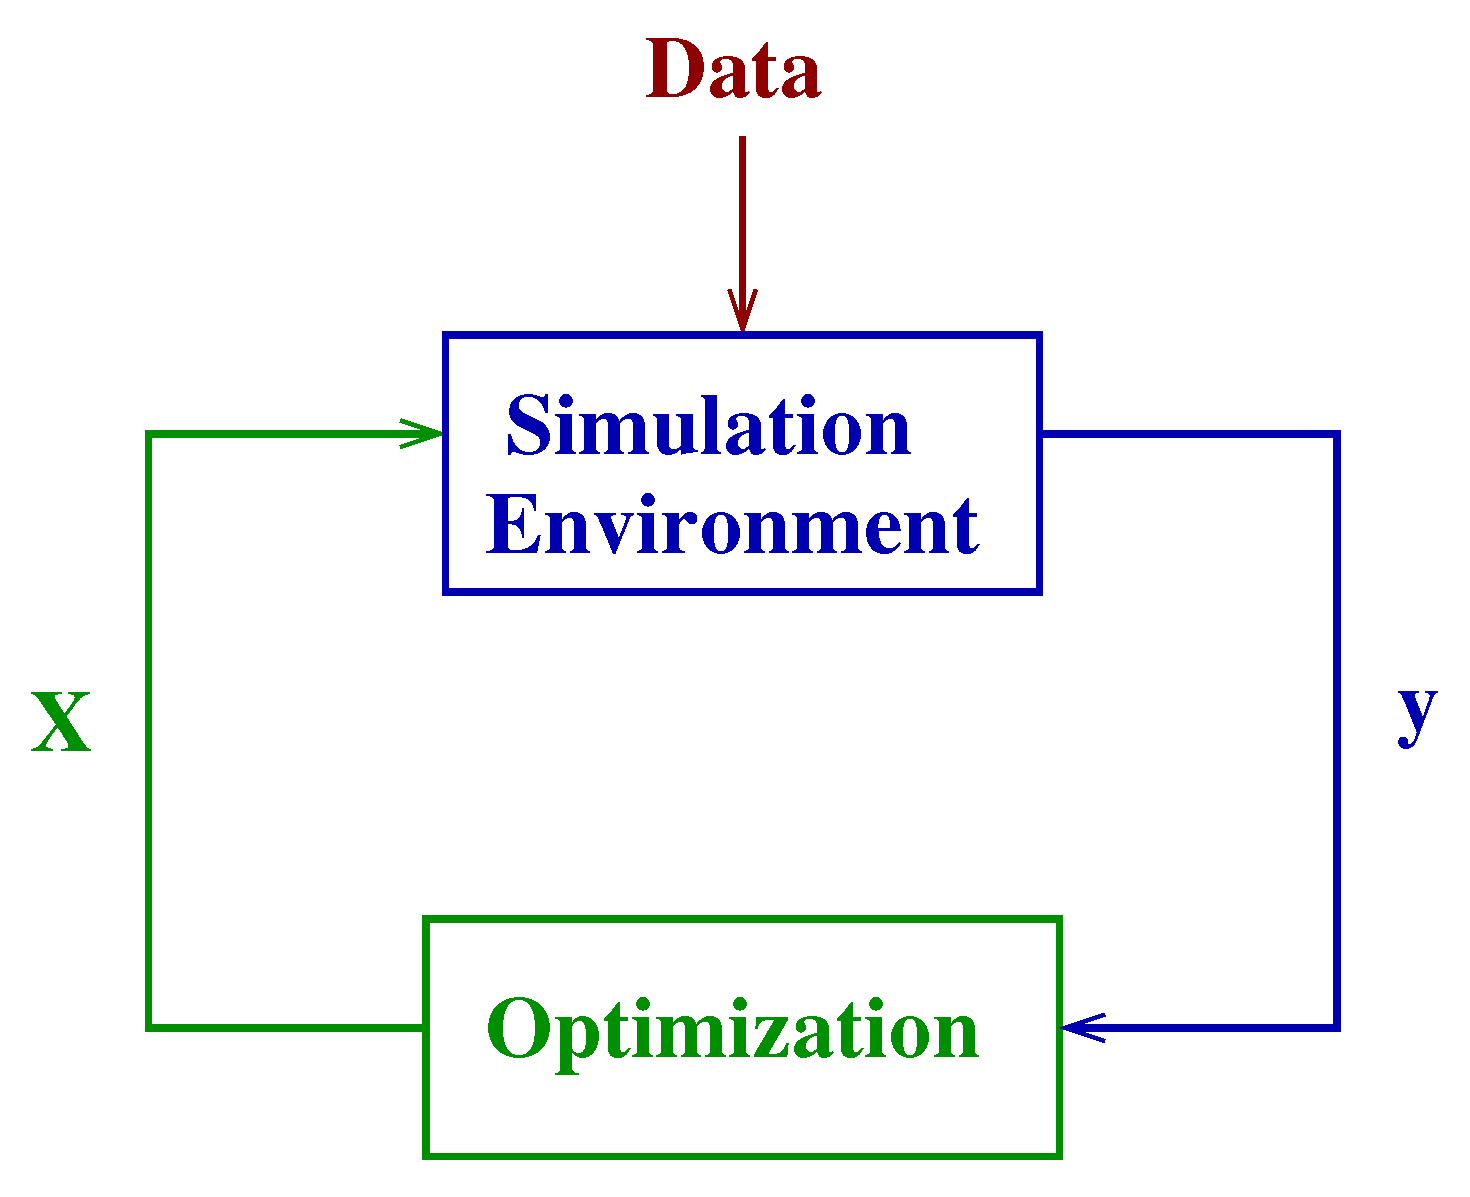
The objective function is evaluated in many optimization applications thanks to a computer simulation process that requires a simulation environment. In such a case, the optimization algorithm controls the vector of decision variables, X, which are used by the simulation process in order to compute the performance (quality), y, of such decisions, as shown in Figure 3.
In this situation, population-based algorithms may not be adapted to address such problems, mainly when the simulation environment requires a considerable amount of memory space, as nowadays is often the case in real-life complex systems. In fact, in the case of a population-based approach, the simulation environment has to be duplicated for each individual of the population of solutions, which may require an excessive amount of memory. In order to avoid this drawback, one may think about having only one simulation environment that could be used each time a point in the population has to be evaluated, as follows. In order to evaluate one population, one first considers the first individual. Then, the simulation environment is initiated, and the simulation associated with the first individual is run. The associated performance is then transferred to the optimization algorithm. After that, the second individual is evaluated, but the algorithm must first clear the simulation environment from the events of the first simulation. The simulation is then run for the second individual, and up to the last individual of the population being evaluated. In this case, the memory space is not an issue anymore. Still, the evaluation time may be excessive and the overall process too slow because the simulation environment is reset at each evaluation.
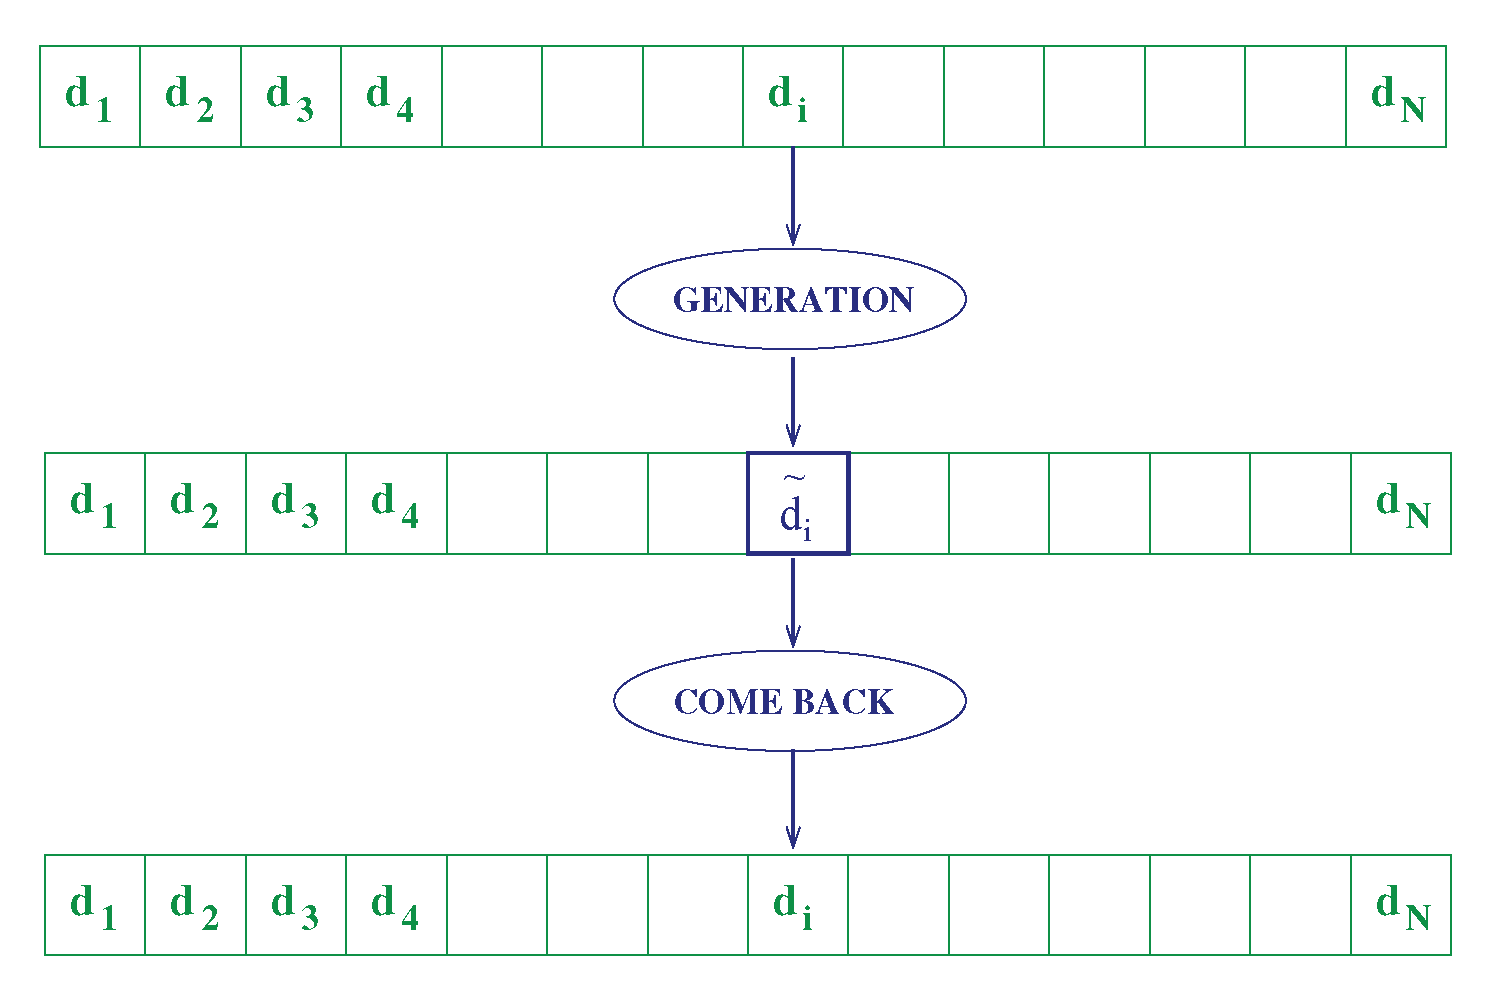
A copy of a state-space point is requested in the standard simulated annealing algorithm for each proposed transition. A point X j is generated from the current point X i through a copy in the memory of the computer. In the case of state spaces of large dimensions, the simple process of implementing such a copy may be inefficient and drastically reduce the simulated annealing performance. In such a case, it is much more efficient to consider a come back operator, which cancels the effect of a generation. Let G be the generation operator which transforms a point from X i to X j :
G X i X j
the comeback operator is the inverse, G 1 , of the generation operator.
Usually, such a generation modifies only one component of the current solution. In this case, the vector X i can be modified without being duplicated. According to the value obtained when evaluating this new point, two options may be considered:
1
The new solution is accepted and, in this case, only the current objective-function value is updated.
2
Else, the comeback operator G 1 is applied to the current position in the state space in order to come back to the previous solution before the generation, again without any duplication in the memory.
This process is summarized in Figure 4.
The come back operator has to be used carefully because it can easily generate undesired distortions in the way the algorithm searches the state space. For example, suppose some secondary evaluation variables are used and modified for computing the overall evaluation. In that case, such variables must also recover their initial value, and the come back operator must therefore ensure the coherence of the state space.

4.3. Selective Simulated Annealing (SSA)

When a decision is put or removed from the simulation environment, one must compute the effect on the objective function y. Several situations may happen depending on the structure of the objective function. The easiest case is when it is possible to efficiently compute the impact of a single decision change on the objective function. The notion is closely related to the separability property of the objective function. If we consider that the current objective function is noted y o l d associated to the current decision vector X o l d and suppose that a decision change is proposed for decision i ( d n e w i ) inducing a new state vector X n e w . One must determine if the impact on the objective function may be computed without evaluating all the decisions in the simulation environment. For some problems, such re-evaluation is limited to some decision variables. It is quite easy to compute the impact on the objective function by using a limited differential objective gap ( Δ y i ) without re-evaluating all the decisions. So, when a solution is removed from the simulation environment, one can compute the impact of the objective function easily by using the following equation:
y n e w = y o l d Δ y i r e m o v e + Δ y i p u t
where y n e w is the new objective function after inserting the selected decision in the simulation environment, Δ y i r e m o v e is the impact on the objective function when the former decision d o l d i is removed from the simulation environment and Δ y i p u t is the impact on the objective function when the new decision d n e w i is inserted in the simulation environment.
When such a differential evaluation of the objective function is not possible at the microscopic decision level, one must recompute all the decision variable evaluations in order to determine y n e w . For some cases, such a re-evaluation may request quite a lot of computation. In order to avoid this issue, we propose an alternative approximation of the standard simulated annealing called “Selective Simulated Annealing”. This approximation starts to evaluate all the decisions d i and associates a cost to each of them y i . For our problem, such an evaluation will be given by summating the congestion along the arc length of the associated trajectory γ i ( t ) . We then have a vector of decisions with their associated “costs” as shown in Figure 5.
The summation of individual costs gives the overall evaluation:
y = i = 1 i = N y i
The heating process consists of applying individual decision changes and individual cost evaluations in order to compute y i o l d and y i n e w ( i { 1 , N } ). If y i n e w is lower than y i o l d the microscopic transition is considered as accepted and if not, it could be accepted based on the Metropolis criterion. The following equation can summarize this:
P r { a c c e p t j } = 1 i f   y i n e w < y i o l d exp y i n e w y i o l d c e l s e .
where c is the overall temperature. This temperature is then increased until the acceptance rate reaches ≃80%.
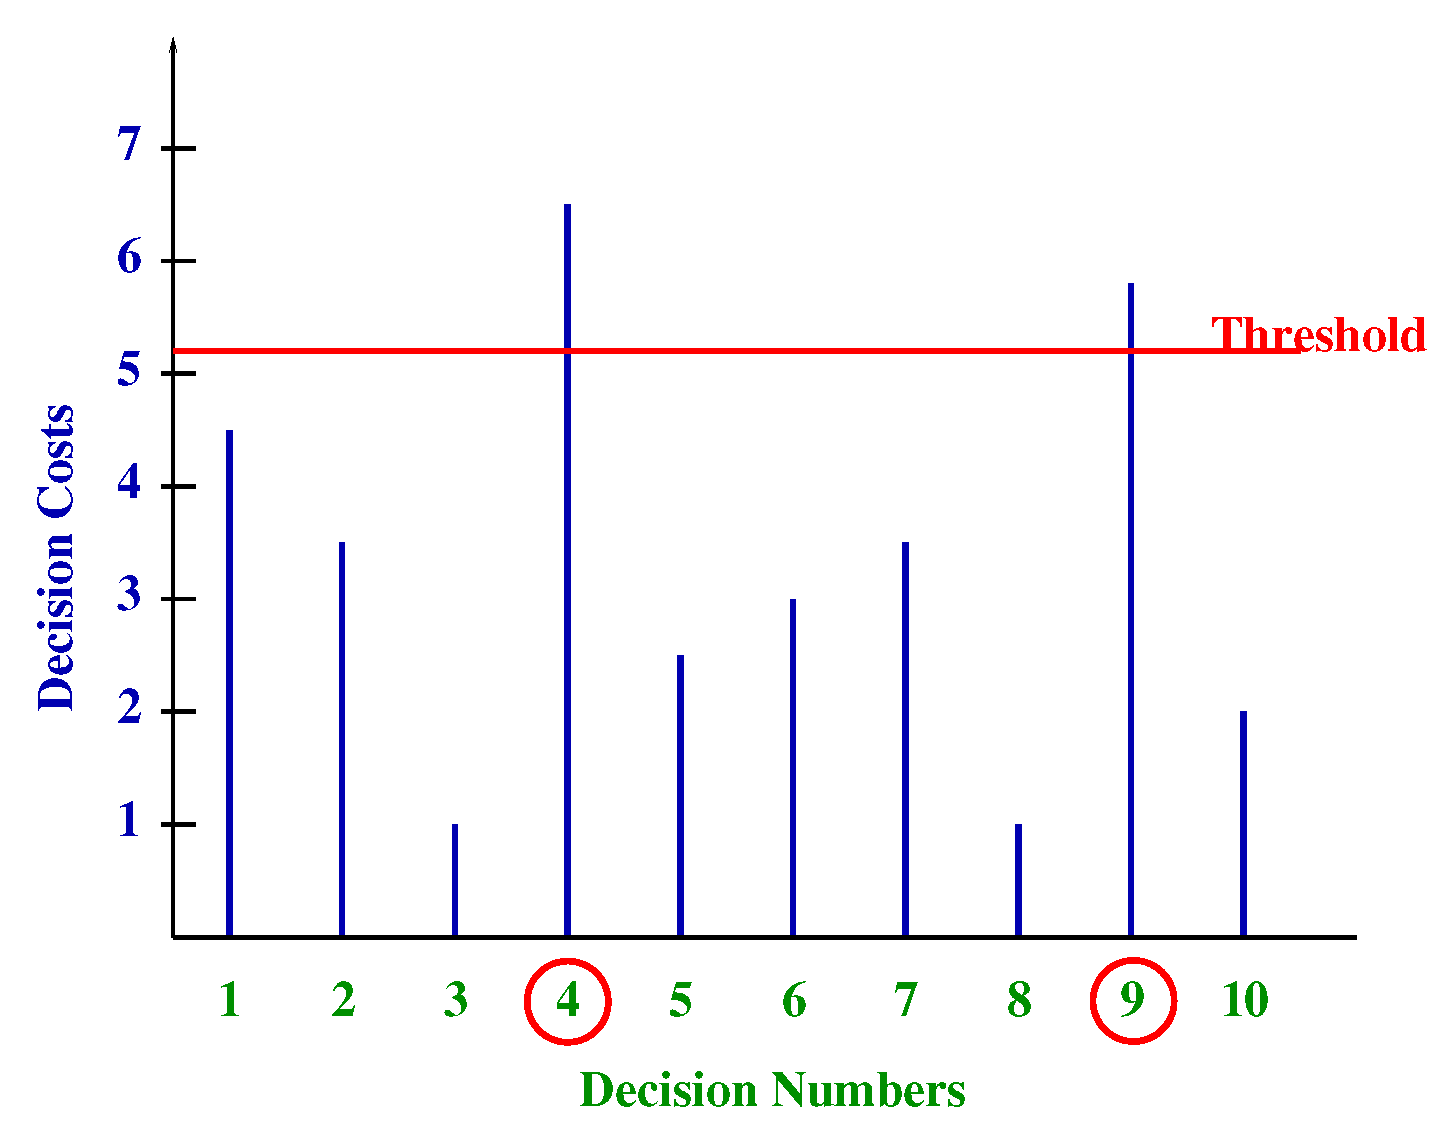
For the cooling process, the algorithm first identifies the worst decision in terms of the cost. Based on this “max” cost, a threshold is established in order to determine the decision that will undergo a neighborhood operator (see Figure 6).
This process focuses mainly on decisions with worse costs. But as previously mentioned, decision changes may impact others’ decisions, which are not easy to identify (no explicit decision dependencies in the objective function). It means that a reduction of cost on a decision may increase the cost of another decision. Still, in our case, it is difficult to identify which decision will be impacted by the change of the former decision. In order to ensure coherence of the overall objective function, a complete evaluation of the decision vector is regularly computed. As we will see in the result, this approximation improves the computation performance without sacrificing the quality of the final solution.

4.4. Implementation of SSA for Our Problem

4.4.1. Coding of the Solution

The state-space coding used for our problem is quite simple and easy to manipulate. As illustrated in Figure 5, our state space is coded by the mean of a decision vector. Each dimension of such a vector represents a decision that can be applied to an aircraft, in our case, a time shift. Such a time shift is coded by an integer (positive or negative) which corresponds to the amount of time (in time slots) the aircraft is shifted when it enters the airspace. This time shift can be absorbed before take-off or onboard in some previous neighboring airspace. Each decision also contains a field representing the aircraft trajectory’s associated performance in the airspace (y).

4.4.2. Neighboring Operator

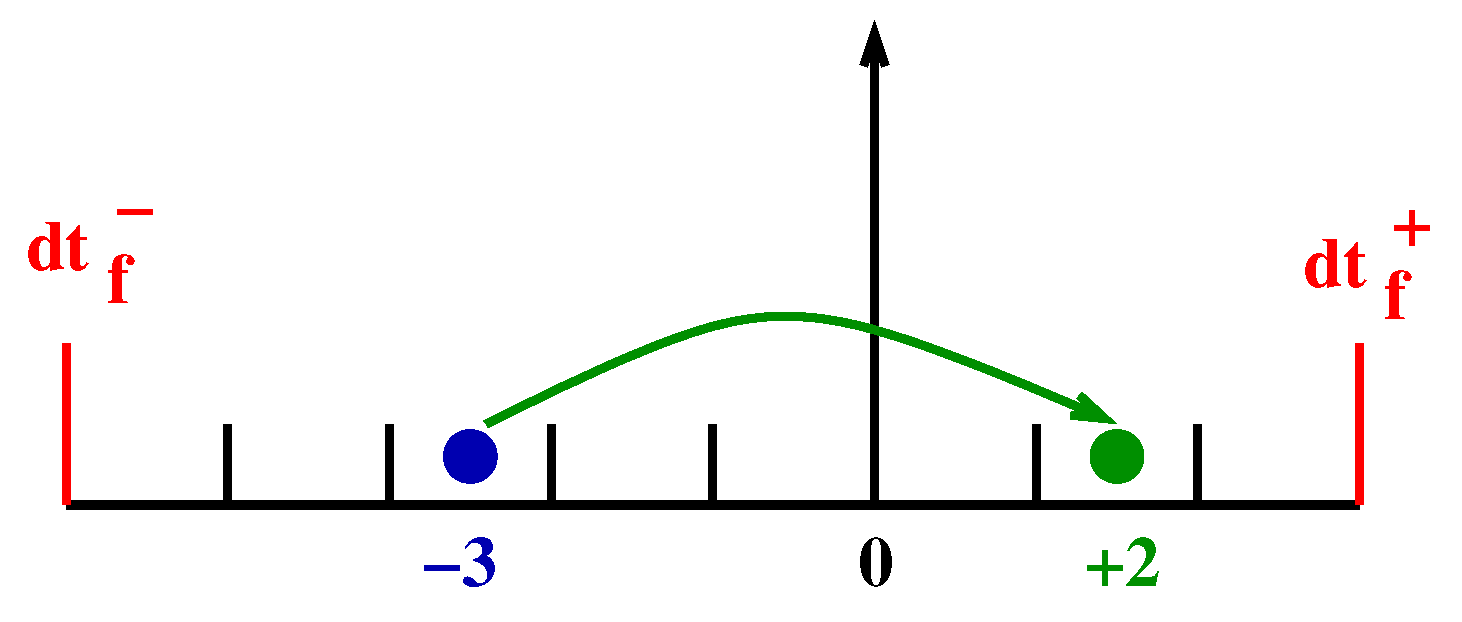
The decision that undergoes a neighboring operator for a given transition is selected, thanks to the cost threshold comparison. Suppose the current decision has an individual cost higher than the computed cost threshold (80% of the max cost). In that case, it is changed by randomly modifying the time shift associated with such a decision considering the aircraft’s feasible time shift range (see Figure 7).

4.4.3. Objective Function Computation

In order to evaluate the objective function, we rely on a grid-based airspace definition which is implemented in a so-called hash table as presented in [22,23]. First, the airspace is discretized using a 4D grid (3D space + time), as illustrated in Figure 8. The size of each cell in the space and time dimensions is defined by the neighborhood area, which has to be checked (in space and time dimension around a given aircraft i at a given time t). All trajectories are first inserted in such a 4D cube with, for each trajectory sample, its associated grid cell coordinates: ( I x , I y , I z , I t ). To compute the complexity associated with a given trajectory sample for which we know the associated grid coordinate, the neighboring cells in all dimensions are checked in order to establish the list of neighboring aircraft around the considered aircraft. Based on their associated positions and speed vectors, one can compute the speed vector disorder metric associated with the considered trajectory sample called c k , representing the complexity metric associated with the trajectory sample number k of the considered aircraft. The process is repeated for all the trajectory samples constituting the considered aircraft trajectory to compute the complexity cost ( y i ) of aircraft i. This computation is then iterated for all aircraft involved in the simulation.

5. Results

5.1. Benchmark Data

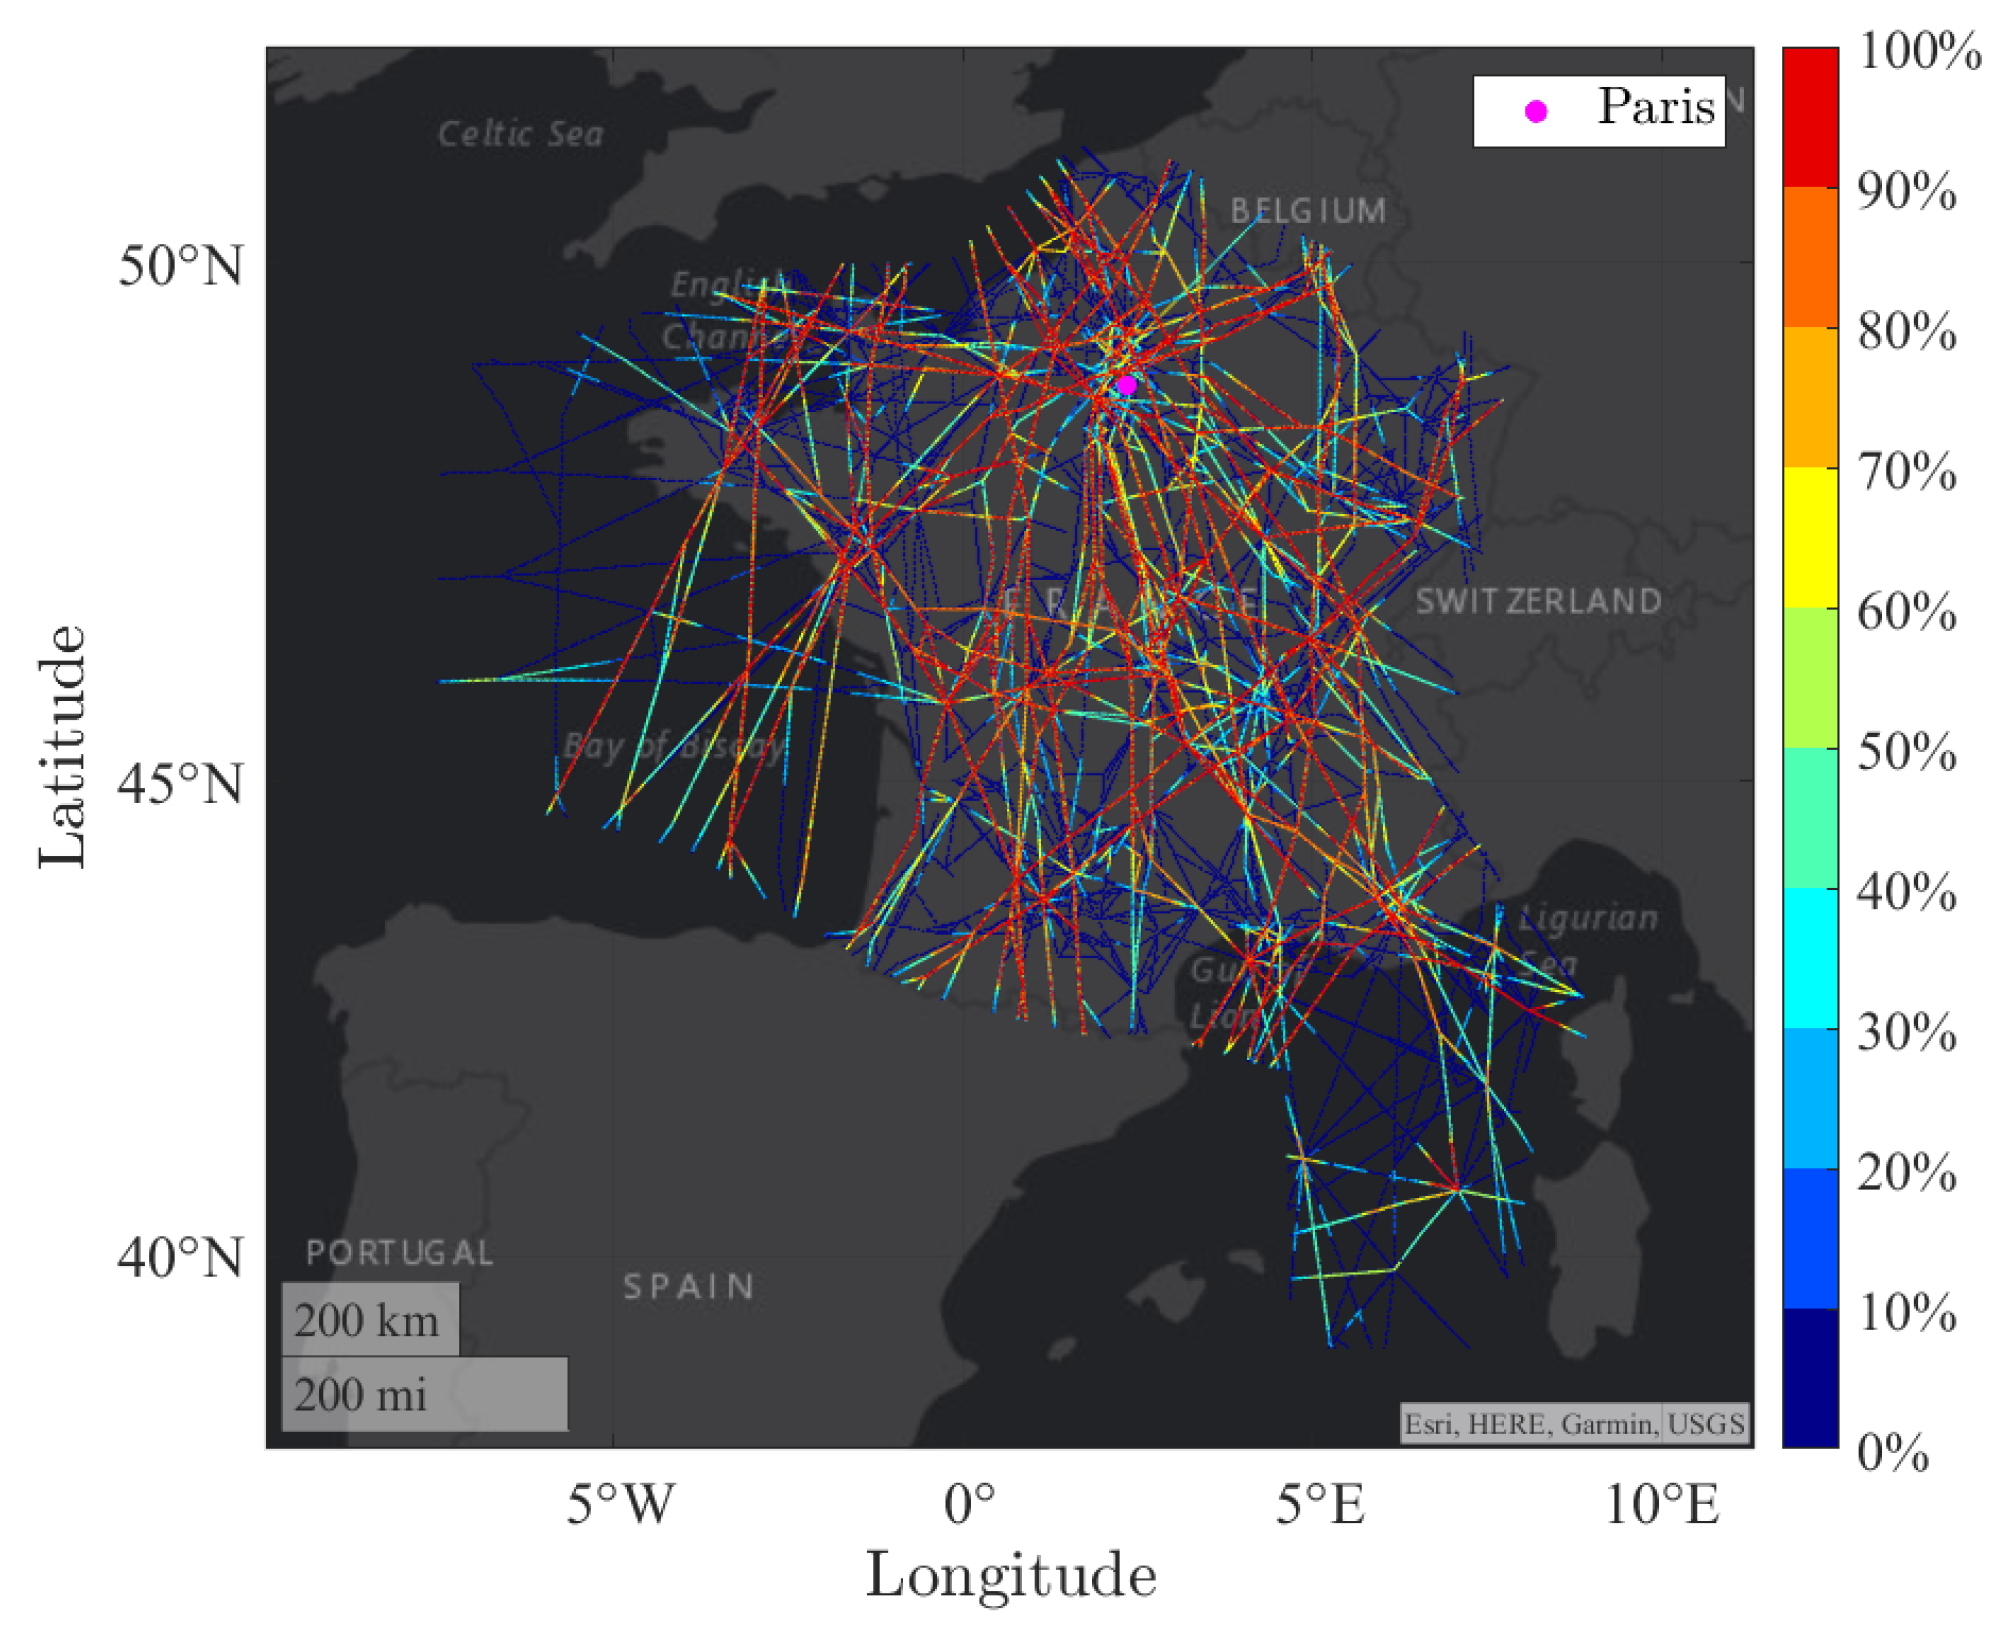
The data set corresponds to air traffic over French airspace during a full day (16 July 2019). It consists of 8800 flights that have been simulated (thanks to the ENAC BADA arithmetic simulator) based on actual flight plans over French airspace. Figure 9 illustrates the initial given trajectories. The trajectories are represented by a curvilinear curve, sampled in time every 15 s. Therefore, a trajectory is a list of 4D points positioned in space (latitude, longitude, altitude) and time steps. The velocity and heading are known for each point because it is needed to find the air traffic congestion. With the sampling time of 15 s, the total number of 4D points in the airspace is over 7,500,000. The congestion has to be computed for each point of the airspace. Thus, the objective function has a high computation time.
In Figure 9 the trajectories are colorized according to their initial complexity (speed covariance metric described in the mathematical model Section 3). Trajectories with the lowest complexity are shown in blue, whereas the highest are drawn in red, based on a logarithmic scale.

5.2. Benchmark Results

The proposed strategic 4D trajectory planning methodology is implemented in the programming language Java on a computer with the following configuration:
  • CPU: Intel Xeon Gold 6230 at 2.10 Ghz;
  • RAM: 1 TB.
The algorithm is tested on the data explained in Section 5.1. As shown in Figure 9, the complexity is high and has to be reduced with the proposed algorithm. The initial worst congestion of the data set is 1,500,000.
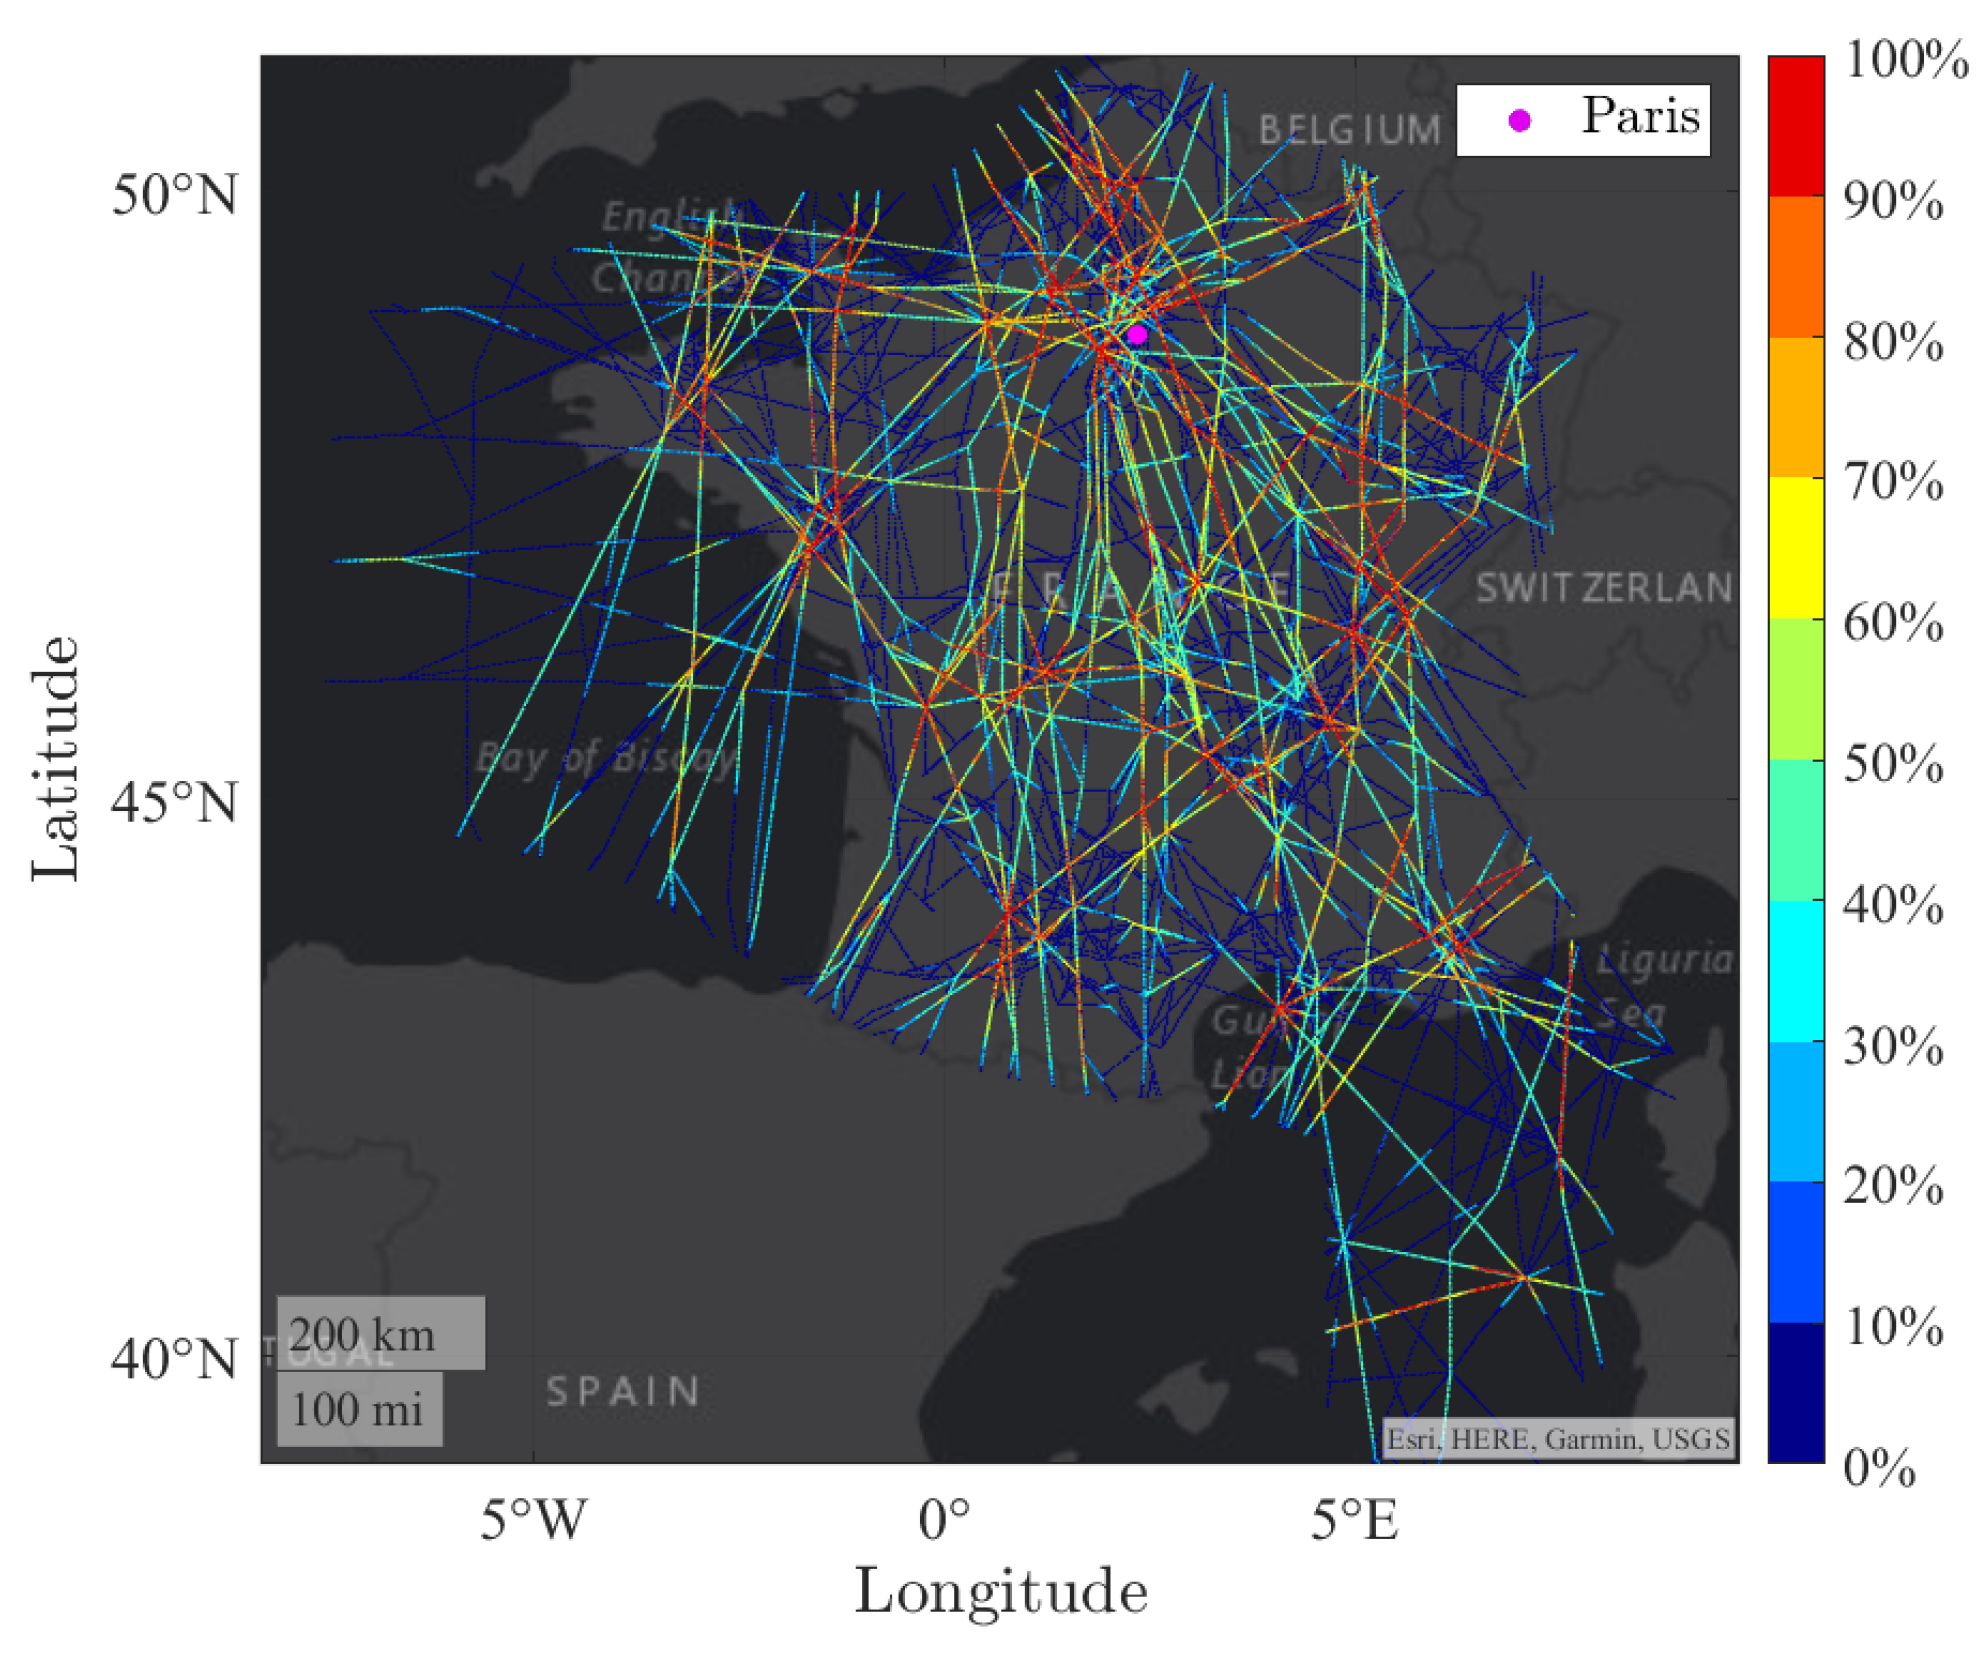
After running the algorithm, for about two hours, the worst flight of the data set has a congestion value of 120,000, see detailed results in Table 1. Moreover, in Figure 10, there are fewer trajectories that are red and more trajectories that are blue. This means the trajectories are less complex. Hence, the air traffic is less congested.
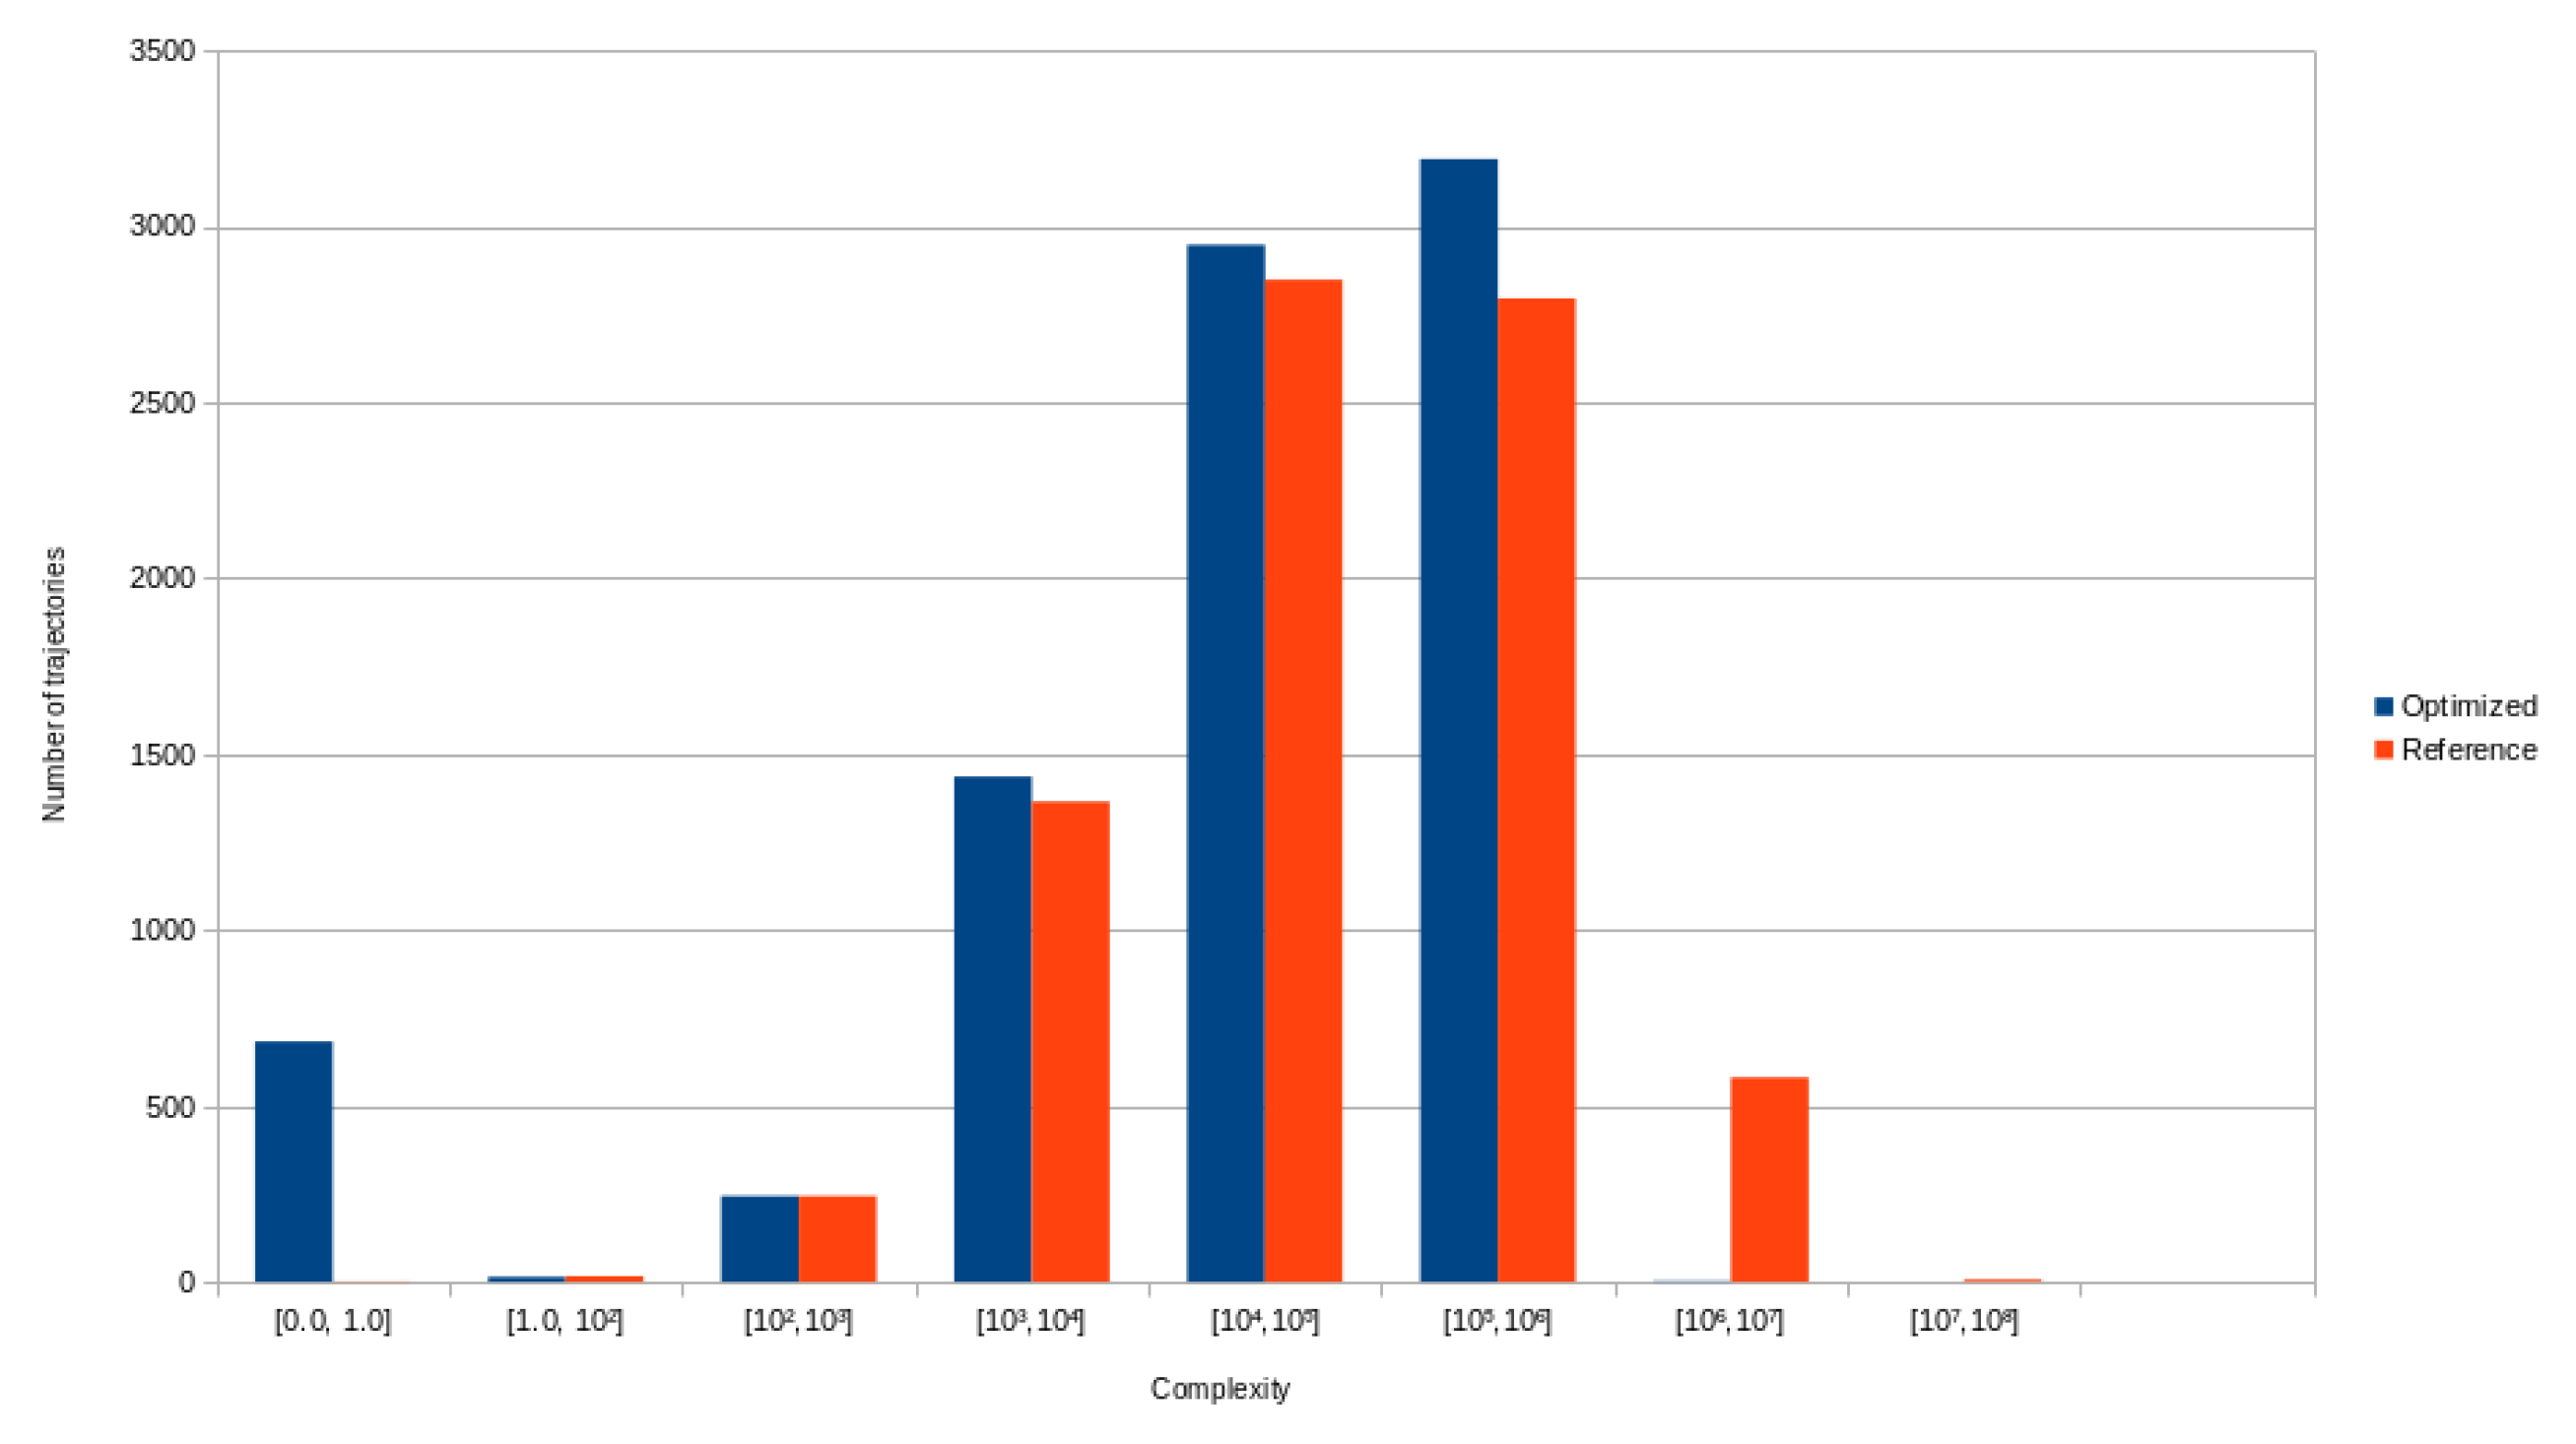
In Figure 11 the complexity of each trajectory is represented in a bar chart. A logarithmic scale groups the complexity of each trajectory to compare the benefits of optimization easily. The complexity is computed after optimization using only time shifts of the departure time. The number of trajectories with high complexity is reduced.
The two hours of computation which has been used for such complexity reduction may be reduced for further experiments. After 45 min, the objective function does not evolve anymore, and we could consider that the algorithm has reached the “optimum”. We will address this point in further research to adjust the right amount of computation for a given problem size.

6. Conclusions

This paper introduced the work done on large-scale trajectory planning. In free-flight, trajectory deconfliction algorithms have to be updated to enable large-scale air traffic. Controllers have an increasing free-flight workload, since aircraft do not always follow patterns. Thus, the airspace has a limited capacity that directly impacts the flight by changing its departure time. On the other hand, airlines wish to have efficient flights with few departure time changes due to congested airspace. We have developed a decision support tool to help the strategic planning of free-flights in a given airspace to solve these issues. After reviewing the concepts and previous works related to our subject, we based our study on mathematical modeling of the problem followed by an optimization algorithm in order to reduce air traffic congestion. The selective simulated annealing algorithm for optimizing flight decisions appeared to be a good choice given its efficiency and adaptability properties. A first trial of our solution on real traffic data over French airspace displayed a good congestion reduction and an acceptable time shift of flights’ departure times.

Author Contributions

The contributions of the authors are the following: conceptualization (J.L., A.I., D.D., S.C, A.A.), methodology (J.L., A.I., D.D., S.C, A.A.), software (D.D., A.A., S.C., J.L.), writing (J.L., A.I., D.D., S.C, A.A.). All authors have read and agreed to the published version of the manuscript.

Funding

This research received no external funding.

Institutional Review Board Statement

Not applicable.

Informed Consent Statement

Not applicable.

Conflicts of Interest

The authors declare no conflict of interest.

References

  1. Hilburn, B. Cognitive Complexity and Air Traffic Control: A Literature Review; Technical Report; Center for Human Performance: Soesterberg, The Netherland, 2004. [Google Scholar]
  2. Mogford, H.; Guttman, J.; Morrowand, P.; Kopardekar, P. The Complexity Construct in Air Traffic Control: A Review and Synthesis of the Literature; Technical Report; FAA: Atlantic City, NJ, USA, 1995.
  3. Durand, N.; Gotteland, J.B. Genetic algorithms applied to air traffic management. In Metaheuristics for Hard Optimization: Simulated Annealing, Tabu Search, Evolutionary and Genetic Algorithms, Ant Colonies, … Methods and Case Studies; Dréo, J., Siarry, P., Pétrowski, A., Taillard, E., Eds.; Springer: Berlin/Heidelberg, Germany, 2006; pp. 277–306. [Google Scholar]
  4. Barnier, N.; Allignol, C. 4D-Trajectory Deconfliction through Departure Time Adjustment; Eighth USA/Europe Air Traffic Management Research and Development Seminar: Napa, CA, USA, 2009. [Google Scholar]
  5. Barnier, N.; Allignol, C. Combining Flight Level Allocation with Ground Holding to Optimize 4D-Deconfliction; Ninth USA/Europe Air Traffic Management Research and Development Seminar: Berlin, Germany, 2011. [Google Scholar]
  6. Dougui, N.; Delahaye, D.; Puechmorel, S.; Mongeau, M. A New Method for Generating Optimal Conflict Free 4D Trajectory. In Proceedings of the 4th International Conference on Research in Air Transportation, Budapest, Hungary, 1–4 June 2010. [Google Scholar]
  7. Dougui, N.; Delahaye, D.; Puechmorel, S.; Mongeau, M. A light-propagation model for aircraft trajectory planning. J. Glob. Optim. 2013, 56, 873–895. [Google Scholar] [CrossRef] [Green Version]
  8. Islami, A.; Chaimatanan, S.; Delahaye, D. Large scale 4D trajectory planning. In Air Traffic Management and Systems—II; Lecture Notes in Electrical Engineering; Springer: Tokyo, Japan, 2016; Volume 420, pp. 27–47. [Google Scholar]
  9. Odoni, A. The flow management problem in air traffic control. In Flow Control of Cogested Networks; Odoni, A.E.A., Ed.; NATO ASI Series; Springer: Berlin/Heidelberg, Germany, 1987; Volume F38, pp. 269–288. [Google Scholar]
  10. Terrab, M.; Odoni, A. Strategic Flow Management for Air Traffic Control. Oper. Res. 1993, 41, 138–152. [Google Scholar] [CrossRef]
  11. Richetta, O.; Odoni, A. Dynamic Solution to the Ground-Holding Problem in Air Traffic Control. Transp. Res. 1994, 28, 167–185. [Google Scholar] [CrossRef]
  12. Andreatta, G.; Romanin-Jacur, G. Aircraft Flow Management under Congestion. Transp. Sci. 1987, 21, 249–253. [Google Scholar] [CrossRef]
  13. Richetta, O.; Odoni, A. Solving Optimally the Static Ground Holding Policy Problem in Air Traffic Control. Transp. Sci. 1993, 27, 228–238. [Google Scholar] [CrossRef]
  14. Wang, H. A Dynamic Programming Framework for the Global Flow Control Problem in Air Traffic Management. Transp. Sci. 1991, 25, 308–313. [Google Scholar] [CrossRef] [Green Version]
  15. Andreatta, G.; Odoni, A.; Richetta, O. Models for the ground holding problem. In Large Scale Computation and Information Processing in Air Traffic Control; Bianco, L., Odoni, A., Eds.; Transportation Analysis; Springer: Berlin/Heidelberg, Germany, 1993; pp. 125–168. [Google Scholar]
  16. Bertsimas, D.; Stock, S. The Air Traffic Flow Management Problem with En-Route Capacities; Technical Report; A.P Sloan School of Management. M.I.T.: Cambridge, MA, USA, 1994. [Google Scholar]
  17. Tosic, V.; Babic, O.; Cangalovic, M.; Hohlacov, D. Some models and algorithms for en-route air traffic flow management faculty transport. Transp. Plan. Technol. 1995, 19, 147–164. [Google Scholar] [CrossRef]
  18. Alam, S.; Delahaye, D.; Chaimatanan, S.; Féron, E. A distributed air traffic flow management model for european functional airspace blocks. In Proceedings of the 12th USA/Europe Air Traffic Management Research and Development Seminar, Seattle, WA, USA, 27–30 June 2017. [Google Scholar]
  19. Juntama, P.; Chaimatanan, S.; Alam, S.; Delahaye, D. A distributed metaheuristic approach for complexity reduction in air traffic for strategic 4D trajectory optimization. In Proceedings of the AIDA-AT 2020, 1st Conference on Artificial Intelligence and Data Analytics in Air Transportation, Singapore, 3–4 February 2020; pp. 1–9, ISBN 978-1-7281-5381-0. [Google Scholar]
  20. Kirkpatrick, S.; Gelatt, C.; Vecchi, M. Optimization by simulated annealing. Science 1983, 220, 671–680. [Google Scholar] [CrossRef] [PubMed]
  21. Metropolis, N.; Rosenbluth, A.; Rosenbluth, M.; Teller, A.; Teller, E. Equation of state calculation by fast computing machines. J. Chem. Phys. 1953, 21, 1087–1092. [Google Scholar] [CrossRef] [Green Version]
  22. Chaimatanan, S.; Delahaye, D.; Mongeau, M. Strategic deconfliction of aircraft trajectories. In Proceedings of the ISIATM 2013, the 2nd International Conference on Interdisciplinary Science for Innovative Air Traffic Management, Toulouse, France, 8–10 July 2013. [Google Scholar]
  23. Chaimatanan, S.; Delahaye, D.; Mongeau, M. A hybrid metaheuristic optimizationalgorithm for strategic planning of 4D aircraft trajectories at the continental scale. Comput. Intell. Mag. 2014, 9, 46–61. [Google Scholar] [CrossRef] [Green Version]
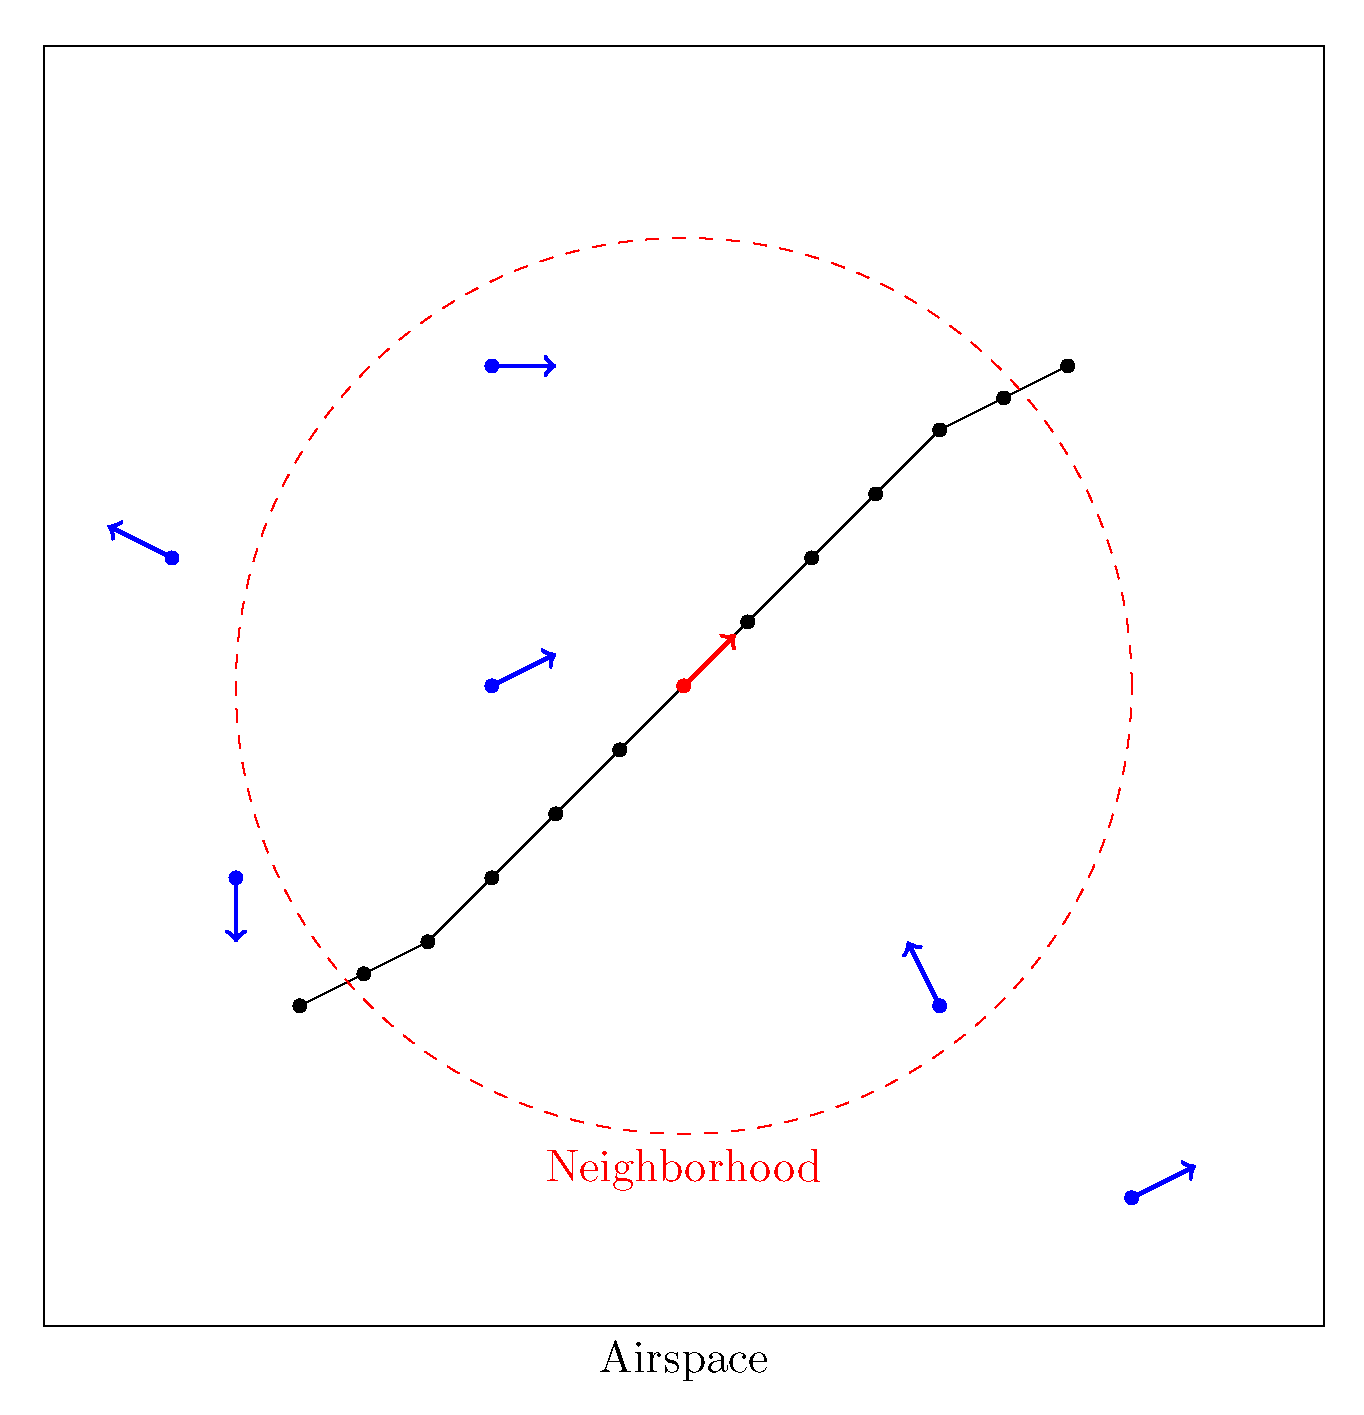
Figure 1. Spatial neighborhood of a 4D point in a curvilinear trajectory sampled in time.
Aerospace 08 00288 g001
Figure 3. Objective-function evaluation based on a simulation process.
Aerospace 08 00288 g003
Figure 4. Optimization of the generation process. In this figure, the state space is built with a vector of decision for which the generation process consists in changing only one decision ( d i ) in the current solution. If this generation is not accepted, this component of the solution recovers its former value. The only information to be stored is the integer i and the real number d i .
Aerospace 08 00288 g004
Figure 5. Vector of evaluated decisions.
Aerospace 08 00288 g005
Figure 6. In this example ten decisions are considered and their costs are illustrated by the vertical bars for which the highest cost is 6.5 . The threshold is then given by 6.5 × 0.8 = 5.2 . The decisions with a cost higher than 5.2 are then selected to undergo the neighboring operator.
Aerospace 08 00288 g006
Figure 7. Time shift operator. The new time shift for the flight f is randomly selected in a time domain defined by two bounds. A negative bound: d t f and a positive bound: d t f + . In this example, the former time shift was −3 (blue dot) and the new generated time shift is +2 (green dot).
Aerospace 08 00288 g007
Figure 8. 4D-Grid coding of the airspace. 4D-Grid coding of the airspace. This structure strongly speeds up the neighborhood search for a given aircraft.
Aerospace 08 00288 g008
Figure 9. Full day of air traffic over French airspace, colorized according to their initial complexity. The trajectories with the lowest complexity are shown in blue, whereas the highest are drawn in red.
Aerospace 08 00288 g009
Figure 10. Full day of air traffic over French airspace, colorized according to their complexity, after optimization of the trajectories to minimize the congestion using time shifts of the departure time. The trajectories with the lowest complexity are shown in blue, whereas the highest are drawn in red.
Aerospace 08 00288 g010
Figure 11. Comparison of the complexity of each trajectory before and after using only departure time shifting.
Aerospace 08 00288 g011
Table 1. Results of the algorithm.
Number of FlightsInitial Worst CongestionFinal Worst CongestionComputation Time
Time shifting88001,500,000120,0007700 (2 h)
Publisher’s Note: MDPI stays neutral with regard to jurisdictional claims in published maps and institutional affiliations.