Author Contributions
Conceptualization, F.A., A.M. and N.Y.; methodology, F.A., A.M., N.Y. and K.-i.O.; validation, F.A., N.Y. and K.-i.O.; formal analysis, F.A., A.M. and N.Y.; investigation, F.A., A.M. and N.Y.; resources, F.A., A.M., N.Y. and K.-i.O.; data curation, F.A., A.M. and N.Y.; writing—original draft preparation, F.A.; writing—review and editing, F.A. and K.-i.O.; visualization, F.A. and N.Y.; supervision, K.-i.O.; project administration, K.-i.O.; and funding acquisition, K.-i.O. All authors have read and agreed to the published version of the manuscript.
Figure 1.
Illustration of the laser-based DED process [
15].
Figure 1.
Illustration of the laser-based DED process [
15].
Figure 2.
CAD drawing of test samples: (a) arc heating test sample with the position of holes for placement of thermocouples; and (b) tensile test sample.
Figure 2.
CAD drawing of test samples: (a) arc heating test sample with the position of holes for placement of thermocouples; and (b) tensile test sample.
Figure 3.
Actual test samples: (a) side view of arc heating test sample; and (b) top view of the tensile test sample.
Figure 3.
Actual test samples: (a) side view of arc heating test sample; and (b) top view of the tensile test sample.
Figure 4.
The thermal cycle chamber used for exposing the tensile test and arc heating test samples to various numbers of thermal cycles.
Figure 4.
The thermal cycle chamber used for exposing the tensile test and arc heating test samples to various numbers of thermal cycles.
Figure 5.
Temperature profile for thermal cycle exposure.
Figure 5.
Temperature profile for thermal cycle exposure.
Figure 6.
Arc heated wind tunnel facility located in JAXA ISAS.
Figure 6.
Arc heated wind tunnel facility located in JAXA ISAS.
Figure 7.
Location of thermocouples within sample including the direction of heat flow. TC refers to the thermocouple.
Figure 7.
Location of thermocouples within sample including the direction of heat flow. TC refers to the thermocouple.
Figure 8.
Completed sample wrapped in glass cloth and Bakelite attached to the sample holder: (a) front view of the sample; and (b) side view of the sample attached to the sample holder.
Figure 8.
Completed sample wrapped in glass cloth and Bakelite attached to the sample holder: (a) front view of the sample; and (b) side view of the sample attached to the sample holder.
Figure 9.
View of ablator sample inside the arc heating chamber during the test.
Figure 9.
View of ablator sample inside the arc heating chamber during the test.
Figure 10.
Effect of variation in the number of thermal cycles and UV fluence on the tensile strength of 3D CF/PEEK.
Figure 10.
Effect of variation in the number of thermal cycles and UV fluence on the tensile strength of 3D CF/PEEK.
Figure 11.
Effect of variation in the number of thermal cycles and UV fluence on the Young’s Modulus of 3D CF/PEEK.
Figure 11.
Effect of variation in the number of thermal cycles and UV fluence on the Young’s Modulus of 3D CF/PEEK.
Figure 12.
External view of ablator sample before and after arc heating test: (a) front view of sample before arc heating test; (b) front view of the sample after test; and (c) side view of the sample after the test.
Figure 12.
External view of ablator sample before and after arc heating test: (a) front view of sample before arc heating test; (b) front view of the sample after test; and (c) side view of the sample after the test.
Figure 13.
Relationship between surface recession with maximum surface temperature of 3D CF/PEEK.
Figure 13.
Relationship between surface recession with maximum surface temperature of 3D CF/PEEK.
Figure 14.
Relationship between maximum surface temperature and heat flux.
Figure 14.
Relationship between maximum surface temperature and heat flux.
Figure 15.
Comparison in time history of in-depth temperature between sample exposed to 5 and 14.2 MW/m2: (a) temperature at a depth of 5 mm; (b) temperature at a depth of 10 mm; and (c) temperature at a depth of 20 mm.
Figure 15.
Comparison in time history of in-depth temperature between sample exposed to 5 and 14.2 MW/m2: (a) temperature at a depth of 5 mm; (b) temperature at a depth of 10 mm; and (c) temperature at a depth of 20 mm.
Figure 16.
Time history of surface temperature during arc heating test: (a) comparison between the base sample and thermally cycled samples; and (b) comparison between the base sample and UV irradiated samples.
Figure 16.
Time history of surface temperature during arc heating test: (a) comparison between the base sample and thermally cycled samples; and (b) comparison between the base sample and UV irradiated samples.
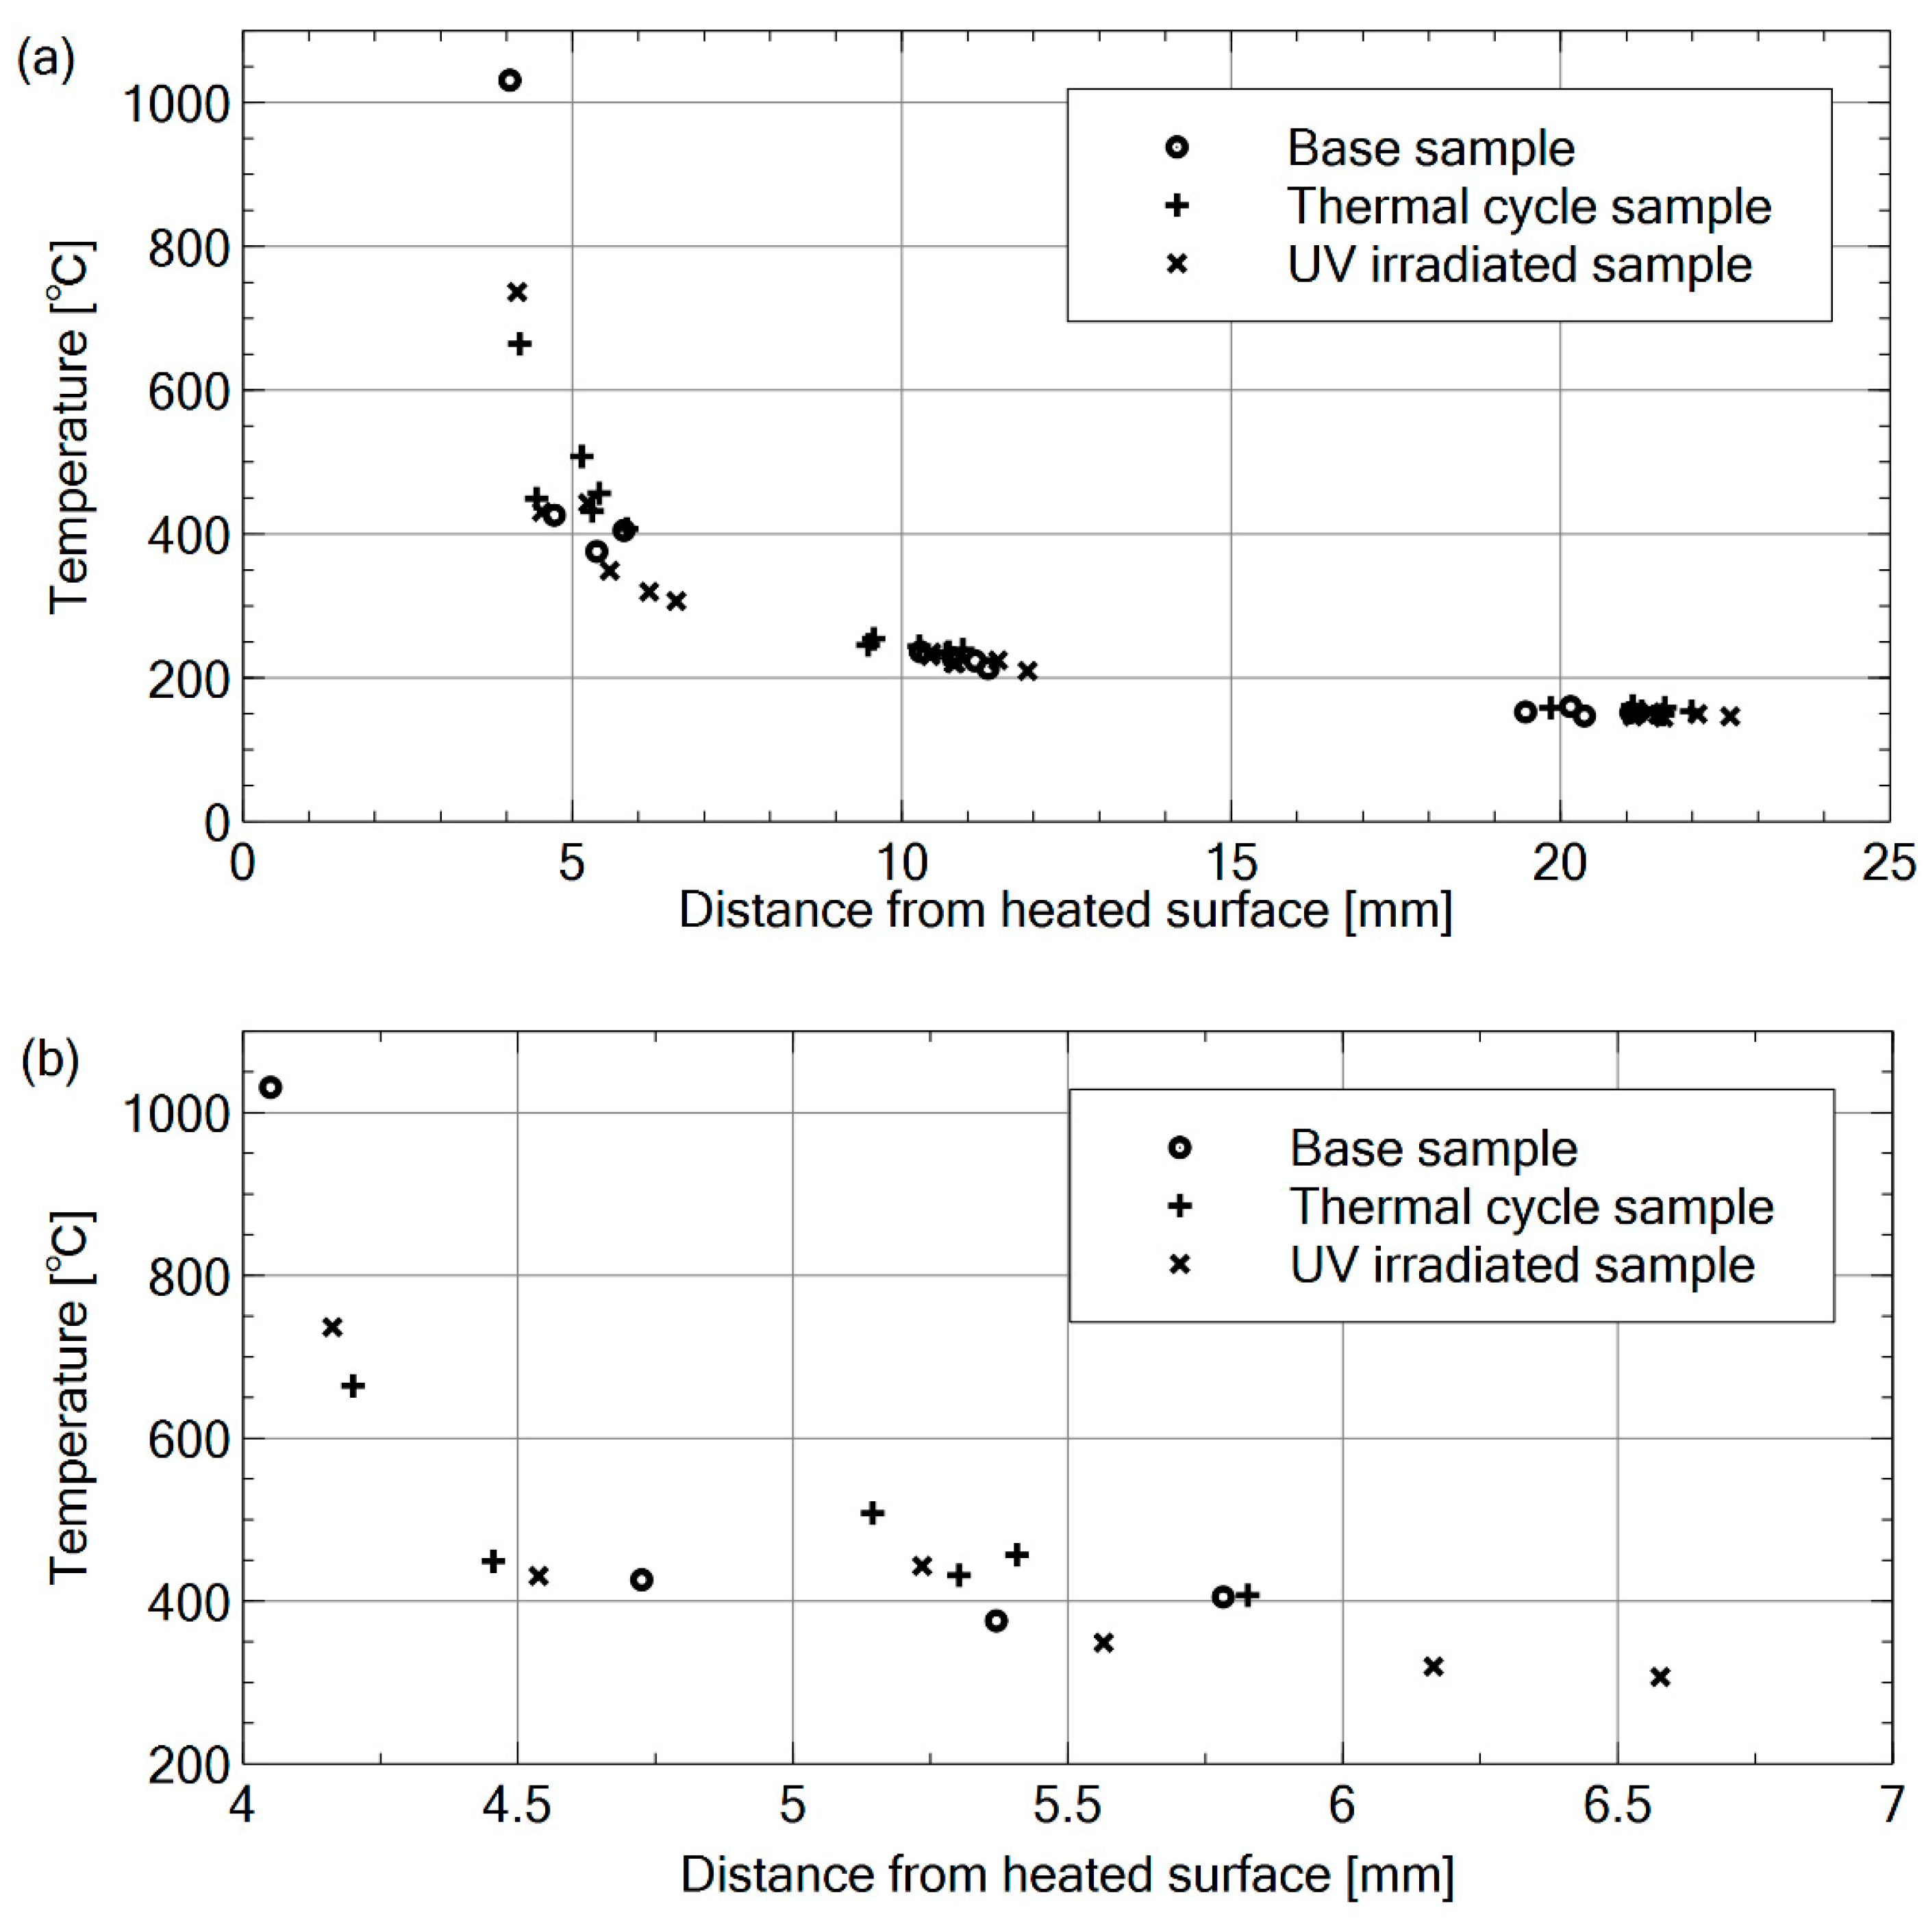
Figure 17.
Comparison of the maximum temperature at different depths for all types of 3D CF/PEEK samples: (a) overall internal maximum temperature; and (b) detailed internal maximum temperature near 5-mm reference point.
Figure 17.
Comparison of the maximum temperature at different depths for all types of 3D CF/PEEK samples: (a) overall internal maximum temperature; and (b) detailed internal maximum temperature near 5-mm reference point.
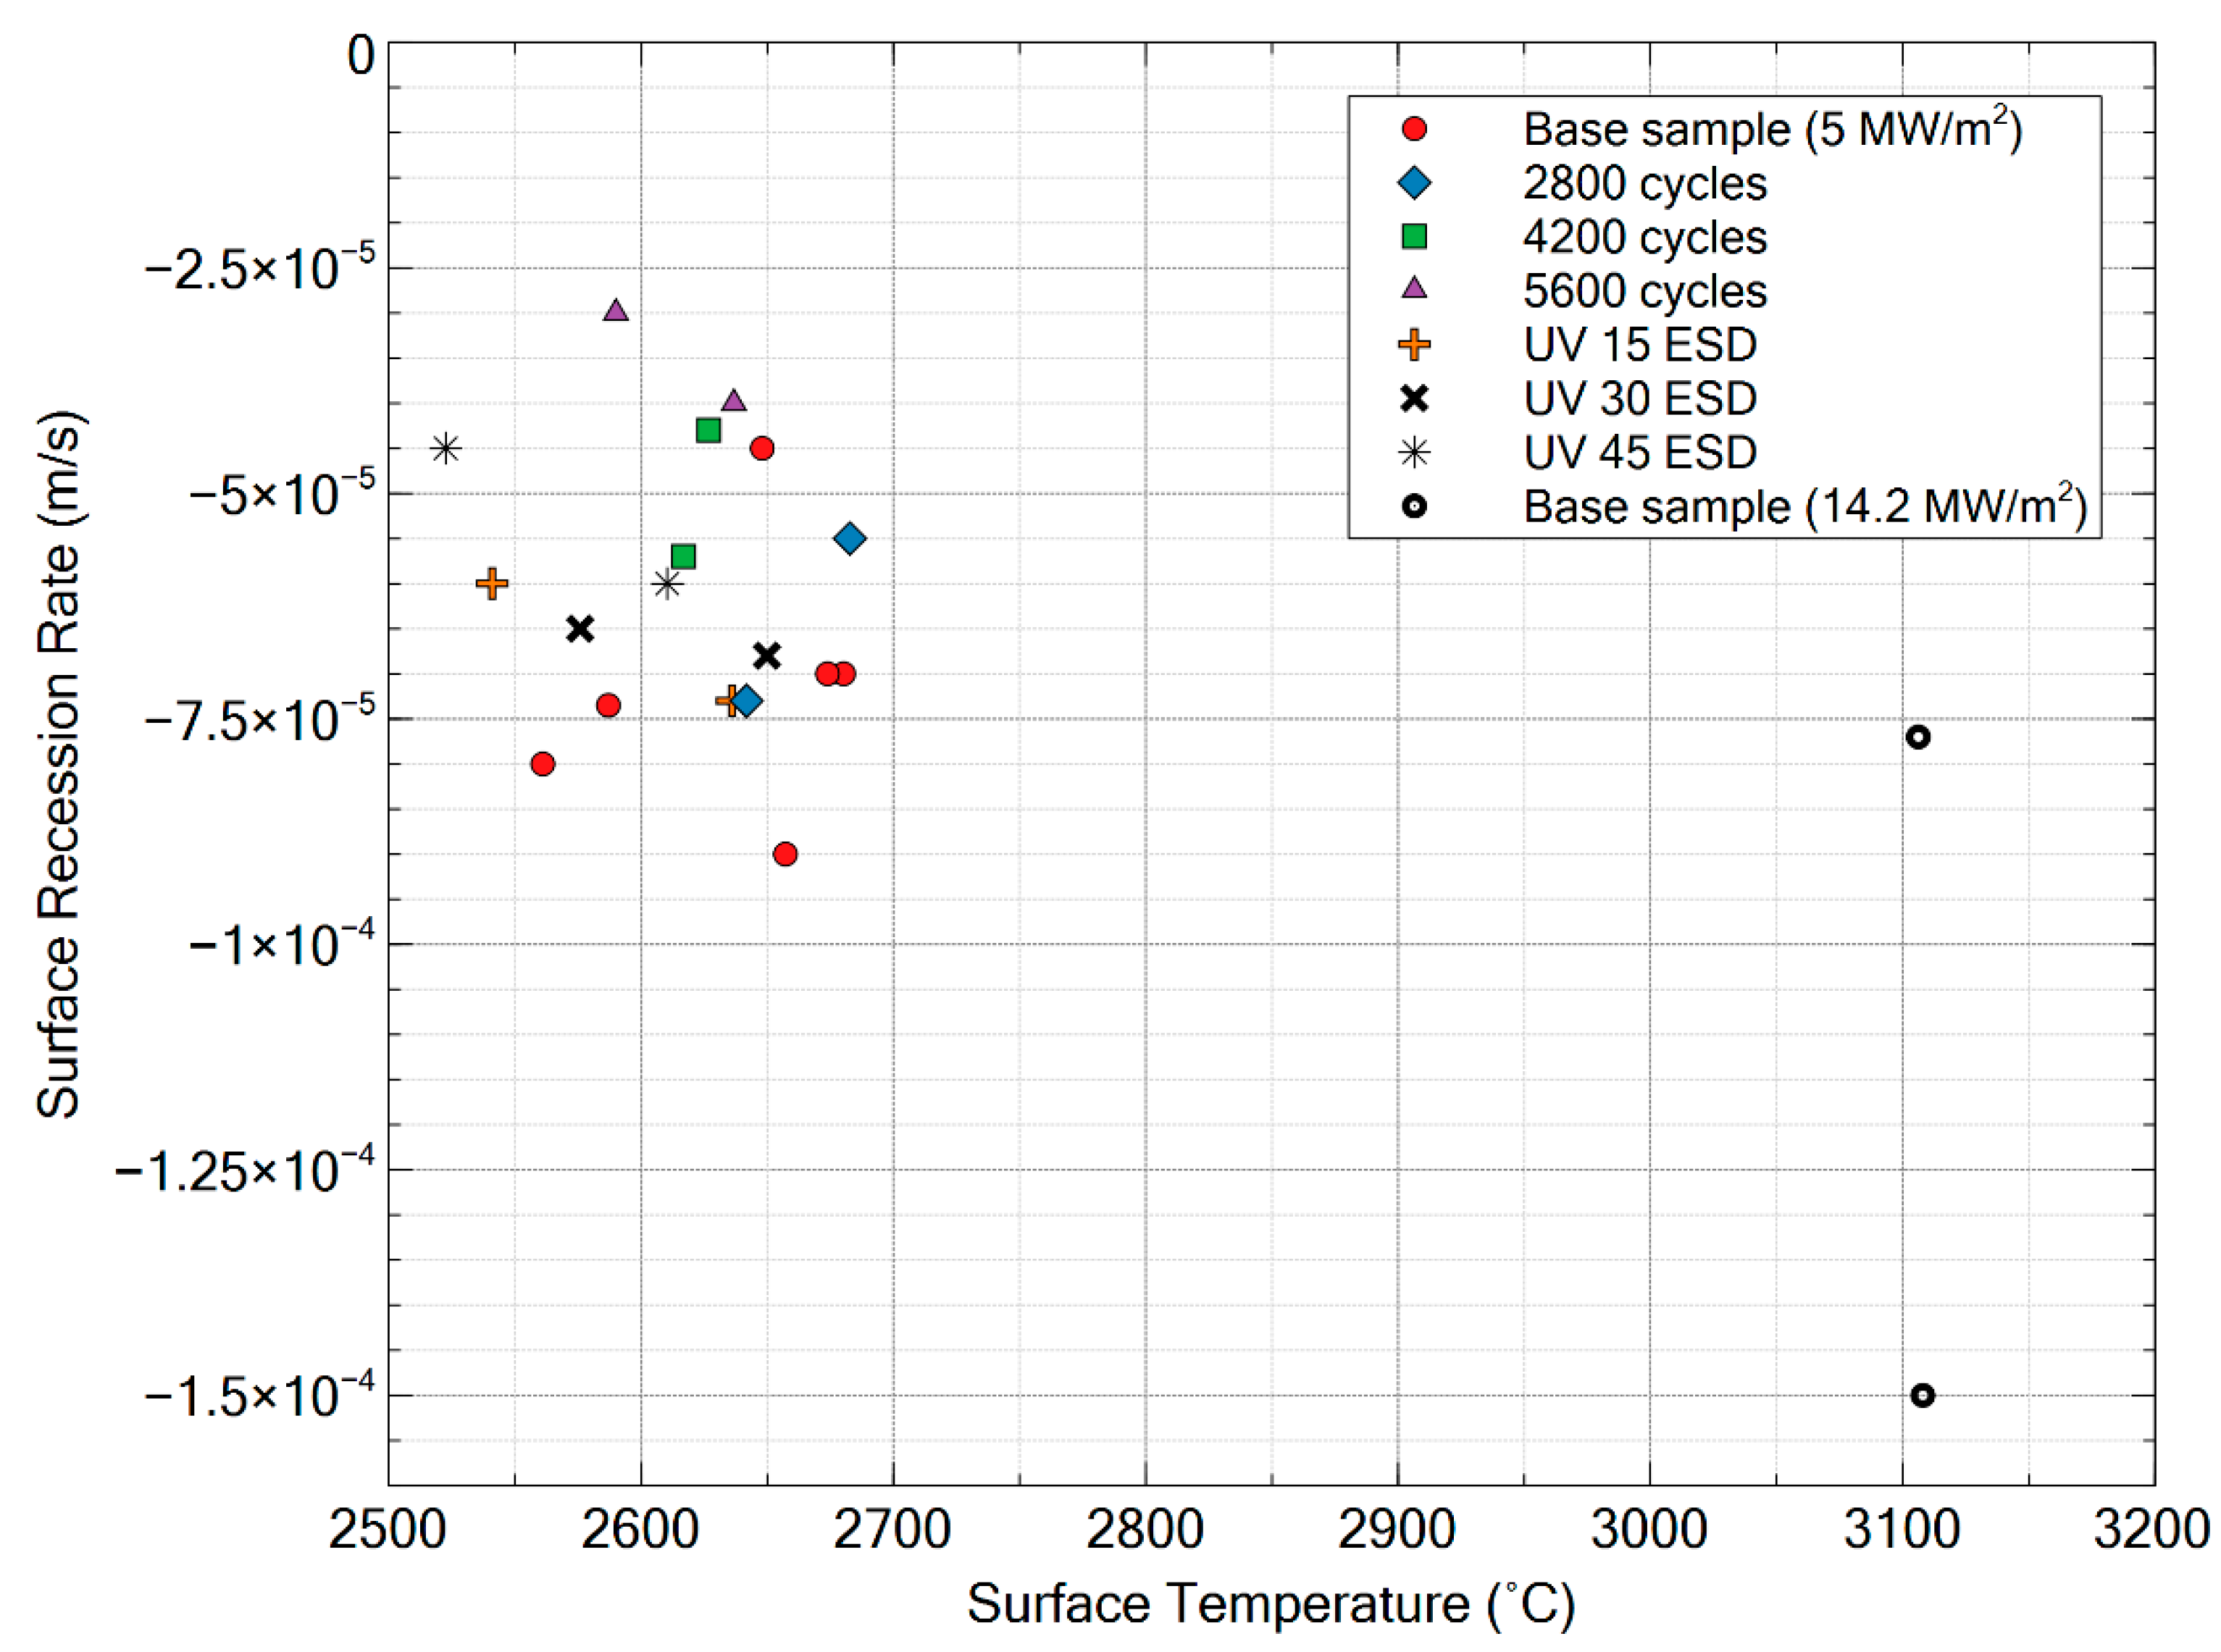
Figure 18.
The relationship between maximum surface temperature and surface recession rate of 3D CF/PEEK.
Figure 18.
The relationship between maximum surface temperature and surface recession rate of 3D CF/PEEK.
Figure 19.
The relationship between mass-loss rate and maximum surface temperature of 3D CF/PEEK.
Figure 19.
The relationship between mass-loss rate and maximum surface temperature of 3D CF/PEEK.
Figure 20.
Comparison of surface recession between 3D CF/PEEK, CF/PEEK and LATS. The negative surface recession denotes a surface expansion.
Figure 20.
Comparison of surface recession between 3D CF/PEEK, CF/PEEK and LATS. The negative surface recession denotes a surface expansion.
Figure 21.
Comparison of surface recession rate between 3D CF/PEEK, CF/PEEK and LATS. The negative surface recession rate denotes a surface expansion rate.
Figure 21.
Comparison of surface recession rate between 3D CF/PEEK, CF/PEEK and LATS. The negative surface recession rate denotes a surface expansion rate.
Figure 22.
Side view of ablator sample used in arc heating test: (a) base sample before the test; (b) base sample after test; (c) thermally cycled sample; and (d) UV irradiated sample.
Figure 22.
Side view of ablator sample used in arc heating test: (a) base sample before the test; (b) base sample after test; (c) thermally cycled sample; and (d) UV irradiated sample.
Figure 23.
The relationship between reciprocal of surface temperature and the logarithm of mass loss rate of 3D CF/PEEK and CF/PEEK.
Figure 23.
The relationship between reciprocal of surface temperature and the logarithm of mass loss rate of 3D CF/PEEK and CF/PEEK.
Figure 24.
The relationship between the mass-loss rate and of 3D CF/PEEK and CF/PEEK.
Figure 24.
The relationship between the mass-loss rate and of 3D CF/PEEK and CF/PEEK.
Figure 25.
The relationship between mass-loss rate and mass loss rate of 3D CF/PEEK, CF/PEEK and LATS.
Figure 25.
The relationship between mass-loss rate and mass loss rate of 3D CF/PEEK, CF/PEEK and LATS.
Figure 26.
The relationship between maximum surface temperature and heat flux for different ablator materials.
Figure 26.
The relationship between maximum surface temperature and heat flux for different ablator materials.
Figure 27.
Comparison of maximum surface and in-depth temperature between 3D CF/PEEK, LATS and CF/PEEK ablator samples: (a) maximum surface temperature; and (b) maximum in-depth temperature for 20 mm from surface.
Figure 27.
Comparison of maximum surface and in-depth temperature between 3D CF/PEEK, LATS and CF/PEEK ablator samples: (a) maximum surface temperature; and (b) maximum in-depth temperature for 20 mm from surface.
Table 1.
Sample types and dimensions for tensile and arc heating test.
Table 1.
Sample types and dimensions for tensile and arc heating test.
| Type of Test | Length (mm) | Width/Diameter (mm) | Thickness (mm) | Fiber Lay-up |
|---|
| Tensile test | 150 | 20 | 2 | (0/90/0) |
| Arc heating test | - | 20 | 30 | (0/90)S |
Table 2.
Main specification of the thermal cycle chamber.
Table 2.
Main specification of the thermal cycle chamber.
| Specification | Description |
|---|
| Size (mm) | 440 width × 480 depth × 500 height |
| Ultimate Vacuum (Pa) | Room pressure |
| Shroud temperature (°C) | −190 to 200 °C |
| Maximum test sample size (mm) | 350 width × 250 depth × 200 height |
| Heating rate | 40−100 :, 40−200:
40−260: |
Table 3.
The number of tensile and arc heating test samples exposed to different thermal cycle conditions.
Table 3.
The number of tensile and arc heating test samples exposed to different thermal cycle conditions.
| Mission Life (months) | Number of Thermal Cycles in Ground Test | Equivalent Number of Thermal Cycles in Orbit | Number of Samples Per Test Type |
|---|
| Tensile Test | Arc Heating Test |
|---|
| 6 | 17 | 2800 | 2 | 2 |
| 9 | 26 | 4200 | 2 | 2 |
| 12 | 35 | 5600 | 2 | 2 |
Table 4.
UV irradiation conditions.
Table 4.
UV irradiation conditions.
| Type of Test | UV Fluence (ESD) |
|---|
| Wavelength (nm) | 253.7 |
| UV fluence (ESD) | 15, 30, 45 |
| UV intensity (W/m2) | 20.5 |
| Pressure in UV chamber (Pa) | |
| Sample temperature (°C) | 50.0 |
Table 5.
List of samples exposed to thermal cycle.
Table 5.
List of samples exposed to thermal cycle.
| UV Fluence (ESD 1) | Number of Samples Per Test Type |
|---|
| Tensile Test | Arc Heating Test |
|---|
| 15 | 2 | 2 |
| 30 | 2 | 2 |
| 45 | 2 | 2 |
Table 6.
List of sample types for tensile tests.
Table 6.
List of sample types for tensile tests.
| Environment | Number of Test Samples |
|---|
| Base sample | 2 |
| 2800 thermal cycles | 2 |
| 4200 thermal cycles | 2 |
| 5600 thermal cycles | 2 |
| 15 ESD UV fluence | 2 |
| 30 ESD UV fluence | 2 |
| 45 ESD UV fluence | 2 |
Table 7.
Test conditions for arc heating test.
Table 7.
Test conditions for arc heating test.
| Group | Model | Environment | Density (kg/m3) 1 | Heat Flux (MW/m2) | Heating Duration (s) | Stagnation Pressure (kPa) |
|---|
| A | G1 | Base sample | 1395.3 | 5.0 | 20 | 12.46 |
| G2 | 1411.2 | 14.2 | 10 | 60.76 |
| H1 | 1359.2 | 5.0 | 20 | 12.46 |
| H2 | 1405.9 | 14.2 | 10 | 60.76 |
| B | A1 | 1412.2 | 5.0 | 20 | 12.46 |
| A2 | 1413.3 | 5.0 | 20 | 12.46 |
| A3 | 1415.4 | 5.0 | 20 | 12.46 |
| A4 | 1419.7 | 5.0 | 20 | 12.46 |
| B1 | 2800 thermal cycles | 1405.9 | 5.0 | 20 | 12.46 |
| B2 | 2800 thermal cycles | 1414.4 | 5.0 | 20 | 12.46 |
| C1 | 4200 thermal cycles | 1412.2 | 5.0 | 20 | 12.46 |
| C2 | 4200 thermal cycles | 1411.7 | 5.0 | 20 | 12.46 |
| D1 | 5600 thermal cycles | 1409.1 | 5.0 | 20 | 12.46 |
| D2 | 5600 thermal cycles | 1412.2 | 5.0 | 20 | 12.46 |
| E1 | 15 ESD UV fluence | 1409.1 | 5.0 | 20 | 12.46 |
| E2 | 15 ESD UV fluence | 1413.3 | 5.0 | 20 | 12.46 |
| F1 | 30 ESD UV fluence | 1410.6 | 5.0 | 20 | 12.46 |
| F2 | 30 ESD UV fluence | 1410.6 | 5.0 | 20 | 12.46 |
| G1 | 45 ESD UV fluence | 1411.2 | 5.0 | 20 | 12.46 |
| G2 | 45 ESD UV fluence | 1419.7 | 5.0 | 20 | 12.46 |
Table 8.
The average maximum surface temperature for difference ablator samples during arc heating test.
Table 8.
The average maximum surface temperature for difference ablator samples during arc heating test.
| Sample Type | Average Maximum Surface T (°C) |
|---|
| A (Base sample) | 2640.78 |
| B (2800 thermal cycles) | 2662.25 |
| C (4200 thermal cycles) | 2621.75 |
| D (5600 thermal cycles) | 2613.38 |
| E (15 ESD) | 2588.48 |
| F (30 ESD) | 2612.83 |
| G (45 ESD) | 2566.44 |
Table 9.
The average surface recession for difference ablator samples after arc heating test.
Table 9.
The average surface recession for difference ablator samples after arc heating test.
| Sample Type | Average Surface Recession Rate (m/s) |
|---|
| A (Base sample) | −0.000071 |
| B (2800 thermal cycles) | −0.000064 |
| C (4200 thermal cycles) | −0.000050 |
| D (5600 thermal cycles) | −0.000035 |
| E (15 ESD) | −0.000066 |
| F (30 ESD) | −0.000066 |
| G (45 ESD) | −0.000052 |


