1. Introduction
In recent years, the increased availability of data and improvements in computing power have paved the way for applications of Machine Learning (ML) techniques to various aviation safety problems.The applications of ML involve the identification, isolation, and amelioration of factors posing potential flight risks. The rise in commercial viability of air travel is estimated to manifest itself as a rapid growth in annual global air traffic according to projections by the International Civil Aviation Organization (ICAO) [
1]. This ultimately paves the way for over a two-fold forecast increase in both the number of departures and the number of passengers (from 37.8 million and 4.3 billion respectively in 2018 to 90 million and 10 billion by 2040 [
1]). This surge in global air mobility is accompanied by a corresponding growth in available flight data spanning both the public and private sectors [
2]. Sizable portions of this aggregated information are dedicated to the sustained operations of its owners, either from an operational and maintenance standpoint or from a safety and incident investigation perspective. This is evidenced by the multiple safety programs endorsed by modern commercial airlines, some of which gather terabytes of instantaneously transmitted data from over a million routine flights annually. Such safety protocols are instated in order to continuously improve the overall safety of the industry through the analysis of routine flight data, despite a proportionate decrease in the number of accidents and events in commercial aviation worldwide.
Advancements in the use of data collected have nevertheless remained subject to preexisting modes of safety investigation, contingent upon a post hoc investigation of events. This results in limited use of the rich set of data available and increasingly strains the application of existing conventions to a novel and large set of data. New methodologies for the incorporation of emerging safety data within established safety principles are essential to get insightful feedback and draw meaningful conclusions from the heterogeneous and voluminous data available for analysis. However, means of isolating accident and incident precursors are rapidly expanding beyond the reach of traditional methods employed by Subject-Matter Experts (SME) as a consequence of the heterogeneous and often interconnected nature of safety data collected. Risk implications drawn from such data sets require the recognition of statistically significant factors operating in a dynamic and parametric domain rather than a pre-defined or point-based one. There is a need to transform this newfound data into an interpretable and traceable decision-making process, a goal rendered feasible through the application of data science techniques. Chief among these new avenues of analysis is Machine Learning, described by Lantz as “a field of study interested in the development of computer algorithms to transform data into intelligent actions” [
3].
In the present work, the predictive capability of machine learning is applied towards the isolation of critical parameters (and potential causal factors) driving safety-related events from within layers of insignificant, uncorrelated, or tangentially coupled ones. This process aims at reliably deriving statistical and quantitative insights into the significance and frequency of various factors in the occurrence of safety events, and thus, of potential incidents and accidents. Based on the preceding observations, the overall research objective of this work is defined as follows:
Research Objective: Establish a data-driven, efficient, and robust framework to determine critical parameters and precursors to safety-related events for commercial aviation operations.
The paper is organized as follows. In
Section 2, the relevant background on existing work is introduced alongside some important definitions. The methodology developed and used in this study is described
Section 3.
Section 4 presents and discusses the results obtained from the application of the proposed methodology on a real-world data set. Finally,
Section 5 summarizes some concluding remarks and proposes avenues for future work.
2. Background
Existing safety conventions are characterized by the synthesis of accident
pathogenesis and
etiology [
4].
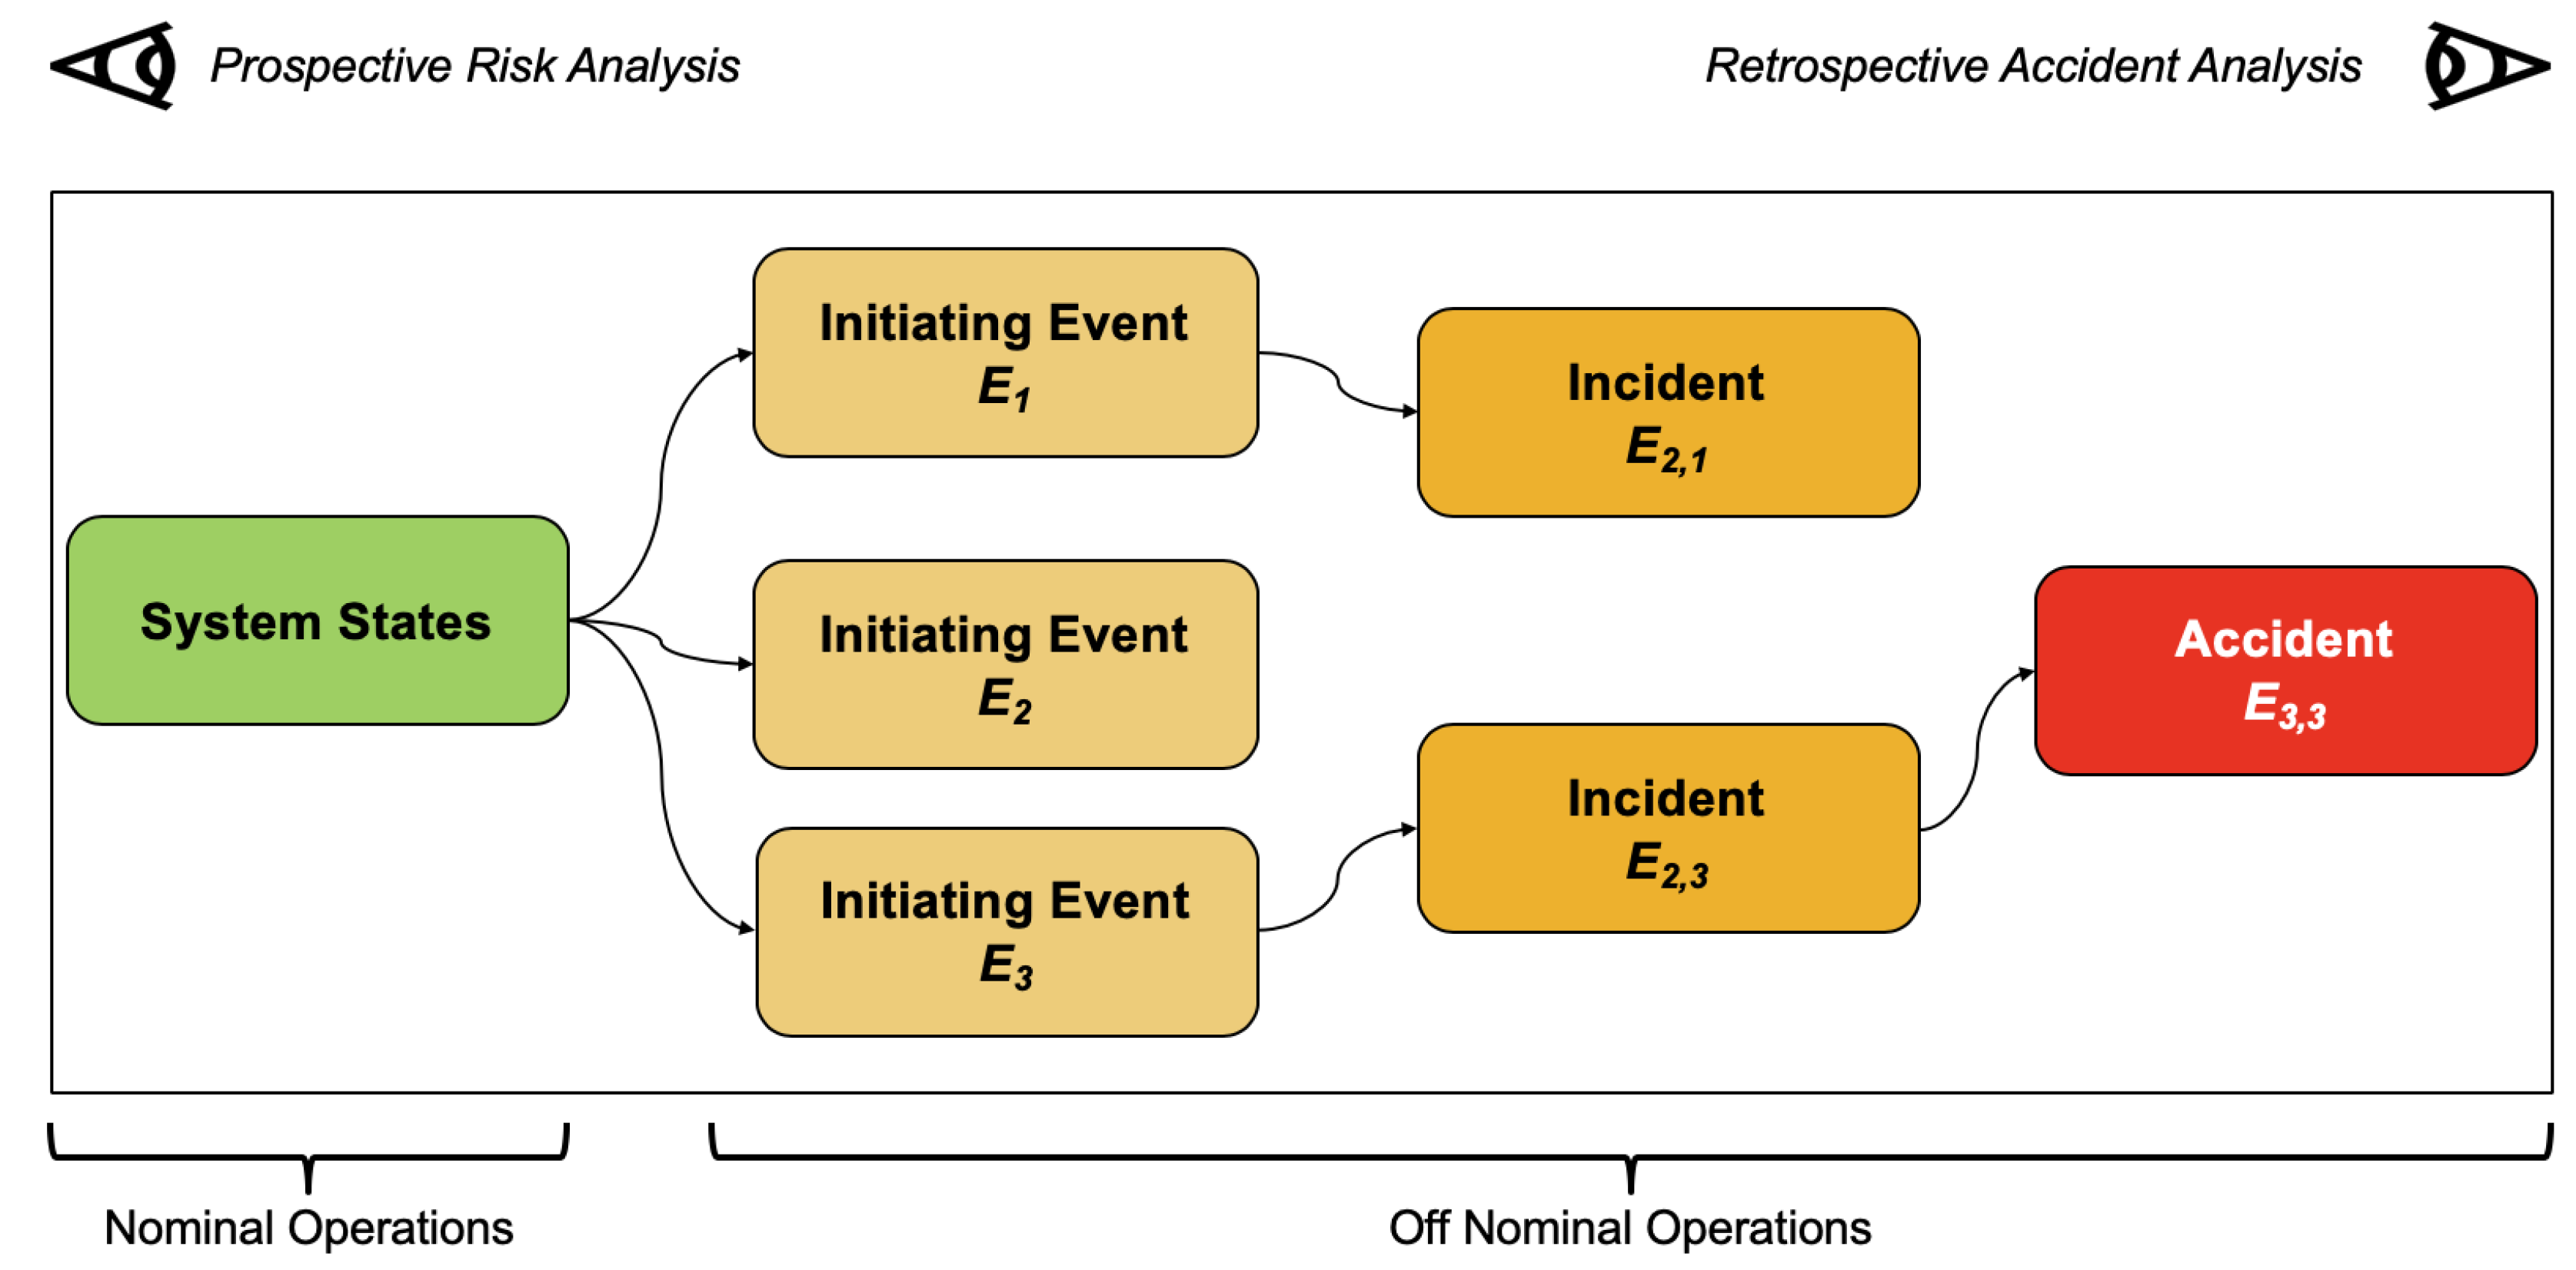
Pathogenesis refers to the causal chain of accidents, whereby a flight shifts from a nominal state to an accident (see
Figure 1). The timeline of causality contains several stages, transitioning from precursors to initiating events, and culminating in incidents and accidents. Accident
etiology refers to the causal factors governing the accident or incident and encapsulates organizational, human, technical, and operational factors. Both pathogenesis and etiology can be investigated either in a retrospective or in a prospective manner. A retrospective analysis is backward-looking and focuses on the identification of causal bases to an accident and its generative mechanisms. A prospective analysis is forward-looking and is oriented towards the analysis of risk through extrapolation of precursors into potential failures.
Figure 1 shows a notional representation of these two approaches. The recent abundance of safety-related data from routine flight operations bridges the gap between a former reliance on retrospective methods and the emergence of a prospective ethos of analysis through the application of
observability-in-depth, which leverages precursor information to assess risk implications [
5].
The aforementioned transition from precursors to incidents and accidents can be formally understood through the definition of incidents which is “an occurrence other than an accident which affects or could affect the safety of operations”. Accidents on the other hand, are “occurrences associated with the operation of an aircraft in which any person suffers death or serious injury, or in which the aircraft receives substantial damage” [
6]. These legal conceptions of safety-related phenomena can be framed through their reformulation as one or more parameter exceedances typically defined by subject-matter experts via parameter threshold values. Safety events are defined as one or more parameter exceedances that take place concurrently over a specified period of time and have the potential to adversely affect operational safety. However, defining events in this manner casts them in a binary light and renders their occurrence and severity contingent upon the exceedance of pre-defined thresholds established by SMEs.
The information regarding parameter behavior and potential exceedances are interspersed throughout the flight envelope and encompass the breadth of standard operating procedures, regulations, and previous experience from accident investigations. These indicators and the parameters therein are encapsulated within data sets typically collected under a program known as Flight Operational Quality Assurance (FOQA) or Flight Data Monitoring (FDM). FOQA or FDM is defined as “a voluntary safety program designed to make commercial aviation safer by allowing commercial airlines and pilots to share de-identified aggregate information with the (Federal Aviation Administration) FAA to identify and reduce or eliminate safety risks, as well as minimize deviations from the regulations” [
7].
FOQA data is obtained from various flight data recorders which consists of regularly recorded aircraft sensor measurements and switch settings. It is a set of multivariate time series throughout the duration of the flight during which the data is being recorded. The data collected consists of thousands of parameters (numerical, discrete, categorical, text, etc.) recorded at a frequency of up to 16 Hz. The flight data parameters can be divided into different categories and levels based on their source system or sub-system in the aircraft. For example, atmospheric data refers to data gathered from pitot tubes, barometers, and thermometers. It includes parameters like airspeed, wind speeds, pressure altitude, and atmospheric temperature. Attitude data refers to roll, pitch, yaw angles and their corresponding rates and accelerations. Global Positioning System (GPS) data contains the latitude, longitude, altitude of the aircraft, and their related rates of variation. Engine data contains information about Rotations Per Minute (RPM), Exhaust Gas Temperatures (EGT), Cylinder Head Temperatures (CHT), oil temperature and pressure, fuel flow rates, and fuel quantities. Control data contains the deflection of control surfaces including flaps, elevator, aileron, and rudder. Communications data includes details about the communication status of the vehicle, such as the radio frequency. Navigation data includes information on any way-point guidance or autopilot features. The aforementioned examples are among the numerous categories of parameters typically present in-flight data recorded on-board commercial airliners. Typical FOQA or FDM programs involve a continuous cycle of data collection from on-board recorders, data transmission to a ground station, retrospective analysis of flight data records, identification of potential operational safety exceedances, design and implementation of corrective measures, and monitoring to assess their effectiveness [
7,
8].
Data science techniques provide accurate and efficient ways of analyzing large, heterogeneous data sets like FOQA. If data science techniques are to be used in development of new safety protocols, the class of machine learning algorithms employed in the process needs to be formalized. Supervised learning techniques provide an opportunity to recognize existing structures and patterns within a given data set using labeled data. On the other hand, unsupervised learning techniques enable an unrestricted recognition of patterns from within available data without the imposition of human constraints. In this paper, we will use supervised learning techniques to fuse ML algorithms with conventional SME definitions of safety events from routine commercial airline operations. The wide array of techniques within supervised learning is further narrowed down to classification algorithms, which are more conducive to the way in which safety events are typically defined (a value of 1 means a safety event occurred, while a value of 0 means that is did not occur in a particular flight).
In recent years, the use of machine learning techniques for solving complex problems in the transportation domain has gained popularity. For example, Hegde and Rokseth [
9] have conducted a survey of ML applications to engineering risk assessment. However, prior studies have mostly used machine learning techniques to perform retrospective analyses of flight data records to detect anomalies during routine operations [
10,
11,
12,
13,
14,
15,
16,
17]. In all these anomaly detection approaches, identification of precursors or causal factors is conducted
a-posteriori by SME analysis. While identifying anomalies is important, it is also critical to investigate the causal factors or precursors to these anomalies to prevent them in the future. However, among the data collected, not all parameters are equally important from a safety and risk perspective. Therefore, there is a need to identify the most influential parameters from among the thousands available to build better risk prediction models. As the size of the data set begins to grow to millions of flights, it becomes more valuable to be able to automatically identify important parameters for safety purposes.
In the domain of precursor identification from flight data, several recent works are of interest. Melynk et al. [
18] have proposed a framework for detecting precursors to aviation safety incidents due to human factors based on Hidden Semi-Markov Models. They performed an empirical evaluation of their models against traditional anomaly detection algorithms and demonstrated better performance on synthetic and flight simulator data. Janakiraman et al. [
19,
20] have developed an algorithm for automatic discovery of precursors in time series data using reinforcement learning and have demonstrated their method on go-around and anomalous drop in airspeed events for commercial aviation. The validation of precursors identified in these studies is not addressed due to the lack of SME-defined labels for the events. Finally, Mangortey et al. [
21] used a variety of clustering techniques to identify clusters of nominal operations and subsequently determine important parameters that differentiate outliers from those nominal clusters. Despite the interesting insights presented, their method is still unsupervised and lacks validation. A generic methodology using supervised learning on flight data for identifying precursors to multiple event types is currently lacking in the literature.
3. Methodology
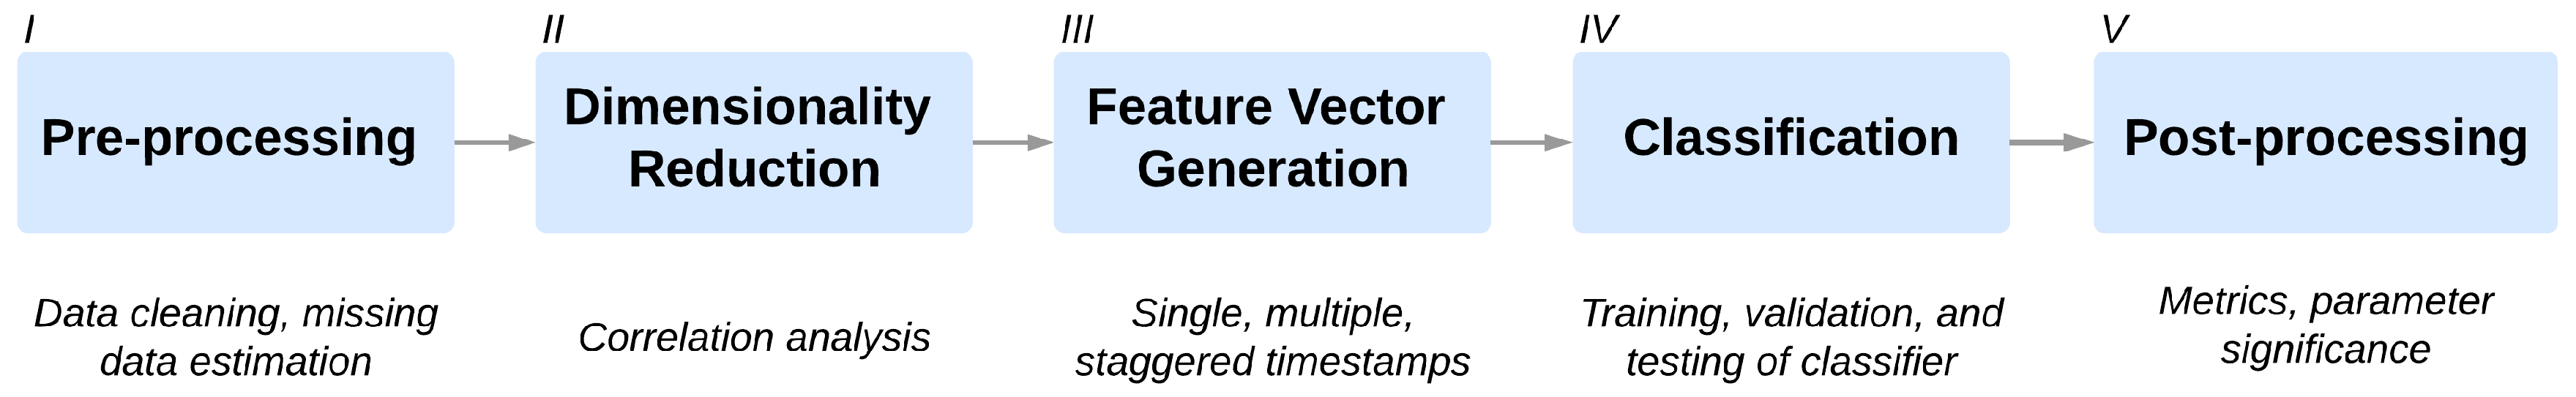
To fill the gaps observed in the prior sections, a framework called SAFE is developed in this work. The SAFE framework, (shown in
Figure 2), is used to determine the FOQA parameters governing event occurrences via the application of machine learning algorithm. The availability of standardized FOQA data and the existence of pre-defined labels for safety events aid in the generation of this repeatable analytical pipeline.
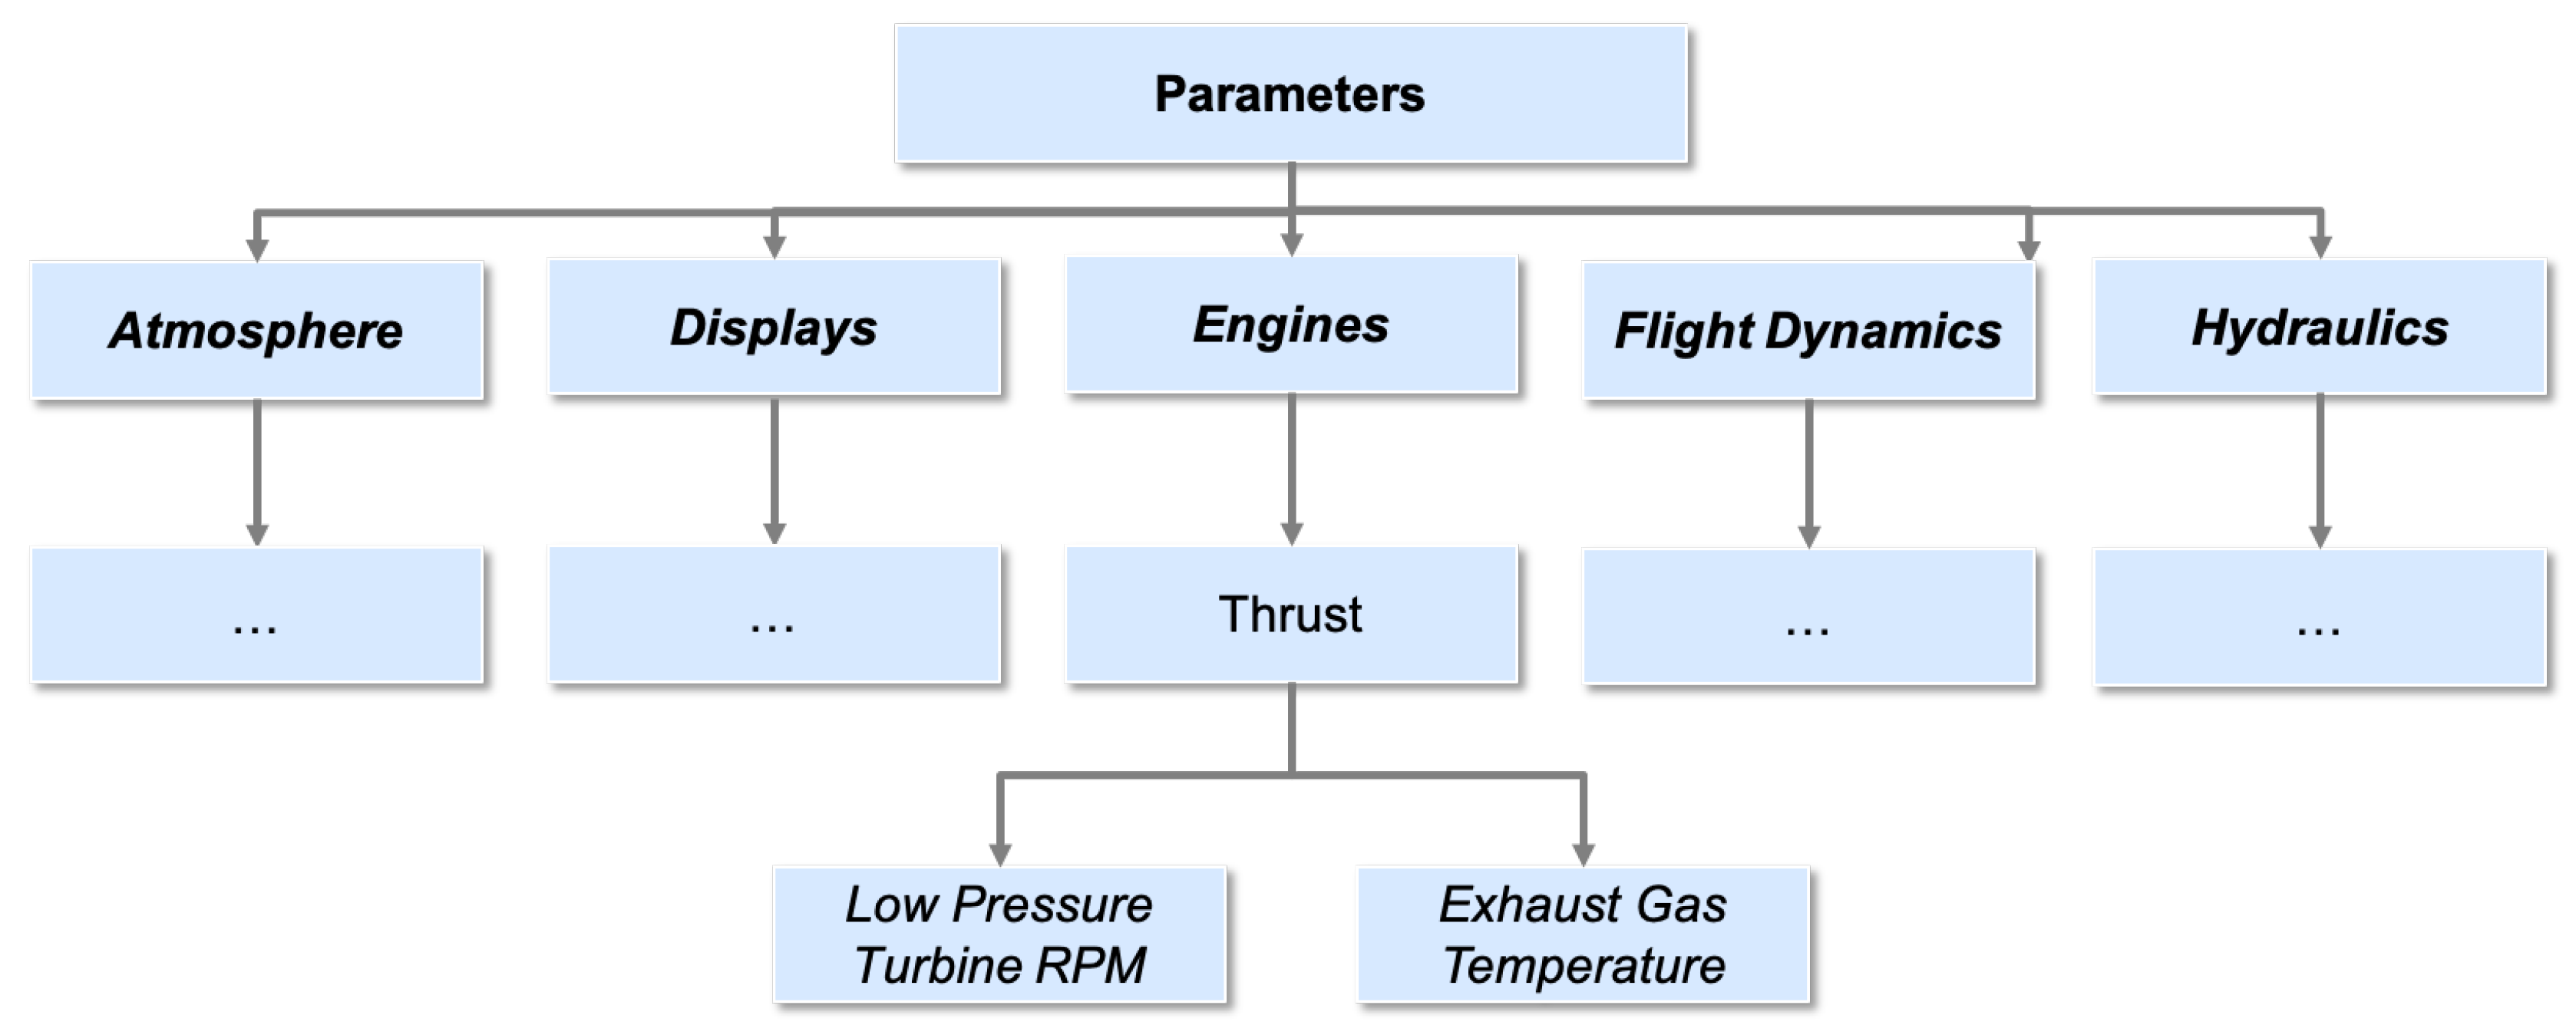
The development of a methodology for the parametric decomposition of safety events is contingent on the attributes of the data used during this process. The SAFE framework leverages commercial airline FOQA data as the standardized basis for analysis. This data is used in tabular form with each column corresponding to one of the 623 parameters considered in this work and each row describing the temporal variation of these parameters throughout the course of a full flight at a 1 Hz frequency. Each FOQA file encapsulates the properties of a single flight and operates under a consistent parametric hierarchy across all its samples. Variables within FOQA files are organized in a consistent table format and are placed at the base of this multi-level hierarchy as shown in
Figure 3. For example, the base level might contain “Low-Pressure Turbine RPM” and “Exhaust Gas Temperature” as variables, which fall under the “Thrust” cluster, and which in turn operates alongside other similar entities to form the "Engines" group. The SAFE framework applied to the FOQA data described previously is composed of five main steps detailed in the subsequent sections.
3.1. Pre-Processing
The first step of the SAFE methodology consists of pre-processing the information-dense FOQA data. The FOQA data offers a detailed and dynamic summary of flight characteristics but contains data heterogeneity, potentially restricting ease of analysis. The data within FOQA files is cleaned and compiled into usable formats consisting of binary, Boolean, numerical, and discrete data types. Two different processed are used to pre-process the data—deletion and replacement.
Deletion is an evaluative process whereby each column within a FOQA file is individually examined for the presence of the aforementioned usable data types. Those columns lacking a sufficient proportion of these data types are removed entirely due to a lack of interpretability stemming from the presence of corrupt information such as
DNE (Does Not Exist) or empty data formats. Deletion ensures the retention of data that is relevant to the flight phases and/or airframes under consideration. An example of the deletion process is shown in
Table 1.
The replacement process acts on the remaining columns through the application of either statistical averaging (mean, median or mode), interpolation (linear or k-nearest neighbor), or numerical replacement with a specific value. The first and third classes of techniques operate on an intra-column scheme and replace corrupt values with a statistically averaged quantity obtained from the entire column or a zero. The interpolative class of techniques operates on the same intra-column scheme as for linear techniques but also at an inter-column scheme through the application of the k-nearest neighbor technique [
22]. Linear interpolation uses averaging to identify numerical candidates for corrupt data nestled between usable values, whereas k-nearest neighbor examines trends in columns similar to the entity in consideration. Similar columns are determined through the correlation process outlined in subsequent sections that replaces missing values via observed inter-column variations. An example of the replacement process is shown in
Table 2 where the empty values are replaced by zeros due to the nature of the parameter under consideration.
Additional consideration is given to the exact replacement method chosen based on the placement of corrupt data within the columns under consideration. Null replacement is employed at column extremities where several binary and switch parameters are likely to adopt an inactive configuration. The arithmetic mean and k-nearest neighbor techniques are used to rectify a few corrupt values in otherwise near-perfect numerically populous columns. Similar cases with discrete columns are addressed through the use of the median or mode averaging technique. In this manner, a unique data cleaning exercise is conducted on each column of the FOQA data and the same consistent schema is applied across all flights of the data set.
3.2. Data Dimensionality Reduction
The size and heterogeneity of the FOQA data which, by nature, synthesizes gigabytes of numerically diverse parameters, add several layers of complexity to the analysis. The dimensionality and heterogeneity challenges may be mitigated through the use of correlation analysis. The goal of the correlation analysis is to identify parameter groups exhibiting three types of similarities observed as part of the FOQA data taxonomy: sensor-based, physics-based, and unit-based. Appropriate representative parameters from each cluster are then retained to maintain highest order of flight system dimension represented by the data. Sensor-based correlations stem from the fact that a single parameter is often recorded from multiple sensors due to the intentional redundancies inherent to FOQA programs. Physics-based correlations emerge because of various equations or physical laws governing flight and involving multiple parameters. Unit-based correlations are linked to the use of multiple metric systems (i.e., English versus International System of Units) when recording parameters. While the theoretical basis of identifying these correlations is distinct from the definitions underlying these similarities, they nevertheless spot the trends produced therein.
Parameters from the processed FOQA files are split into numerical and discrete subsets. The former subset leverages Pearson coefficients [
23] while the latter leverages Kramer’s V method [
24] to determine the extent of the aforementioned three forms of correlations between parameter pairs. The intensity of these correlations is represented numerically within the interval [0, 1], with higher numbers indicating stronger correlations.
Table 3 shows a notional correlation matrix (rendered in an upper triangular fashion owing to its symmetry) indicating the relationship between parameter pairs using the three similarity groups presented above for a notional safety event.
The values in the correlation matrix are used to address the challenges related to the high dimensionality and correlated behavior of the original FOQA data set by eliminating highly correlated parameters which exceed an SME-defined correlation threshold. The process of elimination is conducted as follows:
In each row, identify and group correlated parameters that exceed an SME-defined correlation threshold, for example 0.99. Parameters satisfying this condition are highlighted in yellow in
Table 3. The results from this step are presented in
Table 4.
Combine all the highly correlated parameters, under the correlated parameters column in
Table 4, without repeats, to form a flattened list. Reorder the flattened list according to the SME-determined significance for the parameters with respect to the event under consideration. For example, Parameters B, C, D, and E are highly correlated with Parameters A, B, and D as shown in
Table 3. Therefore, these parameters are condensed into a single vector of correlated parameters. For instance, according to prior knowledge, historical data, and/or experience, Parameter D has the least significance to the event and is followed by Parameters B, C, and E. The order of these correlated parameters is rearranged from B, C, D, and E to D, B, C, and E to form a flattened sorted list.
Delete parameters in the flattened sorted list, in their respective order, unless their removal results in an empty “correlated parameter” list, as shown in
Table 5. For example, Parameters D and B are removed in
step a because removing these parameters do not create an empty correlated parameter list due to the presence of Parameter C. Parameters C and E are retained to prevent from generating empty correlated parameter lists.
Based on the algorithm, parameters are retained for three reasons. First, in the case of Parameters C and E, there needs to be at least one correlated parameter defining each system dimension represented by the original data. Second, in the case of Parameter F, each of these parameters uniquely define a system dimension represented by the original data. Third, in the case of Parameter A, by design, the algorithm does not consider the first parameter when generating the flattened list. This issue can be removed by always including the first parameter in the flattened list if the first parameter is correlated with another parameter.
Automated and repeatable correlative elimination mitigates the complexity stemming from data size and correlations by generating reduced parameter lists. However, the desire to ease computational burden needs to be balanced with the competing motive of retaining potential causal factors to safety hazards. For example, Parameters B and D in
Table 5 may be removed but Parameters C, E and F need to be retained to preserve the physical basis of the notional event under consideration.
3.3. Feature Vector Generation
The reduced parameter list obtained from the previous correlative elimination step of the SAFE methodology, is selectively compiled into feature vector matrices. The matrices summarize the characteristics of all flights within the temporal vicinity of safety hazards as determined by SMEs. Therefore, a feature vector matrix consists of the data vectors of the reduced parameter list from each flight that are associated with a timestamp located within the time period of the safety event under consideration. The flights of interest are appended as unique rows in the feature vector matrix. As shown in
Table 6 and
Table 7, the columns of the feature vector matrix are described by the reduced parameters extended horizontally with their corresponding time stamps.
One of the three following selection methods are used to select time intervals incorporated in feature vectors. The single timestamp technique identifies a single time stamp from each processed FOQA file that is most likely to be related to a flight event or collected from a common point across the different files. The single timestamp method is employed in the absence of concrete knowledge of event pathology with the intent to analyze a shared temporal location for the sake of drawing etiological assessments. The consecutive timestamp method draws from multiple subsequent time increments to generate feature vectors from FOQA files. The length and starting point of these vectors are tailored to reflect the event characteristics and rely on a baseline level of understanding of the event prior to extensive analysis. Temporal multiplicity is leveraged to draw evolutionary conclusions about the genesis of events. The staggered timestamp method also leverages multiple time increments from FOQA files but selects these at discrete and equidistant intervals. Staggered timestamps are employed in the analysis of composite events with unclear precursors, with the aim of analyzing a wide time interval to isolate junctions of escalations in severity. The data collection method is chosen based on the understanding of each event and by the accuracy of the generated classification model.
A complete feature vector matrix indicates the occurrence of events based on SME definitions and detailed variations in retained FOQA parameters across these individual instances. Each row in a feature vector matrix encapsulates a single flight under consideration, whereas columns display values for individual parameters and indicate whether their combinations precipitate into an event. These characterizations of event occurrence and parametric sensitivity are subsequently used for critical parameter isolation using machine learning.
3.4. Classification
The selection of a ML algorithm for the analysis of feature vector matrices is conducted through the concurrent consideration of the following metrics:
Accuracy: The ability of the algorithm to correctly identify instances of safety threats
Collinear Resistance: The ability of the algorithm to operate on highly correlated data sets
Dimensional Capacity: The ability of the algorithm to evaluate high-dimensional, dense data sets
Parametric Robustness: The ability of the algorithm to evaluate distinct, heterogeneous data types
Tuning Simplicity: The ease of selecting appropriate algorithm hyperparameters
Overfitting Resistance: The predictive ability of the algorithm beyond initial training sets
These metrics are used in the evaluation of several candidate classification algorithms, namely Boosting Ensemble [
25], Decision Tree [
26], K-Nearest Neighbor Classification [
27], Naive Bayes, and Random Forest [
28].
Table 8 shows the results of this comparison. Algorithms satisfying the criteria outlined above are denoted with an “X”.
Table 8 indicates a roughly equivalent viability between Boosting Ensemble and Random Forest. However, the latter is chosen for implementation based on its closer adherence to physics-based causal decomposition (outlined in later sections) and overfitting resistance. Although the SAFE framework is developed to be agnostic to any classification algorithm choice, Random Forest is chosen for demonstration purposes.
Random Forest is a meta-estimator which operates via the assembling of several decision trees. It has been applied on a variety of supervised learning tasks, rendering it useful for the classification task during critical parameter identification undertaken in this work. Its functionality is analogous to an expansive tree with several nodes and branches, with a forced schism instituted at each junction with the aim of maximizing subset homogeneity. A populous collection of trees is averaged in the creation of a single predictive schema whose attributes are governed by hyperparameters. The selection of values of these hyperparameter that dictate algorithm behavior is carried out using grid-search and Design of Experiments proposed by Lujan-Moreno et al. [
29] in tandem with bias and error correction using four-fold cross-validation methods [
30].
Additional consideration is given to the process of bias and error reduction through the introduction of resampling techniques, which account for the relative rarity of safety hazards across airline fleets (only about 5–6% of all flights typically have recorded safety events). The skewness of data depicting routine flight operations (towards uneventful journeys) distorts conventional measures of accuracy by placing an unwarranted emphasis on the correct prediction of non-events over events, sometimes referred to as the
class imbalance issue. The class imbalance issue is addressed through the use of two resampling techniques termed
oversampling and
undersampling. The former downscales non-event data to match the number of safety threats recorded, while the latter upscales the number of safety events to match the remainder of the data set. Undersampling is achieved through the use of cluster centroids [
31], random sampling, and Tomek links [
32], whereas oversampling is instituted via Adaptive Synthetic (ADASYN) method [
33], Synthetic Minority Oversampling TEchnique (SMOTE) [
34], and Synthetic Minority Over-sampling Technique for Nominal and Continuous (SMOTE-NC) methods. These methods are all applied on feature vector matrices and the best performers are chosen for further hyperparameter tuning and cross-validation.
3.5. Post-Processing
The results of the algorithmic classification are evaluated through the use of confusion matrices, which draw distinctions between the correct and incorrect identification of events and non-events through the following metrics and arrange them using the format shown in
Table 9.
True Positive (TP): correctly identified events
True Negative (TN): correctly identified non-events
False Positive (FP): incorrectly identified events
False Negative (FN): incorrectly identified non-events
The confusion matrices highlight facets of the algorithm predictive schema most prone to erroneous judgements and facilitates the minimization of false labeling. While the simultaneous mitigation of both false positives and false negatives is desirable, preference is given to the reduction of the former. Indeed, safety conventions are partial towards a conservative approach by overestimation of hazards in comparison to potentially fatal underestimations. Components from confusion matrices are leveraged in the formulation of additional accuracy metrics as follows:
While potentially misleading due to the aforementioned imbalance in data composition, accuracy scores reflect the overall predictive capability of the algorithm. Precision and Recall place an emphasis on the correct identification of safety hazards and lack thereof. Both metrics are leveraged by Balanced Accuracy and F1 Score to generate a single hazard-weighted estimate of reliability. In the context of this study, the F1 score is used as the primary indicator of the model accuracy because of its ability to work well with imbalanced datasets such as those considered in this paper. A test F1 score higher than 0.8 is considered acceptable and higher than 0.9 is considered a good model. Classification models resulting from this process are used in the generation of critical parameter significance plots and decision trees. critical parameter significance plots aid in further event analysis through the identification of causal factors governing event occurrence, while decision trees enable a human-interpretable breakdown of the event progression. The significance plots are further modified through the introduction of parameter groups representing theoretical clusters of flight attributes. Grouping the parameters in this manner allows a multi-tiered analysis highlighting the impact at both the individual and lumped levels and paving the way for removing tangential correlates.
The pathogenetic decomposition of event occurrence is depicted through the decision trees produced by random forest. Decision trees use sequential parametric thresholds to visually represent a series of Boolean conditions determining event occurrence. The parameters controlling event causation are assigned to nodes along the tree and branch out into subsequent factors when their respective safety thresholds are exceeded. The thresholds governing node branching and hazard identification are compared to SME conceptions of event occurrence to formulate an overarching causal chain governing the precipitation and evolution of an average instance of the event under review. Parameters along the decision tree and their values are further used in visual decision-making processes by SMEs to evaluate algorithmic adherence to physical norms, and identify and subsequently mitigate potential flaws in existing data collection protocols.
4. Implementation and Results
Results from the application of the SAFE framework on real-world operations data are demonstrated in this section. The data under consideration consists of flights from routine revenue airline operations and includes multiple airframes with large turbofan engines that was collected during the period from 2013–2018. The data available comes from over 70 airports across the US and worldwide. Among this data, events are identified and labeled by SMEs familiar with safety analysis using pre-defined thresholds based on knowledge of safety experts, prior incident/accident analyses, and the physics of the event. The SMEs involved in the event definitions are typically analysts and experts working within safety enhancement divisions of airlines. One of the limitations of this framework is the assumption of such validated event labels. The first step in the implementation of SAFE framework is the selection of an appropriate use case among the available data.
4.1. Use Case Selection—Tire Speed Event
The analytical processes outlined in the previous sections naturally presume the existence of safety hazards. The process of identifying use cases involving candidate safety events among the FOQA data necessitates statistical analysis and SME input. The formulation and selection of use cases is manually conducted through the use of macro-level statistics spanning all flight envelopes, operating conditions, and aircraft fleets. The statistical metadata along with SME-defined safety events enables the isolation of interesting events for further analysis. Among the safety event metadata available are multiple event types that are identified based on SME-defined thresholds in various phases of flight.
The process of event identification is tailored to address the means by which commercial airlines conventionally investigate safety hazards. This is achieved through a multi-perspective approach relying on location-based, flight phase-based, or airframe-based analysis coupled with risk assessment i.e., the consideration of event frequency and severity. The location-based approach relies on departure and arrival statistics within the metadata to screen out events constrained to specific geographical areas. The flight-phase method examines the frequency and severity of safety events throughout various facets of the flight envelope and highlights the largest sources of risk for each flight segment. The airframe-based technique takes an operational and maintenance point of view to evaluate elevated hazards for certain individual airframes and the risks stemming from the degradation in their performance over time.
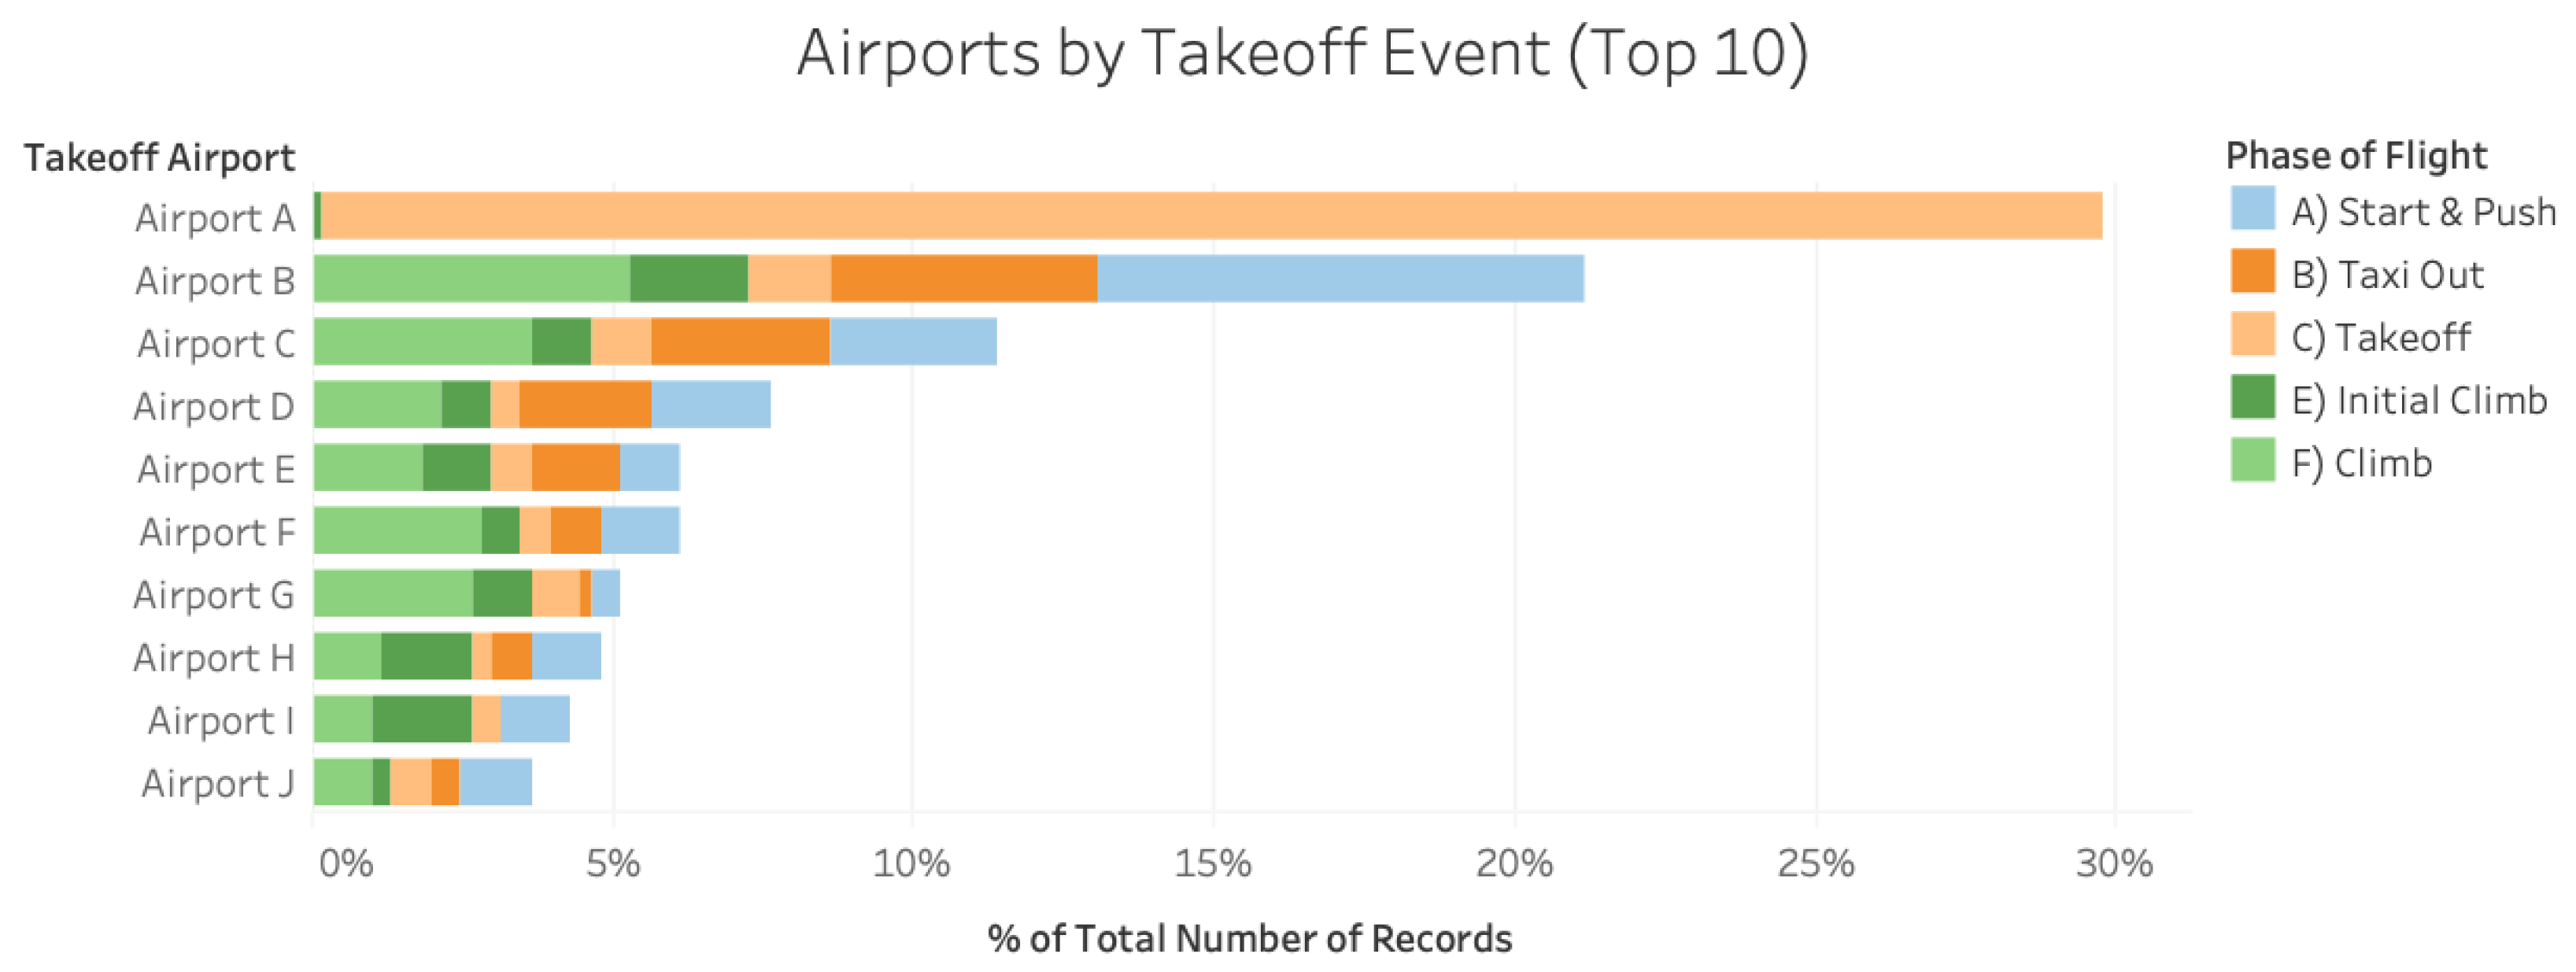
Figure 4 presents a set of results from the location-based analysis of the FOQA data under consideration, whereby airports are ranked in order of event frequency during takeoff. A striking feature of this figure is the higher rate of takeoff events at Airport A, outstripping its more far more frequently traversed counterparts in B and C. Furthermore, it is observed that a majority (99.5%) of the takeoff events at Airport A are a single type of event called
Tire Speed Event which is therefore examined further in the next section.
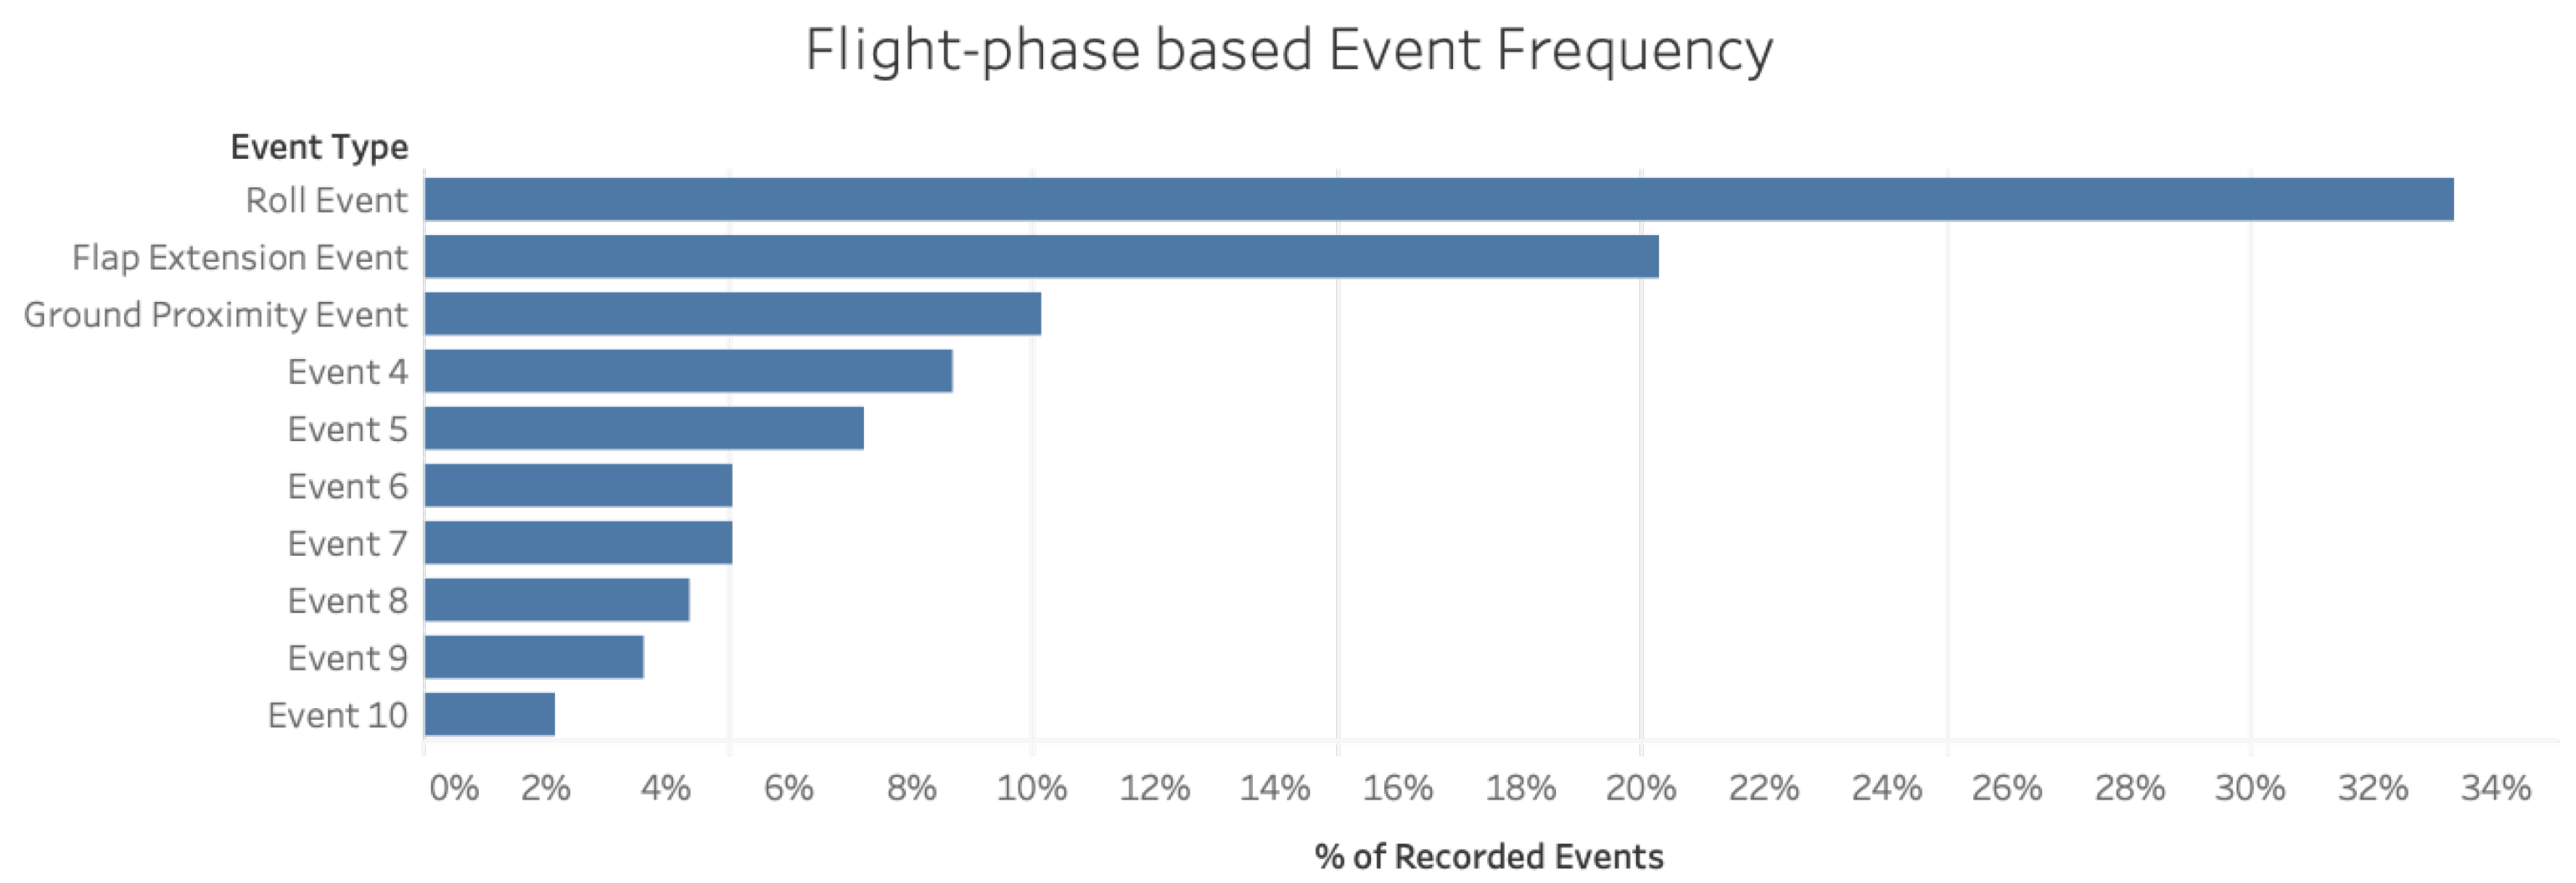
In addition to location-based selection of use case, there are other alternatives available.
Figure 5 depicts the outcomes from the flight-phase-based analysis of all the FOQA data under consideration, with events being ranked in order of frequency during a certain phase of flight. The
Roll Event poses the most serious risk given its high frequency throughout the available data.
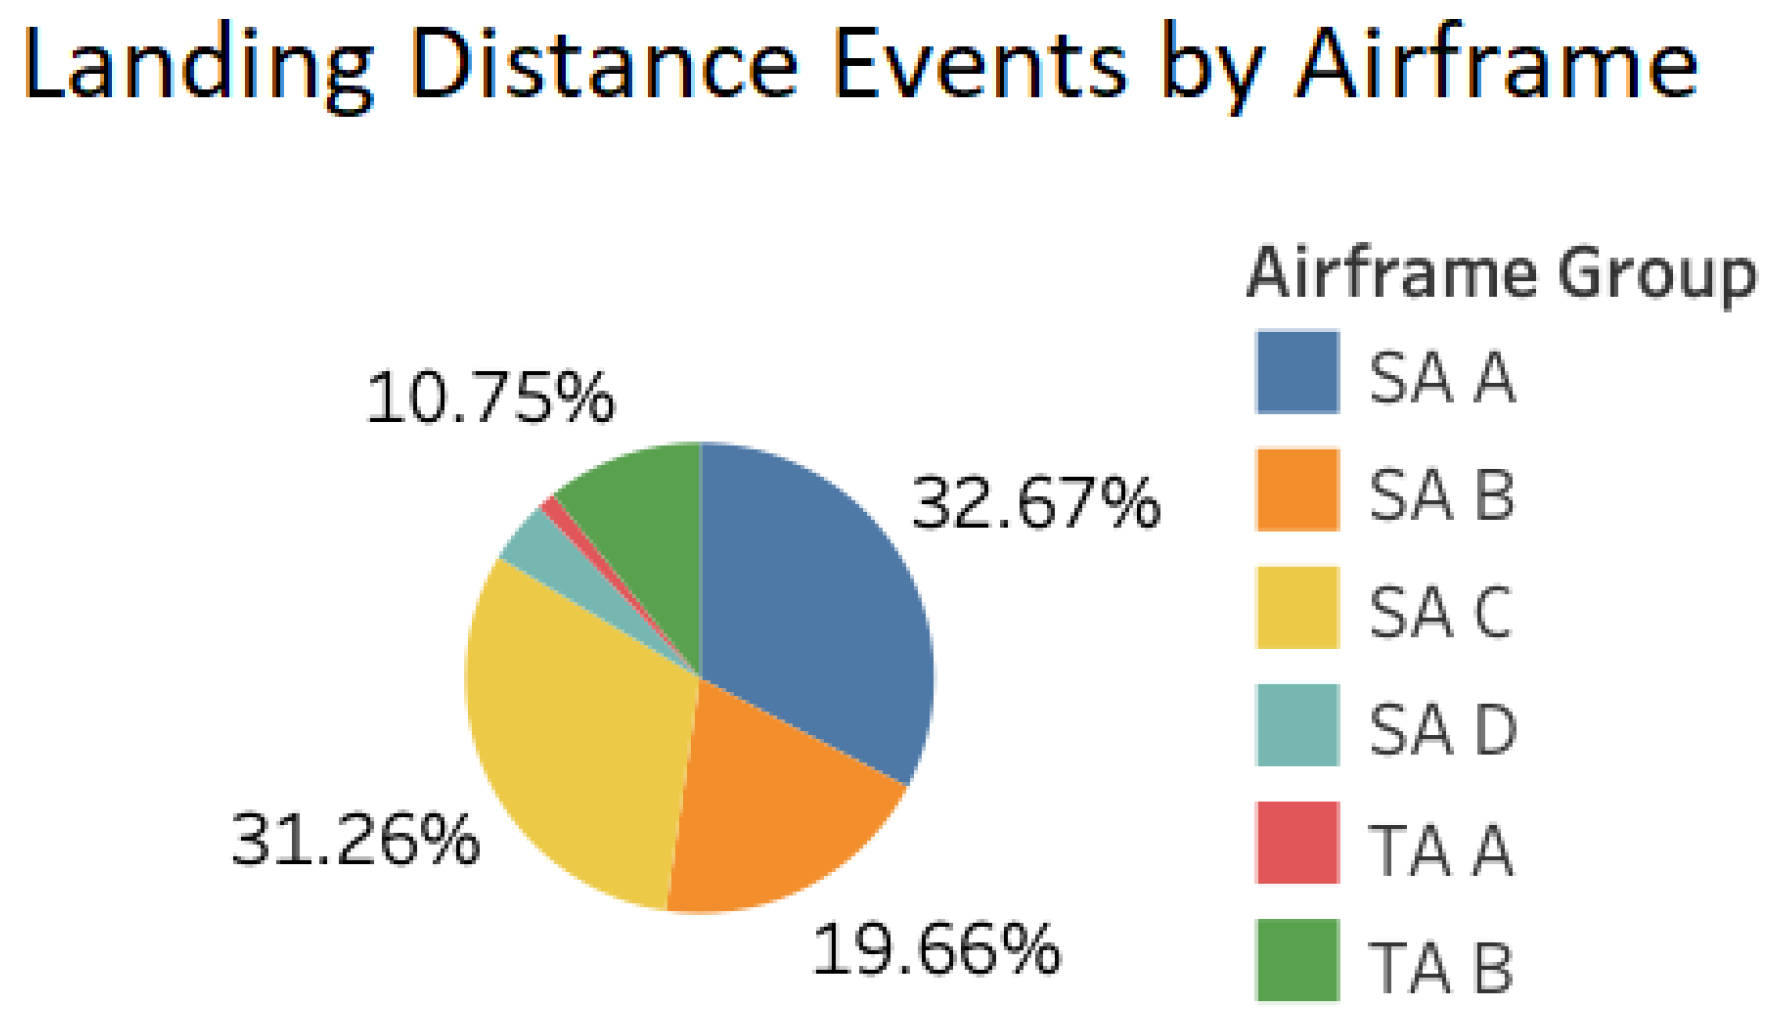
Finally,
Figure 6 shows the products of the airframe-based analysis of the FOQA data under consideration conducted on the
Landing Distance Event. The breakdown of the airframes involved in this event reveals the disproportionate role of the Single-Aisle airframe A and C.
The next two sections are dedicated to the analysis of the first use case identified—Tire Speed Event followed by analysis of a flight-phase-based event (Roll Event) and an airframe-based event (Landing Distance Event for airframe SA C).
4.2. Algorithmic Analysis of Tire Speed Event
The risk assessment schema presented in the previous section is employed for the selection of a single safety hazard for additional analysis. A further examination of the data from
Figure 4 had singled out a safety event called
Tire Speed Event as the primary contributor (99.5%) to the takeoff events at Airport A. An investigation of the attributes associated with the
Tire Speed Event reveals more serious concerns beyond its geographic localization, namely its confinement to the Large Twin-Aisle airframe. Furthermore, these observations are coupled with the event designation as a frequent phenomenon (accounting for 28% of all the takeoff events), and its tendency to warrant warning labels across 99% of its occurrences. A total of 879 flights from the Twin-Aisle airframe group A (TA A) are identified for this event as the data set for further analysis. Pre-processing is conducted solely via the deletion method to ensure the retention of entirely non-corrupted parameters, reducing the remaining parameter list to 282 parameters from the original 623. Correlation analysis is subsequently performed using a threshold of 95% to create a processed FOQA file consisting of 128 parameters per second for each flight that may be aggregated into feature vectors.
Both the single and consecutive timestamp methods are used to create two distinct feature vector sets. Single timestamp method uses the final time stamp associated with the
Tire Speed Event label from the FOQA files under consideration, whereas the consecutive timestamp method considers the final ten timestamps prior to the detection of the event. The staggered timestamp method is neglected due to the temporally localized nature of the
Tire Speed Event, which only occurs towards the end of the takeoff phase [
35]. The available data is split into two sets (training and test) in a 70–30% proportion and is used for model creation, with data balancing achieved through oversampling– rectifying the low number of event flights compared to non-event flights (
1:3 ratio) within the initial data set.
The SAFE framework is applied to this use case and the predictive performance of the classification for the
Tire Speed Event is substantiated through the confusion matrix shown in
Table 10. The confusion matrix demonstrates the ability of the algorithm to distinguish between genuine events and false flags except for a single flight in the test set. This observation is corroborated through the values of the metrics in Equations (
2a)–(
2c), indicating high predictive performance across the balanced data set.
Once the predictive performance of the model is established, it can then be used to identify critical parameters that were instrumental to the successful classification of the event under consideration.
4.3. Critical Parameters for the Tire Speed Event
The accuracy scores stemming from the confusion matrix for the
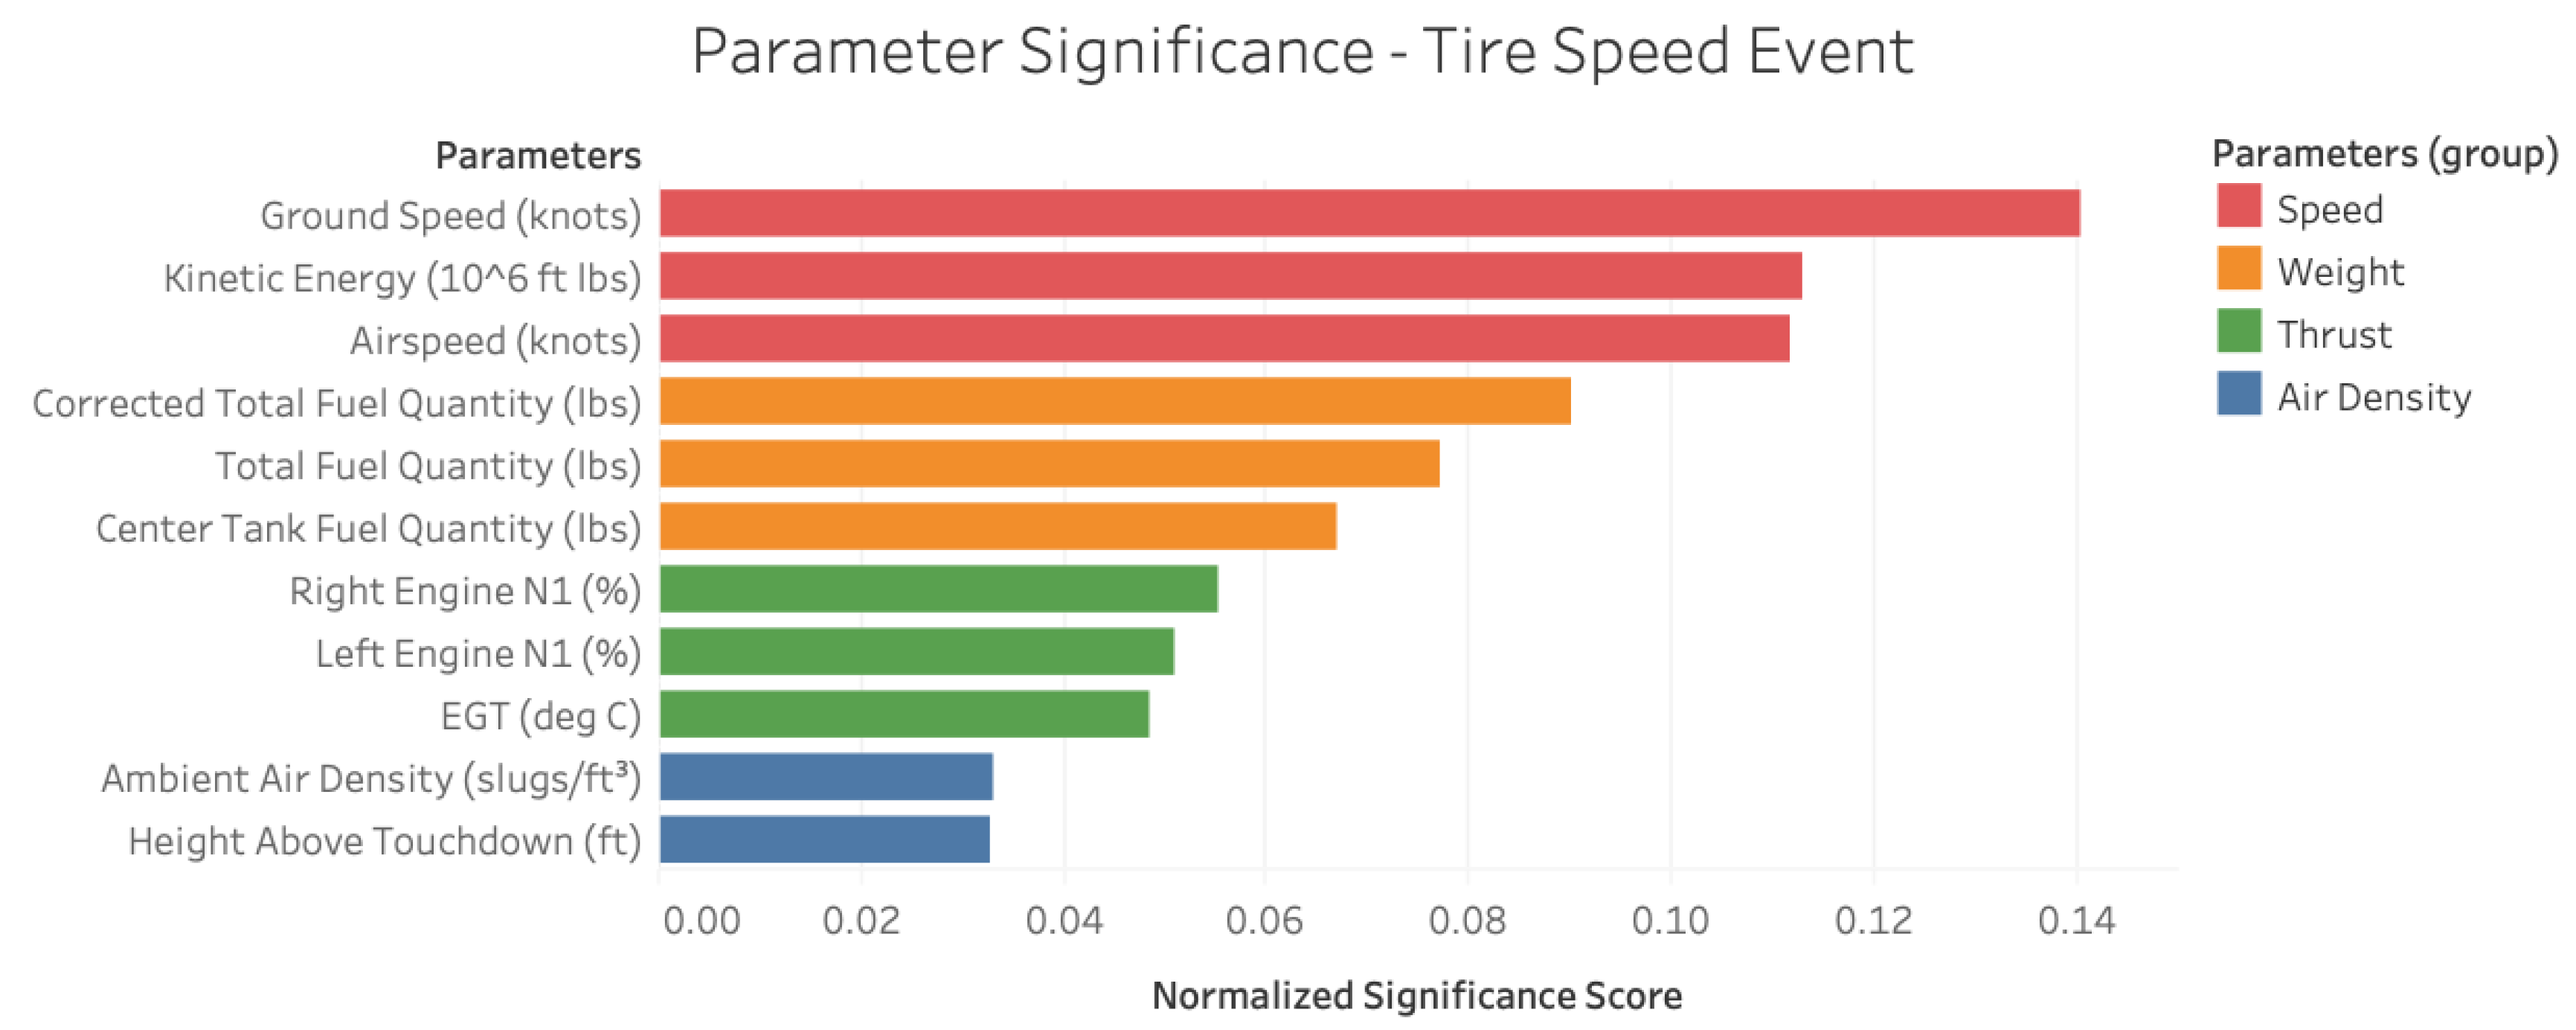
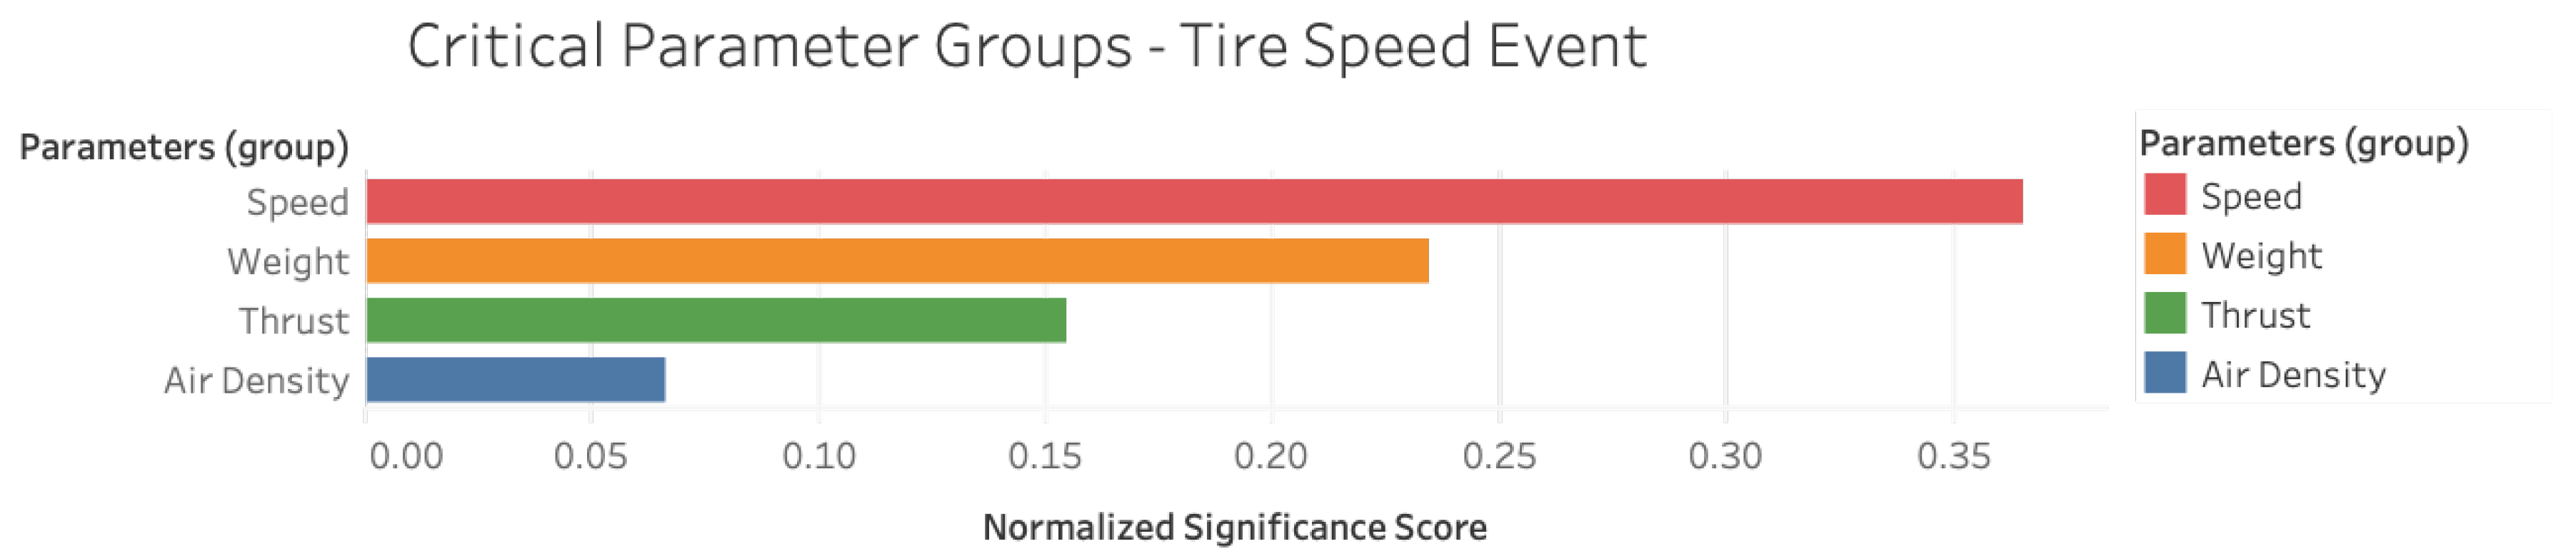
Tire Speed Event validates the predictive capability of the algorithm and sanction a deeper analysis of the critical parameters that constitute the model. The critical parameters for this event and their relative importance is displayed in
Figure 7 alongside the parameter groups defined by SMEs. The parameter names are presented on the
y-axis and their normalized significance score is presented on the
x-axis. The parameters with higher score are deemed to be greater contributing factors towards identification of this event. The normalized significance score is obtained from the Random Forest model through an impurity-based feature importance. The importance of a feature is computed as the (normalized) total reduction in the criterion (in this case, event classification accuracy) brought about by random permutations of that feature. For further details, readers are referred to Breiman [
36].
The nature of the
Tire Speed Event as a sharp-end event [
37] (i.e., occurring at the end of a chronological causality chain) renders it conducive to the use of feature vectors with consecutive time stamps.
Figure 7 exhibits the prevalence of speed, weight, thrust and air density-related parameters as essential factors underlying the
Tire Speed Event obtained through the application of feature vectors with consecutive time stamps. The results presented so far can be corroborated from a human perspective through the incorporation of published guidance about the event and a statistical analysis. For example, in their report, Boeing [
35] assert that the factors governing the
Tire Speed Event are high takeoff speed, high aircraft weight, low air density, under-rotation, and strong crosswind/tailwind. Barring the contribution of the latter two parameters which are not considered in this work, these acknowledged factors arise as the preeminent causal bases in the ML model developed here.
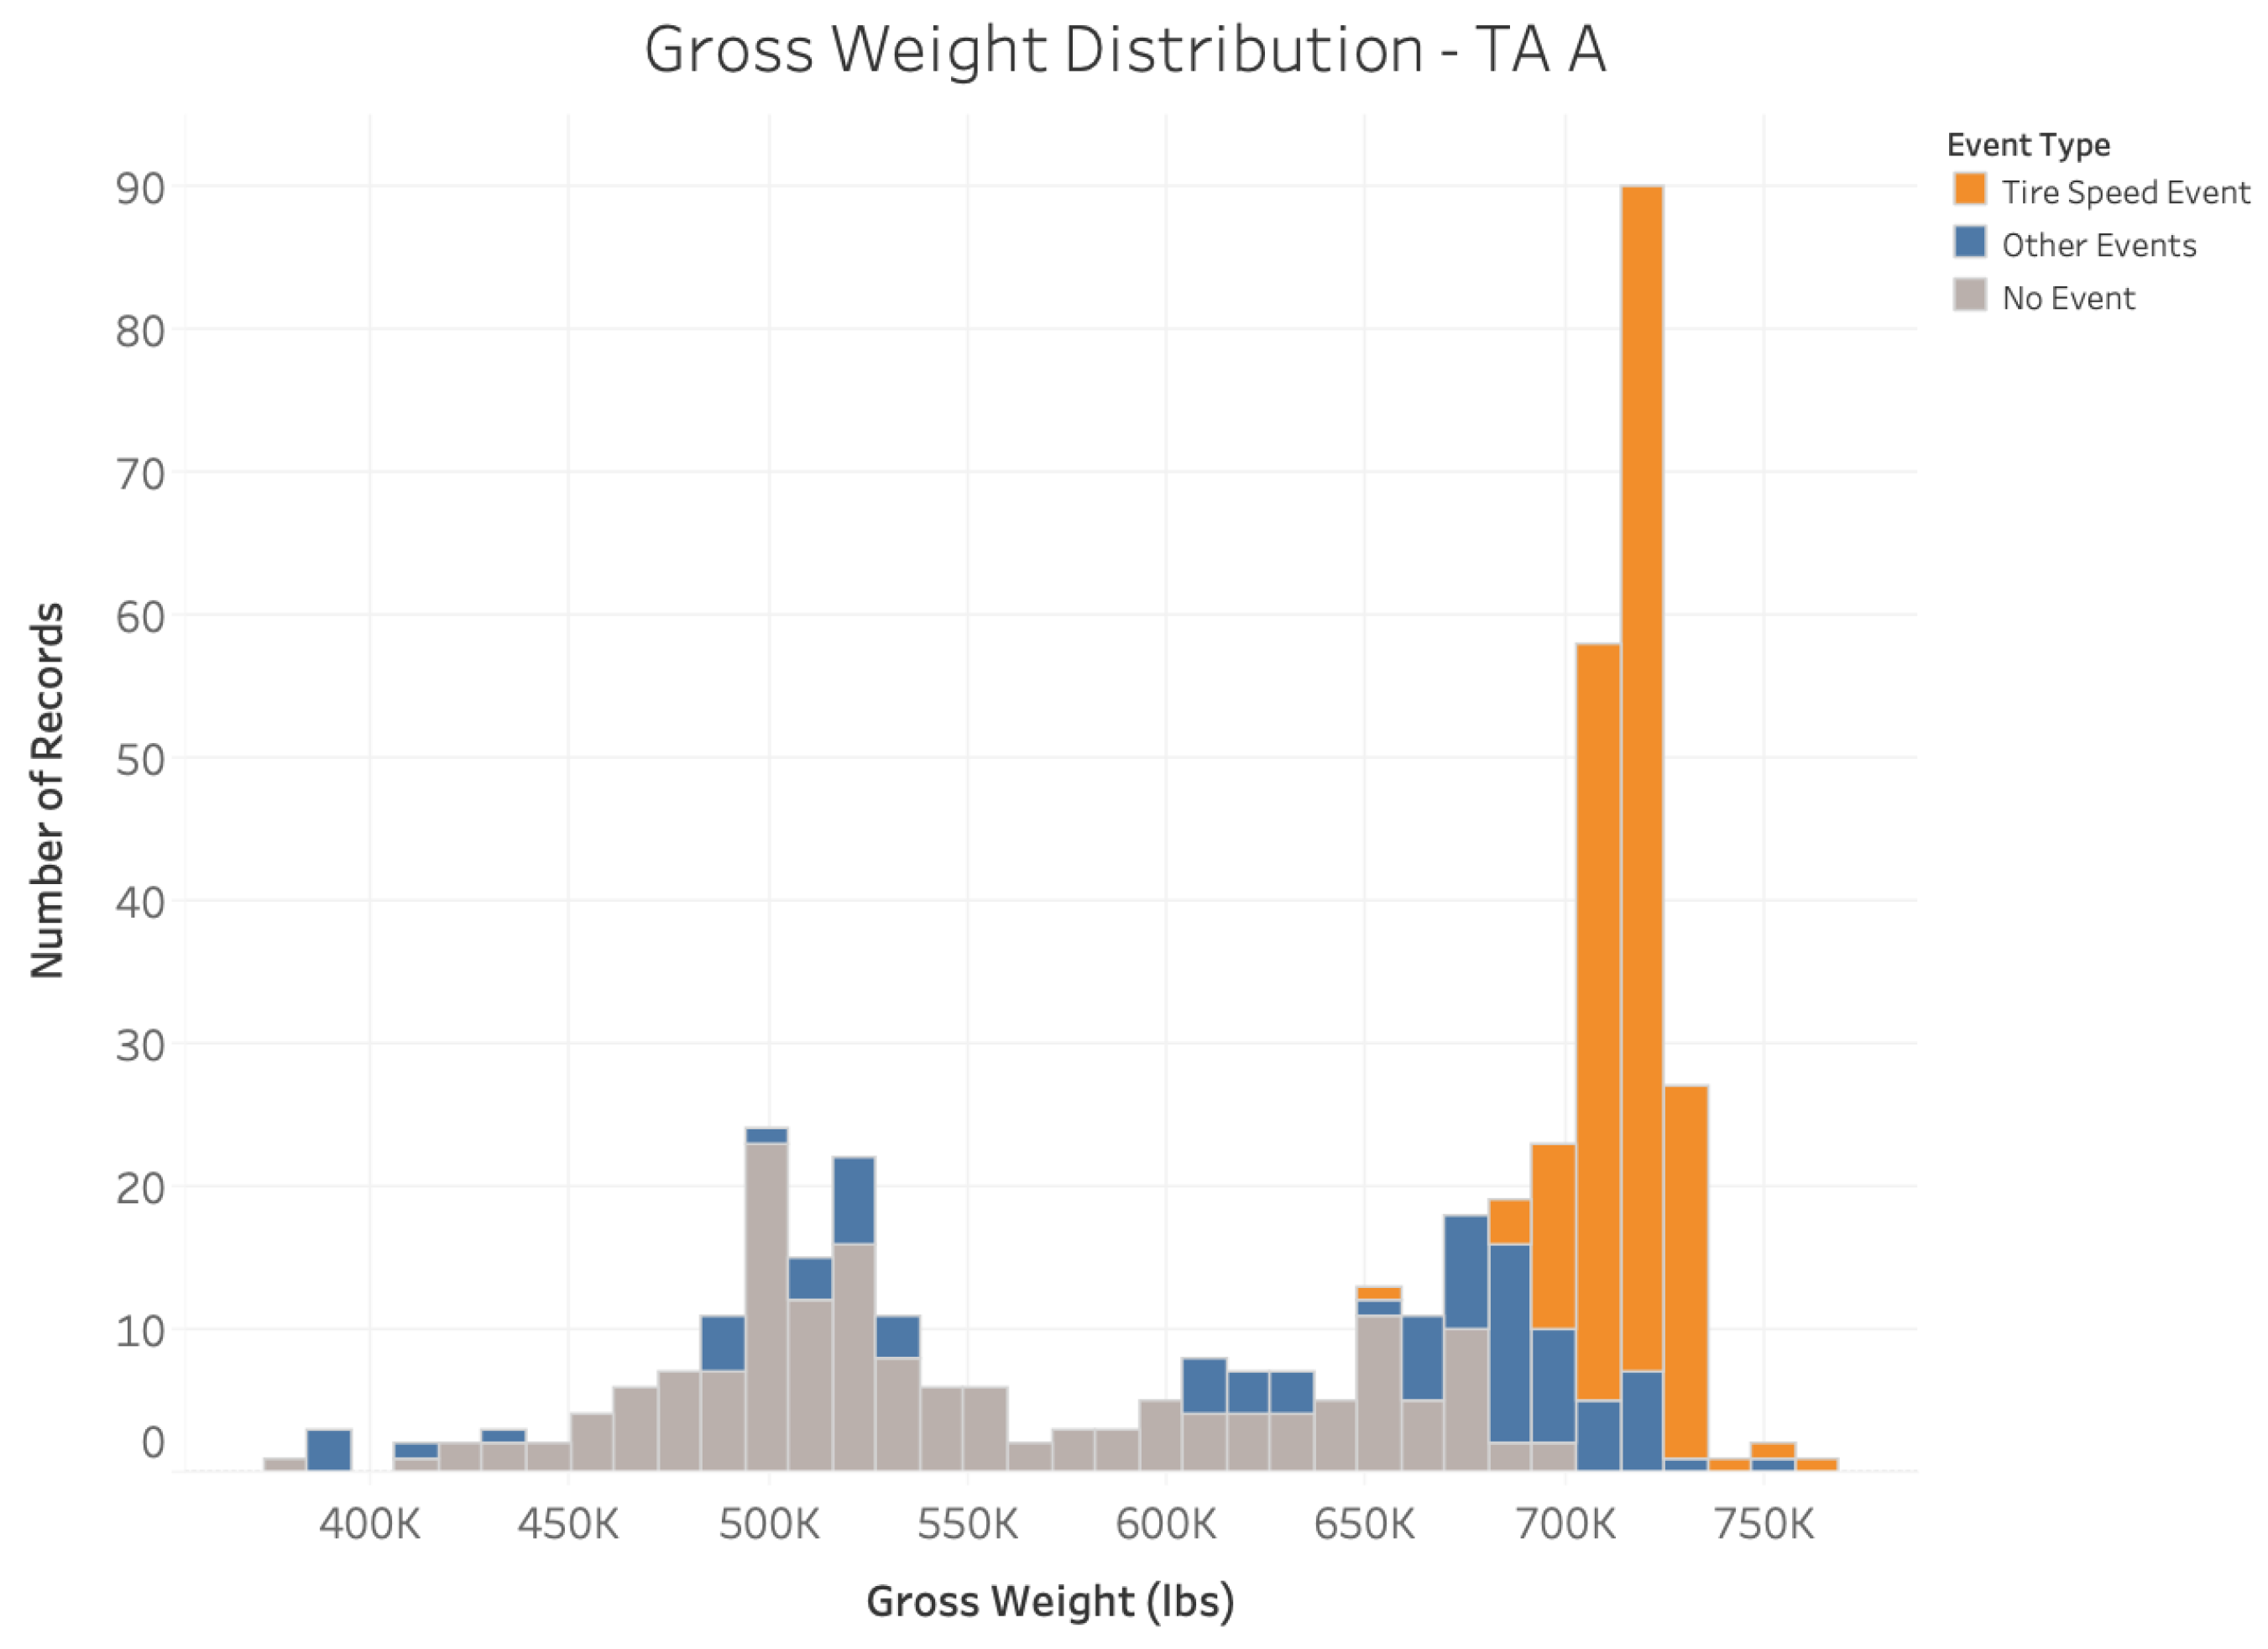
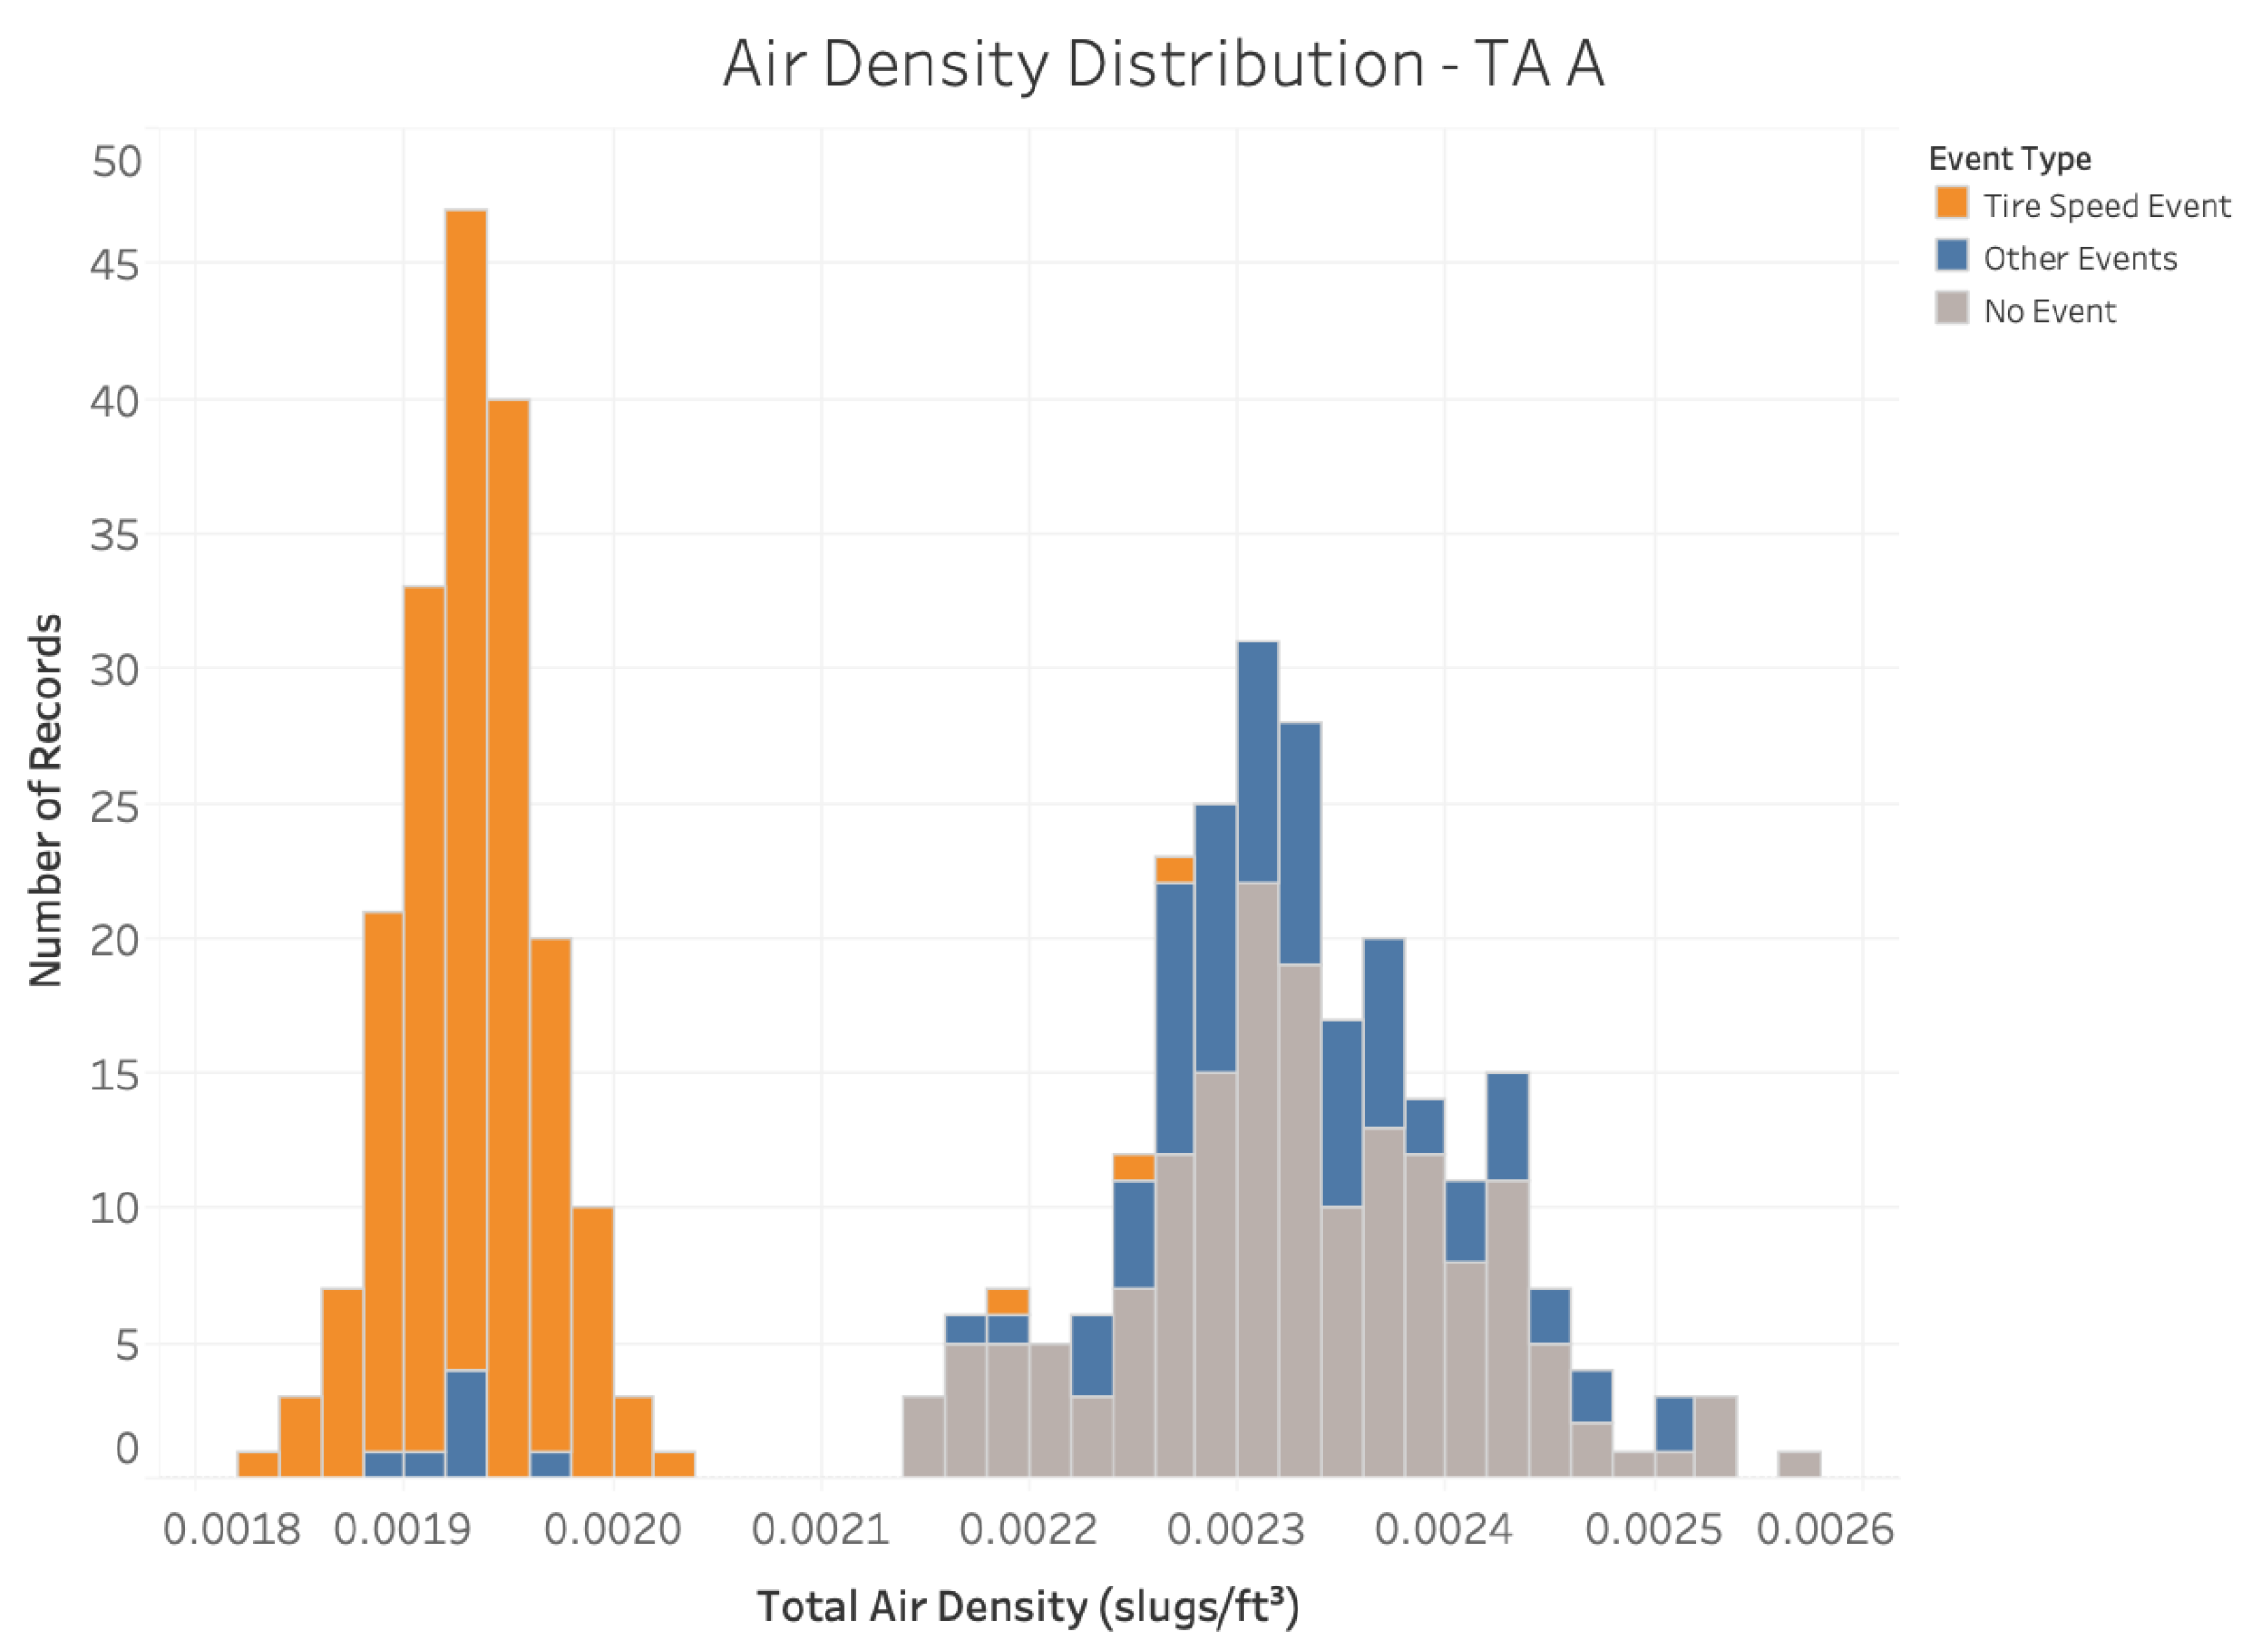
Furthermore, the critical parameter groups identified by the ML model are substantiated in
Figure 8,
Figure 9 and
Figure 10, which show the distributions of airspeed, gross weight, and air density for the TA A fleet for event and non-event flights. The results corroborate the role of these causal parameters identified by the SAFE framework in precipitating the
Tire Speed Event.
Through the visual inspection of the figures and SME inputs, the presence of certain speed, weight, and air density thresholds beyond which safe tire speeds might be exceeded become evident. For example, an airspeed larger than about 185 kt, a gross weight larger than about 650 K lb, and an air density smaller than 0.0021 are all conducive to a higher likelihood of Tire Speed Event for TA A airframe. These numbers demonstrate the potential constraints on the safe operation of the TA A aircraft such as the presence of upper bounds on safe takeoff speed and gross weight, and lower bounds on air density. The automated identification of such constraints thus provides valuable precursor information about the Tire Speed Event and enables proactively implementing measures to avoid it.
Apart from factors traditionally associated with the
Tire Speed Event from published literature [
35], the ML application identifies
thrust as a critical parameter group underlying the event as shown in
Figure 11. This addition to the causal factors can be attributed to two phenomena. First, the physical coupling of
thrust with its parametric counterparts due to the shared density and speed terms in its governing equation. Second, the physical need for
thrust to be increased to counteract degradation in aircraft performance at high gross weights and high-density altitudes. Thus, the algorithmic analysis can offer additional insights beyond existing definitions and can be viewed as a complementary approach for precursor identification.
The manner in which parameters influence the
Tire Speed Event occurrence is encapsulated in the decision tree shown in
Figure 12. Each node within the decision tree examines the influence of FOQA parameters under consideration and indicates the thresholds at which they contribute to the occurrence or progression of a Tire Speed Event. The fulfillment of subsequent parametric thresholds leads downward towards deeper layers of the tree, with each branch indicating a possible avenue of event progression, termination, or realization. This example positions corrected fuel quantity (a proxy for total weight) as the impetus for event occurrence, with its values resulting in a concurrent evaluation of air density, vibration level and their respective pathways. One utility of decision trees lies in their ability to ascribe quantitative and potentially independent series of conditions controlling event progression. In summary, for each flight, the values of the FOQA parameters in its feature vector will lead it through a unique path in the decision tree that will end with a prediction of event or no event. The physics-based approach to event inspection is enhanced with the use of the decision trees generated by random forest, whose aforementioned etiological pathways reaffirm the operational boundaries instated by preceding SME analysis. The investigative approach also facilitates the detection of operational shortcomings beyond the scope of event labeling, as apparent in the decision tree characterization of air density. The imposition of a physically impossible density threshold accentuates both a flaw in the FOQA data collection scheme (a hypothesis validated by the detection of sensor errors) and the robustness of classifiers in event prediction. The incorporation of Machine Learning into event analysis presents a new opportunity for the sustained development of existing data collection and processing protocols while maintaining a vigilant stance towards safety threats.
ML and SME analysis converge upon air density, speed, thrust, and weight as the parameter groups governing the
Tire Speed Event. The convergence to these parameter groups can be understood through basic lift and drag equations pointing to the problem as fundamentally aerodynamic in nature. The absence of wing surface area and the lift and drag coefficients from the ML analysis can be attributed to limitations in data available for analysis in this work.
4.4. Application of SAFE to Other Use Cases
Thus far, results from the
Tire Speed Event have painted a favorable picture of the SAFE framework as an enabler for safety analysis. However, additional considerations are necessary to form a balanced judgement of its abilities. To this end, use cases containing events from the remaining two methods of use case identification shown previously in
Figure 5 and
Figure 6 are investigated. The
Roll Event is different from the
Tire Speed Event due to its tendency to occur all throughout the phase in consideration. The
Roll Event is primarily posed by a pre-defined bank angle exceedance from an SME-defined parameter threshold. This physically defined (i.e., directly controllable) event trigger is molded to reflect the different circumstances under which the bank angle exceedance arises through the establishment of separate event flagging across several altitude ranges and bank angle thresholds. The
Landing Distance Event differs from the
Roll Event due to its formulation using
functionally defined (i.e., indirectly controllable) thresholds for the remaining runway length at the conclusion of the approach phase.
The predictive performance of the classification model for
Landing Distance Event and
Roll Event are substantiated through the confusion matrices shown in
Table 11. The F1 score for the
Landing Distance Event model is
0.911 and for the
Roll Event model is
0.846. From the confusion matrix as well as the
F-1 scores, it is evident that the SAFE framework can fit a good predictive classification models for both these use cases as well.
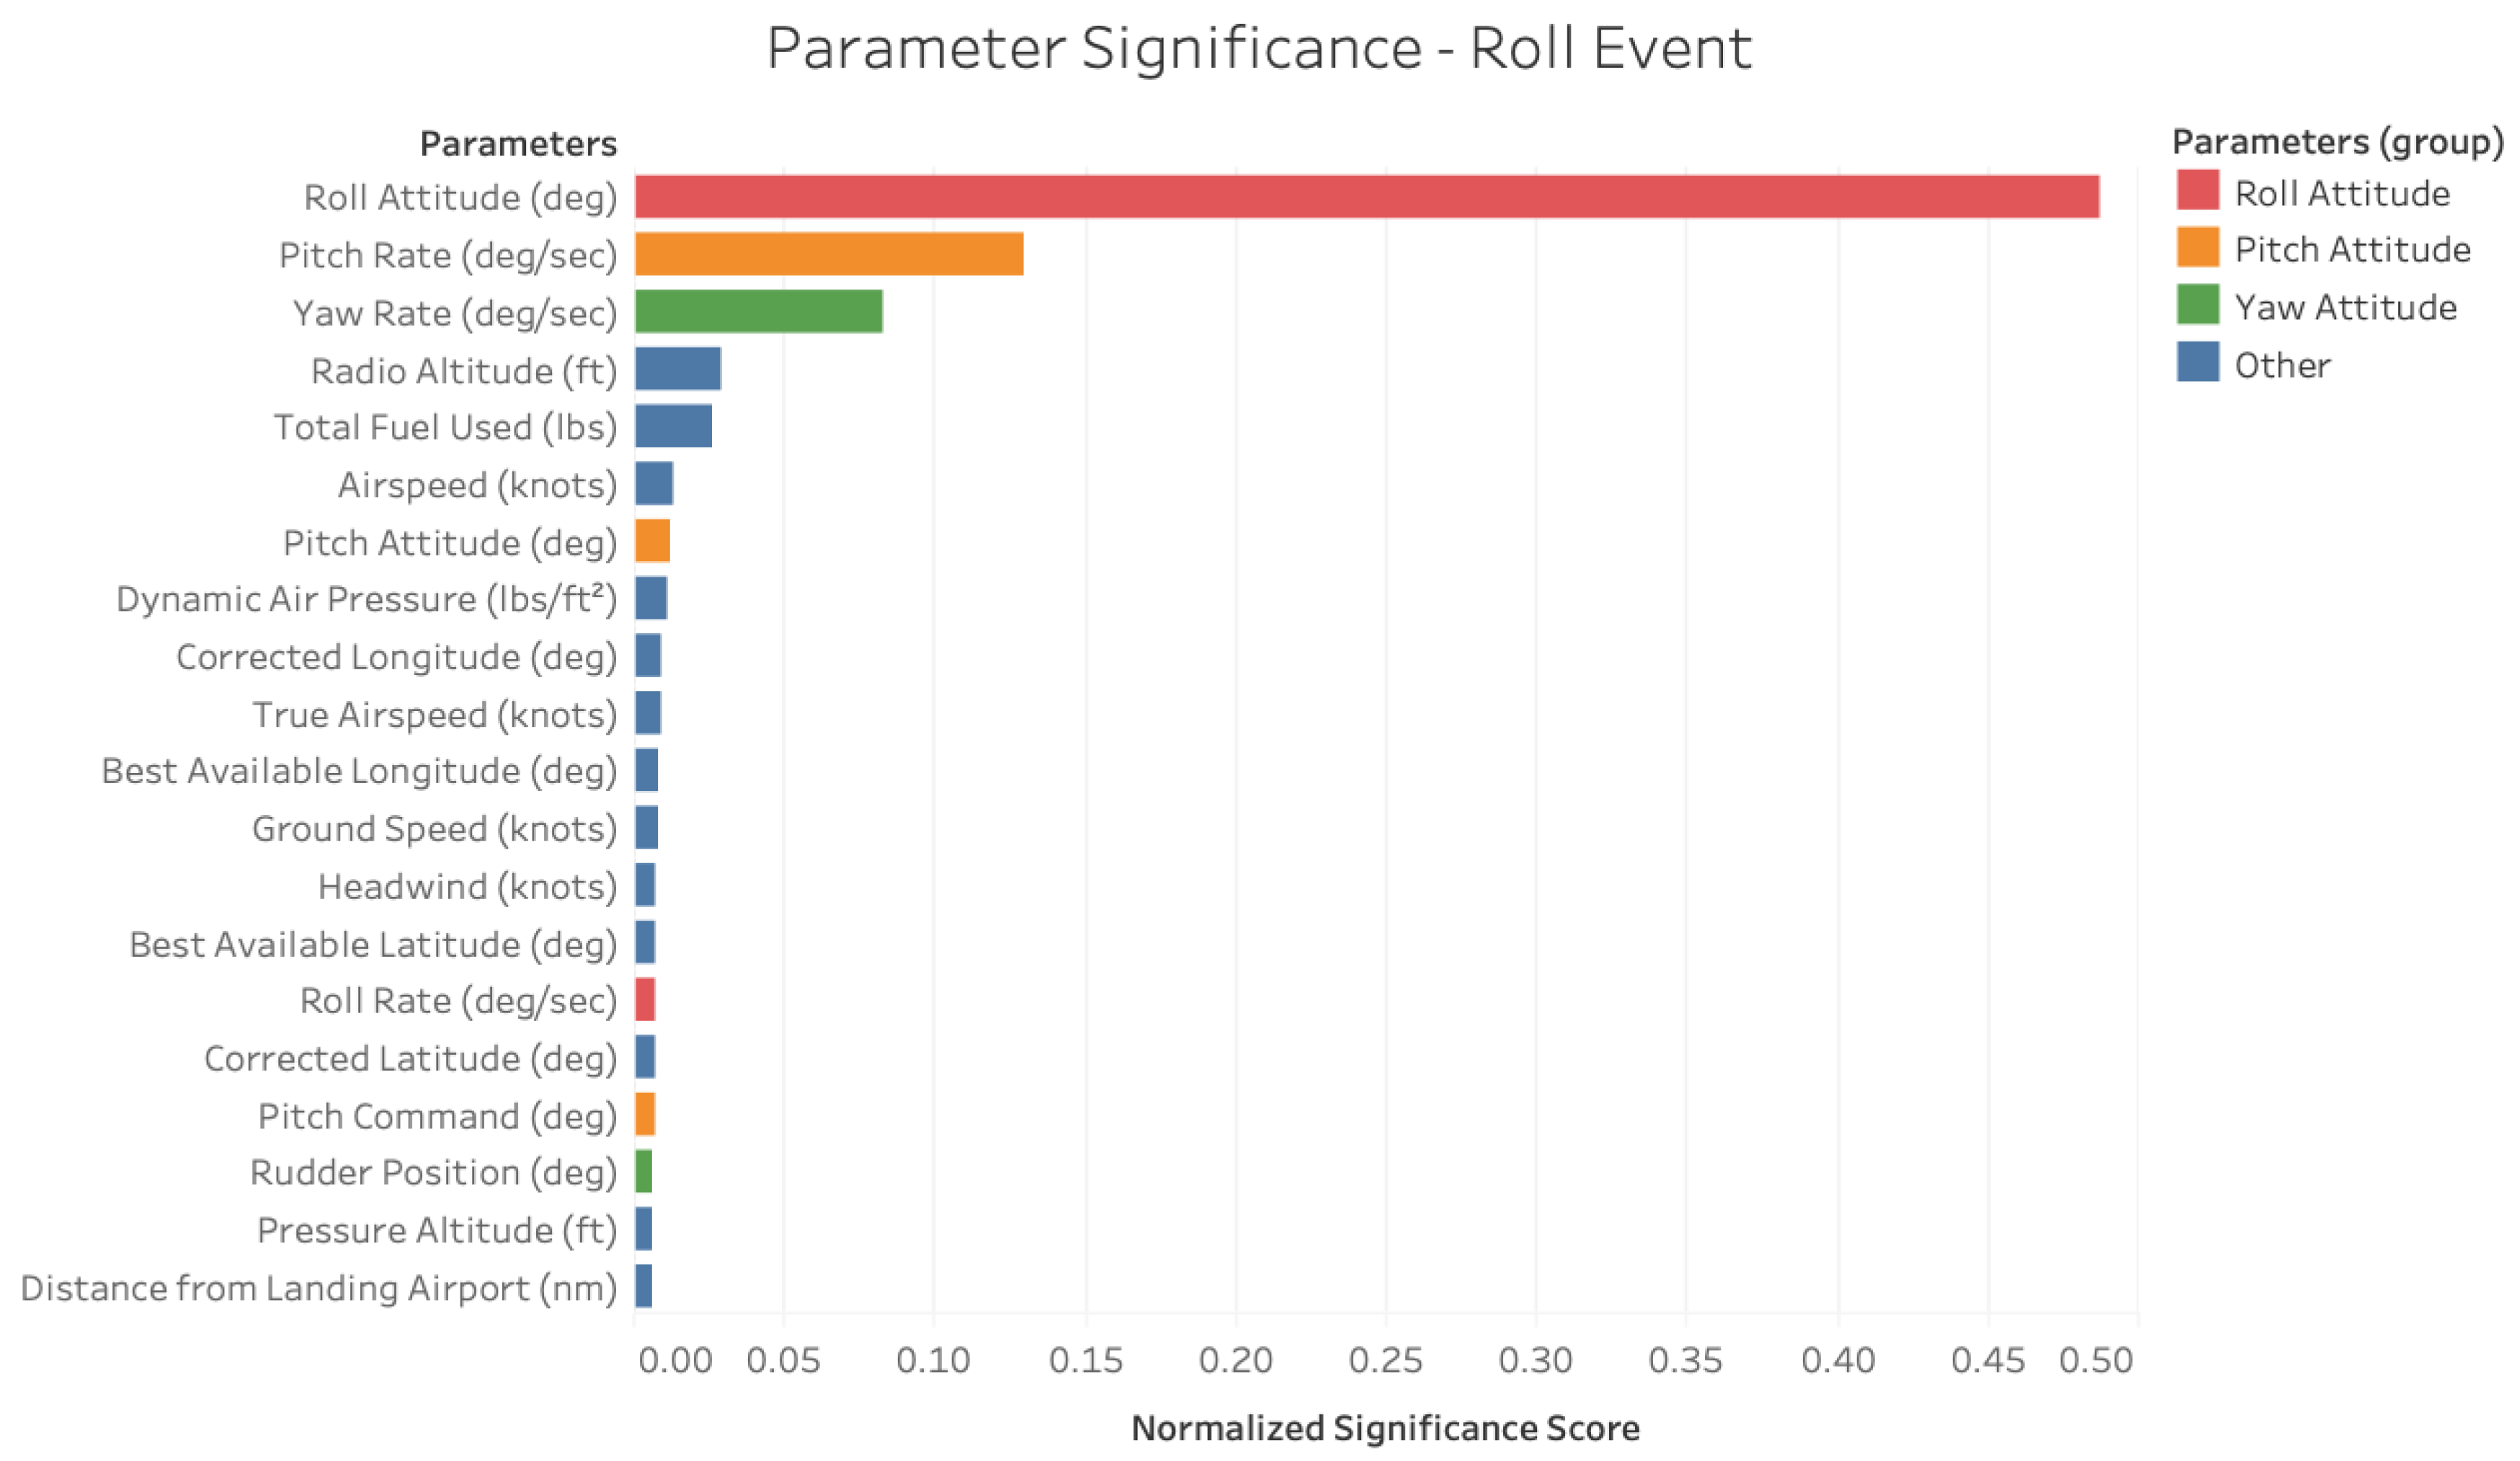
Figure 13 shows the critical parameter decomposition of the
Roll Event stemming from a similar application of the parameter significance using the SAFE framework. The emergence of roll attitude as the predominant factor falls in line with the definitions used in event flagging. The presence of pitch and yaw rates as accompanying factors is substantiated by the coupled nature of aircraft dynamics. The coupling explains these two parameters’ contributions to the event classification not necessarily their claims to causality. This is a potential limitation of the algorithm to distinguish between causal factors and their tangential correlates in certain instances. Furthermore, despite its ability to recognize roll attitude as the primary determinant of the
Roll Event occurrence, the algorithm F1 score is slightly lower in this case, indicating the presence of a few misclassifications.
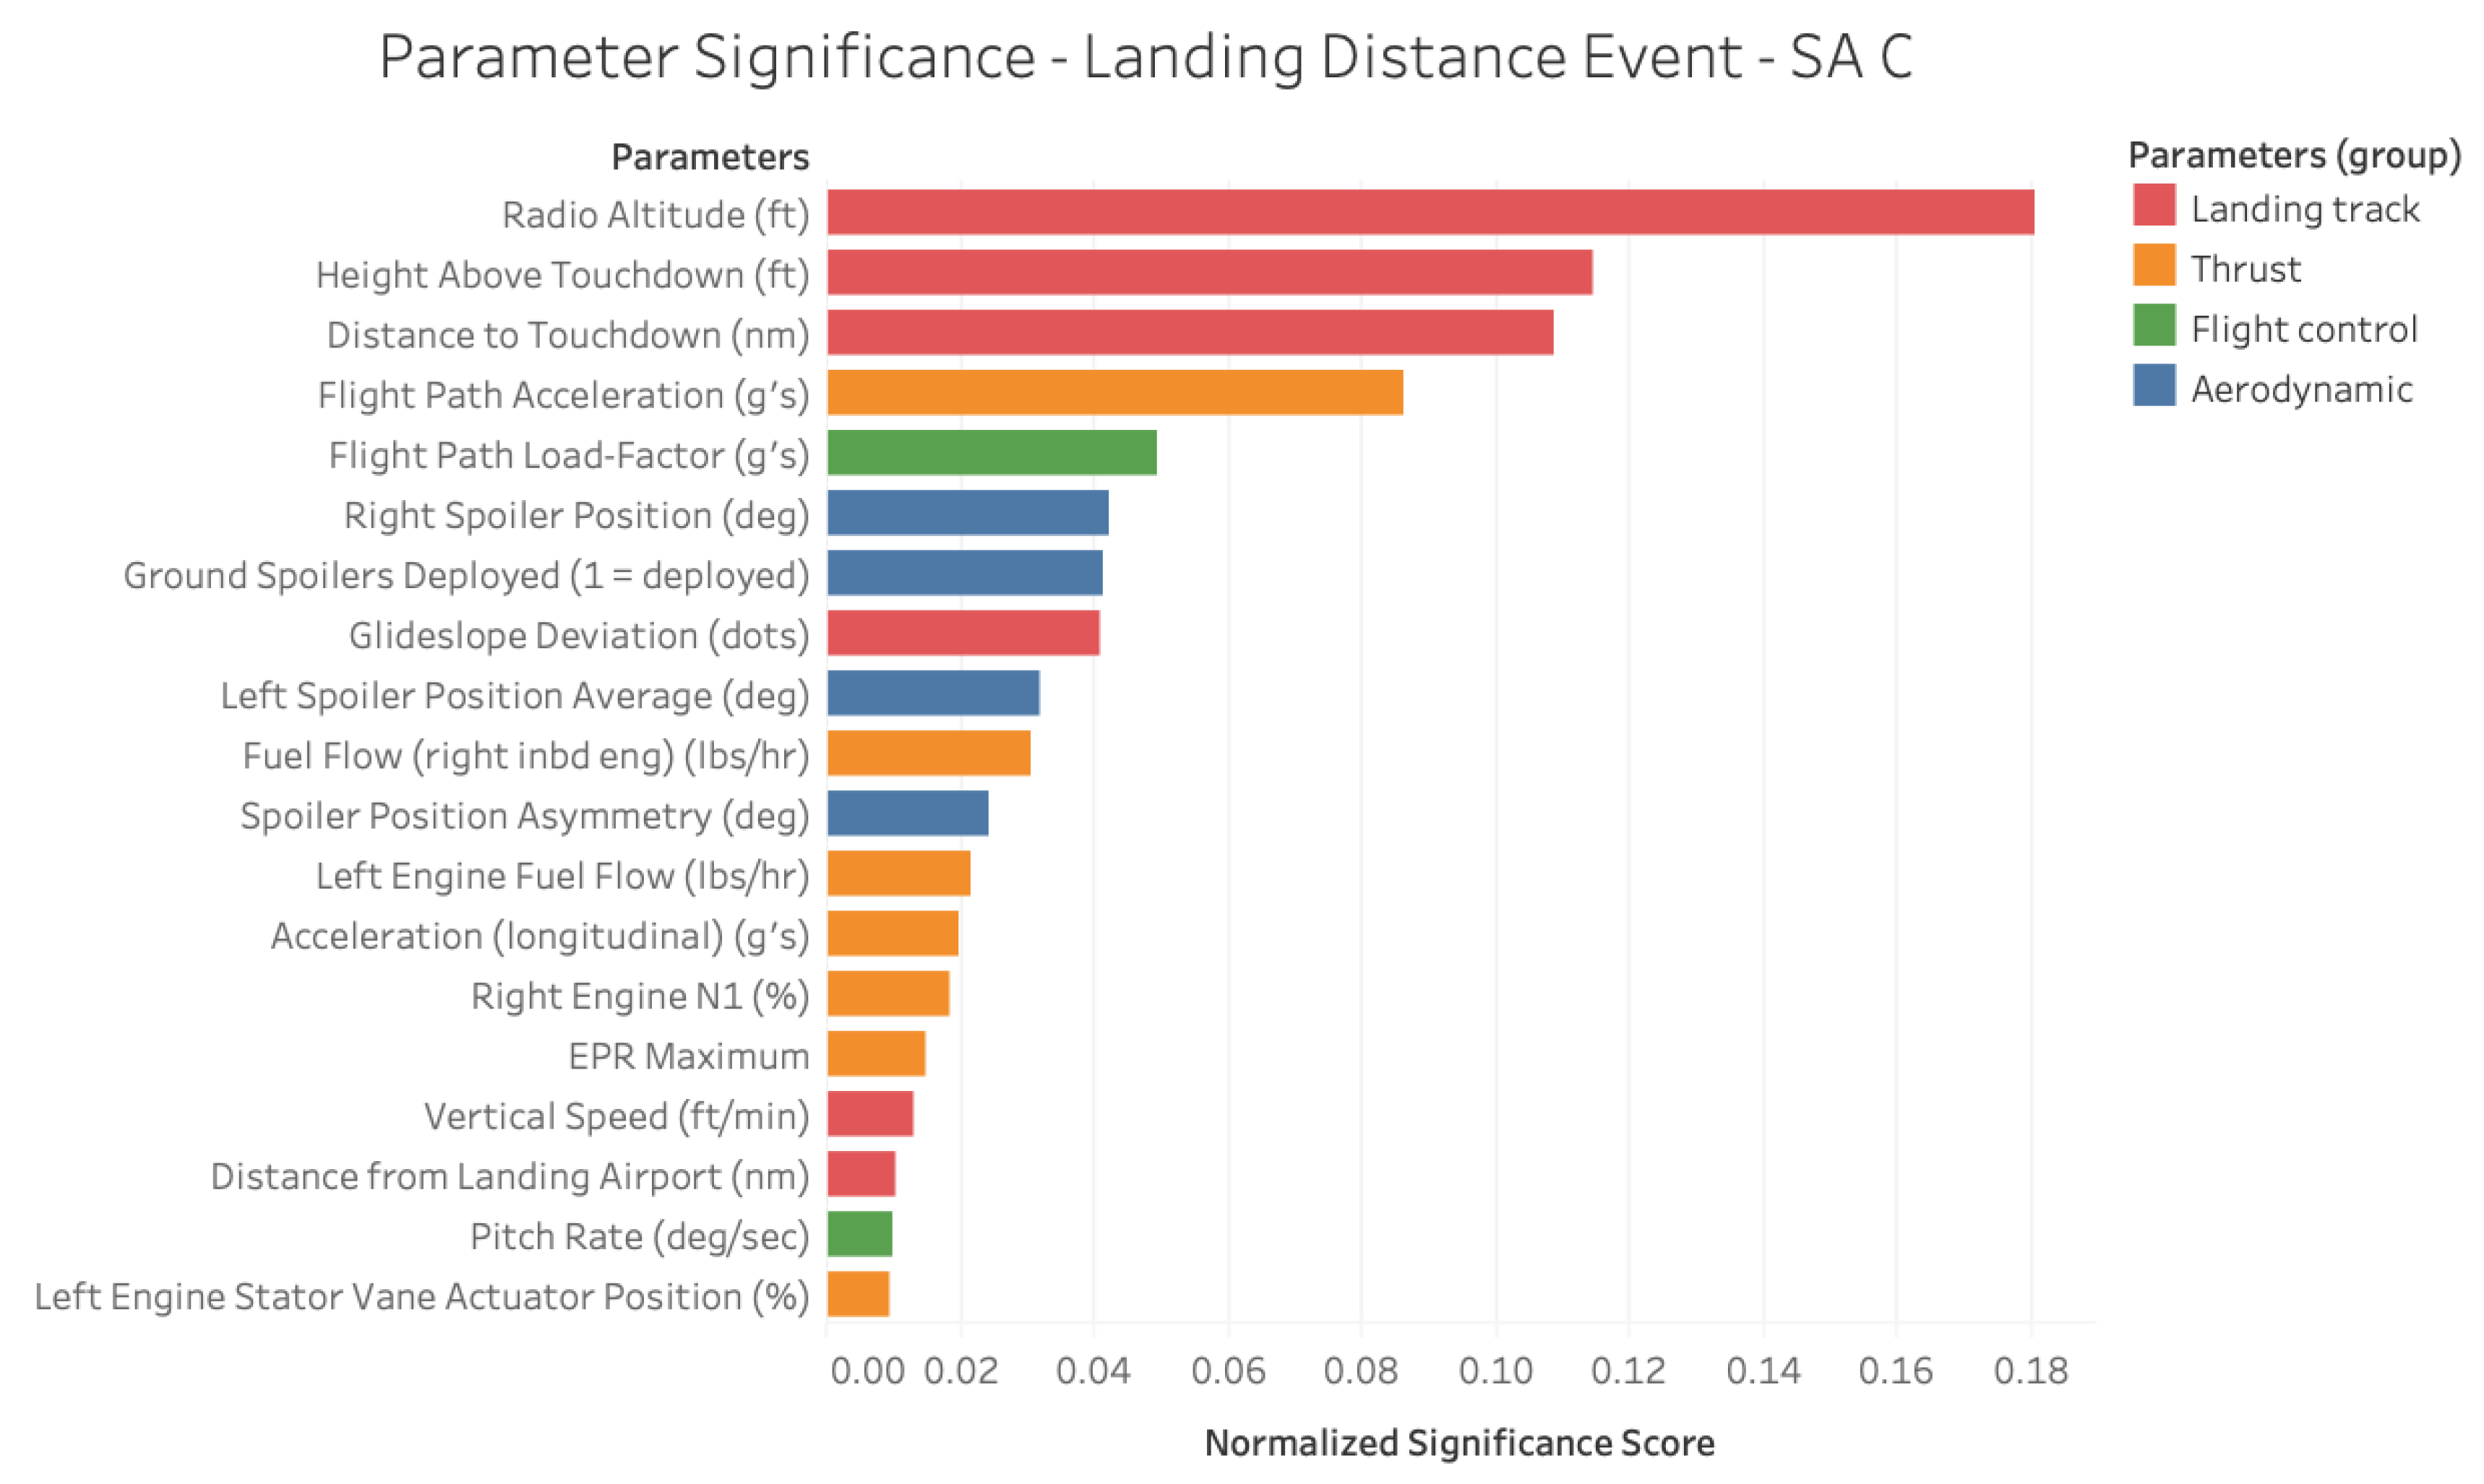
Figure 14 depicts a similar critical parameter decomposition for the
Landing Distance Event event. Unlike the
Roll Event, this event consists of more diverse causal structure spanning multiple significant parameter groups. The presence of parameters related to
landing track reaffirms the importance of trajectory during the final approach phase as a precursor for this event. The remaining parameter groups offer insights into the physics of the
Landing Distance Event and formalize the importance of flight dynamics in the occurrence of this event.
Through all three use cases, the difference in the normalized parameter significance values themselves indicate the varying nature of different types of events and the ability of the SAFE framework to not only identify a ranked parameter significance chart but also their relative importance to each other. Whether the safety event under consideration is
Tire Speed Event where the parameters can be organized into clear groups, or
Roll Event which contain a small list of crisp causal parameters, or
Landing Distance Event which involves a more diverse and coupled parameter significance from the top to the bottom of the list, the SAFE framework is able to identify the critical parameters and their relative significance. The results presented in
Table 12 summarize the application of the SAFE framework for the isolation of critical parameters governing three distinct safety events: the
Tire Speed Event, the
Roll Event, and the
Landing Distance Event. In addition, each parameter groups are corroborated through both physics-based intuition and SME consultation.
The developed framework can be used as a proactive safety measure in two different ways. First, the trained models from each event type can be used to predict the probability of events on a new flight as demonstrated by the high accuracy of the models on test data. Second, the identified precursors or critical parameters for an event type can be monitored for high-risk scenarios or situations in which that event has frequently happened in the past (for example, the precursors of the tire speed event can be monitored when operating Airframe - TA A for which it frequently occurred or the critical parameters of the landing distance event can be monitored for Airframe - SA C).
The SAFE ML framework developed in this study can be practically transferred to work with any similar data sets to gain insights as well. The key requirements for the application of the SAFE ML approach by airlines or other stakeholders are:
The ability to label flights within the data set using SME-defined thresholds for event detection. In the absence of available labels, publicly available guidelines like the stabilized approach criteria [
38] or others may be used.
The processing of data to extract relevant time stamps within the flight to explore for precursors and critical parameters (typically time stamps directly leading up to the detection of the event)
The application of the ML algorithms as outlined in the paper to classify the events and non-events with high accuracy and use the feature importance from the algorithms to understand precursors to the events.
With the development of these three capabilities, stakeholders can practically replicate the SAFE ML approach for critical parameter identification in other data sets.
5. Conclusions and Future Work
5.1. Outlook for Algorithmic Event Analysis
The rapid growth in aviation data coupled with its mandated standardization offers a unique opportunity for the collective analysis of safety events plaguing commercial aviation flights. In this paper, we propose the SAFE framework to streamline event analysis that can identify safety events and their associated critical parameters or precursors for a diverse array of events. The success of the SAFE framework at tackling such challenges is achieved through the application of data cleaning techniques and correlation analysis prior to the implementation of a robust ML algorithm to ensure the predictive integrity and usability of the available data and consistency of results. The SAFE framework is practically implementable and transferable in other scenarios through the guidelines provided in the paper.
5.2. Hurdles to Collaborative SME-ML Analysis
The application of ML across the full spectrum of possible events reveals the impact of event definitions on the framework’s usefulness. While accuracy remains within acceptable bounds (F1 scores ranging from 0.85 to 0.99) across the three events considered, the shortcomings highlighted in the examination of the Roll Event and the Landing Distance Event events warrant further inspection. The challenges for the critical parameter identification of these two events can be attributed to the divide between functional and physical event definitions and the absence of a standardized protocol for event formulation. The success of the SAFE framework firmly depends on clear definitions for safety events which might not always be the case.
These factors can sometimes undermine the ability of the framework to distinguish between causal factors and tangential correlates. These issues are exacerbated by the incorporation of inherently statistical algorithms in an effort to mimic event dynamism. This endeavor produces an innate shift away from static conceptions of event causality towards murkier correlations and stands at odds with the fundamentally deterministic notions governing accident pathogenesis. The introduction of statistical variance extends beyond the intended confines of parametric threshold imposition and instills uncertainty within their position and permanence along the causal chain.
5.3. Guidelines for SME-ML Reconciliation
Addressing these shortcomings requires the incorporation of human feedback borne from a judicious appraisal of the context and physics underlying the events in consideration, and demands a symbiosis of ML analysis and SME judgement throughout event conceptualization and analysis. The dichotomy between functional and physical event definitions can be bridged through SME acquiescence to algorithmic bias and subsequent adoption of functional event conceptualization methods. On the one hand, such practices may be adopted either through the elimination of pre-defined thresholds governing event occurrence, or abstinence from the categorization of multiple sub-events under a single banner (such as unstabilized approach). On the other hand, algorithms may be modified to alleviate their proclivity for including tangential correlated factors. This may be done via exploration of ML algorithms that do not rely on decision tree assembling.
The incorporation of ML offers a novel opportunity for the empirically sound application of modern safety principles encompassing the areas of accident pathology and etiology. The adoption of classification algorithms in critical parameter and precursor identification initiates a transition towards prospective event analysis. However, the analytical nature of ML also diverges from existing notions of accident causation and system safety. Considered in tandem, these factors highlight the need for a circumspect approach in the reconciliation of algorithmic analysis with subject-matter expertise for the capitalization of the promise offered by the newfound abundance of data and the science surrounding it.

 ,
, 


