Abstract
The low Earth orbit (LEO) environment exposes spacecraft to factors that can degrade the dimensional stability of the structure. Carbon Fibre/Polyether Ether Ketone (CF/PEEK) can limit such degradations. However, there are limited in-orbit data on the performance of CF/PEEK. Usage of small satellite as material science research platform can address such limitations. This paper discusses the design of a material science experiment termed material mission (MM) onboard Ten-Koh satellite, which allows in situ measurements of coefficient of thermal expansion (CTE) for CF/PEEK samples in LEO. Results from ground tests before launch demonstrated the feasibility of the MM design. Analysis of in-orbit data indicated that the CTE values exhibit a non-linear temperature dependence, and there was no shift in CTE values after four months. The acquired in-orbit data was consistent with previous ground tests and in-orbit data. The MM experiment provides data to verify the ground test of CF/PEEK performance in LEO. MM also proved the potential of small satellite as a platform for conducting meaningful material science experiments.
1. Introduction
The Low Earth Orbit (LEO) environment exposes spacecraft to ultraviolet (UV) radiation, atomic oxygen (AO), vacuum and temperature variation. These factors can affect the dimensional stability of a spacecraft structure.
Dimensional stability is crucial for different spacecraft structures especially parts that deal with precision such as antenna, truss structure and optical support structure. For example, minute dimensional changes can result in a serious loss of signal for an antenna due to loss in pointing accuracy. Therefore, it is beneficial to utilize dimensionally stable material in manufacturing a spacecraft part. However, the high cost of launching payloads to space place a premium on spacecraft mass. Therefore, it is desirable to use a lightweight and dimensionally stable material for spacecraft structures. Composite materials such as polymer matrix composites (PMC) can suit the mentioned requirements partly due to high strength to weight ratio, high stiffness and low coefficient of thermal expansion (CTE) [1,2].
In the case of PMC, the main factors affecting the dimensional stability are moisture, thermal expansion, mechanical loading and microyielding [3]. Thermal expansion is caused by repeated thermal cycling due to the temperature variation when a satellite passes from direct sunlight into Earth shadow. Microyielding is caused by microcracking in the PMC. Repeated thermal cycling can induce microcracking [4]. These microdamage develops because of stresses caused by the fibre-matrix CTE mismatch, the CTE mismatch in properties along and transverse to the fibre direction and through the ply or lamina [5]. The microcracks can increase as the number of thermal cycles increased. Moreover, the properties of the fibre and matrix can affect the extent of microcracking. This process can lead to a progressive change in the CTE because thermal expansion is affected by microcracking behaviour [4,6,7].
Application of high-performance PMC in spacecraft structures is crucial to limit changes to dimensional stability. Carbon Fibre/Polyether Ether Ketone (CF/PEEK) composite is a high-performance PMC due to its inherent dimensionally stable properties. PEEK is a semi-crystalline thermoplastic polymer. The toughness of PEEK resin provides excellent resistance to microcracking induced by thermal cycling [4,8]. Previously, it was mentioned that microcrack develops due to internal stress caused by fibre-matrix CTE mismatch. In a thermoplastic composite such as CF/PEEK, internal stress is dissipated internally within the structure instead of through microcracking. Heat is generated due to the internal dissipation [4]. As a result, microcracking can be minimized and changes to CTE kept to a minimal level.
In a previous satellite project by Kyushu Institute of Technology (KIT), CF/PEEK was used as the primary material for the external structure of Shinen-2 deep space probe [9]. The structure survived the launch and space environment. However, more space data is required to further understand the behaviour of CF/PEEK including dimensional stability in space. Previous sources of CF/PEEK data mainly originated from ground test [4,10,11].
The lack of space performance data can be attributed to various factors. Firstly, there is limited access to space to launch satellites or experiments into orbit. The current launch options are initially as cargo to International Space Station (ISS), then deployment from the Japanese Experiment Module on ISS (KIBO), as a secondary payload on a rocket, launch in a cluster with other small satellites and as a primary payload on a dedicated small launch vehicle [12]. The ISS cargo and secondary payload placed a constraint on the type of orbit for the payload. Even though numerous companies are developing small launch vehicles, most of the developments may not reach maturity thus limiting access to space. Currently, Northrop Grumman Pegasus, Japan Aerospace Exploration Agency (JAXA) Epsilon and Rocket Lab Electron rocket are the only operational small launch vehicles [13,14]. Secondly, there are limited retrieval options to retrieve samples from orbit. The European Space Agency (ESA) Space Rider, Soyuz capsule and SpaceX Dragon capsule allow the option to retrieve samples from space but are expensive to operate and have limited flight frequency [15,16,17]. Thirdly, ground test offers a lower testing cost; however, the challenge of simulating actual space environment tends to decrease the accuracy of results [18,19].
The emerging small satellite market provides a promising solution to the lack of in-orbit data [20,21]. The small satellite provides an available platform for space experiments including material science experiments [22]. In particular, CubeSats are a promising orbital research platform due to low development cost and accessible to a wider group of participants [23]. The miniaturization of components such as lab-on-a-chip (LOC) and microelectromechanical systems (MEMS) allows the creation of smaller hardware that can fit into smaller satellites [15].
There is a variety of techniques to measure the dimensional stability of CF/PEEK. This paper focuses on measuring the thermal expansion factor. This paper will discuss the material science experiment termed as material mission (MM) and is one of several payloads onboard the Ten-Koh satellite shown in Figure 1. Ten-Koh satellite was developed by KIT and was successfully launched on 29 October 2018. Ten-Koh satellite orbits the Earth in a sun-synchronous sub-recurrent orbit at an altitude of approximately 600 km. The purpose of the MM is to perform in situ measurements of changes in the CTE of CF/PEEK composites samples in LEO. Strain gauges and temperature sensors were used to measure changes in strain and temperature for calculation of CTE. The experiment eliminates the need for sample retrieval by transmitting results to the ground station. This paper briefly introduces the system architecture of the MM design. Ground validation test and in-orbit data were also presented and compared. Discussions on the ground and in-orbit data are provided together with issues and improvements for MM.
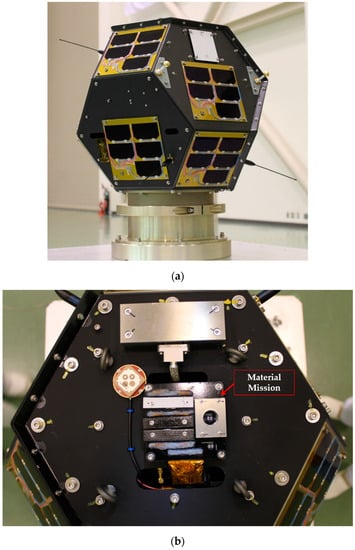
Figure 1.
Ten-Koh satellite configuration and location of material mission (MM). (a) Ten-Koh flight model (FM); (b) location of MM on top of Ten-Koh external structure.
2. Materials and Methods
2.1. Material Mission System Architecture
The MM consisted of two main components; the internal printed circuit board (PCB) and the external PCB. The external PCB contains the CF/PEEK samples, strain gauges and temperature sensors. The external PCB was installed on the top plate of the external satellite structure for maximum field of view as shown in Figure 1. The internal PCB contains the MM electronic circuit for operating the experiment. Figure 2 illustrates the internal and external PCB, respectively. Both PCB were in the upper section of the Ten-Koh satellite.
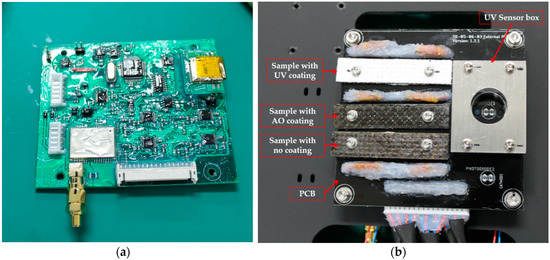
Figure 2.
MM main components. (a) Internal printed circuit board (PCB) contains MM electronic circuit; (b) external PCB contains the Carbon Fibre/Polyether Ether Ketone (CF/PEEK) samples, strain gauges and temperature sensors.
MM was designed to consider the following three constrains:
- The experiment should be able to survive launch conditions without being damaged.
- The experiment will not generate unintentional space debris.
- The limited development time due to the piggyback nature of this mission.
For the first reason, the samples and the experiment assembly can be destroyed and scattered due to the harsh launch environment leading to possible damage of the main satellite and other satellites in the rocket fairing. Therefore, usage of mechanical devices or moving parts to create strain on the samples may fail or cause damage during the launch environment. For the second reason, prolonged exposure to space can deteriorate the mechanical properties of the samples. The samples under due stress can be damaged or break apart leading to an increase in space debris. The second reason was the primary factor for omitting destructive tests such as tensile test. The reason is that the destruction of the samples can create space debris. Moreover, when the strain gauge is attached to the surface of the specimen using an adhesive, the adhesive may outgas in the vacuum environment. The adhesive and detached strain gauge can add to the existing space debris in LEO.
Due to the aforementioned constrains, a passive measurement system utilizing non-destructive test was preferred over an active system. Measurement of CTE due to thermal strain was selected because it requires only a passive measuring system. According to the thermal simulation results performed before launch, the temperature range of the external structure is estimated to be between 10 and 40 °C, which can provide sufficient change in thermal strain.
The dimensions of the external PCB measured 78 × 80 mm. Three CF/PEEK samples were bolted to the external PCB. Each sample consisted of two pieces of CF/PEEK thermally welded together using a heat press machine. The overall dimension of each sample was 50 mm long, 10 mm wide and 2 mm thick, as illustrated in Figure 3.
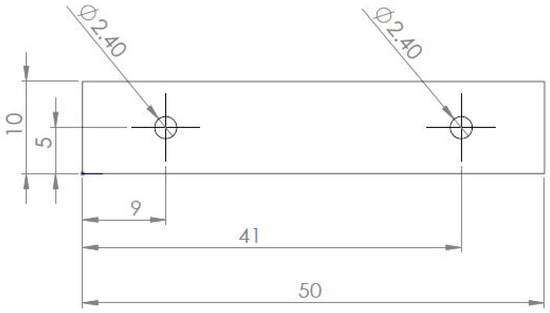
Figure 3.
Detail drawing of CF/PEEK samples measuring 50 mm long, 10 mm wide and 2 mm thick.
The CF was made from plain-woven carbon fabric manufactured by Toray with a 0/90° pattern. The PEEK resin was manufactured by Victrex (Lancashire, United Kingdom). The main reason for the plain-woven pattern was to maintain a quasi-isotropic property for the external structure and the ease of woven material to conform to the moulding tool with complex shape [24]. A protective coating was applied to two of the three samples as shown in Table 1. The purpose of the protective coating was to determine the changes in CTE due to different factors in space.

Table 1.
List of protective coating applied to MM CF/PEEK samples.
Each sample contains a single 0°/90° 2-element rosette stacked type strain gauge. Carbon Fibre Reinforced Thermoplastic (CFRTP) melts when heated above the melting temperature [25]. This unique feature allows a strain gauge to be attached between two pieces of CF/PEEK by thermal welding as shown in Figure 4. The rationale for thermally welding the strain gauge was to avoid accidental detachment of the strain gauge in orbit. Outgassing of the standard strain gauge adhesive can cause the strain gauge to become detached from the samples in orbit. Initially, a strain gauge was placed on one piece of CF/PEEK. Each element of the strain gauge was aligned to the fibre direction. Another piece of CF/PEEK was placed on the strain gauge and the first piece of CF/PEEK. Both pieces with the strain gauge in between were wrapped in aluminium tape and placed in a hot press machine (FT-10HP, Full Tech, Japan). The temperature was increased stepwise until a maximum of 400 °C. Moisture was removed from the sample by maintaining a constant temperature for approximately 30 min after each temperature increment. Pressure was not applied to the samples to avoid damaging the lead wire. Instead, the sample was placed on one hot press plate with the other plate located near and above the sample.
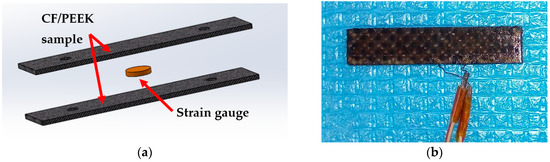
Figure 4.
Strain gauge assembly. (a) Exploded view of a MM sample with the strain gauge thermally welded between two pieces of CF/PEEK; (b) MM sample after completion of thermal welding process.
The measurement of sample temperature by attachment of thermocouple to sample is not viable due to the gradual outgassing of adhesive bonding in a vacuum environment. Therefore, MM applied a temperature measurement system that utilized heat conduction. The system is illustrated in Figure 5. Temperature measurement for each sample was measured using an AD590 temperature sensor (AD590, Analog Devices, Norwood, MA, USA) attached underneath the external PCB but below each sample. The AD590 sensor is capable of recording temperatures between −55 and 150 °C with an error range of ±1 °C. Heat was conducted via conduction from the surface of the sample through a hole filled with thermal grease and α-gel to the temperature sensor.

Figure 5.
Cutaway of MM sample and temperature measurement system. The strain gauge is thermally welded between two CF/PEEK samples. Temperature is measured using a temperature sensor via heat conduction from the surface of the sample through a hole filled with thermal grease and α-gel.
2.1.1. Electrical Design
The MM was developed to measure the CTE of CF/PEEK. CTE is the change in length or volume of a material as a function of temperature rise. The calculation of CTE is based on Equation (1) [1].
where α is CTE (ppm/°C), L is length (m), L0 is initial length (m), T is temperature (°C), T0 is initial temperature (°C), ∆L is change in length (m) and ∆T is change in temperature (°C). The values of CTE are not always constant. Therefore, the CTE is expressed as an average value in a certain temperature range [1].
The MM has two main sensors to calculate CTE; strain gauge and temperature sensor. Each sample has one strain gauge and a temperature sensor attached to it, as shown in Figure 5.
2.1.2. Strain Gauge
Strain is the deformation of a material due to a force or a set of forces resulting in a change in length as shown in Equation (2) [26]. In the context of MM, strain is the change in length of the CF/PEEK sample due to temperature. A strain gauge detects this strain as electrical signals. Strain gauge electrical resistance changes with deformation. When a strain gauge is bonded to a material, the deformation of the material changes the electrical resistance of the strain gauge. The change in strain is small and is measured in microstrain (με). The relation between strain and change in resistance is shown in Equation (3) [26].
where ε is strain (μm/m), L is the initial length (m) and ∆L is the elongation.
where R is resistance (Ω), ∆R is change in resistance (Ω), Ks is gauge factor and ε is strain (μm/m). Gauge factor is the strain gauge sensitivity. A Wheatstone bridge circuit is commonly used to convert minute change in resistance to voltage change (∆V) or output voltage (e0). MM utilized a quarter bridge type of the Wheatstone bridge circuit. The e0 was calculated using Equation (4) [26].
where e0 is output voltage (V), E is bridge excitation voltage or input voltage (V), R is resistance (Ω), ∆R is change in resistance (Ω), KS is gauge factor and ε is strain (μm/m). Based on Equation (4) strain is proportional to the output voltage.
In the LEO environment, the temperature outside of Ten-Koh regularly changes between hot and cold due to the orbital movement around Earth. The apparent strain was generated by the strain gauge bonded to the CF/PEEK sample due to the varying temperatures. The formula for the apparent strain is shown in Equation (5) [26]. The sources of the apparent strains are listed below:
- CTE mismatch between resistance element and measure material.
- Change in resistance of gauge with temperature or resistivity of strain gauge grid.
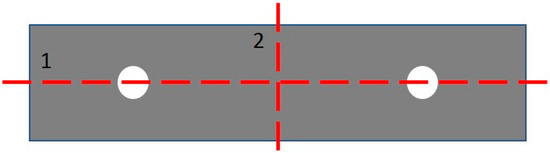
Figure 6.
Alternative apparent strain removal method applied by MM. The difference between strain measurement in direction 1 and 2 can offset the amount of apparent strain included in both directions.
The block diagram for the strain gauge circuit is shown in Figure 7. The ADR4520 voltage regulator (Analog Devices, Norwood, MA, USA) was used to convert the 5 V power supply from battery to 2 V input voltage for the strain gauge. The low noise (0.1 Hz to 10 Hz) and wide operating temperature (−40 to 125 °C) were the reasons for selecting ADR4520. The LM358-N (Texas Instruments, Dallas, TX, USA) operational amplifier was used to provide high input impedance. The reason for the high input impedance was to minimize the drop in the voltage input. The LM358-N was selected due to its proven flight heritage in the Shinen-2 project. An IRLML6244 MOSFET (Infineon Technologies, Neubiberg, Germany) was used to provide a switching circuit. The varying temperature in LEO can also affect the resistance of the lead wire. The 3-lead wire strain gauge was selected for self-temperature compensation. The minute change in resistance was converted by the Wheatstone quarter bridge to voltage change, ∆e0. The ADS1220 (Texas Instruments, Dallas, TX, USA), a 24-bit analogue-to-digital converter (ADC) was used to amplify the value of ∆e0 which was in the μV range. Each of the 2-element strain gauges was connected to two ADC with one ADC for each gauge element.
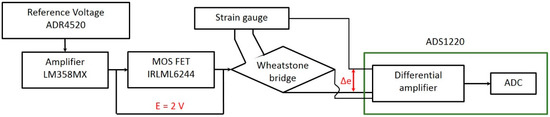
Figure 7.
Strain gauge circuit block diagram.
2.2. Mission Operations
The general process flow for MM starts when the ground station transmits a command to the internal PCB via onboard computer (OBC) to read temperature and strain measurements. Data is then transmitted to the ground station. A decoder program developed using C language converts the data packets into strain, temperature and CTE values. Figure 8 illustrates the overall MM mission operations process flow. The user can set the number of measurements or packet number for each operation session. One packet of data has a size of 60 bytes. The usage of amateur radio with limited bandwidth for communication between the ground station and satellite limits the amount of MM data that can be downloaded in one pass. Moreover, Ten-Koh has other payloads that generate data. This also contributes to limit the amount of MM data that can be transmitted to the ground station. As a result, MM operations were limited to real-time measurements when Ten-Koh passes over the KIT ground station.
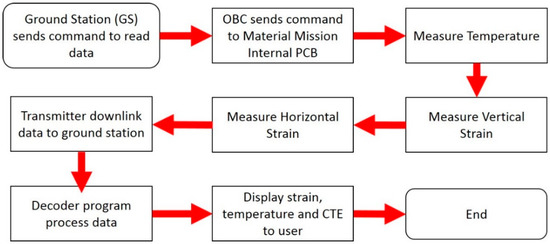
Figure 8.
Overview of MM mission operations process flow.
2.3. Ultraviolet Sensor
Originally, there were two UV sensors, one sensor can detect all UV wavelengths and the other one can detect only UV-C. UV filters were proposed for filtering out UV-A and UV-B, thus allowing the UV sensor to focus on measuring UV-C radiation. However, the UV sensors were excluded from the FM due to a flight qualification problem. Further discussion on the UV sensors will be covered in the discussion section.
2.4. Ground Validation Test
A ground validation test was performed to determine the effectiveness of MM measurement system. The test was carried out in a thermal vacuum chamber (TVAC) in KIT. The TVAC can produce vacuum conditions up to 1.0 × 10⁻⁵ Pa. The purpose of the test is listed as follows:
- To determine the effectiveness of the temperature measurement method using the AD590 temperature sensor.
- To determine the effectiveness of the CTE measurement system.
The surface temperature of the sample recorded by thermocouple was compared with those measured by the temperature sensors. The CTE measurement by the MM circuit was compared with CTE data obtained using a TM-7000 (Advance Riko, Yokohama, Japan) Thermomechanical Analyzer (TMA) provided by Agne Technology Center Company, Tokyo, Japan. Identical external PCB, internal PCB and CF/PEEK samples designed for the FM model were used for the ground test. The number of samples was three which was the same with the FM model. Thermocouples were attached to the sample and temperature sensors for comparison purposes. Polyimide heaters were attached to the heater frame made of aluminium to allow uniform distribution of heat to the samples. Heat was indirectly distributed to the samples via radiation from the aluminium frame. Black paint was also applied to the aluminium frame to increase the amount of radiated heat. The test setup is illustrated in Figure 9.
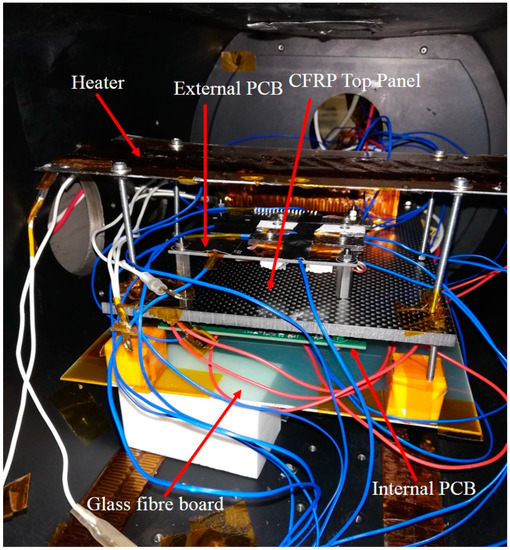
Figure 9.
Full system test setup. Identical external and internal MM PCB to flight model were used for the test. Polyimide heaters attached to aluminium frame were used as a heat source.
The pressure in the TVAC was set to below 1.3 × 10⁻³ Pa. The range of temperature change was between −40 and 22 °C. This temperature range was selected based on recorded temperature obtained from space. The test was carried out in two scenarios. The first was to cool down the test chamber from a room temperature of 22 to −40 °C at a cooling rate of −0.5 °C/min. In the second scenario, the test chamber temperature was increased from −40 to 22 °C at a rate of 1 °C/min.
3. Results
The function of MM was to perform in situ measurement of CTE of CF/PEEK samples in LEO. Ground validation test was performed to validate the design of MM. In-orbit data validated the feasibility of MM to provide in-orbit measurement of CTE in LEO. MM used strain gauges and temperature sensors to measure strain and temperature for calculating CTE. CTE is the change in length of material as a function of temperature rise or fall. CTE is calculated based on Equation (1).
3.1. Ground Validation Test Results
Table 2 lists the maximum, minimum and median values for the difference between temperature measured by temperature sensor and thermocouple in each phase for each sample. Sample 1 refers to the sample with no protective coating; sample 2 refers to the sample with UV protective coating, and sample 3 refers to the sample with AO protective coating. Median was included to provide an accurate assessment of the difference. In the case of sample 3, the median difference was within ±1 °C. This was within the measurement error range for AD590 which is ±1 °C as stated in the datasheet [28]. Sample 1 showed the same median deviation range except during the increasing phase. However, for sample 2, the median deviation range is up to 2.67 °C during the increasing phase. The MM temperature measurement method used an indirect method to measure heat. Therefore, there was additional heat input from the external PCB that has a minor effect on the temperature readings. In terms of the overall trend, there is no adverse difference between the temperatures recorded by thermocouples and temperature sensors. The MM temperature measurement method is feasible based on the obtained results.
Table 2.
Maximum, minimum and median value for the difference between temperature measured by temperature sensor and thermocouple in each phase for each sample.
The overall results from the ground test are shown in Figure 10. For each data point, the median values of strain and temperature range were used for calculation of CTE. Figure 10 showed that the value of CTE varied with increasing temperature. This was consistent with results from previous studies [4,8,29,30]. Sample 2 had the highest range of CTE compared to sample 1 and 3. CTE varied between 2.98 and 3.99 ppm/°C for sample 1 and between 2.93 and 3.23 ppm/°C for sample 2 for temperature up to 10 °C. However, after 10 °C there was a big increase in CTE value up to a maximum of 8.37 ppm/°C and 9.95 ppm/°C for samples 1 and 2, respectively. For sample 3, CTE remained stable until 17 °C before increasing to 4.15 ppm/°C. The difference in CTE values between all samples was due to misalignment between strain gauge elements and the sample fibre direction. A comparison was performed between the median TMA value of 3.11 ppm/°C and all the samples. Sample 1 had the smallest difference between median CTE value and the TMA value, which was 0.14 ppm/°C. Sample 2 had the largest difference between median CTE value and the TMA value which was 0.74 ppm/°C. Overall, the measurement error range between the median TMA value and sample values was approximately within the range of ±1.00 ppm/°C. The minimal error can be considered within measurement tolerance. The MM CTE measurement system was proven to be feasible based on the given results.
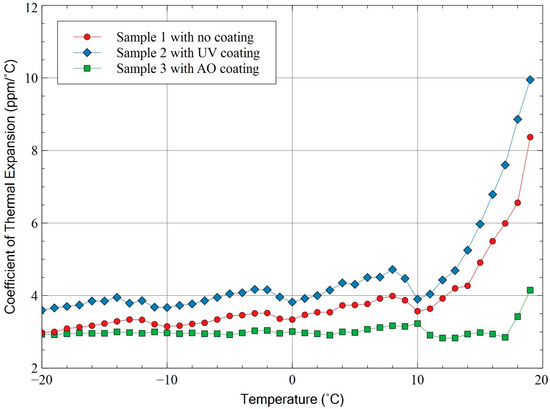
Figure 10.
The overall result from the full system test. The CTE values for samples 1, 2 and 3 were compared with reference CTE data measured using Thermomechanical Analyzer (TMA).
3.2. In-Orbit Results
MM operations were performed from 9 November 2018 to 19 March 2019. A total of 101 measurements were performed during the mentioned period. The subsequent sections discussed the results based on the collected measurements.
3.2.1. Temperature Measurement
Figure 11 illustrates the variation of temperature against time. The temperature varied approximately between −40 and 20 °C for each orbit. This was within the temperature sensor measurement range of −55 and 150 °C [28]. All samples displayed approximately similar temperature readings. MM sessions operated during different times for each session. This explains the difference in temperature reading for each session as shown in Figure 11. Temperatures were generally positive during daylight pass and negative during night-time pass. Occasionally, the temperature was negative during daylight pass, which was due to MM external PCB facing away from sunlight.
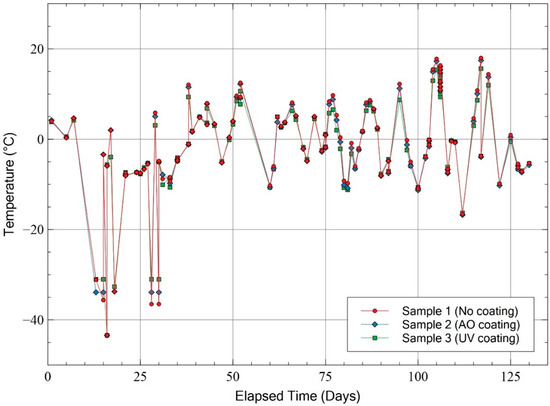
Figure 11.
Variation of temperature measurement for each sample against time. The temperature varied between −40 and 20 °C in orbit.
A comparison was performed with measured temperature value from temperature sensors on six solar panels nearest to the MM. Each solar panel has a temperature sensor like the one used for MM. The location of six solar panels near MM is shown in Figure 12. The purpose of the comparison was to validate the MM temperature sensor reading. The measured temperature from MM was within the range of the upper and lower limit from the solar panels, which was 50 and −45 °C, respectively. It should be noted there were minor variations between MM temperature sensor and solar panels. The temperature sensor of a solar panel was attached to aluminium. The thermal conductivity of aluminium is higher compared to CF/PEEK which contributed to the variation. Based on measured data and comparison with solar panels, the MM temperature sensor provided a feasible method to measure temperature.
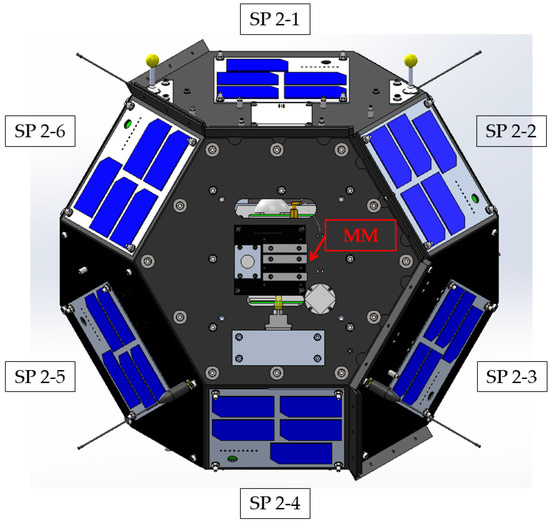
Figure 12.
Location of six solar panels (SP) near to MM.
3.2.2. CTE Measurement
The changes in CTE against temperature for samples 1, 2 and 3 are shown in Figure 13. Sample 1 refers to the sample without a protective coating; sample 2 refers to the sample with AO protective coating, and sample 3 refers to the sample with UV protective coating. The CTE showed a non-linear temperature dependence, which was consistent with results from previous studies [4,8,29,30]. Each data point represents the median CTE value calculated based on a range of temperature and strain measurement during a mission operation session. Moreover, each data point represented measurement from different date or different time within the same day. Each operation session has a varying degree of heating or cooling rate due to the absence of an active attitude control system (AACS) in Ten-Koh. The variation in heating or cooling rate resulted in the scattered CTE values [31,32]. Further discussion on the effect of variation in heating or cooling rate on the CTE values will be provided in the subsequent section. The curves for each sample consisted of scattered data points but follow a consistent upward trend. A bisquare method was used to fit a second-order polynomial curve due to the degree of distribution. The curve fit expressions for each curve were provided in the caption of Figure 13. Figure 13 also showed a high concentration of CTE values between −10 and 10 °C. Limited satellite pass time, communication bandwidth and operation time due to other onboard experiments placed a constraint on material mission operation duration. Therefore, the average number of measurement sessions was approximately one operation per day, which limits the potential to measure CTE values at a wider range of temperatures. Comparison of CTE between samples shows a varying CTE curve. Sample 3 had the highest CTE values followed by sample 1 and 2. The difference in CTE values between all samples was due to a slight strain gauge misalignment with respect to the fibre direction. The strain gauge misalignment will be further discussed in the subsequent section. Table 3 shows the average change in CTE per °C. Between −10 and 10 °C, all sample curves showed a gradual variation in CTE with temperature between 0.064 and 0.094 CTE/°C. However, the variation in CTE sharply increased after 10 °C with a maximum value of 1.018 CTE/°C for sample 2.
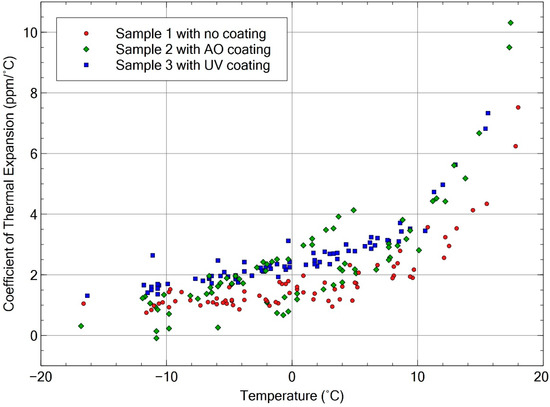
Figure 13.
Comparison of CTE measurements between samples 1, 2 and 3. Curve fit for sample 1: , curve fit for sample 2: and curve fit for sample 3: .
Table 3.
Average change in CTE with increasing temperature.
In terms of long-duration observation, there was no shift in CTE values for up to 4 months or 120 days as shown in Figure 14. The CTE variation remains reasonably similar up to 120 days. There was no upward or downward shift in the CTE curve. The result is in line with previous studies from the National Aeronautics and Space Administration (NASA) Long Duration Exposure Facility (LDEF) mission involving CF/Epoxy samples [33]. However, there were no additional in-orbit data after 4.5 months due to a loss of communication between Ten-Koh and KIT ground station on 19 March 2019. The likely reason for Ten-Koh failure was due to radiation damage triggered by a single event effect [34]. Currently, recovery operations are still trying to recover normal Ten-Koh functions. Nevertheless, these results provide compelling evidence that the MM experiment can provide reasonably accurate CTE values in LEO for CF/PEEK samples.
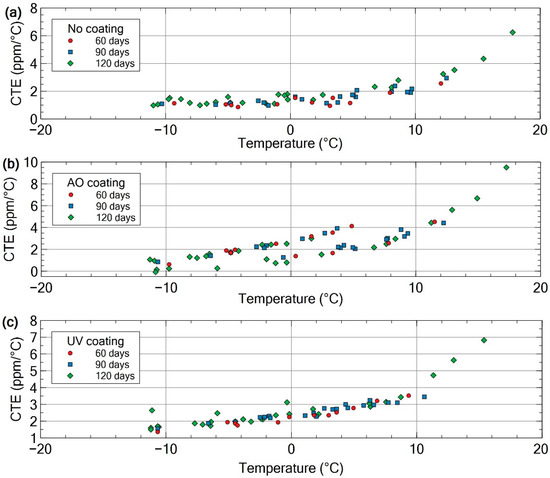
Figure 14.
Monthly CTE measurement. (a) Sample with no coating; (b) sample with atomic oxygen (AO) coating; (c) sample with ultraviolet (UV) coating.
4. Discussion
In this study, the development and operations of MM were presented. A ground test was performed to validate the design of MM. In-orbit data were presented to illustrate the feasibility of MM to provide in situ measurement of CTE in LEO. The full system test proved the feasibility of the MM CTE measurement system including the strain gauge circuit and temperature measurement method.
In-orbit temperature data was comparable with temperature data from nearby solar panels. CTE variation with temperature was consistent with results from previous studies. Based on Figure 13, the plot shows an upward curve pattern. In a CF/PEEK composite, the CF has a lower CTE compared to PEEK or the matrix [8]. Based on Figure 13, all samples exhibit a similar upward curve. At temperature below 10 °C, CTE is lower and almost constant compared to above 10 °C. At lower temperature, the shrinking matrix is constrained by the fibres. Thus, fibres are dominant in lower temperature. As the temperature rises above 0 °C, the CTE values begin to increase in a non-linear pattern. From this, it might be inferred that the matrix is gradually more dominant in affecting the CTE values of CF/PEEK.
Figure 13 showed scattered CTE points but with a consistent upward curve. As mentioned in Section 3.2.2, the difference in heating and cooling rate in LEO affected the change in CTE. This resulted in the scattered points for CTE values. The effect of the variable heating and cooling rate on CTE had been shown in previous studies [31,32]. In the case of Ten-Koh, the variation in the heating and cooling rates was due to the absence of an AACS and few other variables listed below:
- Phases of Ten-Koh’s orbit, e.g., in the eclipse or the sunlit phase.
- The orientation of MM external PCB with respect to the sun.
- Ten-Koh’s rate of rotation.
- Ten-Koh’s direction of rotation.
The above variables affected the heating and cooling rate of MM samples through the amount of change in temperature and time. Figure 15 showed the variation in heating and cooling rate for the sample with UV coating between December 2018 and March 2019. The heating rate varied between 0.39 and 3.24 °C/minute while the cooling rate varied between −0.20 and −1.60 °C/minute. The cooling phase occurred mainly during Ten-Koh’s late-night passes over KIT ground station when Ten-Koh was in Earth’s shadow. The heating phase occurred during afternoon passes when Ten-Koh was in the sunlit phase in orbit.
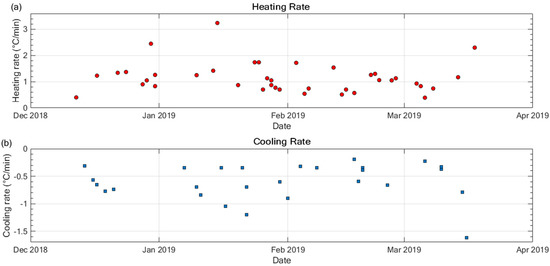
Figure 15.
Heating and cooling rates for MM samples between December 2018 and March 2019. (a) Heating rate; (b) cooling rate.
Further analysis was performed to compare results from the ground validation test and in-orbit data. Figure 16 showed a comparison between ground validation test and in-orbit data. All plots in Figure 16 showed minor changes or near stable CTE values between −10 to 10 °C for both ground and in-orbit data. The change in CTE increased sharply after 10 °C for ground and in-orbit data except for sample with AO coating. This sample showed increased CTE at a later temperature. Table 4 shows the average change in CTE with temperature for ground and in-orbit data. However, based on Table 4, there was difference in CTE value especially in the region below 10 °C for the sample with no coating and sample with UV coating.
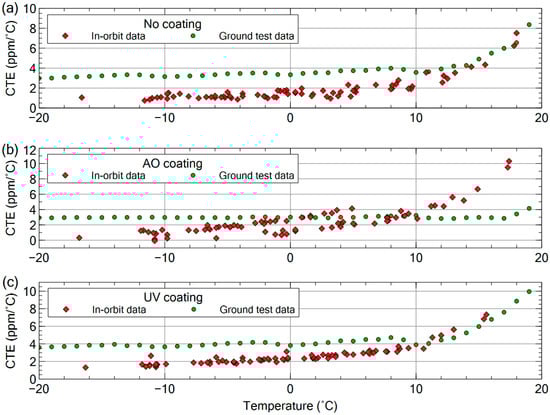
Figure 16.
Comparison of CTE values between ground validation test data and in-orbit data for all MM samples. (a) Sample with no coating; (b) sample with AO coating; (c) sample with UV coating.
Table 4.
Comparison of the average change in CTE with temperature for ground and in-orbit data.
Table 5 showed the difference in CTE between ground and in-orbit data for all MM samples. The sample with no coating had the largest CTE difference while the sample with AO coating had the smallest CTE difference for temperatures below 10 °C. In the temperature range above 10 °C, the sample with AO coating had the largest CTE difference while other samples showed nearly similar CTE values between ground and in-orbit data.
Table 5.
Comparison of the difference in CTE between ground and in-orbit data.
The difference in heating and cooling rate between ground test conditions and LEO environment caused the difference in the average change in CTE with temperature. The heating and cooling rates for the ground validation test were 1.0 °C/minute and −0.5 °C/minute, respectively. The ground validation test was performed in a single day with the same heating and cooling rate. The ground validation test was focused on testing the feasibility of the MM measurement system. The test did not accurately simulate the actual conditions in the LEO environment and the absence of an AACS in Ten-Koh. This includes the variation in heating and cooling rate in-orbit.
The difference in CTE as shown in Table 5 between ground test and in-orbit data was caused by the misalignment of strain gauge with respect to the fibre direction of a MM sample. The strain gauge misalignment also caused the minor difference in CTE between MM samples in-orbit as shown in Figure 13. A strain gauge misalignment test was performed to compare the CTE values for different offset positions of the strain gauge with respect to the fibre direction. As a result, the change in CTE with temperature varied between ground test and in-orbit data.
Strain measurements from three identical CF/PEEK samples were compared using a hot press machine (FT-10HP, Full Tech, Japan). The CF/PEEK samples have similar material properties but different dimensions compared to the samples flown to orbit. The sample dimension was 50 mm long, 10 mm wide and 1 mm thick. A strain gauge was attached to each sample using adhesive to provide strain measurements. Each strain gauge is a single 0°/90° 2-element rosette stacked type strain gauge. There were three test scenarios with each scenario representing a different orientation of the strain gauge with respect to the fibre direction. The strain gauge orientation for each scenario is shown in Figure 17. The rationale behind the differing orientation was to observe changes in CTE variation with different offset positions. A thermocouple was attached to the top of each sample for temperature measurement. Figure 18 shows the test assembly for the offset test. In each scenario, samples were placed on the lower part and enclosed with a 5 mm-thick metal jig to maintain a constant heat on the sample from the heat press. The thermocouple was connected to a data logger, and the strain gauge was connected to a dynamic strainmeter to record data during the test. Test temperature was varied between 30 and 50 °C to stimulate expansion to the CF/PEEK sample. The heating rate was approximately 1 °C/min.
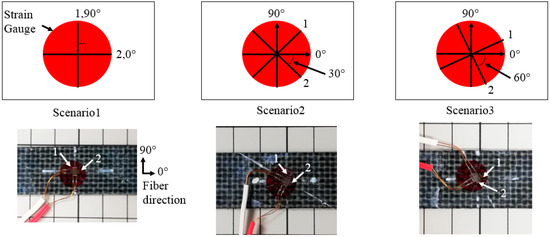
Figure 17.
Strain gauge orientation with respect to fibre direction for three different scenarios.
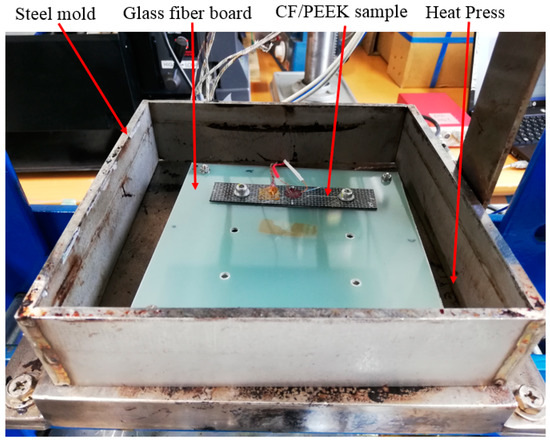
Figure 18.
Test assembly for strain gauge offset test.
Figure 19 showed changes in CTE due to variation in the orientation of the strain gauge with respect to the fibre direction. In the first scenario, the strain gauge was aligned to the 90° and 0° fibre direction. This scenario was the reference for CTE comparison. Figure 19a showed the CTE for strain gauge element 1 aligned to 90° fibre direction. Figure 19b showed the CTE readings for strain gauge element 2 initially aligned to 0° fibre direction. The direction of the shift in CTE was shown by the dotted red arrow in Figure 19a,b. In Figure 19a, scenario 3 exhibited the largest shift in CTE to negative. Moreover, the shift in CTE towards negative increased as the angle between element 1 and 90° fibre direction increased from 0° to 60°. The same pattern was shown in Figure 19b for the angle between element 2 and 0° fibre direction albeit in a lower shift increment. It is observed that the same pattern appeared in the in-orbit data shown in Figure 13 with different CTE for each sample and in Figure 16 for CTE comparison between ground and in-orbit data. Therefore, misalignment of strain gauge with respect to fibre direction caused the difference in CTE for different MM samples and comparison between ground and in-orbit data.
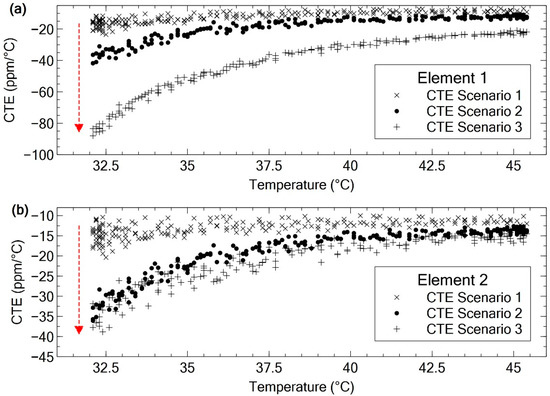
Figure 19.
Changes in CTE due to various offset positions. (a) Changes in CTE for element 1 of strain gauge; (b) Changes in CTE for element 2 of strain gauge.
There was no shift in CTE values for up to four months as shown in Figure 14. The result is in line with previous studies. However, in-orbit data was limited to four and a half months due to loss of data reception from Ten-Koh. A previous study showed that 100 thermal cycles from −160 to +120 °C produced a minor change in CTE of CF/PEEK composites, the main reason being the tough property of PEEK matrix [4]. Previously in 1984, NASA conducted the LDEF mission. Several materials were exposed to the LEO environment including CF/Epoxy samples. After 371 days in space, there was no substantial degradation in CTE value compared to pre-launch CTE values [33]. Selected results are shown in Table 6 below. As mentioned in the Introduction, microcracking induced by thermal cycling can affect CTE [4,6,7]. Thermal cycle can be considered as low-cycle thermal fatigue [5]. In a thermoset composite such as CF/Epoxy, internal stress due to fatigue causes internal cracks. However, the internal stress is absorbed by the internal structure of CF/PEEK instead of cracking [4]. Therefore, it is predicted that the change in CTE for CF/PEEK will be almost like CF/Epoxy samples.
Table 6.
A partial list of CTE data obtained from the Long Duration Exposure Facility (LDEF) experiment for CF/Epoxy samples [33].
In the case of Ten-Koh satellite, the number of cycles can be up to 5290 for a year based on an orbital period of approximately 98 min. For comparison with previous studies, 100 thermal cycles are equivalent to approximately 7 days of mission duration of Ten-Koh. Table 7 list down the number of cycles for different mission duration of Ten-Koh. The variation in CTE values with temperature remains similar between the first month and after four months as shown in Figure 14. These findings supported previous ground tests and in-orbit data showing that the CTE value for CF/PEEK remains invariant up to one year.
Table 7.
The number of thermal cycles for different mission durations of Ten-Koh.
There have been material science experiments performed onboard small satellites. To our knowledge, MM is the first material science experiment that studies the effect of the space environment on the dimensional stability of composites using small satellites. Moreover, MM performs in situ measurements and transmits data to the ground station. The NASA LDEF studied the effect of the space environment on the dimensional stability of composites. However, the experiment could not transmit data in real-time nor was it performed on a small satellite [35].
The MM previous results showed that in situ observation in small form factor coupled with real-time data transmission for a material science experiment is feasible using a small satellite platform. Moreover, the use of commercial off the shelf components (COTS) for MM provides a viable low-cost option for researches interested in performing in-orbit material science experiments.
Furthermore, the strain gauge attachment method has possible applications for structural health monitoring of space structures. The fusion welding or thermal welding of strain gauge provides a solution to the limitations of adhesive outgassing in a standard strain gauge attachment method. The primary influence of thermal cycling is to induce microcracking. The thermal cycling can be considered as a low amplitude thermal fatigue resulting in microcracking changing with time [5]. The measurement methodology used in MM can be applied to monitor possible evidence of microdamage in space structures.
4.1. Issues
4.1.1. Loss of Communication with Ten-Koh
There was no additional in-orbit data after 4.5 months due to a loss of communication between Ten-Koh and the KIT ground station on 19 March 2019. The last data from the MM was received on 18 March 2019 between 15:15:43 and 15:16:24 Coordinated Universal Time (UTC). The last decoded data indicated that the experiment was functioning within normal parameters. An earlier investigation revealed that the Ten-Koh failure was likely due to radiation damage triggered by a single event effect. Ten-Koh travelled twice over the South Atlantic anomaly region before a loss of signal on 19 March 2019. Moreover, there was significant geomagnetic activity on 17 March 2019. The earlier investigation explained that the geomagnetic activity had likely caused a disturbance in the trapped radiation over the South Atlantic anomaly region. This, in turn, caused a single event effect that may have caused Ten-Koh failure [34]. On 14 May 2019, Ten-Koh briefly re-established limited communication. However, further material mission data and other onboard experiments data were not received. On 4 September 2019, communication was again loss between Ten-Koh and ground station. Currently, mission operations are still performed in the possible event that Ten-Koh re-establishes communication.
4.1.2. UV Sensor
Initially, two UV sensors were to be installed on the external PCB. The purpose of the UV sensors was to measure UV intensity and to compare with readings from the ISS since Ten-Koh is orbiting at a different altitude.
One sensor that can only detect UV-C will be enclosed in the aluminium box and another sensor that can detect all UV wavelengths will be located adjacent to the box. Figure 2 showed the location of both UV sensors. The window of the aluminium box was planned to be composed of two UV filters. The filters function to filter out UV-A and UV-B, thus allowing the enclosed UV sensor to focus on measuring UV-C radiation. The UV-C wavelength in LEO is between 200 nm and 280 nm with a mean energy of 122.6 Kcal/mole or 4.4 eV. UV-C has sufficient energy to break several chemical bonds thus causing potential sample degradation [36]. This was the reason for applying UV filters for one of the UV sensors.
By being selected as a secondary payload, the delivery time was primarily dependent on the primary payload. The satellite had to be flight-qualified within a constrained schedule. This limits the development time and reduces further tests during assembly and integration. Unfortunately, a crack was observed on the UV filter during a shock test of the whole of Ten-Koh structure. As a result, the mechanical design for securing the UV filter was not qualified for flight. Changes to the mechanical design were not feasible due to the fixed delivery time. Due to possible hazard posed to other payloads in the event of a broken filter, both UV sensors were excluded from the flight model.
4.2. Future Work
Ground test can assist in validating in-orbit data and provide a better understanding of CTE degradation in LEO. Previously discussed ground tests were limited to validating the concept of the MM and for flight qualification of the MM components. The next step will be to conduct further ground tests to expose the CF/PEEK samples to a different number of thermal cycles, fluence levels of atomic oxygen, UV intensities and different sample heating and cooling rates. This will provide a correlation between in-orbit data and ground data for a complete understanding of CTE degradation in LEO. Conducting ground tests at different sample heating and cooling rates can further confirm the effect of variable heating or cooling rate on CTE rate of change. This can act as guidance to consider the effect of heating or cooling rate on CTE for future design of ground tests and LEO missions.
In the current MM architecture, an 8-bit microcontroller was used on the internal PCB to handle the strain, temperature, UV intensity measurement and Global Navigation Satellite System (GNSS) operations. The mentioned operations were the limit for the 8-bit microcontroller onboard flash memory. Raw data for strain and temperature in hexadecimal are transmitted to the ground station for calculation of CTE using a separate decoder. Each strain measurement is up to 8 decimal places. The current capability is sufficient to meet the mission requirement for MM. However, the capability to perform onboard calculation of CTE will promote better efficiency in mission operations. Future work can explore the replacement of the current 8-bit microcontroller with a 16-bit microcontroller. The higher performance microcontroller allows onboard CTE calculation in addition to handling other payload operations.
5. Conclusions
The LEO environment exposes spacecraft to factors that can degrade the dimensional stability of the structure. The advent of high-performance CF/PEEK may limit changes in dimensional stability. However, there are limited in-orbit data on the performance of CF/PEEK. Factors contributing to the limitations include limited access to space, limited sample retrieval options and difficulty in simulating actual space environment for ground test. The emerging small satellite market provides a promising material science research platform to address the mentioned limitations. In this paper, the Ten-Koh satellite included a material science experiment termed MM. This experiment could perform in situ measurements of CTE for CF/PEEK samples in LEO. Strain gauges and temperature sensors were used to provide strain and temperature measurements. The data could then be transmitted to the ground station for calculation of CTE.
A ground validation test was performed to validate the design of MM. Analysis of the ground test data has shown the feasibility of the MM CTE measurement system. In terms of in-orbit data, the acquired temperature data were within the measurement range of the solar panel temperature sensors. The CTE data exhibit a non-linear temperature dependence and varies between each sample. Strain gauge misalignment has been identified as the reason for the marginal difference between each sample. Comparison of in-orbit data with ground test revealed minor differences in CTE value over a range of temperatures. This was due to difference in the sample heating and cooling rate and strain gauge misalignment with respect to the fibre direction. Analysis of CTE data over four months was performed before a loss of communication with Ten-Koh after four and a half months. Over four months, there was no upward or downward shift in CTE values. The acquired in-orbit data was shown to be consistent with previous ground tests and in-orbit data from NASA LDEF mission.
The MM experiment has demonstrated the ability to fill in the gaps between available ground test and in-orbit data regarding CF/PEEK dimensional stability performance in LEO. Moreover, MM proved the potential of a small satellite as a platform for conducting meaningful material science experiments.
Author Contributions
Conceptualization, F.A., I.F. and N.U.; methodology, F.A., I.F. and N.U.; validation, F.A., I.F. and N.U.; formal analysis, F.A. and N.U.; investigation, F.A. and N.U.; resources, F.A., I.F., N.U. and K.-i.O.; data curation, F.A. and N.U.; writing—original draft preparation, F.A.; writing—review and editing, F.A. and K.-i.O.; visualization, F.A.; supervision, K.-i.O.; project administration, K.-i.O.; and funding acquisition, K.-i.O. All authors have read and agreed to the published version of the manuscript.
Funding
This research was partially funded by the Oita Prefectural Government, Oita Prefectural Organization for Industry Creation and the working group for Ten-Koh development “Oita Challenger”.
Acknowledgments
This study cannot be completed without the effort and co-operation from the Ten-Koh team.
Conflicts of Interest
The authors declare no conflict of interest. The funders had no role in the design of the study; in the collection, analyses, or interpretation of data; in the writing of the manuscript; or in the decision to publish the results.
Abbreviations
The following abbreviations were used in this manuscript:
| AACS | Active Attitude Control System |
| ADC | Analogue-to-Digital Converter |
| AO | Atomic Oxygen |
| CF | Carbon Fibre |
| CFRTP | Carbon Fibre Reinforced Thermoplastic |
| COTS | Commercial Off the Shelf Components |
| CTE | Coefficient of Thermal Expansion |
| ESA | European Space Agency |
| FM | Flight Model |
| GNSS | Global Navigation Satellite System |
| ISS | International Space Station |
| JAXA | Japan Aerospace Exploration Agency |
| KIBO | Japanese Experiment Module on ISS |
| KIT | Kyushu Institute of Technology |
| LDEF | Long Duration Exposure Facility |
| LEO | Low Earth Orbit |
| LOC | Lab-on-a-Chip |
| MEMS | Microelectromechanical Systems |
| MM | Material Mission |
| NASA | National Aeronautics and Space Administration |
| OBC | Onboard Computer |
| PAN | Polyacrylonitrile |
| PCB | Printed Circuit Board |
| PEEK | Polyether Ether Ketone |
| PMC | Polymer Matrix Composite |
| SP | Solar panel |
| TMA | Thermomechanical Analyzer |
| TVAC | Thermal Vacuum Chamber |
| UTC | Coordinated Universal Time |
| UV | Ultraviolet |
References
- Wolff, E.G. Environmental Effects- Temperature. In Introduction to the Dimensional Stability of Composite Materials; DEStech Publicaitons, Incorporated: Lancaster, PA, USA, 2004; pp. 107–144. ISBN 978-1-932078-22-0. [Google Scholar]
- Zhengchun, D.; Mengrui, Z.; Zhiguo, W.; Jianguo, Y. Design and application of composite platform with extreme low thermal deformation for satellite. Compos. Struct. 2016, 152, 693–703. [Google Scholar] [CrossRef]
- Bowles, D.E.; Tenney, D.R. Thermal Expansion of Composites Methods and Results. In Large Space Systems Technology 1980; NASA Conference Publication; NASA, Scientific and Technical Information Office: Hampton, VA, USA, 1980; Volume 1, p. 10. [Google Scholar]
- Cogswell, F.N. Thermoplastic Aromatic Polymer Composites; Cogswell, F.N., Ed.; Butterworth-Heinemann: Oxford, UK, 1992; ISBN 978-0-7506-1086-5. [Google Scholar]
- Unigovski, Y.B.; Grinberg, A.; Gutman, E.M.; Shneck, R. Low-cycle Fatigue of Thermally-Cycled Carbon-Epoxy Composite. Mater. Sci. 2012, 22, 21–30. [Google Scholar]
- Kim, R. Dimensional stability of composite in a space thermal environment. Compos. Sci. Technol. 2000, 60, 2601–2608. [Google Scholar] [CrossRef]
- Stewart, M.C. The Dependence of the Change in the Coefficient of Thermal Expansion of Graphite Fiber Reinforced Polyimide IM7-K3B on Microcracking due to Thermal Cycling; Rensselaer Polytechnic Inst.: Troy, NY, USA, 1995. [Google Scholar]
- Barnes, J.A.; Simms, I.J.; Farrow, G.J.; Jackson, D.; Wostenholm, G.; Yates, B. Thermal expansion characteristics of PEEK composites. J. Mater. Sci. 1991, 26, 2259–2271. [Google Scholar] [CrossRef]
- Fujii, H.; Mashima, Y.; Hibino, S.; Inoue, I.; Okuyama, K. A New Lightweight Structure System for a Nano Deep Space Probe; European Conference on Composite Materials: Seville, Spain, 2014; p. 8.
- Funk, J.G.; Sykes, G.F. The Effects of Simulated Space Environmental Parameters on Six Commercially Available Composite Materials; National Aeronautics and Space Administration: Hampton, Virginia, 1989; p. 34. [Google Scholar]
- Tompkins, S. Effects of Thermal Cycling on Composite Materials for Space Structures; NASA, Scientific and Technical Information Office: Hampton, VA, USA, 1989; p. 24.
- García Yárnoz, D.; Kojima, A.; Di Pippo, S. Access to Space: Capacity-building for development through experiment and payload opportunities. Acta Astronaut. 2019, 154, 227–232. [Google Scholar] [CrossRef]
- Millan, R.M.; von Steiger, R.; Ariel, M.; Bartalev, S.; Borgeaud, M.; Campagnola, S.; Castillo-Rogez, J.C.; Fléron, R.; Gass, V.; Gregorio, A.; et al. Small satellites for space science: A cospar scientific roadmap. Adv. Space Res. 2019, 64, 1466–1517. [Google Scholar] [CrossRef]
- Lal, B.; Blanco, E.; Behrens, J.; Corbin, B.; Green, E.; Picard, A.; Balakrishnan, A. Global Trends in Small Satellites; Institute for Defense Analyses: Alexandria, VA, USA, 2017. [Google Scholar]
- de Crombrugghe, G.; Pletser, V. Emerging Microgravity Platforms and their Capabilities Compared to the Traditional Offering; International Astronautical Federation: Adelaide, Australia, 2017; p. 8. [Google Scholar]
- SpaceX Dragon. Available online: https://www.spacex.com/dragon (accessed on 12 December 2019).
- Rabbow, E.; Rettberg, P.; Parpart, A.; Panitz, C.; Schulte, W.; Molter, F.; Jaramillo, E.; Demets, R.; Weiß, P.; Willnecker, R. EXPOSE-R2: The Astrobiological ESA Mission on Board of the International Space Station. Front. Microbiol. 2017, 8, 1533. [Google Scholar] [CrossRef] [PubMed]
- Harris, I.L.; Chambers, A.R.; Roberts, G.T. Results from the Space Technology Research Vehicle 1a Atomic Oxygen Experiment. J. Rockets 1998, 35, 647–652. [Google Scholar] [CrossRef]
- Abbe, E.; Renger, T.; Sznajder, M.; Klemmed, B.; Sachse, E.; Hübner, R.; Schüler, T.; Bärtling, Y.; Muchow, B.; Tajmar, M.; et al. A material experiment for small satellites to characterise the behaviour of carbon nanotubes in space—development and ground validation. Adv. Space Res. 2019, 63, 2312–2321. [Google Scholar] [CrossRef]
- Williams, C.; DelPozzo, S.; Doncaster, B. Nano/Microsatellite Market Forecast, 9th ed.; SpaceWorks Enterprise Inc.: Dunwoody, Georgia, 2019; p. 37. [Google Scholar]
- Halt, T.; Wieger, A. Smallsats by the Numbers 2019; Bryce Space and Technology: Alexandria, VA, USA, 2019; p. 24. [Google Scholar]
- Poghosyan, A.; Golkar, A. CubeSat evolution: Analyzing CubeSat capabilities for conducting science missions. Prog. Aerosp. Sci. 2017, 88, 59–83. [Google Scholar] [CrossRef]
- Woellert, K.; Ehrenfreund, P.; Ricco, A.J.; Hertzfeld, H. Cubesats: Cost-effective science and technology platforms for emerging and developing nations. Adv. Space Res. 2011, 47, 663–684. [Google Scholar] [CrossRef]
- Ifju, P.G. Composite Materials. In Springer Handbook of Experimental Solid Mechanics; Sharpe, W.N., Ed.; Springer: Boston, MA, USA, 2008; pp. 97–124. ISBN 978-0-387-30877-7. [Google Scholar]
- Yousefpour, A.; Hojjati, M.; Immarigeon, J.-P. Fusion Bonding/Welding of Thermoplastic Composites. J. Thermoplast. Compos. Mater. 2004, 17, 303–341. [Google Scholar] [CrossRef]
- Murray, W.M.; Miiler, W.R. The Bonded Electrical Resistance Strain Gage: An Introduction; Oxford University Press: New York, NY, USA, 1992; ISBN 978-0-19-507209-9. [Google Scholar]
- Miyoshi, H. Mechanical Properties of Carbon Fiber Reinforced Thermoplastic Composite in Space Environment. Master’s Thesis, Kyushu Institute of Technology, Kitakyushu, Japan, 2018. [Google Scholar]
- Analog Devices AD590. Available online: https://www.analog.com/media/en/technical-documentation/data-sheets/AD590.pdf (accessed on 2 March 2018).
- Dong, C.; Li, K.; Jiang, Y.; Arola, D.; Zhang, D. Evaluation of thermal expansion coefficient of carbon fiber reinforced composites using electronic speckle interferometry. Opt. Express 2018, 26, 531–543. [Google Scholar] [CrossRef] [PubMed]
- Goto, K.; Kii, T.; Yoshihara, K.; Ishimura, K.; Komatsu, K.; Higuchi, K.; Maruyama, T.; Ikeda, Y.; Matsumoto, K.; Yoshihara, M.; et al. Long Term Durability of a Rib and Cable Tensioned Structure for High Accuracy Large Deployable Antenna Reflector; International Symposium on Space Technology and Science: Okinawa, Japan, 2011; p. 7. [Google Scholar]
- Jang, K.-W.; Paik, K.-W. Effects of Heating Rate on Material Properties of Anisotropic Conductive Film (ACF) and Thermal Cycling Reliability of ACF Flip Chip Assembly. IEEE Trans. Compon. Packag. Technol. 2009, 32, 339–346. [Google Scholar] [CrossRef]
- Dulucheanu, C.; Severin, T.; Băeșu, M. The influence of heating rate on the coefficient of linear thermal expansion of a 0.087% c and 0.511% Mn steel. Tehnomus 2017, 24, 48–53. [Google Scholar]
- Silverman, M. Space Environmental Effects on Spacecraft: LEO Materials Selection Guide; National Aeronautics and Space Administration: Hampton, VA, USA, 1995; p. 504.
- Fajardo, I.; Lidtke, A.A.; Bendoukha, A.S.; Gonzalez-Llorente, J.; Rodríguez, R.; Morales, R.; Faizullin, D.; Matsuoka, M.; Urakami, N.; Kawauchi, R.; et al. Design, Implementation, and Operation of a Small Satellite Mission to Explore the Space Weather Effects in Leo. Aerospace 2019, 6, 108. [Google Scholar] [CrossRef]
- Tennyson, R.C. Results from the UTIAS Long Duration Exposure Facility Composite Materials Experiment; NASA: Washington, DC, USA, 1992.
- Tennyson, R.C. Atomic Oxygen and Its Effect on Materials. In The Behavior of Systems in the Space Environment; DeWitt, R.N., Duston, D., Hyder, A.K., Eds.; Springer: Dordrecht, The Netherlands, 1993; pp. 233–257. ISBN 978-94-010-4907-8. [Google Scholar]


© 2020 by the authors. Licensee MDPI, Basel, Switzerland. This article is an open access article distributed under the terms and conditions of the Creative Commons Attribution (CC BY) license (http://creativecommons.org/licenses/by/4.0/).