Article

Go-Around Detection Using Crowd-Sourced ADS-B Position Data

by
Simon Richard Proud
National Centre for Earth Observation, Atmospheric, Oceanic and Planetary Physics, University of Oxford, Parks Road, Oxford OX1 3PU, UK
Aerospace 2020, 7(2), 16; https://doi.org/10.3390/aerospace7020016
Submission received: 5 December 2019 / Revised: 14 February 2020 / Accepted: 17 February 2020 / Published: 21 February 2020
(This article belongs to the Collection Air Transportation—Operations and Management)

Abstract

:
The decision of a flight crew to undertake a go-around, aborting a landing attempt, is primarily to ensure the safe conduct of a flight. Although go-arounds are rare, they do cause air traffic disruption, especially in busy airspace, due to the need to accommodate an aircraft in an unusual position, and a go-around can also result in knock-on delays due to the time taken for the aircraft to re-position, fit into the landing sequence and execute a successful landing. Therefore, it is important to understand and alleviate the factors that can result in a go-around. In this paper, I present a new method for automatically detecting go-around events in aircraft position data, such as that sent via the ADS-B system, and apply the method to one year of approach data for Chhatrapati Shivaji Maharaj International Airport (VABB) in Mumbai, India. I show that the method is significantly more accurate than other methods, detecting go-arounds with very few false positives or negatives. Finally, I use the new method to reveal that while there is no one cause for go-arounds at this airport, the majority can be attributed to weather and/or an unstable approach. I also show that one runway (14/32) has a significantly higher proportion of go-arounds than the other (09/27).

1. Introduction

Deciding not to undertake a landing attempt, more commonly known as a go-around [1], is a well-practiced but relatively rare event for flight crews to conduct. The majority of airlines and other aircraft operators specify that an aircraft must meet a number of stable approach criteria [2] in order to continue with a landing, and that a go-around must be conducted if these criteria are not met. While criteria differ between operators, they typically take the form of a series of altitude ’gates’ at which the aircraft must be in a particular configuration, possess horizontal or vertical speeds in a set range, or be within a certain distance of the ideal flight-path. In instrument meteorological conditions, additional criteria such as visibility requirements may apply. Crews may discontinue an approach for other reasons too, such as the passenger cabin not being secure for landing. Weather also plays a role, both due to visibility restrictions and other factors such as wind shear on approach, which is particularly common in regions with thunderstorm activity [3,4]. Lastly, go-arounds may be initiated by the crew or requested by air traffic control if another aircraft is present in a location that conflicts with the safe conduct of either flight, such as an aircraft being slower than expected in vacating the active runway after landing while another aircraft is on approach [5].
Knowledge of the frequency of and circumstances leading to go-arounds allows researchers and the aviation industry to adjust procedures, standard approach paths and advice to flight crews in order to reduce the probability of a go-around occurring, which can improve efficiency and reduce pollution—due to more aircraft landing on schedule without the need for the delays inherent in go-arounds—and can also improve safety if, for example, it is found that go-arounds are frequently being initiated due to insufficient spacing between arrival aircraft.
Many airlines, airports or air traffic management providers gather statistics regarding go-around events, but these are typically limited to one airport or the fleet of one airline—making it difficult to gain a broader overview of go-arounds. Furthermore, such data is often proprietary, and thus difficult for researchers to access. Therefore, a technique to gather data from open-access sources would increase the availability of go-around data to researchers and would enable more in-depth analysis to be conducted.
There are multiple methods, either proposed or in-use, to detect and/or monitor go-around events. Some, such as those in-use at airlines to perform post-event analysis, require access to detailed aircraft status data and hence cannot function with the information available over ADS-B. Other methods can be used and range from simple techniques that look only for an aircraft that switches from descent to ascent in the vicinity of an airport while others take into account multiple parameters such as vertical speed and position [6,7]. In this paper, I test four existing, well used, go-around detection techniques of varying complexity, as described in Section 2.3, and show that these methods are susceptable to numerous issues, including failing to detect some types of go-arounds and/or a high false detection rate. I then introduce a new method that is significantly more robust, with both a higher detection rate and lower false-alarm rate. I demonstrate all five methods using transmissions from Automatic Dependent Surveillance—Broadcast (ADS-B) units that are installed on a significant proportion of commercial aircraft. ADS-B is a technology that allows aircraft to transmit status information, such as position and speed, that can be received and decoded by low-cost receivers with a clear line-of-sight to the aircraft [8]. By mid-2020 it will be mandatory for all aircraft operating in controlled airspace in the USA and Europe to be fitted with an ADS-B transmitter, and similar regulations are either in force or will enter force soon in many other regions around the world. However, some older aircraft (such as the MD-80 series or regional propliners) are not yet ADS-B equipped and many private aircraft do not fly in airspace where ADS-B is a requirement, and are therefore not equipped as a cost-saving measure. In Europe, around 90% of air traffic is equipped with ADS-B and for the purposes of analysing go-arounds of commercial airliners, this is high enough that a reasonably small number of flights are missed.
Because ADS-B signals can be received using cheap, simple, equipment—a radio receiver and a basic computer, many entities have emerged that provide live feeds of aircraft position, such as the Flightradar24 and FlightAware commercial providers and the OpenSky Network that focuses on research use. These services provide coverage for much of the global land surface (oceanic coverage is limited due to the lack of ground-based recivers), including the majority of large airports. This means that ADS-B data has the potential to be an excellent source of position information to feed research into go-around events, as well as other topics such as routing efficiency, congestion and weather avoidance.
In this paper, I focus on OpenSky Network data covering the Chhatrapati Shivaji Maharaj International Airport (VABB) in Mumbai, India between 1 August 2018 and 20 August 2019. VABB was chosen due to the excellent ADS-B coverage, even at low altitudes where line of sight may be an issue, and the complexity of operations at the airport [9]: VABB maintains two runways (14/32 and 09/27) although only one runway is in use at any given time. In August 2019 the airport handled over 27,000 aircraft movements [10], making it the second busiest airport in India and one of the busiest single runway airports in the world. Statistics on the number of landings and go-arounds for each runway at VABB, computed using Opensky data and the detection method described below, are given in Table 1.
Furthermore, Mumbai experiences frequent Monsoon rainfall events between Jun–Sept each year, which has a significant influence on air traffic due to poor visibility, windshear and lightning hazards on the approach path. These factors make VABB an excellent choice for exploring go-around occurrences. The techniques I describe in this paper are generalised, though, and should be applicable to any airport with good low-altitude ADS-B coverage.

2. Data and Methods

2.1. Opensky Aircraft Position Data

In order to monitor go-arounds at a particular airport, a source of ADS-B based aircraft position, velocity and status data is required. It is important that such data is as accurate as possible, to prevent false-positives through, for example, fluctuating altitude reports, and with as high a temporal resolution as possible in order to accurately determine the time and location of the go-around event. To this end, I use data from the OpenSky network [11], a non-profit association that processes and archives ADS-B data from a global network of sensors. OpenSky data has previously been used by researchers for a diverse range of studies, including aviation security [12,13], retrieving meteorological data [14], inferring company information from business jet movements [15] and monitoring both aircraft and airspace performance [16,17].
OpenSky data is ideal for this study as the raw aircraft status messages are available rather than processed position reports. This means that the researcher is able to work with data at the same frequency as it is received from the aircraft, and means that there will be no artefacts due to smoothing or sub-sampling that may be present in data sources that filter the data onto a well-defined cadence, such as one position report every ten seconds. The downside of this data is that it requires the user to take into account the variable timing of the transmitted data, as it is quite common for data transmitted by the aircraft not to be received by a ground-based sensor, or for two differing reports to be stored from two different sensors in separate locations. The researcher must account for this, removing inaccurate or duplicate reports and filtering the data themselves. However, the added computational burden of this user-side filtering is worthwhile as it eliminates a potential source of bias. This is particularly true for studies looking at rapidly-evolving events such as go-arounds or accidents. For example, in a go-around the negative vertical speed (descent) associated with a typical approach trajectory will rapidly shift into a positive vertical speed (climb). Some filtering techniques may interpret these positive values as noisy or bad quality data, removing them from the aircraft position time series, making it difficult to see the point at which an aircraft went around. Other techniques may smooth the transition from negative to positive vertical speed, which also masks the exact position that a go-around occurred.
For this study, I retrieved OpenSky data using the Traffic python library [18], which downloads OpenSky data and converts the data into individual ’flights’, where each flight represents a contiguous set of position reports from a given ICAO24 aircraft address, which is a unique identifier assigned to individual aircraft for the duration of their registration. I directed the Traffic library to download data only for position reports at less than 10,000 ft barometric altitude in a 0.9 × 0.9° (100 × 100 km) box centred on VABB for the period 1 August 2018 until 20 August 2019. This dataset comprised a total of 320,072 individual flights including take-offs, landings and transiting aircraft. If a particular ICAO24 code was seen more than once in the dataset, which is common for short-haul aircraft based at VABB, then the Traffic library automatically split the raw data into multiple flights based upon extended on-ground periods, changes in callsign (which is often, but not always, reported via ADS-B), or extended periods with no ADS-B reception. Manual analysis of a subset of the study data indicated that Traffic successfully identified separate flights in all of the 2000 cases examined. Nevertheless, it is likely that a very small proportion of trajectories did contain multiple flights grouped together. Even if this occurs, however, it should not affect the ability to detect go-arounds, as none of the methods discussed in this paper rely on data that may change between one flight and the next. Throughout this study, and consistent with aviation standards, aircraft altitudes are given in feet rather than metres.

2.2. Pre-Processing of Data

2.2.1. Removal of Invalid and Unneeded Position Reports

By its nature, ADS-B data often contains missing or incomplete reception of position report transmissions from a given aircraft. Therefore, prior to using any ADS-B data it must be pre-processed to remove these invalid transmissions. In addition, the ADS-B data from OpenSky contains many irrelevant position reports, such as those by aircraft taking off or from ground vehicles. A multi-stage filter was applied to the raw OpenSky data to remove these position reports.
Firstly, invalid transmissions were removed using a filter that searched for duplicate timestamps, longitudes or latitudes in the position reports. Duplicates of these values generally mean that a report is redundant, either due to incomplete reception or due to other factors such as the received report not including positional information. A second filter was applied to remove aircraft whose reported altitude was greater than 10,000 ft. Due to the size of the study area around VABB, all aircraft intending to land will be below this altitude and therefore any other aircraft can be ignored. The OpenSky dataset provides ground coverage at VABB, meaning this dataset also contained ground vehicle position reports. These were excluded by removing position reports from callsigns beginning with “WILDLIF”, “AGM000”, “FOLOWME”, “RADAR”, “FIRETEN” or “DUTYOFIR”. All flights with a maximum altitude of less than 1000 ft or a maximum ground speed of less than 100 kts were also excluded, on the basis that they are likely to be taxiing aircraft, helicopters or general aviation—which are not relevant in this study. Manual analysis showed several specific ICAO24 hex codes belonging to helicopters that remained in the dataset after the other tests were applied. These were removed by an ICAO24 address filter. Once invalid and irrelevant reports were removed there were a total of 317,484 flights remaining, meaning that approx. 0.8% of flights in the original dataset were discarded.

2.2.2. Correction of Barometric Altitude

The OpenSky dataset contains two types of altitude report, barometric altitude derived from atmospheric pressure sensors and geometric altitude, which is reported as a relative difference to the barometric altitude and calculated using position measurements from the onboard GPS. In order to maximise data availability, I use the barometric altitudes, in this study: Analysis of the OpenSky data revealed that many aircraft do not transmit, or transmit invalid, geometric altitude values. However, the barometric altitude is reported based on the assumption of standard temperature and pressure, which is defined as 15 °C and 101.325 hPa air temperature and pressure respectively. Barometric altitude reports, therefore, require conversion into local atmospheric conditions before they can be used—otherwise the reported altitude would differ from the actual above ground altitude by an amount that depends on the actual temperature and pressure. To perform this conversion, I retrieved historial meteorological reports (METARs) for VABB using the Automated Surface Observing System (ASOS) operated by Iowa State University [19]. The ’python-metar’ library was used to load the raw METAR data and transform it into numerical temperature and pressure data [20].
For VABB, METARs were typically available every 30 min, and the closest METAR to a given point on the aircraft trajectory was used to convert barometric altitude into actual altitude using the following equation:
Altitude = ( 3.28084 T M E T A R 0.0065 ( 1 T a ) 0.190255
where:
T a = P I S A ( 1 0.0065 A l t B A R O T I S A ) 5.2561 P M E T A R
In these equations, TMETAR and PMETAR are the air temperature and pressure reported in the METAR, TISA and PISA are the standard atmosphere temperature and pressure, and AltBARO is the barometric altitude reported by the aircraft converted into metres. This method will not be completely accurate, due to uncertainties both in the reported METAR data and in the barometric altitude, but does give an aircraft altitude that is much closer to its true altitude above the surface than using the raw barometric altitude. This is especially true for a location such as Mumbai, which generally has air temperatures substantially above that assumed in the standard atmosphere.

2.2.3. Removal of Flights Departing VABB

After this altitude conversion, I used a simple method to determine if a flight was likely to be a departure from VABB and thus of no interest to this study. This method used four checks:
  • The first five position reports for a flight are listed as on the ground, and the average altitude for the entire flight trajectory is less than 3000 ft.
  • All reported in-flight altitudes are less than 600 ft, a threshold determined through manual analysis.
  • All reported in-flight altitudes are less than 3000 ft and the first three reported altitudes are lower than the subsequent three altitude reports.
  • The average rate of climb for the first six in-flight altitude reports is greater than 1500 ft per minute.
If any of the above criteria were satisfied for a flight then it was flagged as a take-off and discarded from subsequent analysis.

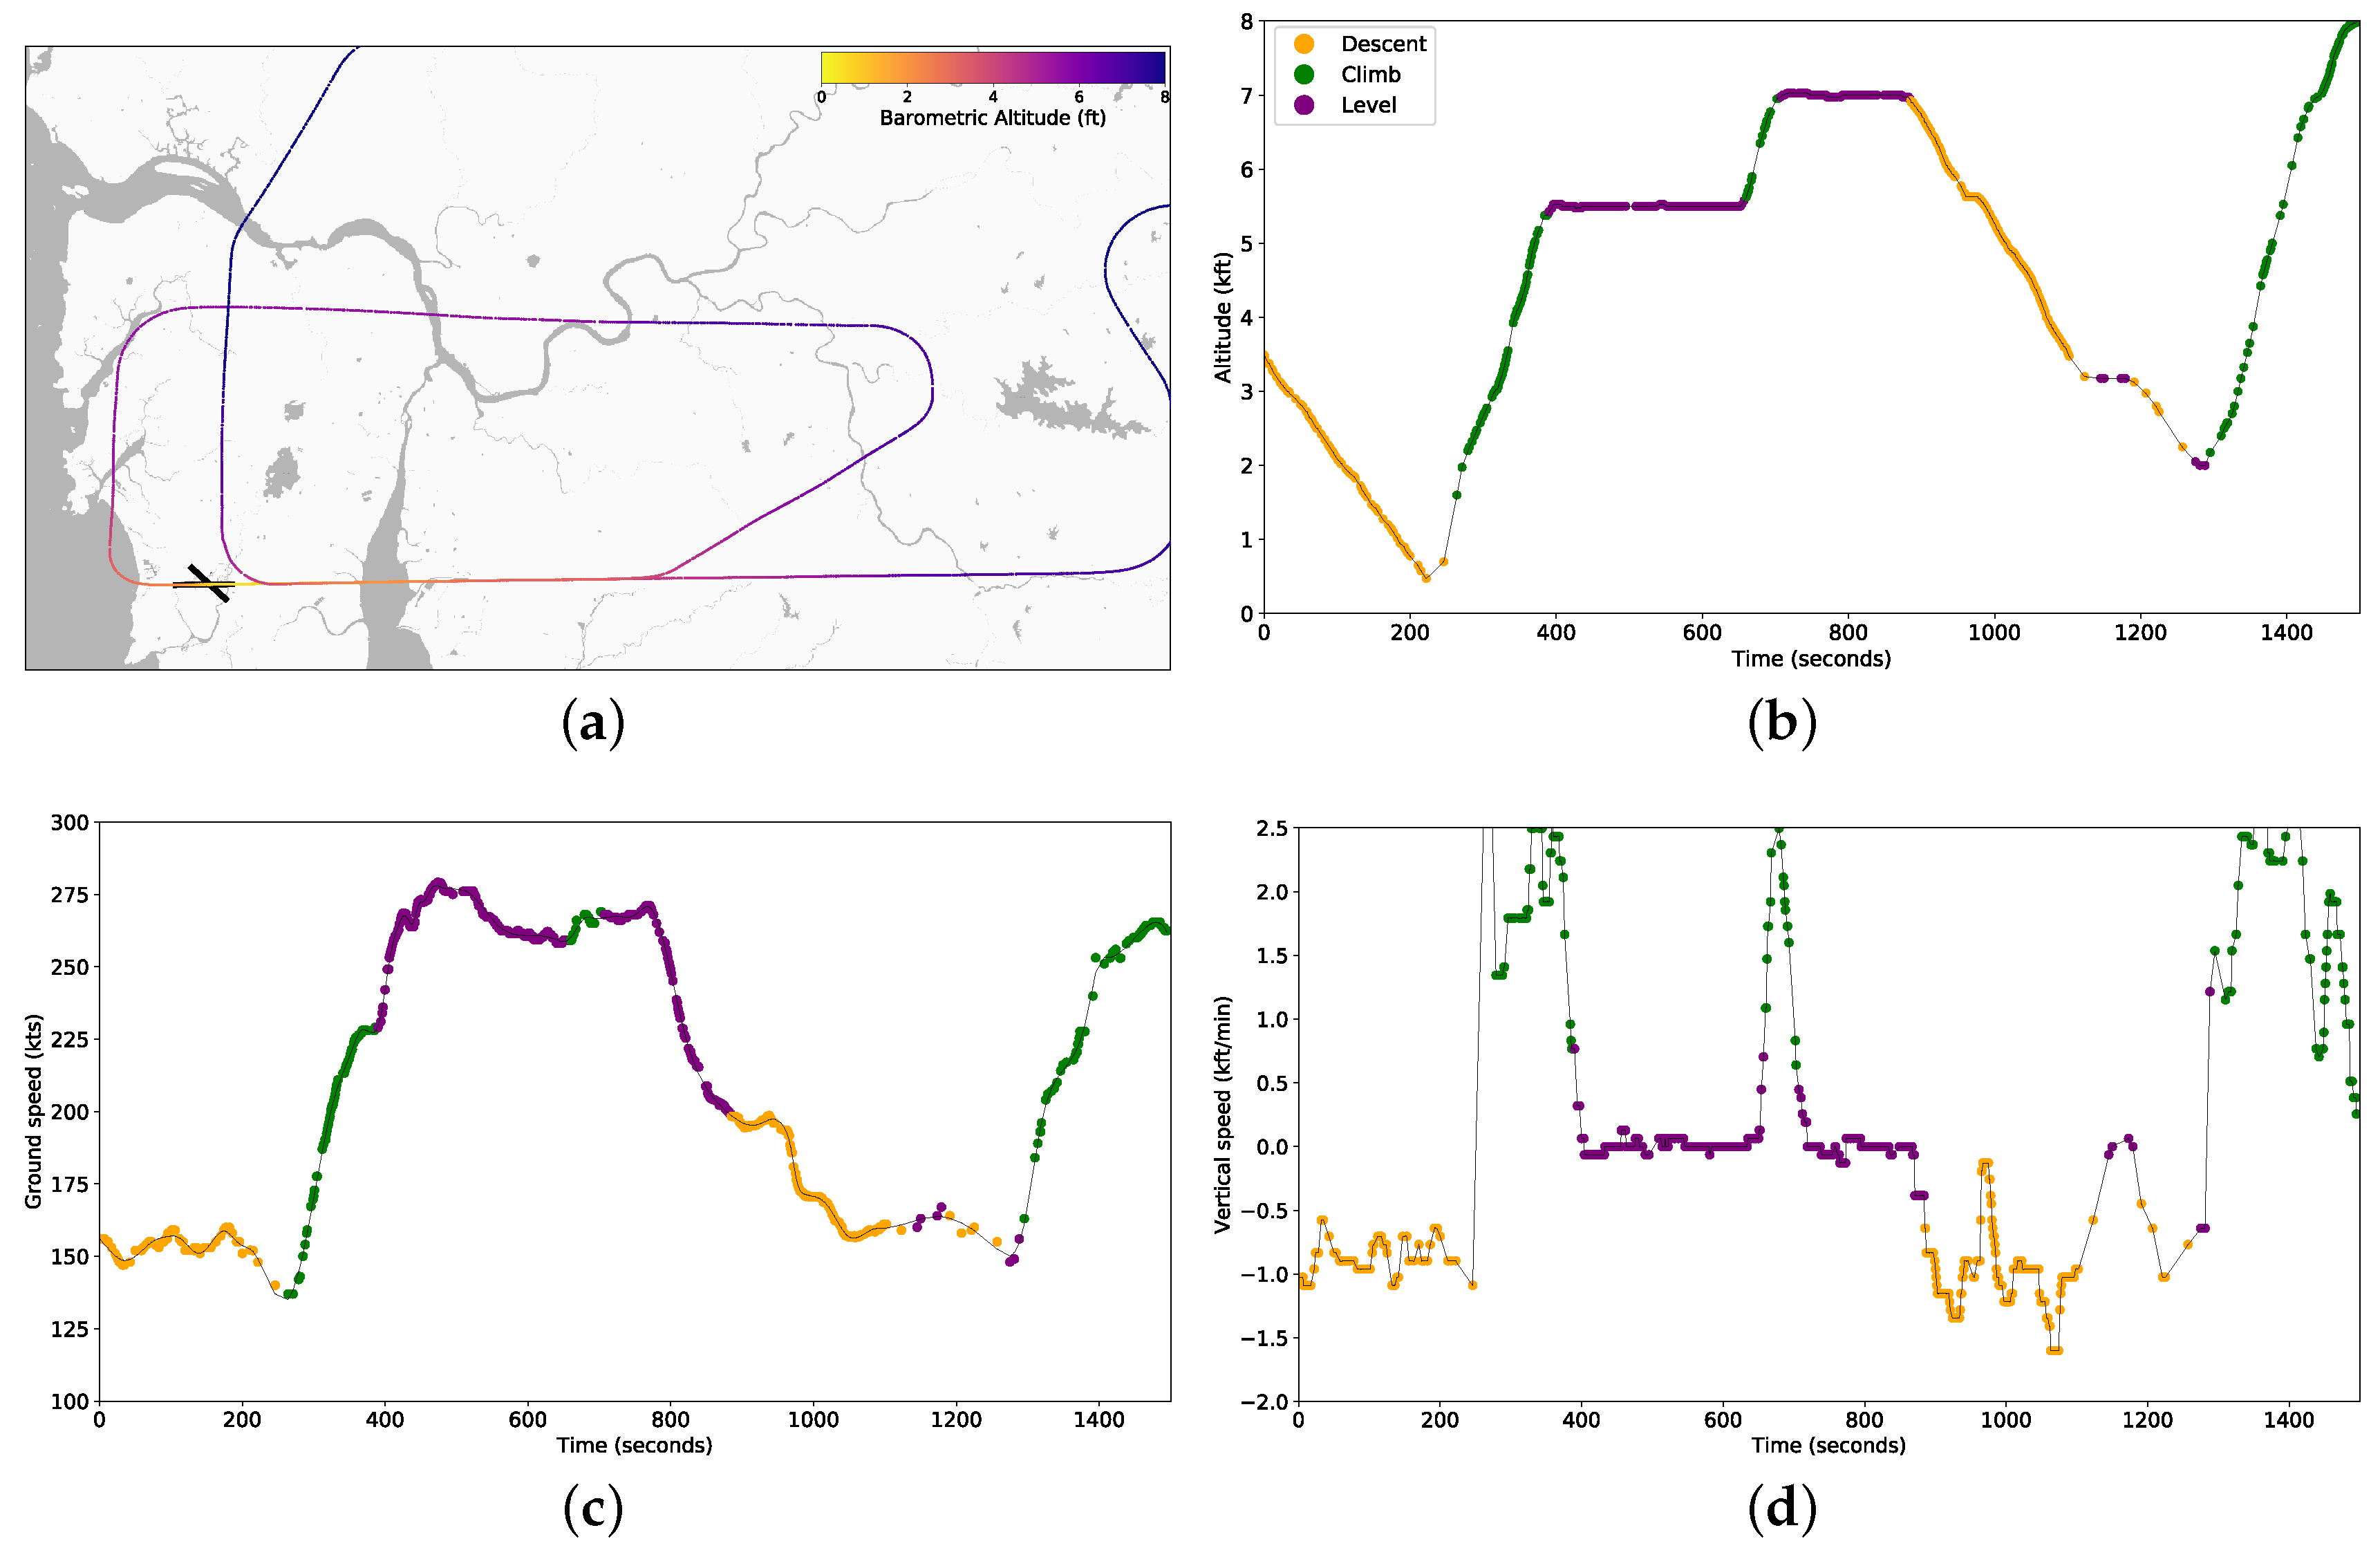
2.2.4. Categorisation of Flight Phases

Next, each flight was categorised into six phases that represent Ground, Climb, Descent, Cruise, Level flight and Other. I used the flightphase algorithm [21] that uses fuzzy logic applied to the aircraft ground speed, altitude and rate-of-climb to perform the categorisation. Figure 1 shows a visualisation of this pre-processing technique applied to a flight that conducted two go-around maneuvers while attempting to land at VABB. The altitude profile looks relatively smooth but the ground speed and, in particular, the vertical speed plots show short-term fluctuations in the values. These are often filtered out by other ADS-B providers, and demonstrate the improved data availability that is possible through OpenSky.

2.3. Go-Around Detection

Here I introduce five go-around detection methods of varying complexity. Three of these methods (2, 3 and 4) check for a specific parameter, or combination of parameters, that occur immediately after a local minimum in the altitude profile for the flight, filtered only for minimum altitudes below 2500 ft. The first method is somewhat more complex, examining the horizontal trajectory of the flight but not the altitude while the final method examines the 4d trajectory of an aircraft, and relies on both the flight data and the flight phase classification described above:
  • Method 1: An existing method for detection [22]. First, check that a flight trajectory begins more than 3 nautical miles from the airport and ends less than 3 nautical miles from the airport. Next, compute the cumulative turn angle by summing the absolute value of all changes in heading within 6 nautical miles of the airport. If this angle is greater than 330° then class the flight as a go-around. Reasoning: Aircraft that go around will typically deviate from the runway heading, flying in some form of circular or oval pattern in order to rejoin the approach path.
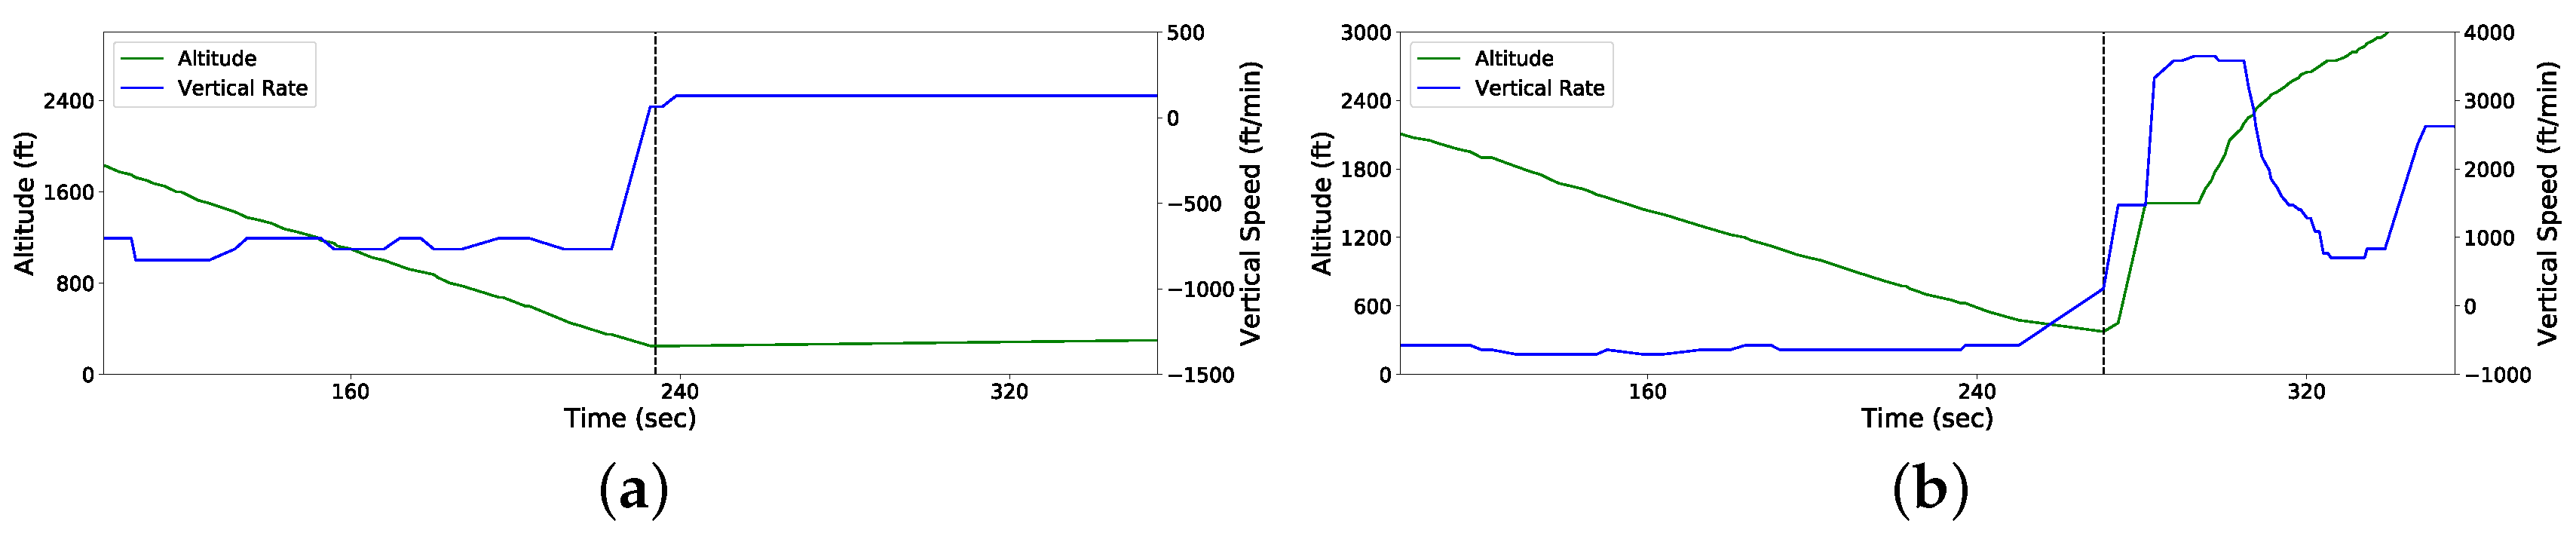
  • Method 2: Check for three position reports, which show an increasing altitude trend, that immediately follow the minimum reported altitude. Reasoning: As above, but testing a different method of detecting the post go-around climb.
  • Method 3: Combine method 2 with a check of positive rate of climb. On occasion, false altitude reports may show an aircraft at high altitude even when on the ground, while sometimes the rate of climb is falsely set to a high number if the aircraft has weight-on-wheels. This method attempts to minimise incorrect detections caused by either of these false datapoints. In addition to the method 2 check, this method looks for a positive rate of climb within one minute after the minimum altitude, reported in three individual position reports that are separated by more than ten seconds. Reasoning: During a go-around, an aircraft will typically climb away from the runway before repositioning for another landing attempt.
  • Method 4: Check for sustained ground speeds above 100 kts following the minimum altitude. An aircraft will typically accelerate during a go-around in order to remain safely above stall speed, whereas a landing aircraft (even if the altitude report is incorrect) will typically report slow speeds, often in the 20–30 kt range for taxiing on the ground after landing.
  • Method 5: Check flight phases and extract points where the phase changes from Descent to either Level or Climb at an altitude below 2500 ft. For each of these phase change points, create a mini-trajectory comprising of the next 120 s of flight data or if such a length of time is not available then create a mini-trajectory from as much flight data as remains. Next, extract the total number of points in this trajectory and count the number of points in this trajectory with an altitude greater than 500 ft and a vertical speed greater than 200 ft/min. Compute the percentage of trajectory points satisfying the altitude and vertical speed criteria. If this is greater than 50% then flag the trajectory as a go-around. Reasoning: A landing aircraft will always be in the descent flight phase, whereas an aircraft conducting a go-around will either be at level altitude or climbing—so this change of phase can be used as a go-around indicator. To remove false-alarms due to things like holding patterns (where an aircraft may descend and then hold at a given altitude for some time, common at major airports such as Heathrow), check that the altitude and vertical speed indicate a climb in the subsequent data, as we would expect from a go-around. The 50% pass rate was chosen based on manual analysis of 30 go-arounds seen in the OpenSky data at various airports worldwide.

3. Results

3.1. Comparison of Go-Around Detection Methods

3.1.1. Comparison to a Manual Analysis of Go-Around Events

To compare the accuracy of the five detection methods I manually analysed 12 days of data from VABB, 00:00 UTC on 24 July until 23:59 UTC on 4 August 2019. Table 2 shows the results of this analysis, indicating that during this study period approximately 1.1% of landing attempts resulted in a go-around. One flight went around twice, while all other go-arounds were from individual flights. In addition, the manual analysis found 12 higher-altitude go-arounds, occurring above the 2500 ft threshold used in this study, that were excluded from further analysis. With an increased threshold only method 5 detected all of these high-altitude go-arounds, the other methods detected between 4 and 7 of them. Increasing the altitude threshold also increases the number of false-detections, though. This is mainly due to aircraft inbound to VABB that tend to hold between 4000–6000 ft, especially if bad weather is present as in some cases this results in aircraft climbing during the hold rather than the more typical descent over each revolution of the holding pattern. Increasing the altitude threshold to detect additional go-arounds therefore requires a solution to these false detections. This could involve adding an runway-specific corridor in which go-arounds are monitored, which would exclude the holding patterns. The downside of this approach, though, is that it would be less generic than the existing method, which only requires basic information about an airport and its runways.
As shown in Table 3, methods 1, 3, 4 and 5 all have a low false-alarm rate. Method 2, however, has a substantially higher number of false alarms, which appears to be due to aircraft reporting erroneous altitude data after landing—primarily due to a very low altitude being reported near touchdown followed by higher altitudes being present in the data post-landing. This issue is resolved by using the geometric altitude, derived by GPS, rather than barometric altitude but many aircraft do not report geometric altitude, limiting the applicability of method 2. Another approach to negating the effects of these errenous high altitude data points is to use the ‘on-ground‘ flag that is included in the Opensky data, determined from whether an aircraft is transmitting ground or air status messages. If the aircraft is flagged as being on-ground then it is safe to assume that a go-around has not occurred. However, analysis of the dataset used here showed that approximately 5% of aircraft were not flagged as on-ground in the data, even when stopped at the gate.

3.1.2. Missing Go-Arounds

Methods 1, 2, 3, and 4 fail to detect many of the go-arounds. In the case of method 1, this is due to a combination of factors. Firstly, this method requires the trajectory of an aircraft to end within 3 nautical miles of the airport. This is not a problem if an aircraft goes around and then attempts another landing, but in around 40% of cases in this manual analysis the go-around was followed by a diversion to an alternate airport, as shown in the Figure 1 for example, thus not triggering the detection. Other go-arounds were missed as the subsequent landing was on a different runway to the first attempt, such as a go-around occuring on approach to runway 09 and the successful landing occuring on runway 32 that, in some cases, required a cumulative turn angle of only 230°. The success of this method could be improved by removing the 3 nautical mile threshold. This threshold is in place to remove transiting flights and take-offs from the dataset, but as described in Section 2.2.3 these can be removed by other techniques. The cumulative turn angle threshold is more of an issue, and is likely to require manual analysis at each airport for which the detection method is applied. The altitude data problems experienced by method 2 in terms of false alarms also manifest themselves in the number of missed go-arounds, with many failing to be detected due to noisy altitude data or false high altitude data during the go-around. This could be mitigated by, for example, averaging the data or applying a filter, but this would limit the utility of the method by making it harder to detect exactly when the go-around occurred. Applying, say, a 20 s filter to the data would make it more difficult to detect when in that period the go-around was initiated. For method 3, the missing detections are primarily due to the vertical speed being inaccurate, many aircraft do not report vertical speed correctly—either reporting values with substantial (60+ s) delay or not reporting accurate vertical speeds at all, meaning that vertical speed cannot be used to assess whether a go-around has occurred.
Similarly, method 4 fails to detect many go-arounds due to the ground speed being incorrectly reported. Ground speed has a dependence upon wind speed, so some go-arounds are missed if there is a strong headwind that reduces the ground speed below the threshold. As aircraft do not report actual airspeed, this is difficult to overcome. The wind speed and direction reported in METAR data can be used to estimate the air speed from the ground speed, but this assumes that the wind speed is constant and does not take into account wind gusts or changing wind direction. Furthermore, METARs report ground-level winds, which may not be applicable to go-arounds at higher altitudes. An alternative approach would be to use Mode-S reports of airspeed that are sent by aircraft following a request from the ground [23]. This allows the wind speed and direction to be estimated more reliably than using METARs, but is limited by the need for Mode-S airspeed data to be present, which is not always the case.
Method 5 missed one go-around, which was due to the aircraft reporting that it was on the ground, and thus not a go-around, despite being airborne. All other go-arounds were detected successfully and no false alarms were flagged in this 12 day dataset. Therefore, method 5 appears to be the best choice for successfully detecting go-arounds at VABB, with a success rate that is significantly better than the other methods that were testing. Nevertheless, all five methods rely, to some extent, upon the data reported by the aircraft being both accurate and timely—which is not always the case.

3.1.3. Processing Efficiency

An additional consideration is the processing efficiency of the methods, as the large volume of data present in ADS-B datasets such as that from Opensky requires that processing can be conducted at high speed, especially if methods such as these are used on a wider (multi-airport) scale than that considered in this paper. All five methods presented here can be run on a standard desktop computer at acceptable speed—processing between 40–50 flights per second, substantially greater than the actual volume of flights at VABB. Method 5, due to its additional complexity, was approximately 5% slower than the other methods but the primary bottleneck is reading the ADS-B data from disk, and that is common across all methods tested here.

3.1.4. Complex Detection Methods Provide better Results

Finally, converting the barometric altitude data to geometric altitude using the METAR atmospheric pressure is not necessary for detecting go-arounds. I tested methods 2 and 5 using uncorrected data with no change in the statistics, which is expected as correcting the altitudes will simply move them higher or lower, rather than changing the intra-datapoint difference. Nevertheless, correcting to geometric altitude is important for examining the conditions under which go-arounds occur, which is explored in more detail in the following section, and also has an effect on the 2500 ft threshold discussed earlier.
Overall, the five detection methods show a number of differences but it is clear that the most complex method, Method 5, produces the most reliable detection statistics across the 12-day period examined here. An example of typical go-around profiles detected and missed by the various methods is shown in Figure 2. This indicates that to successfully detect go-arounds with minimal false-detections one cannot use a single variables such as altitude or vertical speed but must combine multiple variables that better reflect the aircraft state during flight.

3.2. Analysis of Go-Arounds at VABB

To explore go-arounds at VABB in more detail, I applied detection method 5 to just over one year of Opensky data, which resulted in the detection of 392 go-arounds from 153,765 landing attempts

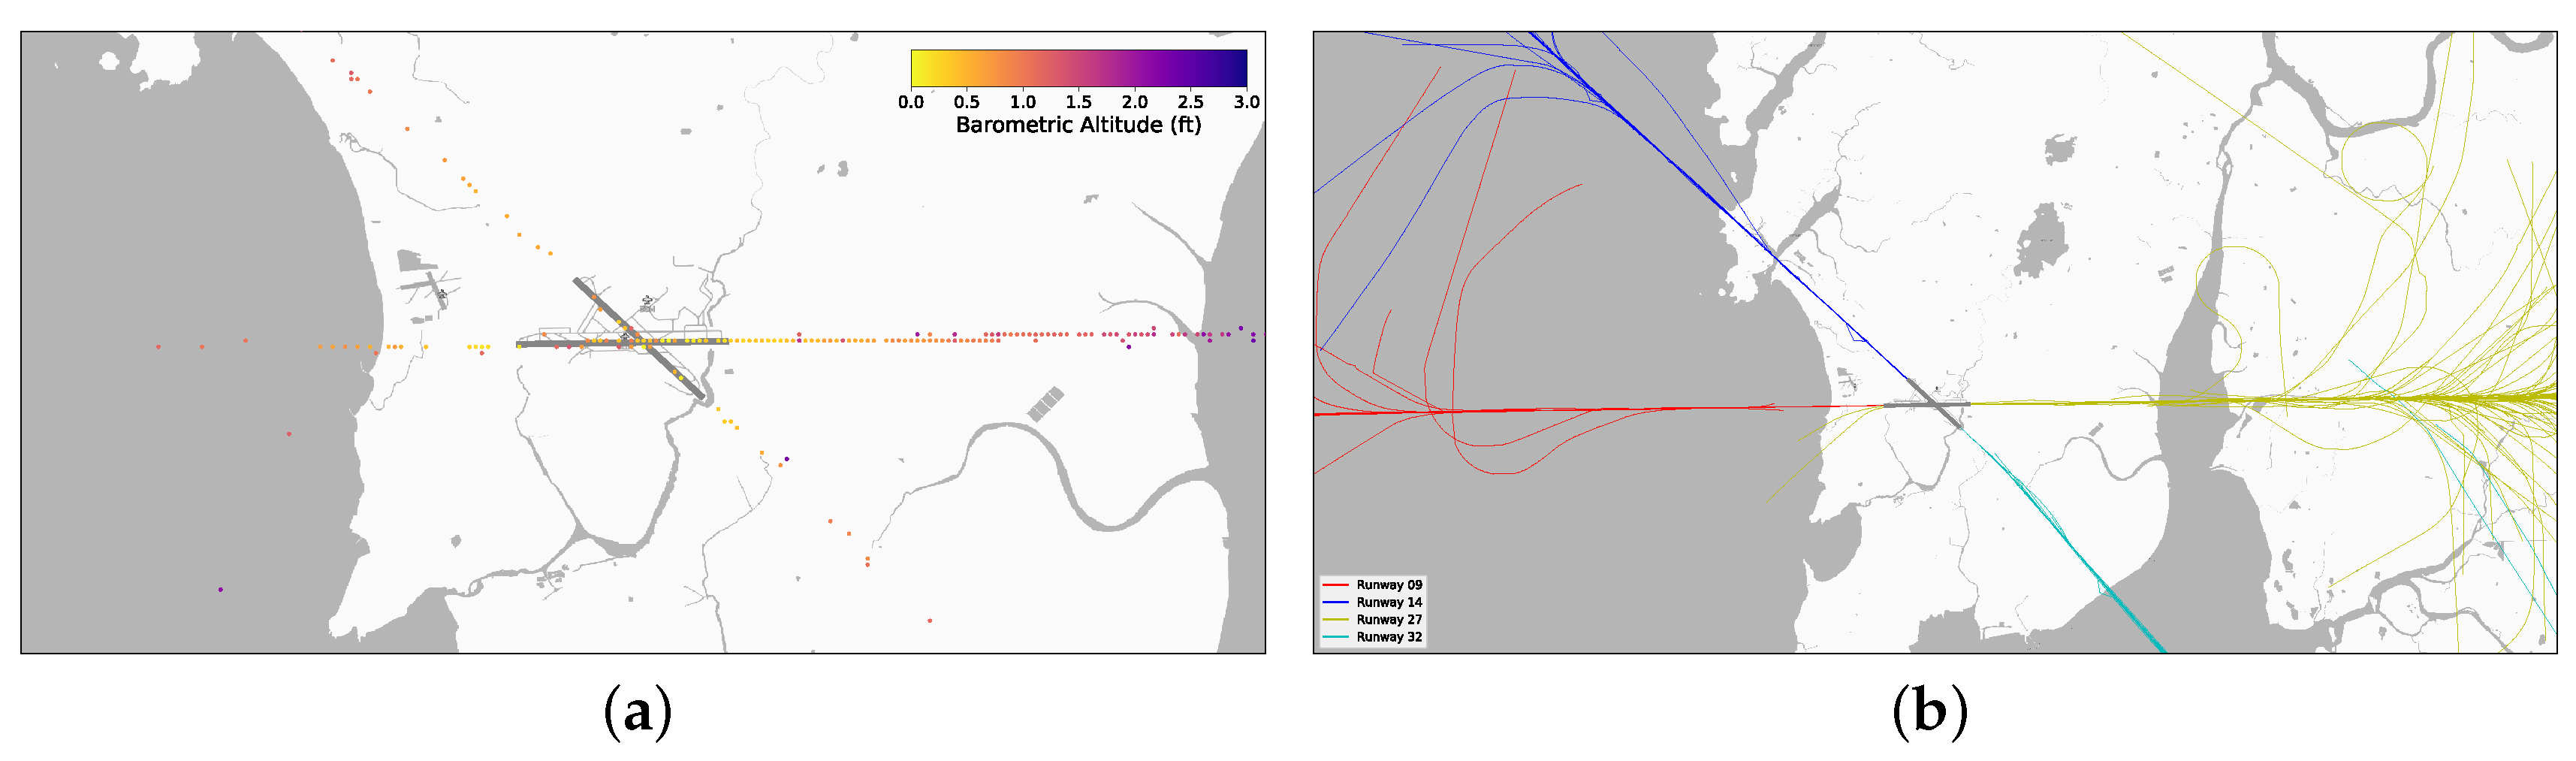
3.2.1. Go-Arounds as a Function of Location

As shown in Table 1, runways 14 and 32 show significantly more go-arounds than runways 09 and 27. Figure 3a maps the locations of all flagged go-arounds and shows that there appears to be little trend in go-around propensity as a function of distance from the runway threshold: Go-arounds occur fairly equally near, or even beyond, the threshold compared to earlier in the approach. The exception to this is Runway 14, where 8 out of 37 (21.6%) of go-arounds occurred after the runway threshold. This is likely due to meteorological conditions, 59% of go-arounds on this runway occurred when the METAR stated that storm cells were present near the airport, compared to an average of 14.3% for the other three runways.

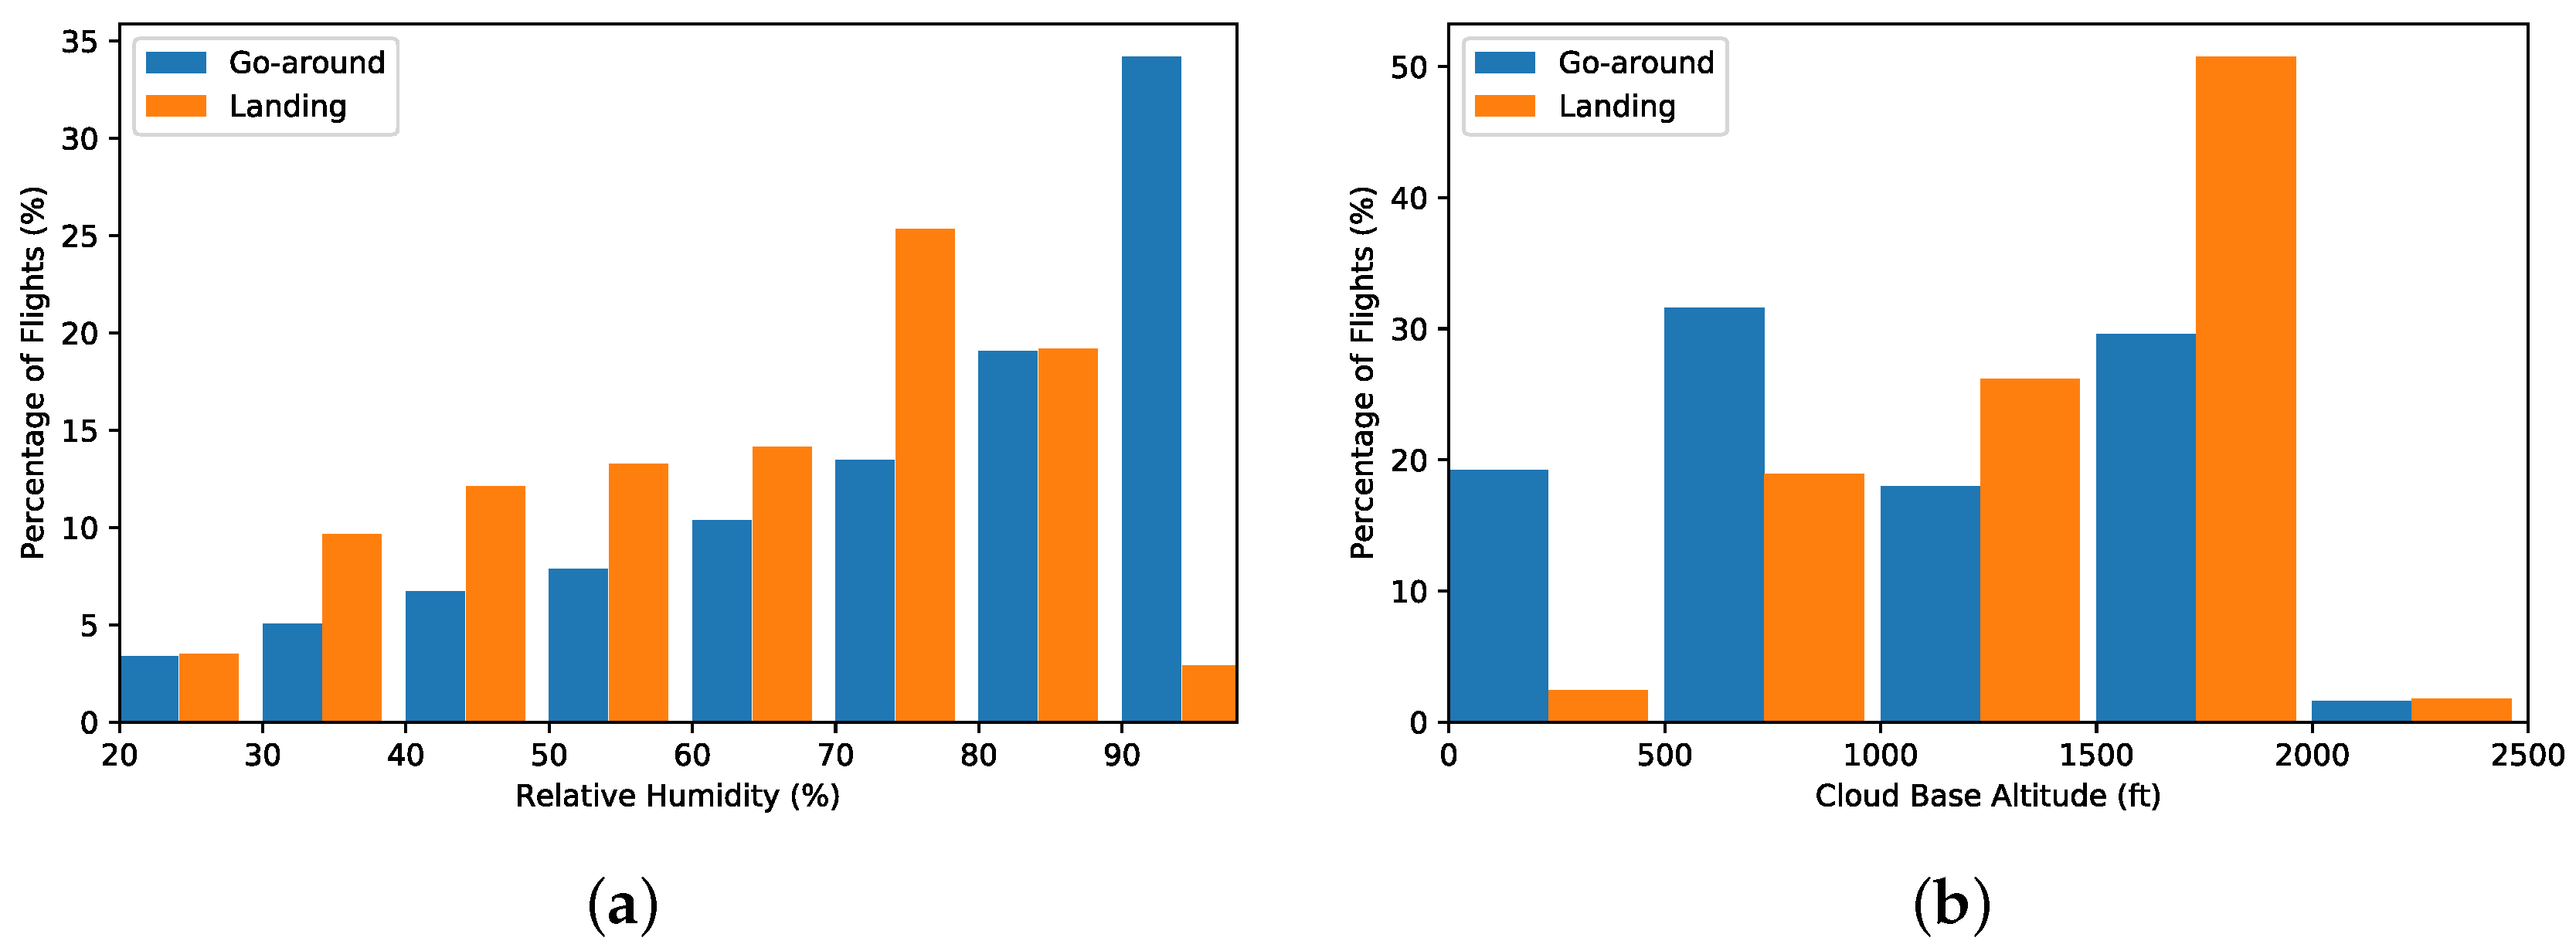
3.2.2. The Role of Meteorological Conditions

In addition to the threat of storm cells, go-arounds on runway 14 experienced an average wind direction of 81° relative to the approach path compared to 30° for the other runways and the average crosswind speed for Runway 14 was 9.3 kts compared to 3.5 kts for the other runways. Together, these indicate that crosswinds were likely an important factor in the high number of go-arounds on Runway 14. Manual analysis of the data from a subset of these go-arounds showed that runway 14 was often used when another runway was affected by storm activity on the approach path, and in most cases a go-around on 14 was followed by a successful landing on runway 09 or 27.
Visibility and precipitation were also likely to have played a role in many of the go-arounds. Figure 4 shows histograms of weather conditions experienced by go-arounds and landings during the study period, derived from the METAR data. Relative Humidity (RH) is used as a proxy for precipitation, as the precipitation text in METARs from VABB was often incorrectly formatted. RH values of 90–100% (the rightmost bars on the chart) are an indication that rainfall may be occurring. These figures show that go-around most frequently occur in very humid conditions, which are much less common for successful landings. Furthermore, more than 50% of go-arounds occurred when the cloud base altitude was less than 1000 ft, while only 21% of successful landings has such a low cloud base.
Runway 32 experienced proportionally more go-arounds than runways 09 or 27 and manual analysis also showed that a landing was attempted on 32 due to storms on the standard approach trajectories to the other runways. Across all runways the majority of go-arounds occurred on the approach path, with very few flights deviating horizontally from the runway heading. There were two exceptions to this, both on runway 27 and visible in the lower left of Figure 3a. These two flights initiated a go-around, then overflew the runway before climbing away at an angle of approximately 230°. For unknown reasons these flights then descended over the ocean by 700–800 ft before resuming their climb. This means that for each of these flights two ‘go-arounds’ were detected, one over the runway and one over the ocean. In Table 1, these flights with multiple go-arounds are only counted once. The example of these two flights illustrates a potential flaw in the detection method described here, as there is no check that a ‘go-around’ occurs on approach to a runway, meaning that go-around-like events can be detected at any location in the 100 × 100 km coverage region. This could be overcome using a similar method to that described in Section 3.1.1 to remove holding pattern false detections.

3.2.3. Unstable Approaches

Many of the go-arounds, across all four runways, could be characterised as unstable approaches—during a 10-s period before a go-around was initiated the rate of change in vertical speed was substantially higher for go-around aircraft than those that did not go around (0.075 vs. 0.021 ft/min2), as was the variation in heading (0.138 vs. 0.077 degrees/s) and the variation in ground speed (0.063 vs. 0.037 kts/s). These trends indicate a degree of instability in the approach, especially as for most of the aircraft analysed, a large variation in one parameter was accompanied by larger than average variations in other parameters too (especially vertical speed and ground speed). A useful metric for analysing approach stability is the total energy of an aircraft, defined as the sum of potential energy (altitude) and kinetic energy (horizontal and vertical speed). This cannot, however, be computed from ADS-B data as the mass of the aircraft is unknown. Instead, the specific energy can be examined. The specific energy fo go-arounds on Runway 32 is shown in Figure 5, many go-arounds possessed an energy excess due to being too high, too fast or both. Sixty five percent of go-arounds (250 flights) had a specific energy more than one sigma outside that averaged across all successful landings (152,000 flights). Of these, 41% a had a total specific energy excess for at least part of their approach of more than one sigma above average while 25% were more than one sigma below average. Similarly, 26% of go-arounds were in the upper fifth percentile for specific energy while 11.5% were in the lowest fifth percentile. Therefore, either an excess or lack of energy was likely to be a contributory factor in a large proportion of go-arounds at VABB. In particular, a substantial fraction of go-arounds flights were both high and fast on approach.

3.2.4. Conflicting Traffic

Interestingly for an airport using single-runway operations, few of the go-arounds correlated with another aircraft being visible on the runway in the OpenSky data. Out of 392 go-arounds, 5 (1.3%) corresponded to a time when another aircraft was clearly on the runway, while another 21 (5.4%) may have experienced another aircraft on the runway. While it is possible that the number of go-arounds due to an occupied runway is so low, this may also be due to aircraft missing in the OpenSky data due to poor reception of the ADS-B signal. While many on-ground aircraft are seen, there are gaps in the coverage and this may hide some additional cases of an occupied runway.

4. Conclusions

In this paper, I have compared multiple methods for detecting aircraft go-arounds in freely-available ADS-B datasets, showing that simple methods tend to miss some go-arounds and are also prone to false detections. I introduce a more robust method that is generic enough to be applied at any major airport, which accurately detected go-arounds over a 12-day period at Mumbai airport, missing only one event and producing no false detections when tuned to detect go-arounds below 2500 ft. Increasing the altitude threshold introduces some false-detections due to aircraft in holding patterns, which could be alleviated by adding airport-specific bounding boxes to limit the area of go-around detections to the standard arrival tracks for each runway at the airport.
Applying this method to just over one year of data for Mumbai airport in India produced a database of 392 flights that experienced one or more go-arounds, which were unevenly spread between the four runways at this airport. I found that runway 14 experienced a disproportionately high number of go-arounds, although the reason for this was not clear, but may be due to this runway being used more frequently during bad weather, for example when storm cells are present on the published approach paths to the more commonly used runways 09 or 27. Overall, relatively few go-arounds could be directly linked to conflicting traffic, which is surprising considering that VABB is one of the busiest single-runway operations worldwide. However, many go-arounds appeared to be due to weather, especially convective storms on the approach path or a low cloud base. In many cases, flights attempted to land during stormy weather only to go-around and subsequently divert to an alternate airport. This indicates that enhanced bad weather procedures at VABB may make operations more efficient by, for example, crews being more open to pro-actively diverting during bad weather.
While I have only applied this method to data from Mumbai airport, it is designed to work equally well at any airport with good low-altitude ADS-B coverage. In this study, I have applied the detection method only to historical data, as this allows the full trajectory of the aircraft to be recorded (both before and after the go-around is initiated). With minor changes, such as changing the post go-around analysis period from 120 s to a shorter time would enable detection of go-arounds in live ADS-B data.

Funding

This research was funded by the Natural Environment Research Council, grant number NE/R013144/1.

Acknowledgments

The algorithms used in this study were written in Python, and the version used in this paper is available at: https://github.com/simonrp84/Go_Around_Detector/releases/tag/v1.0. Updated versions may be available in the top-level github directory. I wish to acknowledge the OpenSky network, for making the ADS-B data used in this study freely available for research use, and the comments of the three anonymous reviewers—whose suggestions have significantly improved the original version of this manuscript.

Conflicts of Interest

The author declares no conflict of interest.

References

  1. Adam, G.; Condette, J. Study on Aeroplane State Awareness during Go-Around; Bureau d’Enquetes et d’Analyses pour la securite de l’aviation civile: Bourget, France, 2013. [Google Scholar]
  2. de Boer, R.J.; Coumou, T.; Hunink, A.; van Bennekom, T. The automatic identification of unstable approaches from flight data. In Proceedings of the 6th International Conference on Research in Air Transportation, Istanbul, Turkey, 26–30 May 2014; pp. 26–30. [Google Scholar]
  3. O’Connor, A.; Kearney, D. Evaluating the Effect of Turbulence on Aircraft During Landing and Take-off Phases. Int. J. Aviat. Aeronaut. Aerosp. 2018, 5, 10. [Google Scholar]
  4. Proud, S.R. Analysis of aircraft flights near convective weather over Europe. Weather 2015, 70, 292–296. [Google Scholar] [CrossRef]
  5. Helleberg, J. Effects of a final approach runway occupancy signal (FAROS) on pilots’ flight path tracking, traffic detection, and air traffic control communications. In Proceedings of the 2005 International Symposium on Aviation Psychology, Dayton, OH, USA, 2005; p. 293. [Google Scholar]
  6. Renz-Wieland, A.; Wallenburg, H. Airport Quality: Holding and Go-Arounds; Technical Report; Centrum Wiskunde & Informatica (CWI): Amsterdam, The Netherlands, 2016. [Google Scholar]
  7. Das, S.; Matthews, B.L.; Srivastava, A.N.; Oza, N.C. Multiple kernel learning for heterogeneous anomaly detection: Algorithm and aviation safety case study. In Proceedings of the 16th ACM SIGKDD International Conference on Knowledge Discovery and Data Mining, Washington, DC, USA, 25–28 July 2010; pp. 47–56. [Google Scholar]
  8. Strohmeier, M.; Schäfer, M.; Lenders, V.; Martinovic, I. Realities and Challenges of NextGen Air Traffic Management: The Case of ADS-B. IEEE Commun. Mag. 2014, 52, 111–118. [Google Scholar] [CrossRef]
  9. Barde, T.; Pantelias, A.; Zerjav, V. Assessment of Airport Performance in India; Royal Institution of Chartered Surveyors (RICS): London, UK, 2016. [Google Scholar]
  10. Air Traffic Report—August, 2019; Technical Report; Airports Authority of India: New Delhi, India, 2019.
  11. Schäfer, M.; Strohmeier, M.; Lenders, V.; Martinovic, I.; Wilhelm, M. Bringing up OpenSky: A large-scale ADS-B sensor network for research. In Proceedings of the 13th International Symposium on Information Processing in Sensor Networks, Berlin, Germany, 15–17 April 2014; pp. 83–94. [Google Scholar]
  12. Strohmeier, M.; Moser, D.; Schäfer, M.; Lenders, V.; Martinovic, I. On the Applicability of Satellite-based Air Traffic Control Communication for Security. IEEE Commun. Mag. 2019, 57, 79–85. [Google Scholar] [CrossRef]
  13. Gökgöz, F. Anomaly Detection using GANs in OpenSky Network. In Proceedings of the NATO Science and Technology Organization: Big Data and Artificial Intelligence for Military Decision Making, Bordeaux, France, 30 May–1 June 2018. [Google Scholar]
  14. Trüb, R.; Moser, D.; Schäfer, M.; Pinheiro, R.; Lenders, V. Monitoring Meteorological Parameters With Crowdsourced Air Traffic Control Data. In Proceedings of the ACM/IEEE International Conference on Information Processing in Sensor Networks (IPSN), Porto, Portugal, 11–13 April 2018. [Google Scholar]
  15. Strohmeier, M.; Smith, M.; Lenders, V.; Martinovic, I. The Real First Class? Inferring Confidential Corporate Mergers and Government Relations from Air Traffic Communication. In Proceedings of the IEEE European Symposium on Security and Privacy (EuroS&P), London, UK, 24–26 April 2018. [Google Scholar]
  16. Alligier, R. Predictive Distribution of the Mass and Speed Profile to Improve Aircraft Climb Prediction. In Proceedings of the Thirteenth USA/Europe Air Traffic Management Research and Development Seminar (ATM2019), Vienna, Austria, 17–21 June 2019. [Google Scholar]
  17. Olive, X.; Grignard, J.; Dubot, T.; Saint-Lot, J. Detecting Controllers’ Actions in Past Mode S Data by Autoencoder-Based Anomaly Detection. In Proceedings of the SESAR Innovation Days, Salzburg, Austria, 3–7 December 2018. [Google Scholar]
  18. Olive, X. Traffic, a toolbox for processing and analysing air traffic data. J. Open Source Softw. 2019, 4, 1518. [Google Scholar] [CrossRef] [Green Version]
  19. Herzmann, D. ASOS-AWOS-METAR Data Download. Available online: https://mesonet.agron.iastate.edu/request/download.phtml (accessed on 20 February 2020).
  20. Herzmann, D. Python-Metar, a Python Package that Parses Coded METAR Weather Reports. Available online: https://github.com/python-metar/python-metar (accessed on 20 February 2020).
  21. Sun, J.; Ellerbroek, J.; Hoekstra, J. Flight Extraction and Phase Identification for Large Automatic Dependent Surveillance–Broadcast Datasets. J. Aerosp. Inf. Syst. 2017, 14, 1–6. [Google Scholar] [CrossRef] [Green Version]
  22. Sherry, L.; Wang, Z.; Kourdali, H.K.; Shortle, J. Big data analysis of irregular operations: Aborted approaches and their underlying factors. In Proceedings of the 2013 Integrated Communications, Navigation and Surveillance Conference (ICNS), Herndon, VA, USA, 22–25 April 2013; pp. 1–10. [Google Scholar]
  23. Sun, J.; Vû, H.; Ellerbroek, J.; Hoekstra, J. Ground-based wind field construction from mode-s and ads-b data with a novel gas particle model. In Proceedings of the Seventh SESAR Innovation Days, Belgrade, Serbia, 28–30 November 2017. [Google Scholar]
Figure 1. An example showing the flight profile for Indigo flight 5384 that performed two go-arounds at VABB on 1 July 2019 before diverting to land at another airport. (a) Overhead map showing horizontal position of aircraft. (b) Altitude profile of the go-around attempts, colour-coded by flight phase. (c) Ground speed profile (d) Vertical speed profile.
Aerospace 07 00016 g001
Figure 2. Example altitude and vertical speed profiles for two flights flagged by only some of the methods tested. The dashed vertical line indicates where methods detected a go-around (a) Incorrectly flagged as a go-around by methods 2 and 3, due to the aircraft reporting higher altitudes post-landing than during descent. (b) Correctly flagged as a go-around by methods 1, 3 and 5, but not 2 or 4.
Aerospace 07 00016 g002
Figure 3. Locations of go-arounds at VABB. (a) Go-around locations marked by a single point, colour-coded by barometric altitude at the time of the go-around. (b) Trajectories for each aircraft that went around over the prior five minutes.
Aerospace 07 00016 g003
Figure 4. Histograms showing the normalised count of go-around and landings as a function of (a) relative humidity and (b) cloud base altitude, excluding those situations where the base is greater than 2500 ft. Bars are aligned to the left-hand tick and represent the percentage of flights between one tick and the next. For example, the leftmost bars on (b) represent cloud base altitudes between 0–500 ft.
Aerospace 07 00016 g004
Figure 5. METAR-corrected barometric altitude against distance from runway threshold for landings and go-arounds on runway 32. Black dots represent aircraft positions at the time they went around and the three coloured lines represent the 2nd, 50th and 98th percentile altitudes across all aircraft that landed successfully.
Aerospace 07 00016 g005
Table 1. Summary of runways, landings and go-arounds at Chhatrapati Shivaji Maharaj International Airport (VABB) during the study period, 1 August 2018 until 19th August 2019.
RunwayLandingsGo-AroundsPercentage
098093260.321%
142682371.380%
27139,6773110.223%
322095180.859%
Total153,7653920.256%
Table 2. Flight statistics for VABB during the comparison study period.
Total FlightsGo-AroundsTake-OffsLandingsOther
9941564905494733
Table 3. Comparison of the five go-around detection methods to a manual analysis of 12 days of aircraft data at VABB.
MethodNumber DetectedFalse AlarmsMissedCritical Success Index
Manual44N/AN/AN/A
M1140300.318
M24523220.328
M3264220.458
M4263210.490
M543010.977

