Abstract
In vertical cold launch the missile starts without the function of the main engine. Over the launcher, the attitude of the missile is controlled by a set of lateral thrusters. However, a quick turn might be disturbed by various uncertainties. This study discusses the problem of the influences of disturbances and the repeatability of lateral thrusters’ ignition on the pitch maneuver quality. The generic 152.4 mm projectile equipped in small, solid propellant lateral thrusters was used as a test platform. A six degree of freedom mathematical model was developed to execute the Monte-Carlo simulations of the launch phase and to prepare the flight test campaign. The parametric analysis was performed to investigate the influence of system uncertainties on quick turn repeatability. A series of ground laboratory trials was accomplished. Thirteen flight tests were completed on the missile test range. The flight parameters were measured using an onboard inertial measurement unit and a ground vision system. It was experimentally proved that the cold vertical launch maneuver could be realized properly with at least two lateral motors. It was found that the initial roll rate of the projectile and the lateral thrusters ‘igniters’ uncertainties could affect the pitch angle achieved and must be minimized to reduce the projectile dispersion.
1. Introduction
1.1. Problem Background
Two main types of missile launching systems are commonly used [1]. The first are trainable launchers which are pointed in the target’s direction together with the projectile. The second are vertical launchers [2,3,4], with which a rapid turn maneuver of the projectile must be performed to point the missile toward the target. The reaction time of the vertical launch system is smaller, which allows one to realize omnidirectional defense and counteract the targets approaching from various directions [5].
The vertical launch could be divided into two categories: “hot” (sometimes also called “hard”) and “cold”. In a hot launch, the main motor is ignited inside the missile canister. In a cold launch, the energy to eject the missile vertically comes from some external device (which is not part of the projectile), such as a hot gas generator, a piston, a spring, or an elastic rope. During the initial unpowered, ascending phase of flight, the projectile’s attitude is controlled precisely with small side thrusters. The main motor is ignited after the rocket leaves the launching device when the missile is several meters above the launcher and in a proper attitude (Figure 1).
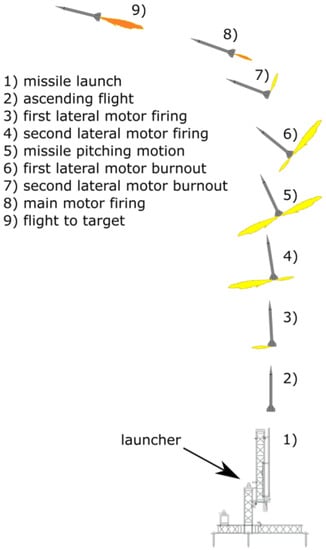
Figure 1.
Cold vertical launch concept.
This method offers several advantages over trainable launchers and conventional hot vertical launching [6,7]. In a cold vertical launch system, the gas management installation is not required and no hot gas efflux interaction on the launcher takes place, which makes this system easier for exploitation [8]. It is possible to achieve a 360° firing coverage in azimuth and a high rate of fire. The thermal, visual, and acoustic signatures of the launcher might be reduced significantly, which improves the system’s survivability on the battlefield. The minimum range could be also shortened, which results in greater defensive capability. Ready to fire missiles could be stored in the canisters so the system might be deployed in a very short time.
In the initial phase of flight, the total velocity relative to oncoming flow and resulting dynamic pressure are very low, so the controlling of the projectile only by movable aerodynamic surfaces is ineffective [9,10]. An efficient way to realize the rapid turnover maneuver is to use a gasodynamic control. The thrust vector control could be used to improve maneuverability [11,12]. The maneuver might be also realized with proportionally controlled side jets or a set of small, solid propellant lateral thrusters. Such lateral thrusters spaced equally around the projectile body are used to control rocket artillery projectiles [13], direct fire munition [14,15,16,17] such as hit-to-kill missiles, and the altitude of spacecraft. The rapid turn must be carefully planned to ensure high maneuver repeatability.
1.2. Related Works
Cold vertical launch is often used in Eastern missile systems. Some land-based intercontinental ballistic missiles (such as RS-28 Sarmat) use cold launch because for large caliber missiles the gas efflux interaction with the launching device is a significant problem, and the benefits from using cold launch grow with projectile size. This method is commonly used for submarine-launched ballistic missiles (e.g., UGM-133 Trident II). There exist only a few anti-aircraft missiles with cold vertical launch capabilities supported by lateral thrusters, e.g., CAMM, 9M330, 9M96, and Cholmae-2. The Russian P-800 missile combines hot vertical launch with lateral thrusters mounted in the nose section to make the projectile more agile in the initial phase of flight.
The main motivation of this work results from the fact that the data for the abovementioned existing systems are often classified and not widely available. Moreover, the present systems use more than two lateral thrusters integrated with closed-loop control, which makes them quite complicated.
In the literature, the agile turn maneuver realized in the launch phase with lateral thrusters is poorly described. Only a few works on this subject can be mentioned. Taur et al. [18] has evaluated the theoretical analysis of the optimal open-loop trajectories which could occur in a soft vertical launch. As a result, Taur has proposed a program that could realize the pitch attitude in the shortest possible time. Numerical simulations of the initial phase of flight were performed by Glebocki et al. [19,20]. Ożóg et al. [21] presented wind tunnel investigations of the generic missile and Monte-Carlo simulations of the launch phase. Veitch et al. in [22] presented the cold vertical launch concept with thrusters located at projectile tail. In [23] Tekin et al. presented skid-to-turn with initial roll realized by thrust vector and aero control. Harriss in [24] presented the design of a roll-decoupled thruster pack mounted on a bearing which allows one to realize the rapid turn maneuver when the projectile is not stabilized in the roll channel.
Due to the significant gap in the literature, there still exists a need for investigating this launch method. Parameters like linear accelerations and angular rates of the projectile must be precisely measured to understand the phenomena which take place during the quick turn maneuver.
1.3. Problem Definition
Repeatability is one of the most important features of the missile launching process. Several factors, such as manufacturing errors, main motor thrust misalignment, and igniter time delays could influence the projectile’s attitude after the completion of the cold vertical launch maneuver. As a result, projectile dispersion might occur. First, in the ascending phase of flight, the projectile could freely rotate around the longitudinal axis. To successfully perform the rapid turn maneuver and achieve the commanded flight direction, the projectile could be controlled in the roll channel before the lateral thrusters fire [24]. A set of nozzles mounted tangentially to the fuselage might be used to generate the control rolling moment (like in CAMM missile), but this makes the whole system more complicated and expensive. On the other hand, if the roll channel stabilization is not present, the initial roll rate should be minimized to eliminate the undesired rotation effects. Second, the ignition time of the lateral thrusters could vary between consecutive projectiles due to manufacturing errors such as propellant grain geometric tolerances, uncertainties in the mass of igniter charge, and initial grain temperature. The delay introduced by the igniters might disturb the launch process. As a result, the achieved projectile pitch angle could differ significantly from the commanded one. When the thrusters are fired too late, a flat trajectory might be achieved, and in the worst-case scenario, the projectile might fall into the ground directly after launch. Third, the main motor delay uncertainty also might modify the projectile’s attitude. The influences of abovementioned uncertainties on the rapid turn must be understood. The time delay requirements for lateral thrusters and the main motor must be defined precisely to achieve high maneuver repeatability.
The main contribution of this paper is the analysis of uncertainties in the cold vertical launch phase. The influences of various disturbances on the maneuver repeatability were investigated using the Monte-Carlo methodology. The effects of igniters’ delays on the resulting trajectory were studied. The results of ground-based firings of the vertically cold launched projectile are shown. A low-cost inertial measurement unit (IMU) was used to obtain the accelerations, angular rates, and magnetic field components. Using these data, the developed mathematical model was validated and could be used for the future design of similar systems.
This paper is organized as follows. Section 2 presents the used methodology and describes the generic projectile, mathematical model, onboard instrumentation, and sensor model. Section 3 outlines the results from Monte-Carlo simulations, followed by the presentation of ground laboratory tests. Finally, real firings are described and the validation of the model is discussed. This article ends with a conclusion and a summary of the main findings.
2. Materials and Methods
2.1. Experiment Description
Ground firing experiments were planned to investigate the repeatability of the cold vertical launch maneuver. The purpose of flight trials was to obtain the flight parameters (e.g., angular rates and the linear accelerations) which are necessary for model validation. The other goal was to check in real conditions the functionality of missile components.
It was assumed that only two thrusters will be used to complete the maneuver according to the idea presented in Figure 1. Open-loop control was applied. It means that the times of firing for the thrusters and the main motor were predefined before the launch by the system operator. It was planned to fire 12 missiles: 6 with thrusters located before and 6 behind the center of mass.
At first, the scenario was planned and the system requirements were defined. Next, the projectile aerodynamic characteristics were estimated. The preliminary mathematical model of the system was developed to investigate various scenarios that could occur in real firings. Afterward, the launcher and the test platform were designed and manufactured. Laboratory tests of the missile components (e.g., lateral thrusters, main motor, onboard computer, and parachute) took place and the whole system was integrated. Later the real flight trials were realized. Next, the post-flight analysis of the registered data was completed. The developed model was re-tuned and the simulations were evaluated again to compare the results with the flight data.
2.2. Test Platform
A high-performance, generic, single-stage missile used as a test platform is presented in Figure 2.

Figure 2.
The 152.4 mm generic projectile.
The missile caliber is 152.4 mm and its length is 1.72 m. The projectile is equipped with four swept, unmovable fins mounted at the tail in a cruciform configuration. The projectile’s center of mass locations before/after main motor burnout are = 0.673 m/ = 0.692 m, mass = 15.97 kg/ = 15.24 kg; the longitudinal moments of inertia = 0.057 kgm2/ = 0.056 kgm2; and the lateral moments of inertia = = 3.617 kgm2/ = = 3.458 kgm2.
The solid propellant, main motor thrust characteristics that were obtained from measurements in the engine test for grain temperature +21 °C and altitude = 0 m are presented in Figure 3.
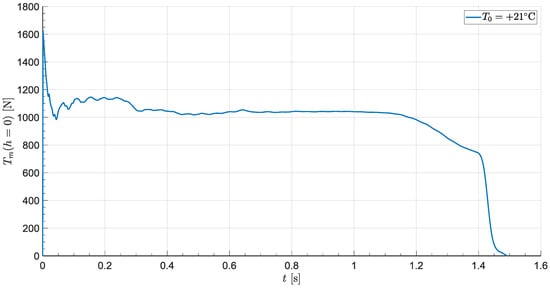
Figure 3.
Main motor thrust curve.
For the purpose of flight tests, for safety reasons, the amount of propellant was intentionally limited to reduce the projectile’s range to 1000 m. As a result, the maximum missile velocity relative to the ground was also restricted to approximately 90 m/s.
The projectile was equipped with two sets of lateral thrusters: one mounted behind and one before the center of mass. Each set was composed of four solid propellant lateral thrusters, but only two of them were used to realize the rotation around the lateral axis of the missile. The minimum number of thrusters required to realize the cold launch maneuver is two [18,19]. The thrusters’ locations from the projectile base were = 0.05 m and = 1.276 m, respectively. Each nozzle was perpendicular to the surface of the projectile. The lateral motor propellant grain was cylindrical and burned from the frontal area. The lateral thruster thrust curves from some real tests are presented in Figure 4.
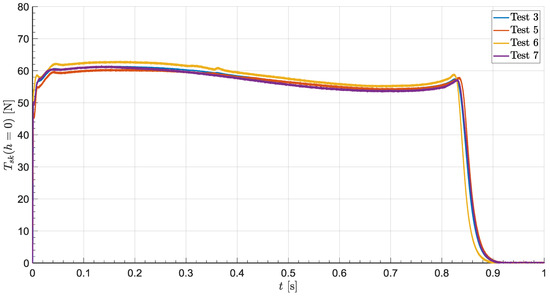
Figure 4.
Lateral thruster thrust curves.
The thrust curves are very close to each other, but some small differences could be observed. That means that the repeatability of the combustion process cannot be neglected.
To reduce the range, the missile was additionally equipped with a recovery system compounded from a rail-gun launched parachute. This kind of recovery system is widely used in the rocket research community [25].
2.3. Mathematical Model of the Test Platform
Extensive flight simulations were performed to analyze the effects of disturbances on the rapid turn and to plan the flight tests carefully. The missile was modelled as a six degree of freedom variable mass rigid body with axial symmetry. The flat Earth approximation was used due to the projectile’s short range (<1000 m). Constant gravity acceleration ≅9.81 m/s2 was applied. The air properties were assumed according to [26]. Steady-state atmosphere was considered because for research purposes it was planned to conduct the experiments in a good weather conditions. Fin cant angle misalignment was included in the simulation.
The coordinate systems that were used in simulations are presented in Figure 5.
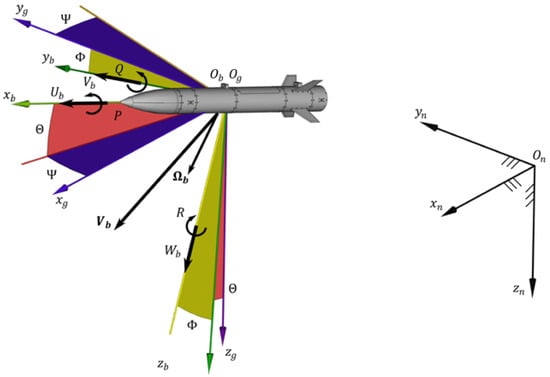
Figure 5.
Coordinate systems used in the model.
is a nonmoving, earth fixed frame. The origin was located at the top of the launcher. The origin of body-fixed frame coincides with the projectile center of mass and moves with it as the main motor expelled propellant from the projectile. is a vehicle-carried system with axes parallel to .
The projectile’s equations of motion are [27,28,29]:
where is projectile mass, are linear velocities in the body frame , are body angular rates. are forces expressed in the body-fixed frame, are moments with respect to the center of mass. is the inertia matrix, and are missile moments of inertia. are quaternion elements, —constant coefficient, —coefficient that is adjusted in each iteration ( = 0 in an ideal situation) which is defined as [29]:
Coefficient is determined empirically and its value should be such that , where is numerical integration step (for simulation it was assumed that = 1).
The quaternions were converted to Euler angles [28,30]:
The forces acting on the projectile were calculated as [14]:
where are gravity forces, are main motor propulsive forces, are aerodynamic forces, and are forces generated by lateral thrusters.
In a similar way, moments in body axes with respect to the projectile center of mass could be obtained as:
The gravity forces were calculated as follows:
where is gravity acceleration. It was assumed that the origin coincides with the projectile’s center of mass during the whole flight so moments from gravity forces are zero
Propulsive forces from the main motor were obtained as [31]:
where is the main motor thrust, is pitch misalignment, and is yaw thrust misalignment angle. The moments generated by the motor with respect to the projectile center of mass were calculated as:
Aerodynamic forces were calculated as:
where is the air density, is total flight velocity, is the projectile cross-section area. are axial, side, and normal force nondimensional coefficients.
The aerodynamic moments were calculated as:
where is projectile diameter; are rolling, pitching, and yawing moments’ coefficients. are roll, pitch, and yaw damping moments’ coefficients. Tests in the subsonic wind tunnel were performed to obtain the aerodynamic characteristics of the projectile, and the resulting data are presented in [21]. Additionally, Projectile Rocket Ordnance Design and Analysis System (PRODAS) software was used to validate the aerodynamic coefficients. Base drag variation due to main motor burn was included into the aerodynamic model. The center of pressure location as a function of Mach number is presented in Figure 6. Additionally, the center of mass locations and (before and after main motor burnout, respectively) are marked by horizontal lines.
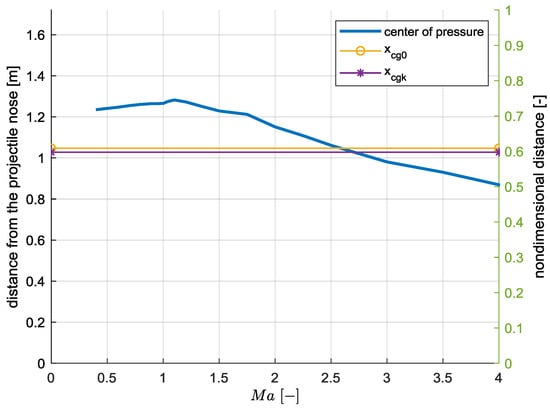
Figure 6.
Projectile center of pressure location.
From Figure 6 someone might observe that in the subsonic region the projectile stability margin is positive (center of pressure is located behind the center of mass). From Mach = 1 the center of pressure moves forward. The projectile becomes unstable for Mach numbers greater than 2.6, but this feature in the context of the presented work is unimportant (the experiments took place in the subsonic region).
The forces generated by the lateral thrusters are:
where is lateral thruster magnitude, is the number of the thruster, and = 4 is the number of thrusters in the single set. = 1 corresponds with a thruster located in the plane.
Moments generated by thrusters with respect to the projectile center of mass are:
where is the actual projectile center of mass location from the projectile base.
The center of mass location, mass, and moments of inertia of the projectile are time-dependent and were parameterized by the main motor thrust curve.
2.4. Onboard Instrumentation
Inertial measurement units (IMU) are widely used to measure the flight parameters of projectiles [32]. The onboard measuring equipment should be low cost, vibration proof, and small in size, with low mass and energy consumption [33]. These requirements could be fulfilled using microelectromechanical systems (MEMS)-based sensors [34]. The onboard computer of the projectile is presented in Figure 7a. The instrumentation consists also of a strapdown inertial measurement unit based on an ADIS16448 sensor (Figure 7b). It is composed of triaxial accelerometers, gyroscopes, magnetometers, a thermometer, and a pressure sensor [35].
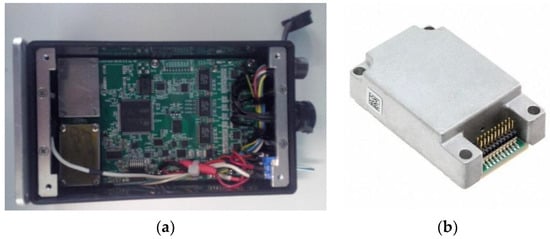
Figure 7.
(a) Onboard computer; (b) ADIS16448 sensor.
The range of the measured acceleration was ±180 m/s2, the angular rate was ±1000°/s, and the magnetic field was ±1.9 Gs. Initial sensitivity for gyro was 0.04°/s/LSB (where LSB means least significant bit). For accelerometers the sensitivity was 0.833 mg/LSB. Gyro bias repeatability was 0.5°/s and for accelerometers 20 mg. The axis to frame package misalignment was ±0.5° for both kinds of sensors. The flight parameters data were registered with time step 0.03 s on the SD memory card which was restored after the end of the flight. Additionally, the temperature of the sensor and output voltage from the onboard power supply were measured.
The onboard computer was used to activate the projectile control channels. The launch was detected when the initial acceleration measured along the longitudinal axis was larger than 30 m/s2 over time equal or larger than 100 ms. Five activation channels were used: first lateral thruster firing (1 channel), second firing (2), main motor activation (3 and 4), recovery system deployment (5). To achieve redundancy and minimalize the risk of projectile falling on the launcher due to main motor igniter failure, the main motor activation channel was doubled. The RS232 interface was used to program the time sequence of the igniter and to realize onboard computer management functions.
The measurements of the magnetic field are often disturbed by various metal components of the rocket body, so its usefulness might be limited.
2.5. Inertial Measurement Unit Error Model
Before the flight tests it was necessary to simulate the sensors outputs to check the requirements on the IMU and identify potential problems that could occur during flight testing. The data output directly from the developed 6DoF projectile model are related to the center of mass without any errors, so a realistic simulation should include the sensor model [36]. The IMU was mounted in the center of mass of the projectile before the main motor burnout. The main motor burning the lever arm between the actual center of mass and IMU location influences the accelerations readings by angular rates [37]. The transformation between accelerations in the center of mass and sensed accelerations is [38,39,40]:
where are measured accelerations at the IMU location point, are accelerations in the projectile center of mass with respect to the navigation coordinate system , is a vector of angular rates in the body-fixed coordinate frame , are body fixed angular accelerations, and is the vector from the center of mass pointed to the IMU location. is linear acceleration of the IMU with respect to body-fixed axes resulting from the projectile center of mass motion.
The gyroscopes’ measurements do not need to be compensated for due to sensors offset with respect to the center of gravity.
Various deterministic and stochastic errors are considered. The developed model of the IMU accounts for mounting misalignment, scale, bias errors, and noise [41,42]. The error budget was obtained from the ADIS16448 sensor datasheet [35].
Scale factors and bias generally could drift in time, because they depend on IMU device temperature, but due to the short flight time of the projectile (<30 s) it was assumed that these quantities are constant. Linear acceleration influence on gyro bias has been neglected.
The complete model of the triad of gyroscopes was formulated as [36,43,44]:
where are measured angular rates. The manufacturing errors are always present in the real system and it might influence the sensors’ readings [45]. If the sense axes and the IMU package are not perfectly aligned with the body axis , then some false readings on the other two axes will be observed. is a matrix which describes the angular orientation of sensor axes with respect to the body axis system [46]:
where are IMU enclosure misalignments angles. In an ideal situation is the identity matrix. The IMU case to projectile body misalignment was assumed to be ±0.8°.
is the diagonal matrix which describes the scaling error
where are scale factors for each gyroscope. In an ideal situation is the identity matrix.
is a static bias vector of the form
where are bias components for each axis. In an ideal case is a null vector.
is random noise
where are measurement noise components for each gyroscope axis.
In a similar way the accelerometers error was modelled as [43]:
where and measured accelerations. The quantities are calculated from Equation (18). is scaling matrix
where are scaling factors for each accelerometer. is a static bias vector for accelerometers
are bias factors for each axis. is noise vector
are accelerometers’ noise.
A simplified method of including the noise data into the model was applied. The noise of the gyroscopes and accelerometers was obtained from static measurements (Figure 8) and after removing of bias implemented into the simulation.
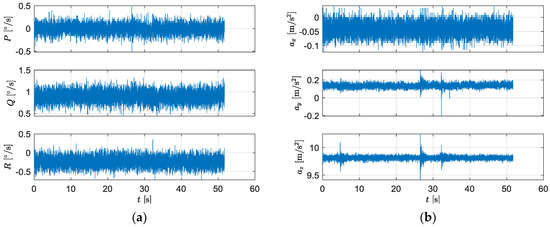
Figure 8.
Example noise of the sensors from static measurements: (a) gyroscopes; (b) accelerometers.
The gyroscope bias is easily observable in Figure 8a. The z-axis was pointed vertical, so in Figure 8b the value of the readings from this axis is ≅ 9.81 m/s2. On the two others axes, the accelerometer bias is observable because the IMU was not perfectly aligned with the surface of the laboratory table.
The outputs and from the model of IMU were quantized to make the simulation more realistic. The turn on bias was simulated at the beginning of each projectile flight.
3. Results
3.1. Monte-Carlo Analysis
The developed model was implemented in MATLAB/Simulink R2018a. The simulations were completed on a desktop computer with Intel i7 CPU and 16 GB RAM. The projectile equations of motion were integrated using the fourth-order Runge–Kutta algorithm with a fixed step size = 0.001 s. Monte-Carlo sensitivity analysis was evaluated to prepare the flight tests and to investigate the influences of launch parameters’ uncertainties and thrusters’ ignition delays on the projectile’s trajectory. The most common disturbances that affect the projectile motion are mass uncertainties, launcher vibrations, main motor thrust misalignments, fin mounting imperfections, and wind shears. Each of the disturbances was separately modelled as a Gaussian [47,48,49]. The Marsenne–Twister algorithm [50] was used to generate the pseudorandom numbers (random seed was set to 0 before each scenario evaluation). The parameters for simulation are presented in Table 1. The error values are based on laboratory tests.

Table 1.
Parameters for Monte-Carlo simulation (mass and launch uncertainties).
Six different standard deviations of initial roll rate from 10°/s to 60°/s with step size 10°/s were assumed to study the influence of the lack of stabilization in the roll channel on the resulting dispersion. The initial pitch angle is a bit smaller than 90°, because when the main motor failure occurs the projectile could fall back down on the launcher and some small deviation from vertical direction prevents the infrastructure from destruction in such an emergency situation.
The lateral thrusters are rigidly mounted to the projectile fuselage, so the force generated by them changes direction as the projectile rotates around the center of mass. In the ideal case, the roll rate of the missile during the rapid turn should be zero because the forces generated by the thrusters lie then in a vertical plane. Such a situation is difficult to achieve in a real system.
The projectile motion along the rails was not simulated. The simulation started from the time when the projectile left the launcher. The time of a single run was set to 5.54 s, which corresponds with the recovery system channel’s activation. The last phase of flight, when the projectile is descending on the parachute, was not considered because it is out of the scope of this study. In the presented simulation scenarios, it was assumed that the rapid turn maneuver was realized with the two thrusters located before the center of mass. Open-loop control was realized, which means that the firing events had been predefined before the launch using the lookup table. The nominal ignition times were programmed before the simulations. The first lateral thruster delay was set to = 0.2 s, for the second thruster = 0.33 s, and for the main motor ignition = 0.95 s. It was assumed that perfect igniters were available, so the standard deviation from the nominal firing time value was 0 s. A set of 100 simulations was evaluated for each of the considered scenarios. It was assumed that the projectile commanded pitch angle was achieved in ≅2.5 s (immediately after main motor burnout, when the projectile reaches maximum speed). The commanded pitch angle was set approximately to ≅31.5° with the tolerance ±5°. That means that the allowed pitch angle cannot be smaller than ≅26.5° or larger than ≅36.5°. Similarly, the yaw angle deviation from the firing plane was assumed to be smaller than ±5°, which means that the yaw angle was to be between –5° and +5°. In fully operable missile systems, such small inaccuracies could be compensated for in the later phase of flight by the guidance unit. These tolerance requirements could be fulfilled only when the initial roll rate dispersion and igniters’ repeatability are below certain thresholds, which must be found. This can influence the manufacturing process parameters and stiffness of the launcher rails.
The projectiles were fired in the positive direction of the axis. The calculated trajectories in the coordinate frame for the best and worst cases are presented in Figure 9 and Figure 10. The black dashed lines mean the assumed tolerance and the trajectories should lie between them.

Figure 9.
Projectile trajectories projections on for various initial roll rate standard deviations. (a) 10°/s; (b) 60°/s.

Figure 10.
Projectile trajectories projections on for various initial roll rate standard deviations. (a) 10°/s; (b) 60°/s.
In Figure 10, the coordinate has a negative sign because this axis is pointed down. Theoretically, in the ideal case when no disturbances were applied, all the trajectories should be coincident and lie in the plane. The uncertainties in the launching conditions significantly influence the trajectories achieved. The missile is not roll stabilized, so it can rotate freely around the longitudinal axis. As a result, the trajectories are different in elevation and azimuth. For larger standard deviations of , larger dispersions were obtained, which means that to improve the maneuver’s repeatability, the roll rate of the projectile should be as small as possible. Significant lateral dispersion has been observed for the standard deviation of roll rate 60°/s (Figure 9b). Some of the projectiles fall further than 50 m from the plane . Some quantitative analysis of the errors was applied. The percentages of projectiles which achieved the assumed lateral dispersion tolerance in the scenarios were: 97%, 92%, 86%, 82%, 79% and 78%, respectively. This means that the more uncertain the initial roll rate, the more projectiles there were which landed out of the allowed side borders.
For a standard deviation of equal to 60°/s, the height at the end of flight varies from 0 m up to 190 m (Figure 10b). One of the projectiles immediately after launch falls directly into the ground at the range of 260 m from the launcher. The maximum heights obtained in all scenario are similar (approximately 200 m), but the minimum changes significantly.
The visualization of the projectile trajectories in 3D is presented in Figure 11.

Figure 11.
Projectile trajectories for various initial roll rate standard deviations. (a) 10°/s; (b) 60°/s.
In the worst-case scenario (Figure 11b, black arrow), the trajectories are far from the desired direction. Such a situation is undesirable in real firings for safety reasons.
Projectile angular rates are shown in Figure 12.
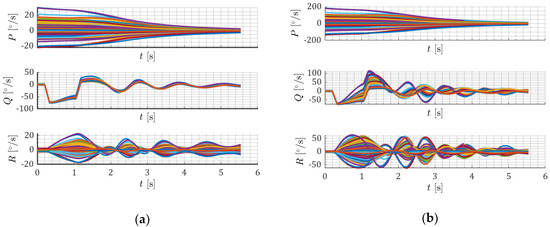
Figure 12.
Projectile angular rates for various initial roll rate standard deviations. (a) 10°/s; (b) 60°/s.
Initial roll rate dispersion increases in the consecutive scenarios. In the last considered case, some of the projectiles achieved up to 200°/s, which is unacceptably high. Over time, angular rate converges to zero due to aerodynamic damping. The fin cant angle in preliminary simulations was assumed to be 0°. Angular rate is strongly influenced by the uncertainties. After lateral motors stopped, oscillations in pitch rate and yaw rate appeared, and they were dampened with time, which means that the projectile is statically stable (the center of pressure lies closer to the base than the center of mass).
The obtained roll, pitch and yaw angles are presented in Figure 13.
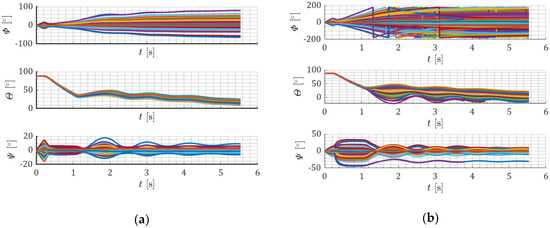
Figure 13.
Projectile roll, pitch and yaw angles for various initial roll rate standard deviations. (a) 10°/s; (b) 60°/s.
The roll angle varies with time. In the worst case, the roll angle changes rapidly over ±180°, which means that several projectiles rotated more than 180° around the longitudinal axis (Figure 13b). The pitch angle starts decreasing after the first thruster fires. Next, decreases linearly when the first and second lateral thrusters are working simultaneously. Pitch angle stabilizes when both thrusters expell the propellant. For the smallest standard deviation, the pitch angle curves are nearly coincident. The pitch angle is the most repeatable for the smallest roll rate deviation of 10°/s. At the end of the simulation was in range between 7.5° and 25° (Figure 13a). On the other hand, in the last case the final pitch angle was from −12.5° to 22° (negative values mean that some of the projectiles were in descending flight). The yaw angles change when both thrusters work simultaneously. In the worst case yaw angle falls in the range from −30° up to 9.5°.
The requirements on the pitch and yaw angles are fulfilled only when roll rate standard deviation is smaller than 10°/s. For larger uncertainties, the trajectories’ dispersion is too large when related to assumed a priori repeatability.
Next, the sensitivity analysis was evaluated to assess the influences of lateral thrusters and main motor ignition uncertainties on the projectile trajectories. The ignition time might be different from its nominal value due to manufacturing errors and the initial temperature of the propellant grain. Additionally, the time delays for thrusters located before and behind the center of mass could be different. Several firing delay combinations might occur. For example, the first lateral thruster might be fired too early, the second too late and the main motor too early. To illustrate this effect, several flight scenarios for some deterministic combinations of delays have been simulated. It was assumed that the time difference between nominal and achieved ignition time is 0.011 s. The possible combinations of igniters uncertainties for the assumed worst-case scenarios are presented in Table 2.

Table 2.
Igniters’ uncertainty combinations.
It was assumed that the only source of disturbances was igniters, so the maneuver took place in the plane. The obtained trajectories are presented in Figure 14. The reference, nominal trajectory (blue solid line) is shown for comparison. Entry in each legend corresponds with a case number from Table 2.
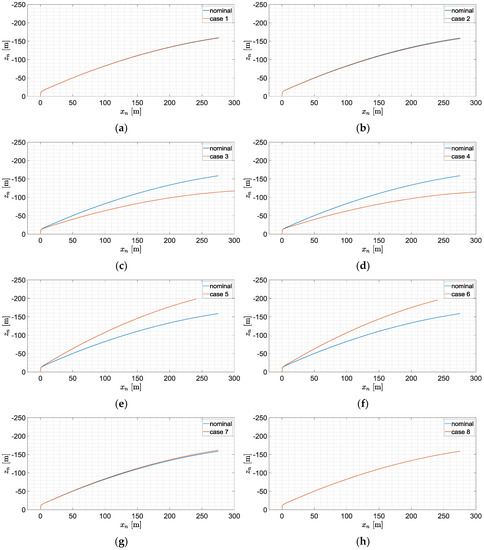
Figure 14.
Projectile trajectories’ projections on for various delay combinations: (a) = 0.189, = 0.319, = 0.939; (b) = 0.189, = 0.319, = 0.961; (c) = 0.189, = 0.341, = 0.939; (d) = 0.189, = 0.341, = 0.961; (e) = 0.211, = 0.319, = 0.939; (f) = 0.211, = 0.319, = 0.961; (g) = 0.211, = 0.341, = 0.939; (h) = 0.211, = 0.341, = 0.961.
The trajectory depends on combinations of thrusters’ firings. In cases 1, 2, 7 and 8 the trajectories are very close to the nominal one (the end difference is below several meters). In cases 3 and 4 the final trajectory is too flat when compared to the nominal one because the second thruster was fired too late. In cases 5 and 6 the trajectory is too steep because the second lateral motor was fired too early. Main motor firing delay results in quite a small divergence of trajectories.
The comparison of pitch angles for various combinations of igniters’ delays is shown in Figure 15.
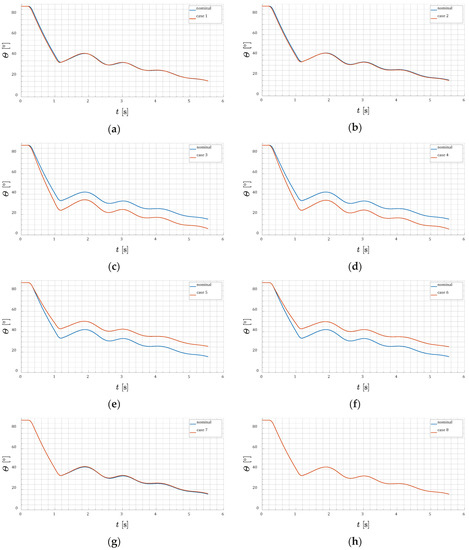
Figure 15.
Projectile pitch angles for various delay combinations: (a) = 0.189, = 0.319, = 0.939; (b) = 0.189, = 0.319, = 0.961; (c) = 0.189, = 0.341, = 0.939; (d) = 0.189, = 0.341, = 0.961; (e) = 0.211, = 0.319, = 0.939; (f) = 0.211, = 0.319, = 0.961; (g) = 0.211, = 0.341, = 0.939; (h) = 0.211, = 0.341, = 0.961.
Even very small time differences with respect to nominal ignition times could affect the pitch angle by several degrees. In cases c and d the final pitch angle is smaller with respect to nominal one. On the other hand, in e and f angle is too large.
To isolate the influences of ignition uncertainties on the maneuver repeatability, the ideal launch conditions were assumed (which means that all standard deviations from Table 1 were set to zero). In this way, the maneuver was realized only in the plane . Six various standard deviations from nominal values of , and have been considered. The nominal pitch angle (measured after main motor burnout) was equal to ≅31.5° as in the previously described scenarios. The parameters for the Monte-Carlo simulation are presented in Table 3.

Table 3.
Parameters for the Monte-Carlo simulation (igniters’ uncertainties).
A set of 100 simulations has been evaluated for each scenario. The obtained trajectories in the frame are presented in Figure 16.
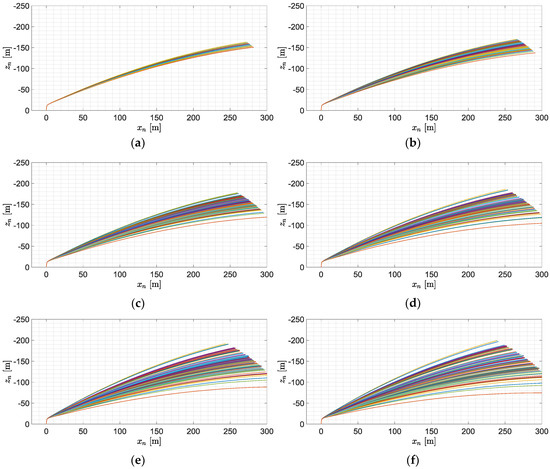
Figure 16.
Projectile trajectories’ projections on for various standard deviations: (a) 0.001 s; (b) 0.003 s; (c) 0.005 s; (d) 0.007 s; (e) 0.009 s; (f) 0.011 s.
In the ideal case for perfect igniters, all the trajectories should be coincident with each other. The missile trajectories depend strongly on the igniters’ repeatability. The larger uncertainties, the greater dispersion has been obtained. For 0.001 s the projectile altitude at the end of the flight was between 150 and 160 m (Figure 16a). The largest differences in elevation angles were observed for the standard deviation of igniters equal to 0.011 s, and then the height of the projectile at the end of simulation varied from 74 to 200 m (Figure 16f).
The projectile pitch angles for various scenarios are shown in Figure 17. The black markers mean the allowed angular tolerance.
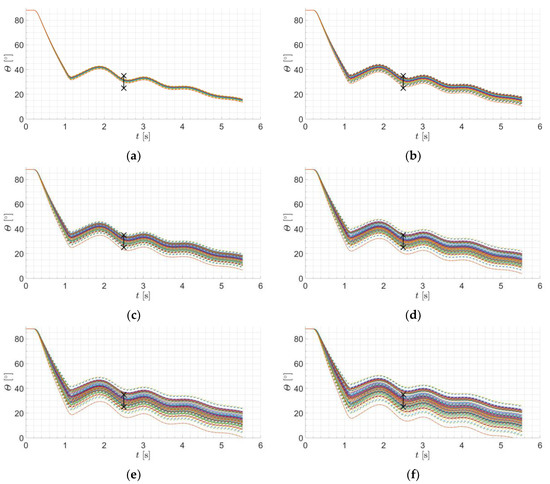
Figure 17.
Projectile pitch angles for various standard deviations: (a) 0.001 s; (b) 0.0003 s; (c) 0.005 s; (d) 0.007 s; (e) 0.009 s; (f) 0.011 s.
The obtained results indicate that the projectile’s pitch angle depends on igniters’ repeatability. That means that lateral thrusters’ ignition uncertainties’ should be as small as possible to achieve greater maneuver repeatability.
Using the pitch angles from Figure 17, which occurred in the first 2.5 s of the flight, a set of histograms has been obtained (Figure 18).
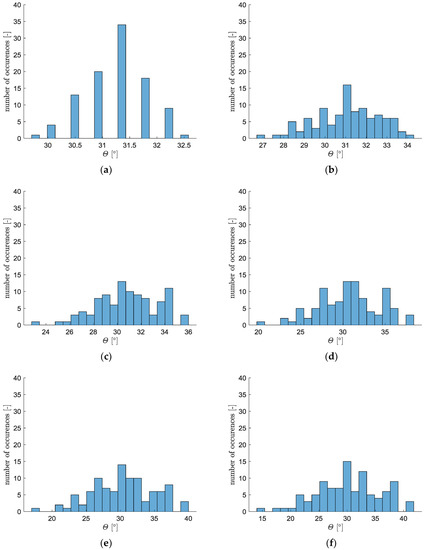
Figure 18.
Projectile pitch angles histograms (3 s of flight) for various standard deviations: (a) 0.001 s; (b) 0.0003 s; (c) 0.005 s; (d) 0.007 s; (e) 0.009 s; (f) 0.011 s.
The more bins concentrated around the nominal value of the pitch angle, the better. The histograms are more flattened for larger standard deviations of and . In Figure 18a,b, all projectiles fall into the assumed tolerance 31.5° ± 5°. In Figure 18c some of the missiles achieved pitch angles out of the allowed range. It was found that the requirement of deviation ±5° from the nominal value 31.5° of the pitch angle in 2.5 s of flight could be met when the lateral thrusters’ ignition time standard deviation is smaller than or equal to 0.003 s. For larger uncertainties, the obtained trajectories are too flat or too steep when compared to the commanded value. In the last considered scenario (Figure 18f) the dispersion was the largest, and the angle achieved falls within the range from 15° up to 41°, which is totally unacceptable.
The results of the numerical simulations were used to formulate the requirements on the parameters of the motor igniters and the onboard computer. The safety analysis was evaluated before the real tests. The worst-case scenario which defines the geometric parameters of the required area for tests is when the recovery system fails and the projectile flies at ballistic flight at the maximum range. It was concluded from the numerical simulations that the circular area with a radius of 700 m from the launch point on the missile test range must be prepared to ensure the required level of safety.
3.2. Ground Tests
Ground tests were performed before the flight trials to investigate the influence of the delay ignition of the second lateral motor on the resulting pitch angle. The projectile was mounted on a test stand in such a way that the missile was free to rotate around the lateral axis. High-quality bearings were used to minimize friction between the supporting frame and the rotation axis. Several experiments for various delay combinations were performed. The lateral motors in ground tests were located before the center of mass. In Figure 19 the photos of test number 1 from a high-speed camera are presented. Below each picture, there is a timestamp measured from the first thruster ignition.
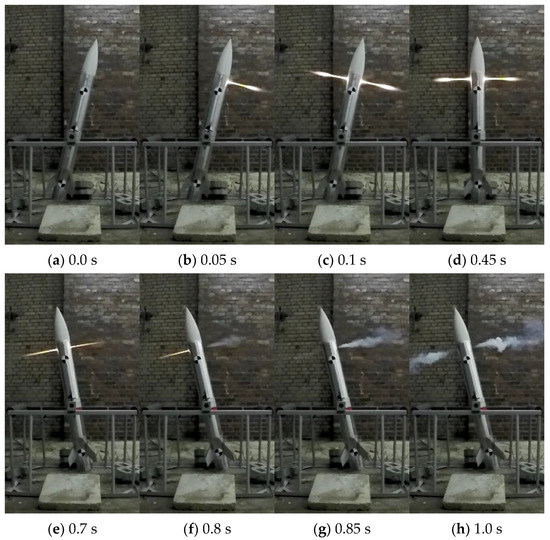
Figure 19.
Ground tests of the lateral thrusters (test 1).
The three circular black and white visual markers were added at the projectile’s surface to measure the attitude precisely. At the beginning of the experiment, the projectile was at rest and the rotation was initialized by the first motor firing up (Figure 19a, the flame is still invisible). Next, the second motor firing took place (Figure 19b), and when both thrusters operated simultaneously (Figure 19c–e) the lateral forces approximately balanced each other, but the projectile still rotated at a nearly constant angular rate. When the first thruster expells the propellant, the rotation slows down (Figure 19f). Finally, the second thruster also ends its operation (Figure 19g) and the final pitch angle is achieved (Figure 19h). The obtained relations between thruster ignition delays and the pitch angles for the four ground tests are presented in Table 4. The ignition delay was calculated as a time difference between the firing of the second and first lateral thrusters.

Table 4.
Ground tests results.
The difference in total angle between test number 2 and 3 is very small (only 1.49°), which means that the thrusters’ repeatability influenced the results.
3.3. Flight Tests
After completing laboratory trials, flight tests were conducted in the form of ground firings in June and July 2019. The main goals of tests were to check the integration of the whole system and investigate the cold launch maneuver repeatability. The projectile was launched with a stationary launcher (Figure 20).
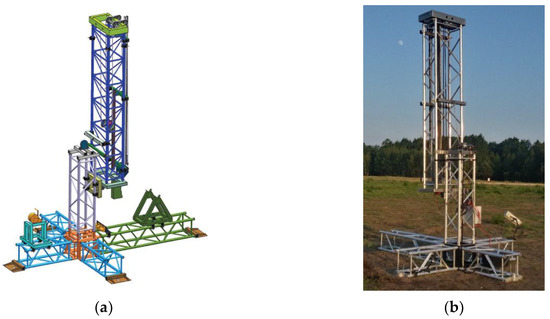
Figure 20.
(a) The 3D CAD model of the launcher; (b) the launcher fully deployed before flight tests.
The projectile was mounted to the rails with two sliders. The projectile launch was initiated remotely. The missile was ejected by an elastic rope. A set of high-speed cameras (Memrecam HX-3, GoPro Hero 7, NIKON D7200) was put around the launcher to observe the launch phase from various directions. Additionally, a quadcopter unmanned aerial vehicle equipped in the camera was used to observe the test range and localize the impact points of the projectiles.
Thirteen projectiles were fired during the flight tests for both thrusters’ locations. It was assumed that the whole test campaign would be graded positive if at least four tests were to be completed successfully. In six firings the lateral thrusters were mounted behind the center of mass and in seven trials after. In 11 launches the maneuver was completed successfully. Two tests (1 and 13) failed due to mechanical fracture of the thrusters’ propellant grain, and as a result, only one motor worked. The control channels’ parameters were programmed before each flight and adjusted according to the obtained results to achieve the best projectile performance.
The measured wind velocity in the first series of firings (tests from 1 to 7) was below 2 m/s with gusts up to 2.5 m/s. In the second series (tests from 9 to 13) the wind speed was between 3.5 m/s and 5.5 m/s.
The registered data are necessary for model validation [51]. Next, the model after firing trials was re-tuned based on acquired data and the simulations were completed again. Some of the results from research are presented below.
In test number 3 the thrusters were mounted before the center of mass. The commanded pitch angle (achieved at main motor firing) was set to 45°. After laboratory trials it was concluded that it is better to define the commanded angle at main motor ignition, rather than after burnout. The first thruster ignition delay was set to = 0.5 s, the second thruster = 0.6 s, main motor ignition = 1.25 s and the parachute deployment 5.9 s. In Figure 21 the footage of the launch phase from flight number 3 is shown. Below each photo, time measured from the launch command (which takes place at = 0 s) is presented.
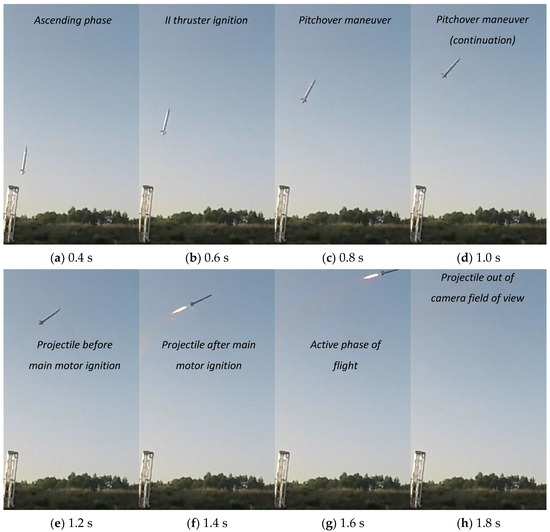
Figure 21.
The launch phase of the missile (test 3, lateral thrusters before the center of mass).
The main motor firing takes place when the center of mass of the missile is at a height of ≅12 m from the ground (Figure 21e,f). The final pitch angle of the missile when the main motor ignition took place was approximately 32.5°, which is significantly smaller than the commanded value 45°.
The registered data were used to validate the developed projectile model. The convention of the sensors axes is presented in Figure 22.
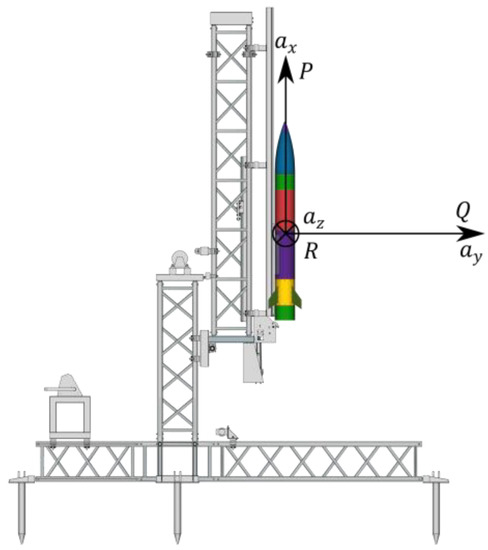
Figure 22.
Sensor axis convention (projectile ready to launch).
In Figure 23, the accelerations measured during flight tests and obtained from the numerical simulation (after re-tuning of the model) are presented. The vertical dashed lines mean the times of control channel activation: the first lateral thruster (black), the second lateral thruster (blue), main motor ignition (red) and recovery system deployment (green).
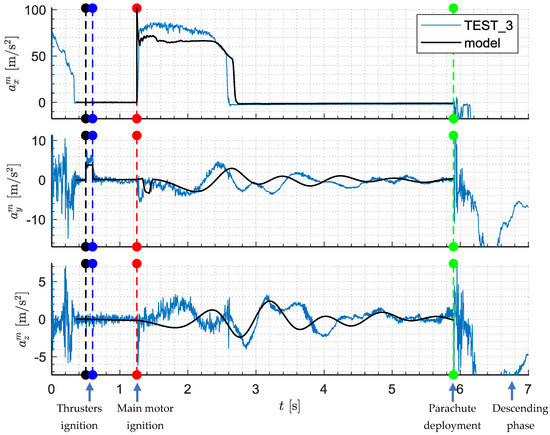
Figure 23.
Accelerations (test 3, lateral thrusters before the center of mass).
Time 0 s corresponds with the launch command. The initial peak and oscillations which are visible in acceleration before 0.3 s resulted from the projectile motion along rails because the projectile was accelerated by an elastic rope. Similarly, on and between 0 s and 0.3 s a significant oscillation occurred because of the launcher lateral vibrations. The main motor firing took place in 1.2 s, which is visible as a nearly rectangular pulse on the axis. Small differences between measurement and the model are the result of properties of the propellant grain and temperature effects. After the first lateral thruster firing at a rectangular pulse occurred. Similarly, from when the first motor expelled the propellant, a second peak is visible at 1.2 s with the opposite sign. The main motor firing took place when the thrusters already operated. The disturbances after 5.9 s on all the axes are results of parachute deployment and deceleration of the missile. The rest of the flight was not shown because the projectile was descending on the parachute and this portion of flight is not important for the considerations presented here.
Figure 24 presents a comparison of angular rates .
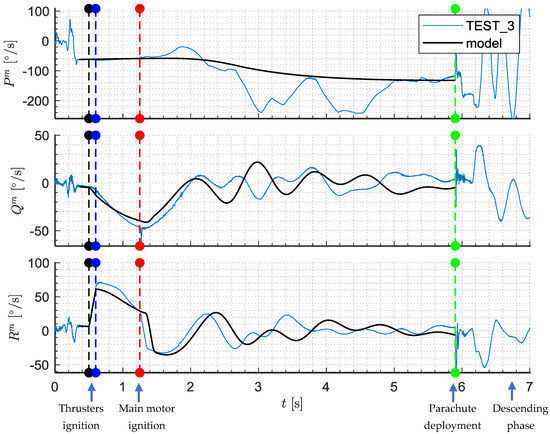
Figure 24.
Angular rates (test 3, lateral thrusters before the center of mass).
The initial roll rate after launcher clearance was approximately −60°/s. In the ideal situation, it should be 0°/s. It was concluded that launcher rail misalignments occurred. The roll rate changes with time due to fin mounting errors. The obtained results show that the fin misalignment was greater (approximately 0.3°) than assumed in preliminary simulations (nearly 0°). Some differences between the model and reality were observed, especially after main motor burnout. The roll rate oscillates between −100°/s and −240°/s. This effect might be explained by the fact that some of the fins were shadowed from inflow by the projectile fuselage and other fins. As a result, asymmetric flow occurred and the additional rolling moment was generated. These phenomena were not fully predicted in the model. The ignition of the first lateral thruster resulted in changing the yaw rate of the projectile. When the second thruster was fired, decreased. Pitch rate also changed because of the roll of the missile and motion coupling in two lateral channels.
A similar analysis was conducted for the thrusters mounted behind the center of mass. In test 5 the commanded pitch angle was assumed to be 45° (the same as in test number 3). The value of was again set to 0.5 s, = 0.6 s, and = 1.250 s. The activation of the parachute was set to 3.9 s. The video footage for test number 5 is presented in Figure 25.
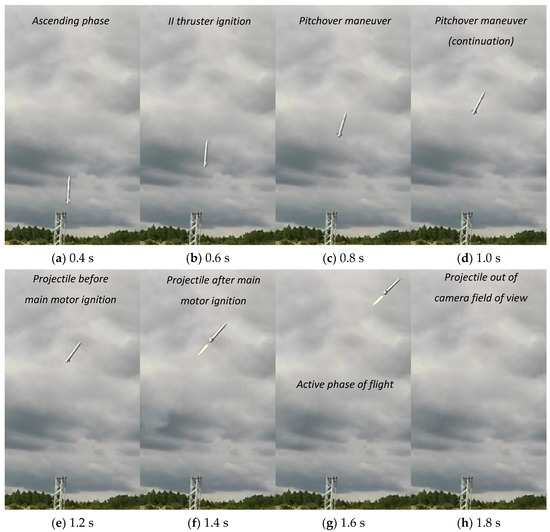
Figure 25.
The launch phase of the missile (test 5, lateral thrusters behind the center of mass).
The missile pitch angle at main motor firing (Figure 25f) was approximately 52.5°, which is more than the desired value 45°.
The accelerations measured in test number 5 are presented in Figure 26, and angular rates in Figure 27.
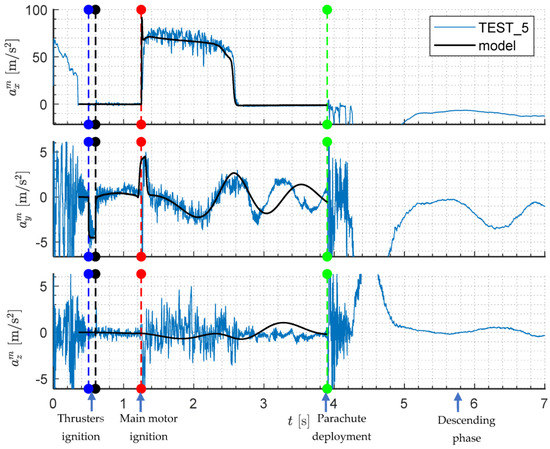
Figure 26.
Accelerations (test 5, lateral thrusters behind the center of mass).
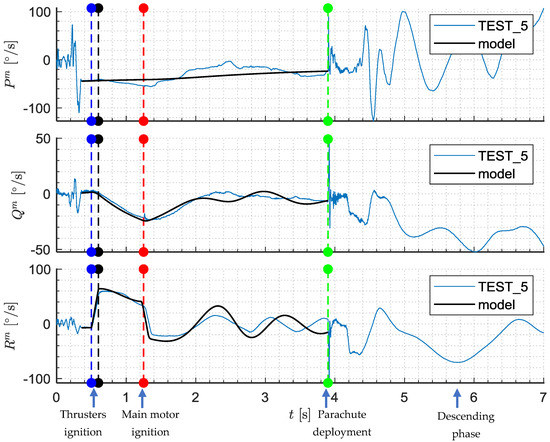
Figure 27.
Angular rates (test 5, thrusters mounted behind the center of mass).
Two rectangular pulses resulting from lateral thrusters’ firings are visible on . Both lines of acceleration are very close to each other up to 2.8 s. After 2.8 s a small divergence between model and experimental data was observed, which resulted from the aerodynamic data inaccuracies. Similarly, obtained from the model after 2.8 s was too high. Parachute deployment took place at 3.9 s. The maximum peak on all three axes was achieved at 4.5 s.
The oscillations on all three axes before 0.3 s resulted from movement along rails. The roll rate after leaving the launcher was –40°/s. That means that the projectile rotates anticlockwise (looking from the base) and the rails’ misalignment is so significant that it cannot be neglected in the analysis. The roll rate decreases and increases again. Probably, the main motor roll damping affects the projectile dynamics. The firing of thrusters influences the pitch rate . The pitch damping in the model after 2 s is a bit underestimated. It must be remembered that semi-empirical codes were used to predict most of the aerodynamic coefficients (especially dynamic damping moments) and this method has limited accuracy. After the first thruster firing a characteristic trapezoidal pulse at occurred. The main motor ignition caused that the damping yawing motion appeared. The model after re-tuning agrees quite well with the experimental data. After parachute deployment at 3.9 s a significant rotation about all three projectile axes took place.
The summary of the flight tests is presented in Table 5. The nominal firing times are shown. Projectile Euler angles, linear velocities, and position coordinates were estimated offline using registered angular rates and linear accelerations.

Table 5.
Summary of the flight tests results.
In test number 9 the projectile was seriously damaged due to touchdown and the IMU data from the flight recorder were lost. It might be concluded that eight from the overall 13 flights ended positively (61.6%) and three partially positively (23%). According to formulated earlier criteria (at least four positive trials), the whole test campaign was graded successfully.
The projectile’s impact point locations obtained in the experiment are shown in Figure 28. The GPS (Global Positioning System) receivers have been used to acquire the geographical coordinates of the projectiles after landing. Predicted lateral dispersion has been marked with blue lines and in an ideal situation; all impact points should lie between them. A safety factor equal to three (when related to the preliminary theoretical predictions) was applied to define these borders.
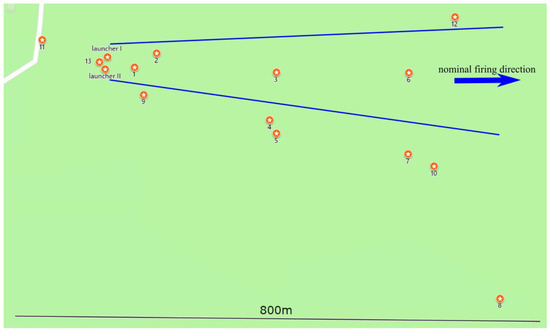
Figure 28.
The impact point locations (north direction at the top of the map).
A significant dispersion in the nominal launch direction has been observed. Projectiles 1, 2, and 9 landed too close to the launcher due to lateral motor failures (test 1 and 9) or were too high in roll rate (test 2). Projectiles 11 and 13 landed behind the launcher (thruster failure occurred in both trials and only one motor was operational). Projectile number 8 landed further than other missiles and on the right side of the demanded flight direction because of the broken parachute cord (the object was not slowed down properly by the rescue system). The obtained results indicate that the real dispersion was greater than in preliminary simulations (some of the points are located outside the allowed borders). Regardless of this fact, the goals of the flight trials were achieved.
The estimates from flight data and predicted projectile location coordinates (projections on ground plane) at parachute deployment are presented in Figure 29.
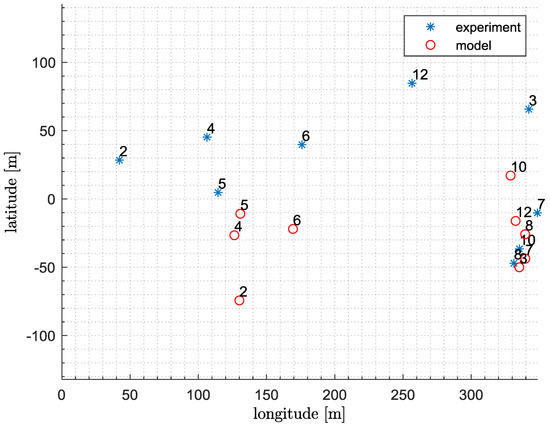
Figure 29.
Displacements at parachute deployment (origin of the coordinate frame centered at launcher location in the first phase of tests, positive latitude to the north, positive longitude to the east).
The data for tests 1, 11, and 13 are not shown because these trials were not relevant. In flight 9 onboard registered data were lost because of uncontrolled touchdown of the projectile. The locations of points at parachute deployment are different from ground impact points (Figure 28) because of wind that influenced the projectile’s motion during the descending phase. The projectile fell not ideally vertically, but moved laterally due to wind gusts. The dispersion at the parachute deployment is smaller than on the ground. The predictions from the developed model are not very precise. Due to that, a safety area was defined during the flight tests.
In Figure 30 the scatter plot of measured and predicted pitch angles at the main motor ignition is shown. The pitch angles were measured using image processing methods on the launch phase footage.
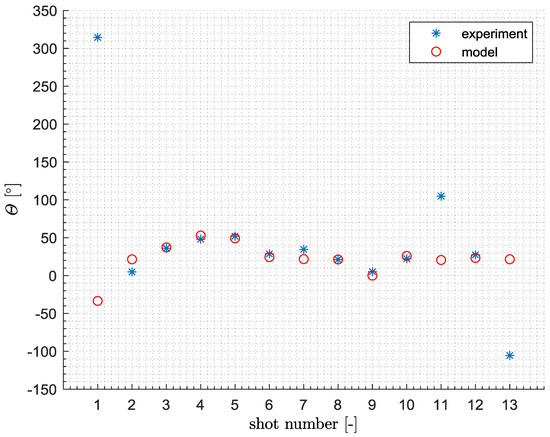
Figure 30.
Dispersion of pitch angles at main motor firing (obtained from video footage and numerical simulation).
Quite a high dispersion of pitch angles was observed in the experiments. The pitch angle at main motor ignition for tests 1, 11, and 13 was beyond the scope of interest because only one lateral thruster worked properly and the projectile rotated too much around the center of mass. For that reason, for these three trials the differences between the model and experiments are very large. For other cases, the measured pitch angle varied from 4.8° up to 52°. For cases 2–10 and 12 the model coincides quite well with the experimental data.
In Figure 31a the projectile velocities (in frame) for flight test number 3 calculated using the simulation and estimated from flight tests are presented. In Figure 31b the comparison of numerically predicted and estimated positions (in coordinate system) is shown. In Figure 31c Euler angles are compared.
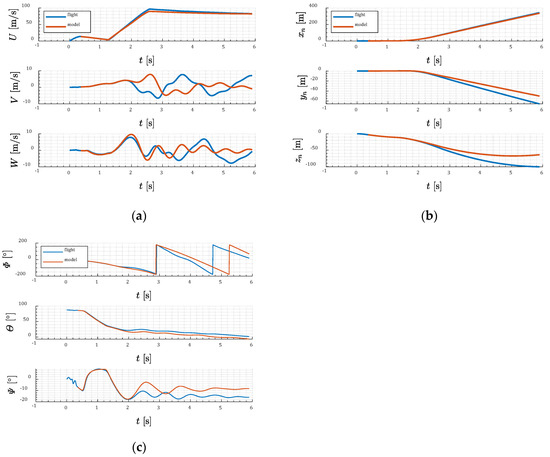
Figure 31.
(a) Projectile velocity; (b) projectile position (test 3, lateral thrusters before the center of mass); (c) Euler angles.
The axial velocity decreases in the ascending, unpowered phase of flight. Next, the main motor ignition takes place and the projectile accelerates. The maximum projectile velocity in the experiment was approximately 90 m/s. Later, in the passive portion of the flight, the projectile velocity decreases again due to aerodynamic drag. The lateral components and are much smaller in magnitude and some damped oscillatory motion is clearly visible. Some differences between the model and experiments were observed due to uncertainties in aerodynamic characteristics.
The projectile moved laterally (in left) from the vertical shoot plane . The flight ended at the moment of parachute deployment, so this is not the same as ground position (after projectile fall).
The roll, pitch, and yaw angles agree well up to 2 s of flight. After main motor burnout the predicted roll and pitch yaw angles diverges from experimental data.
A similar analysis was performed for test number 5. The obtained velocities (in a body-fixed axis system ) are presented in Figure 32a and the position (in frame) is shown in Figure 32b. In Figure 32c the comparisons of roll, pitch, and yaw angles are presented.
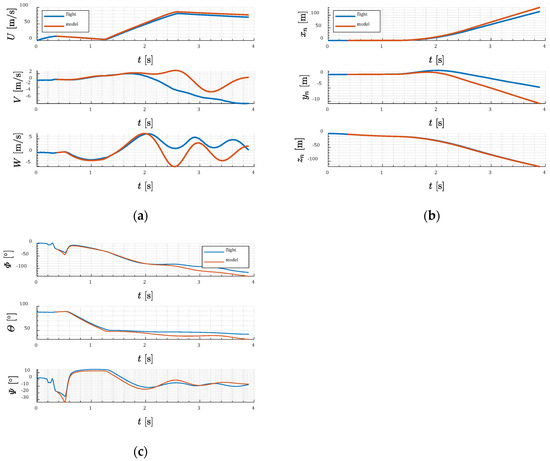
Figure 32.
(a) Projectile velocity; (b) projectile position (test 5, thrusters mounted behind the center of mass); (c) Euler angles.
The main motor firing took place when the projectile velocity was nearly 4 m/s. The maximum velocity did not exceed 90 m/s. The oscillations occurred in and velocity components.
The achieved range was about 110 m. The projectile moved left from the demanded flight direction. The maximum height was approximately 150 m above the ground. After 2 s of flight, some divergence between model and flight data was observed.
Roll, pitch, and yaw angles obtained from the experiment and simulation are quite similar. After main motor burnout, predicted pitch angle diverges from the measured value.
Next, some additional analysis was performed to evaluate model accuracy. The differences in time between the values of signals obtained from the model and the inertial measurement unit flight data were calculated. Later, the mean values of the differences were obtained; 90th percentiles for absolute values of differences were calculated. The smaller the errors are, the more reliable the model is. In Table 6 the mean errors and 90th percentile values for the , , coordinates and roll, pitch, and yaw angles for the differences between the model and flight data for the phase of flight from launch guide clearance to main motor ignition are shown.

Table 6.
Mean error and 90th percentile (from launch guide clearance to main motor ignition).
For test number 9 the data from IMU were unavailable, and estimation of true projectile attitude and position was impossible. In tests 1, 11, and 13 the mean error for Euler angles is significantly larger than for other cases due to lateral motor failures (these tests were not relevant). The model was not designed to analyze such scenarios. Due to those reasons, data for these flights are not shown. Neglecting the abovementioned four trials, it might be concluded that the mean error of position is not larger than −1.1704 m in the worst case (test number 12, coordinate). The mean error of attitude is smaller than 7.1416° (test number 2, roll angle).
In Table 7, calculated errors for the phase of flight from the main motor ignition to parachute deployment are presented.

Table 7.
Mean error and 90th percentile (from main motor ignition to parachute deployment).
The mean errors for phase of flight from the main motor ignition to parachute deployment are larger than for the first portion of trajectory. It might be concluded that model possesses quite good relevance for the turnover maneuver, but for the later phases of flight the accuracy is smaller, mainly due to aerodynamic characteristics uncertainties.
4. Conclusions
Various disturbances could affect the quick turn maneuver of the vertically cold launched missile and deteriorate the projectile performance. This paper presents a parametric analysis of uncertainties that could affect the rapid turn maneuver. It has been postulated that for a missile that is uncontrolled in roll channel, only two thrusters located at the opposite sides of the fuselage are required to successfully complete the maneuver and achieve small projectile dispersion. The contribution of this paper to the existing literature is the understanding of how these disturbances influence the initial phase of flight. This work confirmed the numerical simulation results presented in [19]. It also extends the research presented by Ożóg in [21].
First, using the 6DoF numerical simulations, it was discovered that important sources of disturbances are launch uncertainties, especially initial angular velocity . It was shown that the initial roll rate of the projectile could influence significantly the achieved pitch angle, because the projectile rotates freely around the longitudinal axis. To achieve the nominal pitch angle, forces generated by lateral thrusters should lie ideally in the vertical plane. Such a situation is difficult to obtain in reality due to the projectile’s very slow axial spin after launcher exit. The initial roll rate should be minimized to ensure the high repeatability of the rapid turn maneuver.
Second, the maneuver repeatability is influenced by the time delays of lateral thrusters and main motor igniters. To achieve the maximal launch replicability, the igniters of side thrusters should be as close to the nominal values as possible. To ensure proper completion of the rapid turn maneuver, the uncertainties must be below some thresholds. Using Monte-Carlo analysis it was obtained that when the commanded pitch angle (after main motor burnout) was set to 31.5° with tolerance ±5°, the standard deviation of ignition time should be below 0.003 s. For igniter uncertainties greater than 0.003 s the resulting projectile dispersion was unacceptably high. The same effects occurred during flight tests. From the IMU data and fast-camera footages it was found that the delay time of igniters was smaller than 0.01 s (the exact value was difficult to measure).
Third, the flight tests have shown that the main motor ignition cannot take place too late, and that it optimally should be realized after the first lateral thruster ignition. In test 2 the main motor started operation after lateral thrusters’ burnout, and as a result, the projectile hit the ground immediately after launch (the pitch angle achieved was too small).
Fourth, the linear accelerations’ and angular rates’ time histories for the agile turn maneuver were obtained during real firings. To realize the maneuver, the thrusters should be located as far from the center of mass as possible to ensure a greater pitching moment arm. The locations of the thrusters do not influence the pitch angle only if the arm length is the same for both steering kits. It was experimentally proved that the minimum number of thrusters which allows one to realize the rapid turn and achieve nominal trajectory is two, which confirms the thesis presented in [18]. The flight tests fill partially the gap in the publicly available literature on the subject of cold vertical launch. It extends significantly the knowledge about cold vertical launch presented up to this time.
Fifth, the model of the missile we developed was validated using real data obtained from the onboard inertial measurement unit and could be used in further investigations. The model of the inertial measurement unit was used to simulate the sensor outputs. In the post analysis phase, it was found that the fin misalignment in reality was greater than assumed in pre-flight simulations. It caused the additional spin driving moment to occur. Aerodynamic characteristics must be estimated precisely to match the model response to flight data. On the other hand, in the real firings quite a high lateral dispersion was observed, which means that the lack of roll stabilization in a cold launched missile is a significant challenge. A high degree of reliability of the missile components must be ensured to realize rapid turn properly.
The interest in developing vertically cold launched projectiles probably will grow in the near future. Further investigations should concentrate on more flight tests in various weather conditions to investigate the influences of wind on rapid-turn repeatability. Equipping the projectile with more lateral thrusters should also be considered. Roll stabilized control might be implemented. Closed-loop control could be utilized to improve the maneuver repeatability.
Author Contributions
Conceptualization, R.G. and M.J.; methodology, M.J.; software, M.J.; validation, M.J.; formal analysis, R.G.; investigation, J.M.; resources, R.G.; writing—original draft preparation, M.J.; writing—review and editing, R.G. and M.J.; visualization, M.J.; supervision, R.G.; project administration, R.G.; funding acquisition, R.G. Both authors have read and agreed to the published version of the manuscript.
Funding
This research was funded by The National Centre for Research and Development (NCBiR), grant number DOB-BIO8/10/01/2016 ”Projectiles control system technology development.”
Acknowledgments
Special thanks to the Institute of Aviation and Mesko S.A. for preparing and conducting the ground experiments and flight tests.
Conflicts of Interest
The authors declare no conflict of interest. The funders had no role in the design of the study; in the collection, analyses, or interpretation of data; in the writing of the manuscript, or in the decision to publish the results.
Notation
The following symbols and abbreviations are used in this manuscript:
| Latin symbols | |
| linear accelerations, [m/s2] | |
| linear accelerations measured by IMU, [m/s2] | |
| linear accelerations at IMU location, [m/s2] | |
| bias vector for accelerometers, [m/s2] | |
| bias vector for gyroscopes, [°/s] | |
| bias factors for accelerometers, [m/s2] | |
| bias factors for gyroscopes, [°/s] | |
| rolling, pitching, and yawing moments coefficients, [-] | |
| roll, pitch, and yaw damping moments coefficients, [-] | |
| axial, side, and normal force coefficients, [-] | |
| projectile diameter, [m] | |
| quaternion elements, [-] | |
| quaternion norm, [-] | |
| aerodynamic forces, [N] | |
| total forces in body-fixed frame | |
| gravity forces, [N] | |
| forces generated by lateral thrusters, [N] | |
| forces generated by main motor, [N] | |
| gravity acceleration, [m/s2] | |
| altitude, [m] | |
| numerical integration step, [s] | |
| coefficient which drives the norm of the quaternion state vector to 1.0, [-] | |
| accelerometers scaling matrix, [-] | |
| gyroscopes scaling matrix, [-] | |
| number of the thruster, [-] | |
| inertia matrix, [kgm2] | |
| moments of inertia before main motor burnout, [kgm2] | |
| moments of inertia after main motor burnout, [kgm2] | |
| rolling, pitching, and yawing moment in the body-fixed frame with respect to the center of mass, [Nm] | |
| projectile mass, [kg] | |
| projectile initial mass, [kg] | |
| projectile mass after main motor burnout, [kg] | |
| aerodynamic moments, [Nm] | |
| total moments in body-fixed frame , [Nm] | |
| moments due to gravity, [Nm] | |
| moments due to lateral thrusters, [Nm] | |
| moments due to main motor, [Nm] | |
| number of lateral thrusters, [-] | |
| projectile angular rates in the body-fixed frame , [°/s] | |
| projectile angular rates measured by IMU, [°/s] | |
| vector describing the position of IMU in the body-fixed frame , [m] | |
| scale factors for accelerometers, [-] | |
| scale factors for gyroscopes, [-] | |
| projectile cross section area, [m2] | |
| time, [s] | |
| matrix of transformation from the body-fixed frame to IMU axis, [-] | |
| main motor thrust force, [N] | |
| lateral thruster magnitude, [N] | |
| projectile linear velocities in the body-fixed frame , [m/s] | |
| vector of accelerometers noise, [m/s2] | |
| vector of gyroscopes noise, [°/s] | |
| accelerometers noise, [m/s2] | |
| gyroscopes noise, [°/s] | |
| total flight velocity, [m/s] | |
| the actual center of mass location (from the projectile base), [m] | |
| the initial center of mass location (from the projectile base), [m] | |
| center of mass location after main motor burnout (from the projectile base), [m] | |
| inertial measurement unit location coordinates (from the projectile base), [m] | |
| lateral thruster location coordinate (from the projectile base), [m] | |
| projectile center of mass coordinates in the frame , [m] | |
| axial, side and normal force in the body-fixed frame , [N] | |
| Greek symbols | |
| projectile roll, pitch, and yaw angles, respectively, [°] | |
| IMU enclosure misalignment angles with respect to the body-fixed frame , [°] | |
| pitch misalignment angle of the main motor thrust, [°] | |
| air density, [kg/m3] | |
| first lateral thruster firing time delay, [s] | |
| second lateral thruster firing time delay, [s] | |
| the main motor firing time delay, [s] | |
| yaw misalignment angle of the main motor thrust, [°] | |
| vector of angular rates in the body-fixed frame , [°/s] | |
| Abbreviations | |
| CPU | central processing unit |
| IMU | inertial measurement unit |
| DOF | degree of freedom |
| LSB | least significant bit |
| MEMS | microelectromechanical systems |
References
- Yagla, J.; Anderson, L., Jr. Internal ballistics and missile launch environment for the Vertical Launching System. In Proceedings of the 3rd Joint Thermophysics, Fluids, Plasma and Heat Transfer Conference, St. Louis, MO, USA, 7–11 June 1982. [Google Scholar] [CrossRef]
- Qi, Q.; Chen, Q.; Zhou, Y.; Wang, H.; Zhou, H. Submarine-Launched Cruise Missile Ejecting Launch Simulation and Research. In Proceedings of the 2011 International Conference on Electronic & Mechanical Engineering and Information Technology, Harbin, China, 12–14 August 2011. [Google Scholar] [CrossRef]
- Ma, G.; Chen, F.; Yu, J.; Wang, K.; Jiang, S. Effects of Uncertainties in the Launch Parameters on the Pressure-Equalizing Air Film Around a Vertically Launched Underwater Vehicle. J. Fluids Eng. 2019, 141, 104501. [Google Scholar] [CrossRef]
- Jia-Yi, C.; Chuan-Jing, L.; Ying, C.; Xin, C.; Jie, L. Research on the base cavity of a sub-launched projectile. J. Hydrodynam. 2012, 24, 244–249. [Google Scholar] [CrossRef]
- Wang, Z.L.; Kong, F.S.; Li, H.P. Research on Cylindrical Launcher with Cylindrical Launch Parameters Simulation. Adv. Mat. Res. 2014, 886, 422–425. [Google Scholar] [CrossRef]
- Titchener, P.E.; Veitch, A.J. UK Soft Vertical Launch—A Flexible Solution to an Integral Concept for Ground & Naval Air Defence. In Proceedings of the System Concepts for Integrated Air Defense of Multinational Mobile Crisis Reaction Forces, Valencia, Spain, 22–24 May 2000. [Google Scholar]
- Arkhangelsky, I.I.; Afanasev, P.P.; Golubev, I.S. Design of Guided Anti-Aircraft Missiles (In Russian); Izdatelstva MAI: Moscow, Russia, 2001. [Google Scholar]
- Alberding, M.R.; Ciappi, J.I. Cold—Gas munitions launch system. US Patent US 2008/0148927 A1, 15 July 2008. [Google Scholar]
- Liu, F.; Wang, L. Research on the thrust vector control via jet vane in rapid turning of vertical launch. In Proceedings of the 2013 2nd International Conference on Measurement, Information and Control, Harbin, China, 16–18 August 2013; pp. 837–842. [Google Scholar] [CrossRef]
- Tekin, R.; Ateşoğlu, Ö.; Leblebicioğlu, K. Modeling and Vertical Launch Analysis of an Aero and Thrust Vector Controlled Surface to Air Missile. In Proceedings of the AIAA Atmospheric Flight Mechanics Conference, Toronto, ON, Canada, 2–5 August 2010. [Google Scholar] [CrossRef]
- Zhang, H.; Li, F.; Fan, Y. Design of Vertical Launch Control System for Antiaircraft Missile Using Optical Control. In Proceedings of the 2010 International Conference on Measuring Technology and Mechatronics Automation, Changsha City, China, 13–14 March 2010; pp. 1068–1071. [Google Scholar] [CrossRef]
- Jonsson, H.-O.; Malmberg, G. Optimal Thrust Vector Control for Vertical Launch of Tactical Missiles. J. Guid. Control Dyn. 1982, 5, 17–21. [Google Scholar] [CrossRef]
- Lichota, P.; Jacewicz, M.; Szulczyk, J. Spinning gasodynamic projectile system identification experiment design. Aircr. Eng. Aerosp. Technol. 2020, 92, 452–459. [Google Scholar] [CrossRef]
- Burchett, B. Predictive Optimal Pulse-jet Control for Symmetric Projectiles. In Proceedings of the AIAA Atmospheric Flight Mechanics Conference, National Harbor, MD, USA, 13–17 January 2014. [Google Scholar] [CrossRef]
- Jitpraphai, T.; Costello, M. Dispersion Reduction of a Direct-Fire Rocket Using Lateral Pulse Jets. J. Spacecr. Rocket. 2001, 38, 929–936. [Google Scholar] [CrossRef]
- Burchett, B.T. Genetic Algorithm Optimization of Hydra Pulse Jet Controller. In Proceedings of the AIAA Atmospheric Flight Mechanics Conference and Exhibit, Honolulu, HI, USA, 18–21 August 2008. [Google Scholar] [CrossRef]
- Burchett, B.; Costello, M. Model Predictive Lateral Pulse Jet Control of an Atmospheric Rocket. J. Guid. Control Dyn. 2002, 25, 860–867. [Google Scholar] [CrossRef]
- Taur, D.-R.; Chern, J.-S. Optimal Side Jet Control for Vertically Cold Launched Tactical Missiles. In Proceedings of the AIAA Guidance, Navigation, and Control Conference and Exhibit, Denver, CO, USA, 14–17 August 2000. [Google Scholar] [CrossRef]
- Jacewicz, M.; Głębocki, R. Simulation study of a missile cold launch system. J. Theor. App. Mech-Pol. 2018, 56, 901–913. [Google Scholar] [CrossRef]
- Głębocki, R.; Jacewicz, M. Missile Vertical Launch System with Reaction Control Jets. Issues Armam. Technol. 2018, 145, 25–46. [Google Scholar] [CrossRef]
- Ożóg, R.; Jacewicz, M.; Głębocki, R. Use of Wind Tunnel Measurements Data in Cold Launched Missile Flight Simulations. Measur. Automat. Robot. 2020, 24, 49–60. [Google Scholar] [CrossRef][Green Version]
- Veitch, A.J.; Machell, A.; Winter, J.W.M.; Harriss, R.T. Launching of Missiles. U.S. Patent 7207254B2, 24 April 2007. [Google Scholar]
- Tekin, R.; Atesoglu, O.; Leblebicioglu, K. Flight Control Algorithms for a Vertical Launch Air Defense Missile. In Proceedings of the 2nd EuroGNC 2013 CEAS Specialist Conference on Guidance, Navigation & Control, Delft, The Netherlands, 10–12 April 2013. [Google Scholar] [CrossRef]
- Harriss, R.T. Thruster Pack for Missile Control. GB Patent GB2316663A, 4 March 1998. [Google Scholar]
- Buchanan, G.; Wright, D. The Development of Rocketry Capability in New Zealand—World Record Rocket and First of Its Kind Rocketry Course. Aerospace 2015, 2, 91–117. [Google Scholar] [CrossRef]
- National Aeronautics and Space Administration. U.S. Standard Atmosphere, 1976; National Aeronautics and Space Administration: Washington, DC, USA, 1976.
- Lichota, P.; Szulczyk, J.; Tischler, M.B.; Berger, T. Frequency Responses Identification from Multi-Axis Maneuver with Simultaneous Multisine Inputs. J. Guid. Control Dyn. 2019, 42, 2550–2556. [Google Scholar] [CrossRef]
- Zipfel, P. Modeling and Simulation of Aerospace Vehicle Dynamics; American Institute of Aeronautics and Astronautics, Inc.: Reston, VA, USA, 2000. [Google Scholar]
- Allerton, D. Principles of Flight Simulation; John Wiley & Sons: Wiltshire, UK, 2009. [Google Scholar]
- Cai, G.; Chen, B.M.; Lee, T.H. Unmanned Rotorcraft Systems; Springer: London, UK, 2011. [Google Scholar]
- Military Handbook. Missile Flight Simulation, (Part One), Surface-To-Air Missiles; Technical Report No. MIL-HDBK-1211; Department of Defense: Arlington, VA, USA, 1995.
- Xiao, H.; Li, S.; Shen, Q.; Li, H.; Wang, Q. Automatic Positioning of Spinning Projectile in Trajectory Correction Fuze via GPS/IMU Integration. In Proceedings of the 2007 International Conference on Mechatronics and Automation, Harbin, China, 5–8 August 2007. [Google Scholar] [CrossRef]
- Liu, J.; Zhao, T. In-flight alignment method of navigation system based on microelectromechanical systems sensor measurement. Int. J. Distrib. Sens. N. 2019, 15. [Google Scholar] [CrossRef]
- Xing, H.; Chen, Z.; Yang, H.; Wang, C.; Lin, Z.; Guo, M. Self-Alignment MEMS IMU Method Based on the Rotation Modulation Technique on a Swing Base. Sensors 2018, 18, 1178. [Google Scholar] [CrossRef] [PubMed]
- Analog Devices. Available online: https://www.analog.com/media/en/technical-documentation/data-sheets/adis16448.pdf (accessed on 4 July 2020).
- Fairfax, L.D.; Fresconi, F.E. Position Estimation for Projectiles Using Low-cost Sensors and Flight Dynamics. J. Aerospace Eng. 2012, 27, 611–620. [Google Scholar] [CrossRef]
- Pamadi, K.B.; Ohlmeyer, E.J.; Pepitone, T.R. Assessment of a GPS Guided Spinning Projectile Using an Accelerometer-Only IMU. In Proceedings of the AIAA Guidance, Navigation, and Control Conference and Exhibit, Providence, RI, USA, 16–19 August 2004. [Google Scholar] [CrossRef]
- Liu, F.; Su, Z.; Zhao, H.; Li, Q.; Li, C. Attitude Measurement for High-Spinning Projectile with a Hollow MEMS IMU Consisting of Multiple Accelerometers and Gyros. Sensors 2019, 19, 1799. [Google Scholar] [CrossRef] [PubMed]
- Al-Rawashdeh, Y.M.; Elshafei, M.; Al-Malki, M.F. In-Flight Estimation of Center of Gravity Position Using All-Accelerometers. Sensors 2014, 14, 17567–17585. [Google Scholar] [CrossRef] [PubMed]
- Jekeli, C. Inertial Navigation Systems with Geodetic Applications; Walter de Gruyter: Berlin, Germany, 2001. [Google Scholar]
- Sun, W.; Wang, D.; Xu, L.; Xu, L. MEMS-based rotary strapdown inertial navigation system. Measurement 2013, 46, 2585–2596. [Google Scholar] [CrossRef]
- Groves, P.D. Principles of GNSS, Inertial, and Multisensor Integrated Navigation Systems, 2nd ed.; Artech House: London, UK, 2013. [Google Scholar]
- Pretto, A.; Grisetti, G. Calibration and performance evaluation of low-cost IMUs. In Proceedings of the 20th IMEKO TC4 International Symposium and 18th International Workshop on ADC Modelling and Testing. Research on Electric and Electronic Measurement for the Economic Upturn, Benevento, Italy, 15–17 September 2014. [Google Scholar]
- Britting, K.R. Inertial Navigation Systems Analysis; John Wiley & Sons, Inc.: New York, NY, USA, 1971. [Google Scholar]
- Andreev, V.D. Theory of Inertial Navigation Aided Systems; Izdatelstva Nauka: Moscow, Russia, 1967. (In Russian) [Google Scholar]
- Titterton, D.H.; Weston, J.L. Strapdown Inertial Navigation Technology, 2nd ed.; The Institution of Electrical Engineers: London, UK, 2004. [Google Scholar]
- Ilg, M. Multi-Core Computing Cluster for Safety Fan Analysis of Guided Projectiles; Army Research Laboratory: Aberdeen Proving Ground, MD, USA, 2011. [Google Scholar]
- Ilg, M. Guidance, Navigation, and Control System Simulations via Graphics Processor Unit; Army Research Laboratory: Aberdeen Proving Ground, MD, USA, 2011. [Google Scholar]
- Ilg, M.; Rogers, J.; Costello, M. Projectile Monte-Carlo Trajectory Analysis Using a Graphics Processing Unit. In Proceedings of the AIAA Atmospheric Flight Mechanics Conference, Portland, OR, USA, 8–11 August 2011. [Google Scholar] [CrossRef]
- Matsumoto, M.; Nishimura, T. Mersenne twister: A 623-dimensionally equidistributed uniform pseudo-random number generator. ACM Trans. Model. Comput. Simul. 1998, 8, 3–30. [Google Scholar] [CrossRef]
- Lichota, P.; Szulczyk, J.; Noreña, D.A.; Vallejo Monsalve, F.A. Power spectrum optimization in the design of multisine manoeuvre for identification purposes. J. Theor. App. Mech-Pol. 2017, 55, 1193–1203. [Google Scholar] [CrossRef]
Publisher’s Note: MDPI stays neutral with regard to jurisdictional claims in published maps and institutional affiliations. |
© 2020 by the authors. Licensee MDPI, Basel, Switzerland. This article is an open access article distributed under the terms and conditions of the Creative Commons Attribution (CC BY) license (http://creativecommons.org/licenses/by/4.0/).