Abstract
There have been several recorded mishaps of rotorcraft experiencing flame-out due to engine surge as a result of rapid accumulation of sand and dust on nozzle guide vanes. Minerals such as sodium chloride and albite have lower melting points than quartz and are found to constitute some of the loose sediment on unprepared landing sites in the Persian Gulf. Despite this, they are not found in great abundance, if at all, in many of the test dusts that are used to qualify engines operating in harsh environments. The consequence is an under-prediction of the time to failure due to vane deposit build-up. In the current work, we use a simple model to demonstrate the sensitivity of accumulation efficiency (the proportion of ingested dust that sticks) to mineral dust physico-chemical properties. We utilise the concept of thermal Stokes number to examine the relationship between time to equilibrate and residence time and how this varies as a function of constituent mineral, as well as particle size. The likelihood of impact increases with momentum Stokes number, while the likelihood of adhesion decreases with thermal Stokes number, yet the two both increase with the square of particle diameter. This leads to a peak in deposition rate at a certain particle size. However, dust mineralogy is shown to influence sticking efficiency more than impact efficiency owing to differences in melting point. Finally, we apply our simple model to estimate the mass of dust deposited during a single brownout landing of a Pave Hawk helicopter, using two different commercially-available test dusts.
1. Introduction
By the very nature of their versatility, helicopters are often required to operate at unprepared landing sites. In dry, arid areas, the interaction of the rotor wake with the loose sediment bed creates a dust cloud, the severity of which varies between rotorcraft [1]. When the visual environment has been degraded, the situation is commonly known as brownout. The mishaps resulting from hard brownout landings are common: in one report, they are cited as the primary cause of human-factor-related accidents [2]. However, the safety risks associated with landing in a brownout cloud are not limited to piloting.
The damage to helicopter engines resulting from the deposition of sand and dust is well known. Particles below 10 microns in diameter mostly evade removal by inertial separators [3] and can be pulverised further into smaller particles during passage through the compressor stages [4]. Upon entry to the combustor, a large subset of these is small enough to soften or melt, yet possesses the inertia to adhere to surfaces. The rate of accretion of this deposit layer, and the chemistry of the glass-like material that forms, determines the severity and type of damage to gas turbine engines that results.
Prediction of the resultant damage is made difficult by the multitude of dependent variables. In addition to the physical properties of the particle, the chemical properties can also play a huge role. Experience from the field indicates that two helicopters with the same gas turbine engine could fly identical mission profiles in two separate areas of Southwest Asia, but suffer contrasting maintenance issues. The major difference appears to be geographic location, which suggests that the specific mix of ingested sand may have an important effect on degradation mechanisms [5]. There is also evidence to suggest that the dust composition on the ground is markedly different to what each stage of the gas turbine is subjected to, owing to physical sorting processes along the way [6].
The significance of this is perhaps most apparent in engine susceptibility tests. To demonstrate compliance, engines must undergo durability tests with an approved medium, or test dust. These test dusts, such as Arizona road dust, have become commonplace both in full-scale and sub-component rig-scale tests [7]. Recent contributions in numerical simulations also use standard “sands” in deposition modelling [8]. However, their distinctly different chemical compositions lead to inaccurate durability tests. Indeed, recent issues in Afghanistan prompted the U.S. Department of Defence to commission the development of new test media for sand ingestion qualification testing that replicates the phase transition and glass formation that so plagues rotorcraft engines [5].
The consequence of inadequate engine susceptibility tests may lead to a reduced lifetime or, worse, may compromise flight safety [9]. On 17 May 2015, a tiltrotor aircraft was returning to an air base on Hawaii after a routine training sortie and was on its third attempted landing in brownout conditions. One of the engines suffered a compressor surge during a hover landing manoeuvre, and the aircraft crash landed. An investigation carried out after the accident identified deposits of CMAS glass (Calcium-Magnesium-Aluminosilicate) on the turbine NGVs (nozzle guide vanes). It is possible that the reduction in flow path area choked the engine, causing it to surge.
The factors contributing to the rapid build-up of vane deposits are not limited to chemistry; the individual particles must first impact a surface, then dissipate the elastic energy to avoid rebound and adhere by surface forces. The factors influencing this are related, but not limited to the condition of the carrier phase and the receiving substrate. To complicate matters, there are certain combinations of minerals and reactive species that reduce the bulk particulate melting point below that of its constituent particles [5].
The flameout of engines may also occur due to rapid build up of other environmental dusts. Two separate events in the 1980s saw Boeing 747s flying through volcanic ash clouds and experiencing a total loss of power due to build-up of ash on NGVs that had melted in the combustor and solidified on the surfaces. Clarkson et al. [10] used these events in combination with several other, less severe encounters to use what is known as the DEvAC chart, or Duration of Exposure versus Ash Concentration (although the offending particulate also includes sand dust; see Figure 1), to provide a rapid assessment of safe dose levels. The concept of dose rather than concentration is becoming accepted among civil operators and manufacturers as a more useful metric in determining the safe-to-fly limits of a given dust event.
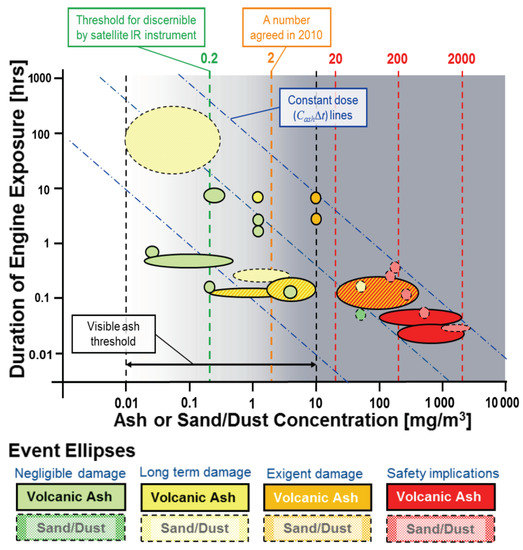
Figure 1.
The duration of exposure versus ash concentration chart, populated with known aircraft encounters with dust clouds and results from the rig test, as taken from [11].
1.1. Dose
Dose is a more useful metric than the concentration alone, because it affords a safety assessment over a trajectory of multiple exposures or varying concentrations. In the case of the tiltrotor crash, three attempts were made to land in brownout conditions, over which time, the dust would have built up and clogged the flow path. The concentration of dust is difficult to estimate, but the Sandblaster 2 dust flight trials on the Yuma Proving Grounds in 2007 [12] measured concentration levels at 1.4 m above the ground of 1600 mg/m. Since brownout intensity is strongly correlated to rotor design parameters [1], it is reasonable to assume that similar concentrations were ingested by the tiltrotor aircraft on Hawaii. For three landing attempts of 20 seconds in duration, this equates to a dose of around 100 gs/m. A re-evaluation of the concentration of the BA009 encounter with the Galunggung volcanic eruption reported in [10] estimated a value of 320 mg/m through back calculations. According to the same reference, this flight experienced two encounters at high power, the first being at least 2 min long and the second being between 3 and 7 min in duration, putting the dose at the same order of magnitude as the tiltrotor crash landing. These events both led to engine failure and are shown as ellipses in the same area of Figure 1, in the bottom right corner.
The proximity of the two contrasting event types is useful: this dose region can be considered as unsafe, to be avoided in flight path planning. However, the size and shape of the ellipses is indicative of the uncertainty in the value. Part of this uncertainty lies in the estimation of the concentration levels at the engine intake, which satellite measurements cannot provide. The duration of exposure is also quite difficult to establish, because particle-laden air can be difficult to discern, and its concentration varies with flight level; on a practical level, exposure events are not formally recorded by the airframe operator. This is an open field of research in atmospheric science and sensor technology.
1.2. Composition
While the dose principle proves useful in comparing and assessing exposure events, its use in understanding the mass and composition of material interacting with engine components in a given time window is less useful. This is because the dust undergoes effective filtering at each stage of the flow path. If the engine is fitted with a particle separator, a large proportion of the mass entering will be removed, and the dose will be reduced. The removal efficiency of particle separators and intake filters varies with particle size, which modifies the particle size distribution of the dust and reduces the mean particle diameter. This helps to reduce erosion, which generally scales with mass impact rate and particle size. However, smaller particles also take less time to equilibrate with the hot gas stream and soften or melt, increasing their likelihood of adhesion to a surface. Furthermore, a study by Smialek found that the composition of dune dust in the size fraction below 20 microns was significantly different to that of the raw dust on the ground [6]. The “as-collected” dust contained 91% silica, whereas the sieved dust contained just 50%. The reduced silica content serves to lower the mean melting temperature of the sample, increasing the likelihood of particle adhesion.
While the intrinsic physical and chemical composition are dominant factors in the accumulation of ingested material on to engine surfaces, but are not the only factors. The substrate temperature also plays a large role, as does the level of turbulence, the degree of cooling and the water content of the combustion products. Once the accumulation process has started, there is evidence to suggest that the deposition rate is non-linear [13]. The physical processes responsible for this are not yet fully understood.
1.3. Scope
The overarching aim of our current work is to provide more appropriate boundary conditions for numerical and experimental simulations. Within this, we investigate how sensitive the accumulation efficiency is to particulate physical and chemical composition. We do this via a simple representation of a particle-laden stream leaving the combustor and approaching the high-pressure turbine NGVs. We present the data with non-dimensional parameters to enable their use in any environment-airframe-engine system. We then use these parameters to estimate the mass deposited on the NGVs of a T700-GE-701c engine, during the brownout landing of an HH-60 Pave Hawk.
2. Materials and Methods
We represent the engine as a one-dimensional system composed of several sub-systems, each of which processes the particulate laden flow, modifying its properties. These subsystems are depicted in Figure 2. In the current work, we developed a simple model of particle deposition for the turbine NGVs. We then applied these to the dose principle defined above.
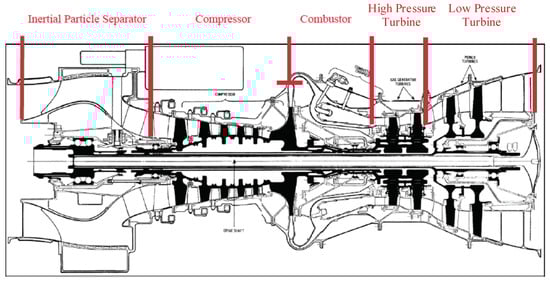
Figure 2.
T700 cutaway drawing, illustrating the sub-system assembly.
2.1. Theory
2.1.1. Dust Dose Model
The dose is defined as the dust concentration multiplied by the duration of exposure:
where is the mass of dust per unit volume of particulate-laden air and is the duration of exposure. The mass flow rate of particles into the engine, , is:
where is the mass of particles per unit mass of engine-bound air (or mass concentration), is the engine mass flow rate, and are the density and volume flow rate, respectively, and the subscripts p and relate to particulate and bulk air-particle mix, respectively. Since it is easier to work with a value of air density, we can express the bulk air-particle density in terms of the dust mass concentration . The mass concentration can be expressed in terms of the air and particle densities and dust volume concentration as:
As the density ratio , the dust mass concentration . The dust density is typically of the order 10 kg/m, whereas the air density is of the order 10 kg/m. Hence, it is reasonable to simplify the dust volume concentration to:
The total mass of particulate ingested into the engine during an exposure period can therefore be expressed in terms of the dose, since:
Hence, for a fixed dust exposure dose, the mass of particulate ingested increases as the freestream air density decreases and the engine mass flow rate increases.
2.1.2. Integrated Inertial Particle Separator
Once the particulate has reached the engine, it will undergo changes in composition and bulk mass, due to filtration effects from the engine inlet protection system. Many helicopters are protected by a barrier filter or a vortex tube pack [14]; the T700 has an Inertial Particle Separator (IPS), which is integrated into the engine inlet. The degree of effectiveness of these systems depends on the particle size, or more accurately the Stokes number, of the particle-fluid-separator system. If the particle size distribution is discretized into size groups of fractional mass , the overall removal efficiency of a particle separator is given as [3]:
where is the separation efficiency of the ith size group, which is a function of the respective Stokes number. The characteristic length in the IPS Stokes number will differ for each type of particle separator, but separator throat height is typically used [15]. The IPS Stokes number is defined as the ratio of particle velocity response time to domain fluid response time and is given as:
where f is the Stokes drag correction factor and is the gas viscosity. The Stokes number can be used to predict with reasonable accuracy the efficiency of an inertial particle separator, according to Barone et al. [7], using:
where J is an empirically-derived constant that is representative of the flow field around the central hump and is the fraction of inlet mass flow rate that is scavenged to carry away separated particles. This conditioning stage may be adopted for other protection systems, or omitted altogether for helicopters without inlet protection.
Since the IPS is not 100% efficient at removing particles, some of the particles continue through to the compressor. The total mass of dust entering the compressor during the exposure event is therefore reduced, in comparison to the mass entering the inlet:
The mean particle size also decreases, as the particle separator performs better at removing the larger particles in the sample. Hence, each size group of the particle size distribution is updated according to Equation (6).
2.1.3. Compressor
There are opportunities for the size distribution and total mass to be modified in the compressor and combustor. In the compressor, studies have shown that the particles above approximately 10 microns are pulverised by the rotating components into smaller sizes [4]. Additionally, a percentage of the mass flow is bled off in later stages of the compressor to service on-board systems or to cool turbine blades [16]. This reduces further the mass of dust reaching the combustor:
The swirl introduced by the rotor blades of the compressor will likely have a centrifuging effect on the dust, which may lead to a greater proportion of dust being removed in the bleed air.
2.1.4. Combustor
It is well known that particle adhesion to the combustor walls may occur during a dust exposure event [17,18]. However, the flow inside the combustor is complex: an unsteady turbulent flow being heated by a flame reaching temperatures of up to 2200 K. A study by Kim and Dunn et al. on the deposition of blends of dusts including feldspars and clays in the hot section of a T56 engine revealed no deposition within the combustor [19]. However, a recent whole-engine test by NASA using Mt. Mazama volcanic ash showed signs of deposition and glazing on the combustor walls [17]. In the absence of any appropriate reduced order model, we exclude deposition in the combustor from our current work.
2.1.5. Turbine
The flow then accelerates towards the NGVs, which turn the flow to drive the first-stage turbine rotor blades at the optimum angle of incidence. The particles are presented with a rapid change in flow direction. Deposition may occur on the leading edge of the NGV or the pressure surface. Not all particles in the flow will impact with the NGVs, as some will simply follow the gas streamlines. Of those that do impact, not all will stick. The overall accumulation efficiency is defined as:
where is the impact efficiency of the ith particle size group and is the sticking efficiency of the ith particle size group. The product of these two terms is sometimes called capture efficiency, for example in [8].
The impact efficiency and sticking efficiency thus dictate the overall accumulation efficiency on to the NGVs. The accumulation efficiency is sensitive to many properties of the particle-fluid system and the operating condition of the engine. The mass of material collected by the NGVs during an exposure event is therefore:
2.2. NGV Capture Efficiency
The forces responsible for particle capture are multifarious and difficult to generalise into a 1D gas path model. They can generally be split into two processes: transport to the near-wall region and adhesion to the surface. Particles suspended in the flow are initially carried to the vane under the influence of aerodynamic drag. Their fate in the vicinity of the surface depends on the particle response time compared to that of the fluid when met with a change in momentum. If the response time of the particle greatly exceeds that of the flow, the particle will fail to negotiate the object, penetrate the airfoil boundary layer and impact the surface. This is the dominant transport mechanism for particles of a few microns in diameter to pressure surfaces of first-stage stator vanes [18]. Smaller particles may arrive at surfaces after becoming entrained in turbulent eddies introduced by NGV cooling and surface roughness; and smaller particles that would otherwise possess insufficient mass to deviate from fluid streamlines may be persuaded under an imbalanced action of thermally-agitated gas molecules in the thermal boundary layer, a process known as thermophoresis. If the surface is cooled, the thermal gradient will result in a net average impact force towards the wall, thereby increasing particle delivery rate. For yet smaller particles, random impacts of the gas molecules with the particles may also deliver particles to the surface (Brownian motion).
If a particle reaches the surface, it will adhere if the attractive forces of van der Waals and electrostatic charge exceed the elastic rebound energy and aerodynamic shear force. Predicting the level of elastic energy available to cause rebound is complicated by the dissipation of energy during impact to plastic deformation and shape change, which is dependent on the temperature- and composition-dependent material properties (viscosity, wettability with substrate, density) and the inbound wall-normal kinetic energy (particle mass, impact angle, impact velocity) [20]. The attractive forces and shear removal force are functions of the size of the particle and the condition of the surface. These phenomena combine to produce a probability of sticking, which many authors have attempted to model.
2.2.1. Sticking Probability Models
There is a plethora of experimental and numerical works in the literature on fouling in gas turbine engines; see Suman et al. [21] for a comprehensive review. Much of the recent hot section experimental work on deposition has taken place on rigs at Virginia Tech University [22] and Brigham Young University [23]. The contaminant in the former case is coal fly ash and in the latter case is mineral dust. More recent experiments in Europe include hot deposition rigs for testing the accumulation of volcanic ash on to metal coupons, e.g., Dean et al. [24]. The focus here was on the particles in the small percentage of flow entering the combustor at the burner nozzle site. They found an increase in the deposition rate on a metal coupon downstream with increasing glass content and flow speed. A similar study on volcanic ash by Giehl et al. [25] investigated the influence of silica content in addition to glass content and found a decreasing accumulation with increasing silica content. This is due to the increase in the bulk melting point, due to the crystalline structure of silica.
A notable numerical study by Singh and Tafti [8] presented estimates of the capture efficiency of different substrates when subjected to environmental particulates. The authors have implemented sticking conditions on to particles tracked in a Lagrangian framework based on the critical viscosity model and a particle-wall collision energy loss model. This model assumes that the particle undergoes a gradual decrease in viscosity as its temperature rises until it reaches a critical value, below which the sticking probability is assumed to be unity. At temperatures below that which corresponds to the critical viscosity, an additional model is implemented to calculate the probability of rebound based on wall-normal impact energy. The results have shown a good correlation for a generic sand, the chemical composition of which looks similar to Arizona road dust.
A similar model for sticking probability is the critical velocity model, which correlates the onset of sticking to a threshold value of impact velocity, below which particles stick [26]. One of the first applications of this model to particle deposition gas turbine engines was by El-Batsh et al. [27], which they implemented into a steady Reynolds-Averaged Navier Stokes (RANS) solution for flow through a linear turbine cascade. The model was used to compute the coefficient of restitution of a rebounding particle based on classical impact theory and Hertzian mechanics. The probability of rebound, or inversely adhesion, is dependent on the competing forces of elastic rebound energy and surface adhesion. Below a critical velocity, which is a function of particle size and composite Young’s modulus, the particle will stick. The model has been continually improved with additional physics in the last ten years or so, including the possibility of particle re-entrainment into the flow by shear drag [27,28], improvements to the temperature dependency of the Young’s modulus [28] and a more accurate prediction of the rebound potential energy lost to particle deformation [29] during the impact process.
The threshold velocity is dependent on the Young’s modulus of the particle, which is strongly affected by particle temperature. Because of this, if the precise relationship between the particle temperature and Young’s modulus is not known, the model becomes inaccurate [21]. For this reason, recent modifications to the model have focused on this temperature dependency [30,31]. The model is well suited to ash contamination in gas turbines.
More recently, Bons et al. have developed a new, simpler formulation based on the same principles for the interaction fate [32]. This formulation simultaneously incorporates the same physical phenomena of elastic deformation, plastic deformation, adhesion and shear removal. It also includes material property sensitivity to temperature and tangential-normal velocity rebound cross-dependencies observed in experiments. It simplifies the particle impact as a 1D cylinder in compression, as opposed to a sphere as in prior work. This leads to an explicit algebraic formulation that, when implemented into computational fluid dynamics (CFD) codes, affords a much faster simulation of particle deposition. However, the simplification requires the user to tune the model constants to fit experimental data for a given case, which somewhat limits its general applicability. When validated for a given case, the model holds well across a wide range of particle diameters, impact angles and impact velocities.
A limitation of the above models is that they assumed a gradual change in the germane property of the dust with temperature, such as viscosity or Young’s modulus. For amorphous material such as ash, this is appropriate, as the weak bonds break steadily under heating. The change in viscosity can be predicted if the composition is known [20,33,34]. However, sand is usually composed of crystalline material, which decomposes in a more complex manner, involving disassociation reactions and non-uniform softening through the particle. The strong inter-atomic bonds that define the crystal have equal strength throughout the material. This means the melting point will be distinct, since applying heat will break all the bonds at the same time. It is also likely that the change in viscosity and Young’s modulus with temperature will be discontinuous. Efforts to capture this physics in numerical models of dust deposition are ongoing.
2.2.2. Reduced Order Sticking Model
Our over-arching aim was to reduce the number of independent variables that influence accumulation rate. The momentum and thermal Stokes numbers are two examples of important dimensionless numbers that can be used to assess the likelihood of particle capture by an internal gas turbine surface. They do not incorporate any surface interaction effects, but they can act as a starting point in the development of reduced order models to predict and in Equation (11) as a function of operating environment. We do this by constructing a simple case of potential flow past a 2D right cylinder and vary the parameters that constitute the thermal and momentum Stokes numbers by subjecting the cylinder to the properties of two commercially-available test dusts.
2.2.3. Particle Acceleration
The particle is initially carried towards the cylinder by the flow. The cylinder’s presence is felt by the flow, which gradually changes direction and is diverted around the cylinder. The rate of change of direction is a function of the flow velocity and dynamic viscosity. The particle’s inertia causes an apparent delay in its response, which increases with particle momentum, itself a function of particle density and diameter. A relative velocity is set up between the particle and carrier phase, which induces a drag force, which acts to persuade the particle towards the new fluid streamline. This is depicted in Figure 3.
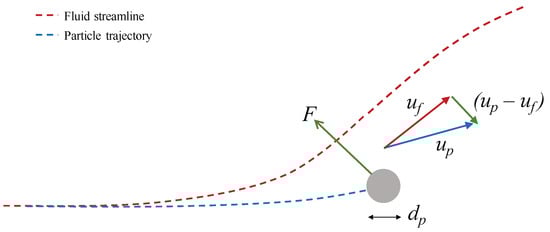
Figure 3.
The development of a relative velocity between the particle and gas and subsequent drag force as a result of a perturbation in the fluid streamline.
Particle acceleration and heating are modelled in a simple two-dimensional Lagrangian frame of reference. The carrier phase is simplified to isentropic inviscid flow, and the discrete phase is simplified to convected point masses with a spherical virtual shape. Particle motion is attributed solely to the influence of the steady state drag force exerted by the gas, which means the virtual mass effect and Basset force (unsteady forces due to a change in relative velocity), pressure force (buoyancy), body force (gravity) and particle–particle interactions are all neglected. This is a reasonable simplification for subsonic gas-particle flows of particles where the ratio of the carrier flow density to particle material density is very small (), the suspension is dilute ( 1 gm) and the settling velocity due to gravity is of the order of metres per second. The particle acceleration is thus a reduced form of the Basset–Boussinesq–Oseen (BBO) equation, given as:
The particle velocity response time, is given as:
where is the particle diameter, is the fluid viscosity and f is the Stokes drag correction factor. The Stokes drag correction factor is usually correlated to experimental data over a fixed range of Reynolds number, and as such is difficult to generalise. One correlation that is reasonably good for Reynolds numbers up to 800 (Schiller and Naumann, given in [35]) is:
where is the particle Reynolds number relative to the carrier fluid velocity as given by Equation (18) and is the particle drag coefficient. Generally, the drag coefficient will depend on the particle shape and orientation with respect to the flow, as well as other flow parameters such as Mach number and turbulence level. We assumed that the relative velocity between the particle and gas does not exceed a level at which compressibility effects are significant. We also assumed that the particles are spherical and the particle Reynolds number does not exceed 800.
Equation (14) does not account for the gradient and surface forces of thermophoresis, turbulent diffusion, Saffman’s lift and adhesion forces, significant in the near-wall region. They are the dominant transport mechanisms for particles below a few microns in diameter, and require the boundary layer and turbulent kinetic energy to be modelled. In the present work, we focus solely on the inertial transport mechanism; the near-wall transport mechanisms are not modelled. While this may lead to an underprediction of deposition of the smallest particles in the test dusts of interest, this allows us to isolate the influence of particle mineralogy on the inertial impaction alone, which is the dominant transport mechanism across the particle diameters of consideration in this study.
2.2.4. Thermal Stokes Number
The thermal Stokes number is the ratio of the particle thermal response time to fluid response time . Similar to the traditional momentum Stokes number, it normalises the time taken for a particle to equilibrate with its carrier fluid temperature (rather than velocity), with a characteristic time scale of the system. It is thus defined as:
where is the specific heat of the particle, is the particle diameter. is the gas thermal conductivity, is the Nusselt number, is the mean gas velocity on entry to the NGV stage and C is the NGV chord. Radiation is unlikely to have a significant effect over the temperature range of interest here and has been neglected [36]. The Nusselt number is derived from the Ranz–Marshall correlation:
where h is the heat transfer coefficient, is the freestream particle Reynolds number and is the Prandtl number. For low Reynolds numbers, the ratio approaches unity. The particle Reynolds and Prandtl numbers are defined as:
and:
respectively, where and are the velocities of the gas and particle, respectively, and is the specific heat capacity of the gas.
A thermal Stokes number of much less than unity indicates that the particle will equilibrate with the gas temperature in a fraction of the time it takes to pass over the vane. A thermal Stokes number of much greater than unity indicates that the particle will not reach the temperature of the gas in the time taken to pass the NGV. If the gas temperature exceeds the melting point of the particle, then a thermal Stokes number of unity or less will lead to deposition, provided the particle impacts the surface. For particles with a thermal Stokes number of greater than one, deposition is less likely, owing to the presence of the solid phase in the particle.
Real-world sands and dusts contain a range of minerals of varying proportion, as well as a range of particle sizes. For this reason, it is likely that a given dust will exhibit a distribution of momentum Stokes number (given in Equation (7)) and thermal Stokes number. Furthermore, since properties of the flow (pressure, temperature, velocity) change with engine operating point, it is likely that the accumulation efficiency as given in Equation (11) that is used to estimate the deposit mass in a dust exposure event will not be constant.
2.2.5. Particle Heating
The particle was assumed to be isothermal throughout, initially at temperature and surrounded by gas at temperature . As it convects through the gas field, it is heated solely through convection; radiation is unlikely to have a significant effect over the range of temperatures considered here. The heat flux Q between the gas and the particle can be expressed as:
where is the surface area of the particle (the other parameters are defined in Section 2.1.5). The heat transfer coefficient h is estimated as a function of the relative velocity between the particle and the carrier fluid. Substituting the Nusselt number into Equation (20) and writing the particle surface area in terms of particle diameter, we have:
where is the thermal response time of the particle, as defined in Equation (16), and is the Nusselt number, as given in Equation (17).
2.2.6. Potential Flow over a 2D Right Cylinder
The velocity field around a two-dimensional right cylinder is given as:
and:
where x and y are the Cartesian coordinates, with the origin at the cylinder centroid, and and are the non-dimensional velocity components. In this approach, we neglect the influence of the particle on the flow (i.e., one-way coupling), which is acceptable given the low mass loading.
The particle trajectory is computed by solving Equation (13) for the x- and y-components of the particle velocity in the inertial frame of reference. The particle is assumed to be initially travelling at the same velocity as the flow. The particle approaches the obstacle with the flow. As the flow begins to be influenced by the cylinder, the carrier fluid velocity is updated according to Equations (22) and (23). The response of the particle depends on the velocity response time. The response time is dependent on the particle drag, which is a function of the relative particle Reynolds number. The particle trajectory is updated according to its response to the change in velocity. In the next time step, the gas velocity is updated at the new particle position and the difference between particle velocity and gas velocity computed to determine the new Reynolds number, hence the new drag coefficient. The numerical solution is solved with the following finite difference schemes. For the particle velocity:
and:
where n is the iteration number and is the time step size between successive iterations. A value of was used for the time step size, which equates to a non-dimensional distance of (the radius of the cylinder is one). For the particle position:
and:
For the particle temperature:
2.2.7. Accumulation Factor
Empirical formulae to determine the capture efficiency of a right cylinder as a function of Stokes number do exist for super-cooled water droplets and aerosols that adhere on impact [37]. In the present case, we cannot assume that fate of the impacting particles will be the same, as some may still be in the solid phase, some may be semi-molten and break up on impact and some may adhere if the surface is “pre-wetted” by previously-deposited material. There is no model as yet that accounts for all these effects for crystalline material, nor for the phase change along the particle trajectory; this is an ongoing research area. In the current work, we simplify the process of heating between the compressor and turbine vane. The gas temperature is considered to be constant and the flow field to be isothermal. The particle has an initial temperature that is equal to the compressor exit temperature. The particle enters the domain at five cylinder radii upstream of the cylinder. The temperature of the particle is then solved using Equation (28) to model the temperature of the particle on impact with the 2D cylinder, which is in thermal equilibrium with the gas.
The rate of impingement on the 2D cylinder depends on cylinder size, the flow condition and the inertia of the particles. The trajectories of spherical particles of given diameter and density are initiated five cylinder radii upstream, at increasing ordinate positions. The capture efficiency, or impact efficiency, is the y-position of the outermost trajectory that results in an interception by the cylinder. Figure 4 shows the deviation of the particle from the fluid streamline when the initial Reynolds number is 100 for the case of Stokes number equal to unity.
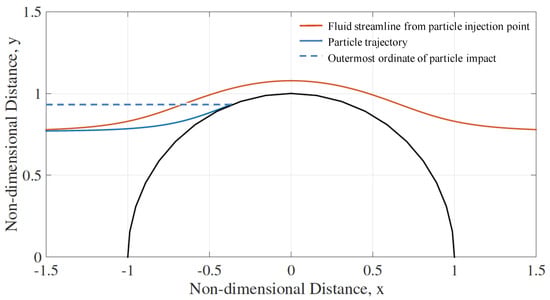
Figure 4.
Impingement of the outermost trajectory of particles injected with an initial particle Reynolds number of 100, Stokes number of 1, and non-Stokes drag parameter, , of 1000. The fluid streamline from injection point is also shown, illustrating an impact efficiency of around 0.93 for this case.
The sticking efficiency here, , is based solely on particle temperature. The cylinder temperature is considered to be the same as the gas temperature and has no influence on the sticking probability. The condition for adhesion to take place is that the particle temperature at the time of impact exceeds its melting point. The probability is effectively binary: 0% or 100%. This approach has been used elsewhere, e.g., [38]. It is a very simple approach, but allows us to compare the overall efficiency of different minerals and sizes solely from the perspective of heating and inertial impaction. We take a bulk dust, discretize it into mass fractions of size and mineral, gather the melting points of each mineral and use the cylinder model to find the accumulation efficiency of each individual mass fraction. Summing the efficiency achieves the overall accumulation efficiency of the bulk dust.
2.3. Model Inputs
We applied our cylinder model to represent the NGVs of a T700-GE-701c operating in an HH-60 Pave Hawk in the Persian Gulf during a brownout landing. This is a gross simplification, but allows us to compare the two dusts easily. The momentum Stokes and thermal Stokes numbers that influence the mass deposited are functions of the dust chemical and physical composition, the flow condition and the engine geometry. We split the required inputs into those relating to the engine operating condition and those relating to the dust exposure event.
2.3.1. Engine Operating Condition
The T700-GE-701c is a turboshaft engine capable of delivering 1239 kW of maximum continuous shaft power. We simulated the operation of a turboshaft similar to the T700 engine using the zero-dimension gas path analysis tool “GSP” (Gas Simulation Program), developed by Netherlands Aerospace Centre (NLR) (At the time of writing, the program is available from www.gspteam.com/ under license. Version 10.016 was used in the current study). A diagram of the turboshaft model is given in Figure 5. The IPS is included, labelled “EAPS”—Engine Air Particle Separator. The power turbine load had an input value. The compressor had an externally-controlled rotor speed, and the power turbine had a power balance at rotor speed option. The software computes the fuel flow required to maintain a specified shaft power load and RPM (revolutions per minute). We can examine the fuel flow required for a sweep of shaft power load and examine the temperature and pressure at each sub-system block. For the cylinder model, we required the gas temperature, viscosity, density and velocity. Since it is a zero-dimension model, the software only outputs scalar quantities. The mass flow rate, combustor exit temperature, pressure and ratio of specific heats are included in this, but the other quantities must be inferred by applying mass continuity, ideal gas law and Sutherland’s correction (Ch. 9, [39]).
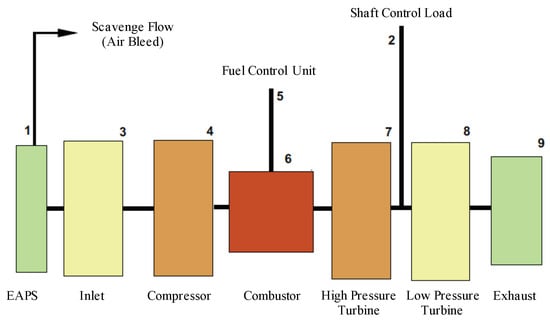
Figure 5.
Turboshaft model for GSP.
The density is found from the pressure, temperature and ratio of specific heats by applying the ideal gas law. However, to apply mass continuity to determine the bulk velocity requires knowledge of the flow cross-sectional area. For commercial reasons, engine manufacturers only publish a very limited set of data relating to the geometry of the engine. In the absence of direct measurements of the combustor exit/HP turbine entry cross-sectional area, we have used the cutaway shown in Figure 2. The temperature and velocity at entry into each stage is illustrated in Figure 6. The static pressure at each stage was also computed.
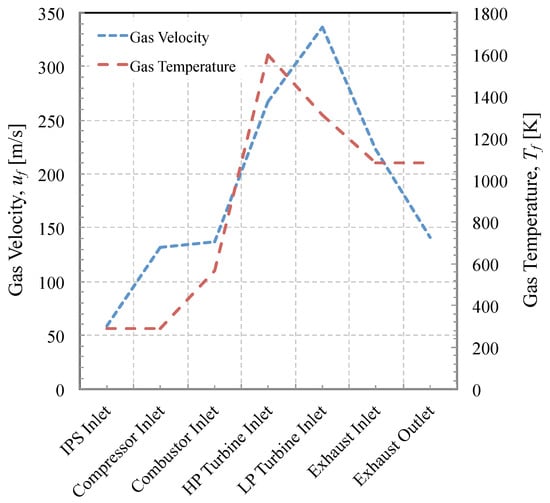
Figure 6.
Mean gas velocity and temperature through the engine.
2.3.2. Dust Exposure Event
We have selected two test dust blends of known composition to compare as analogues of the dusty environment:
- Arizona A2 Fine, a commonly-used test dust for certification of particle separators.
- AFRL02, a commercially available blend developed by Krisak et al. [5] at the U.S. Air Force Research Laboratories (AFRL) for sand ingestion testing to mimic the chemistry of CMAS-forming natural dusts.
The brownout landing was estimated to last 20 s. We estimated the dust concentration using data collected in the Sandblaster 2 flight trials on Yuma Proving Ground, Arizona [12]. The data relating to the physical and chemical composition of the two dusts are presented in Table 1 and Table 2; some of these data, based on published data, are nonetheless approximate owing to the complex melting behaviour of each mineral. The relative mineral proportions and the particle size distributions of each dust are presented in Table 2 and Figure 7, respectively. It is worth mentioning here that due to a lack of data on the mineralogy of the dust, we have assumed that the proportion of minerals illustrated in Table 2 applied across the whole size distribution. In reality, this is unlikely, as evidenced by Smialek [6].

Table 1.
Physical and chemical properties of two mineral dust brownout clouds.
Table 2.
Relative proportion of minerals in each test dust and their approximate physical and chemical properties. Where ranges are given, a mid-range value is used. Gypsum and dolomite decompose under heating to form and/or before melting; final melting points of decomposed material are given here [38].
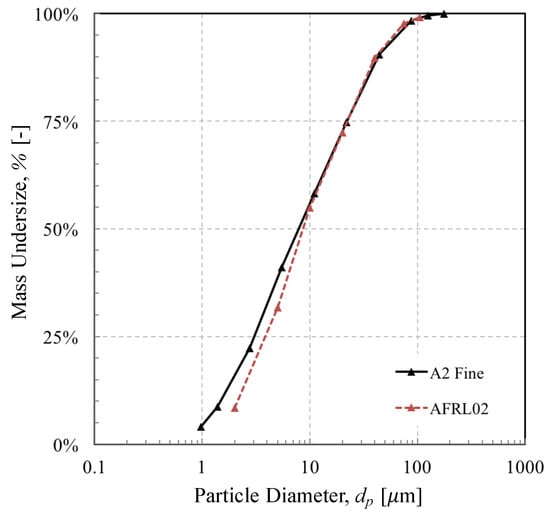
Figure 7.
Cumulative distribution of the two mineral dusts tested.
We first explored the influence of momentum and thermal Stokes numbers on the accumulation efficiency of a 2D isolated cylinder in an isothermal gas. We then utilised the model to investigate the effect this may have when extended to a hypothetical rotorcraft dust landing. It should be re-iterated here that the isolated cylinder model is a much simplified analogue of the real situation. Many aspects of the flow physics that have first order effects on accumulation are not included. Users of the dust dose model may implement their own accumulation factor for the NGV stage.
3. Results and Discussion
3.1. Impact Efficiency of Mineral Dusts on an Isolated Cylinder
The impact efficiency is shown in Figure 8 as a function of Stokes number for two constituents of the AFRL02 dust. The range of Stokes numbers was calculated for seven mid-size diameters across the “raw” AFRL02 size distribution, for illustration (1–90 m). It is evident that the difference in mineralogy had little bearing on the impact efficiency when all particles were considered spherical. Since the inertial effects were normalised with the Stokes number, the only source of variation would be the initial Reynolds number [47], which did not vary greatly enough over the range of Stokes numbers found for each mineral to cause a significant difference in the particle trajectory. A dimensionless parameter, , was defined by Brun et al. [47] as a measure of the deviation from Stokes’ law for the forces acting on the particle:
where is the freestream particle Reynolds number and is the freestream velocity. When the freestream Reynolds number is zero, the drag correction factor 0, and the particle motion resembles that of slow translatory motion of a small sphere in an incompressible viscous fluid, upon which the Stokes law was derived. The larger the magnitude of , the greater is the deviation from the Stokes law. The values of calculated for the range of Stokes number and initial conditions chosen (typical turboshaft engine) were of similar order of magnitude and resulted in little deviation from the best fit line of Figure 8.
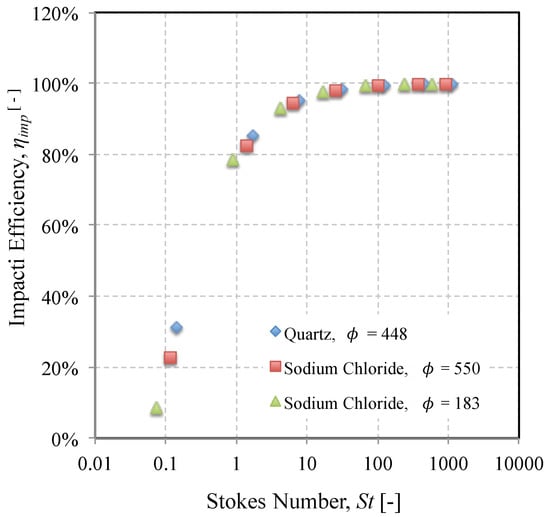
Figure 8.
Impact efficiency as a function of Stokes number of two constituent minerals of the AFRL02 test dust and three different values of .
A similar result was found when comparing the heating rate of each mineral in the time leading up to impact. The ratio of the particle’s temperature on impact to the gas temperature is plotted as a function of thermal Stokes number for each mineral in the AFRL02 dust in Figure 9. The results show that the Prandtl number begins to take effect at values of beyond 100. A larger value of thermal Stokes number is indicative of a slow particle response to heating relative to the characteristic flow time. If such particles enter the domain at a temperature much lower than their melting point, they are unlikely to become molten enough to adhere. A higher Prandtl number appears to accelerate the heating, but not substantially.
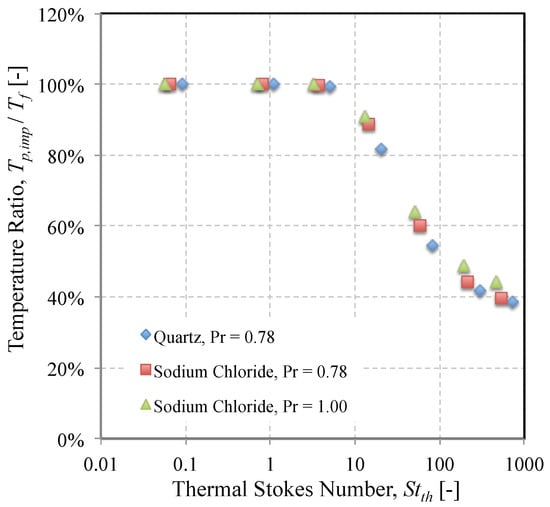
Figure 9.
Variation of the temperature ratio as a function of thermal Stokes number for two minerals and two Prandtl numbers.
3.2. Influence of Mineralogy on Stokes Number
Figure 8 and Figure 9 also illustrate the difference between particles of the same size, but of different mineralogy. The same seven “mid-size” particle diameters given in Table 3 were used to generate the seven data points that make up the three sets of data in each figure. The quartz and sodium chloride ( = 550) particles were injected into the same flow field (initial velocity and viscosity), which means that the difference in separation efficiency can be attributed mainly to differences in particle density that modify the momentum Stokes number. A given desert dust will contain a range of minerals; Figure 10 shows the largest range in momentum Stokes number for the range of minerals contained in AFRL02 across the range of particle diameters. It is worth repeating here that the mineral proportions are the same in each discrete particle size band. In reality, there may be a non-uniform discrepancy between the smallest and largest momentum Stokes number for a given particle size band, owing to different mineral proportions.
Table 3.
Table of proportions by mass in each size band and mineral, of initial test dust, of impacted dust and of deposited dust. All percentages are relative to the initial mass. The numbers in bold emphasise the overall values: they are a summation of the proportions of each mineral and each size band.
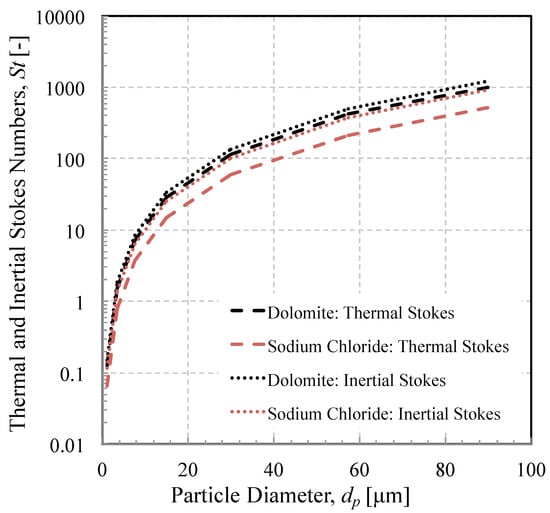
Figure 10.
Variation of thermal and inertial stokes number as a function of particle diameter for two minerals.
Also shown in Figure 10 are the upper and lower bounds of the thermal Stokes number over the range of particle diameters that constitute AFRL02. It is interesting to note that the difference was much greater than that of the momentum Stokes number. For example, a 12-micron particle of sodium chloride had a thermal Stokes number of 10, whereas a 12-micron particle of dolomite had a thermal Stokes number of around 20. Returning to Figure 9, the significance of this is that in the same length of time it takes to reach the cylinder, a sodium chloride particle will reach 95% of the gas temperature, while a dolomite particle of the same size will only reach 75% of the gas temperature. Furthermore, the melting point of sodium chloride is significantly lower (1074 K) than that of dolomite (2973 K). Hence, there is likely to be a huge range of sticking probabilities even within a small subset of particle sizes due to particle mineralogy.
3.3. Effect of Particle Mineralogy on Impact and Accumulation Efficiency
The variation in inertial and thermal Stokes number translates to a difference in the mass deposited per mineral in a sample. This is illustrated in the results of the isolated cylinder example, given in Table 3. The flow conditions used are reflective of those shown at the HP turbine inlet in Figure 10 (gas temperature 1600 K, flow inlet velocity 270 m/s). As discussed, the variation in impact efficiency can be wholly attributed to particle density, since mineral proportions were kept uniform across the size distribution and all other factors in the Stokes number were held constant. The impact efficiency was similar for each mineral, but not identical. For sodium chloride (density 2170 kg/m), the impact efficiency was 87.5%; for dolomite (density 2840 kg/m), it was 89.7% (calculated by dividing “impacted” by “initial” values from Table 2). This illustrates the effect of increasing Stokes number on impact efficiency.
Of the five minerals present in AFRL02, all may have impacted, but only albite (melting point 1388 K) and sodium chloride (melting point 1074 K) met the condition for deposition. Interestingly, since the accumulation efficiency is a product of the impact efficiency and the sticking efficiency (the latter of which is unity if the particle temperature exceeds the melting point), not all of the albite and sodium chloride particles that impacted the cylinder deposited. This suggests that a portion of these impacting particles had not reached their melting point, most likely due to their larger volume. For example, 17% of AFRL02 is composed of albite: on reaching the cylinder, 5% avoided the obstacle, while the remaining 12% impacted the cylinder. Of this 12%, 10% reached the melting temperature at the point of impact, while 2% had residence times just too short to reach the melting point, most likely impacting at the cylinder leading edge.
The significance of this is that a reduction of deposition may be achievable with some control of inertial and thermal Stokes number. As shown in Figure 10, both Stokes numbers increased with particle diameter. However, since impact efficiency increases with momentum Stokes number, but sticking efficiency decreases with thermal Stokes number, there may be an optimum operating point for a given dust that leads to a minimum overall accumulation efficiency; or, rather perhaps more importantly, these results suggest that there is a key sub-range of particle diameters in a given test dust that are more likely to deposit. This is illustrated in Figure 11, which shows the proportion of mass deposited relative to the initial mass fraction. The effect of the competing Stokes numbers is evident, in this case displaying a preponderance of particles with diameters of around 4–10 microns to deposit. If one were to mitigate against deposition by using a device to remove particles before they have a chance to deposit, such a size range may be targeted in the design requirements stage.
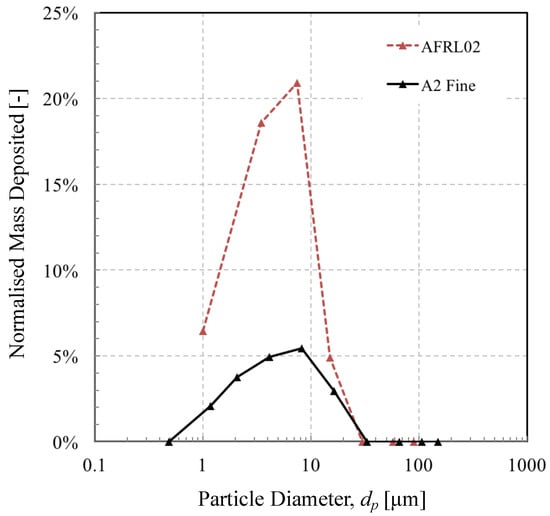
Figure 11.
Percentage of deposited dust as a function of particle size for the two test dusts, normalised by the initial mass fraction.
The mismatch between test dusts evident in Figure 11 also illustrates the influence of particle mineralogy, at least from the perspective of thermal and velocity response times. The AFRL02 test dust contains a large proportion of albite (17%), which the other two dusts do not have. This seems obvious, but as we can see from Table 3, not all of the albite in the dust reached that melting temperature. In fact, only half of the albite that impacted the cylinder met the condition for sticking, which emphasises the point that diameter, specific heat, Nusselt number, and thermal conductivity all play a role in the likelihood of particle adhesion. It also illustrates that the actual dust seen by an engine component is likely to be different from that which was initially ingested, owing to these mechanisms of inertial and thermal “sorting”. There is more work to be done to investigate the influence of turbulence, surface temperature, cooling, and adhesion mechanics, but this could be a useful correction when selecting a suitable test dust to challenge a given component.
3.4. Mass Collected during Brownout Landing of an HH-60 Helicopter
We used the model in a hypothetical situation of an HH-60 landing in a brownout cloud. The duration of the landing was estimated to be 20 s, and the dust cloud concentration was assumed to be an average of 1.8 g/m, giving an exposure event dose, , of 36 gs/m. The accumulation efficiency of a 2D cylinder was used as a basic substitute for NGV of the case study engine, the T700-GE-701c.
We first investigated the proportion of the dust mass concentration that the NGV might actually see and compared that with the proportion of the ingested mass that deposited on the NGV for the two dusts in question. In both cases, the IPS was efficient at removing around 70% of the inbound dust, as shown in Figure 12. Differences can be explained by the slight difference in mean density and mean particle size, which reduce the mean momentum Stokes number, as given in Equation (8). However, the proportion that deposits was different for each dust. AFRL02 exhibited the largest proportion of mass collected, around % owing to the presence of albite, melting point 1533 K, a significant proportion of which reached the melting point, as shown in Figure 12. A2 Fine test dust also deposited, albeit in lower quantities, despite exhibiting a similar overall impact efficiency of around 23%. AFRL02 is said to be more representative of Middle Eastern dusts; the results illustrate the importance of including other constituent minerals in a test dust in order to reflect the damage potential of the dusty environment in which the engines may be required to run.
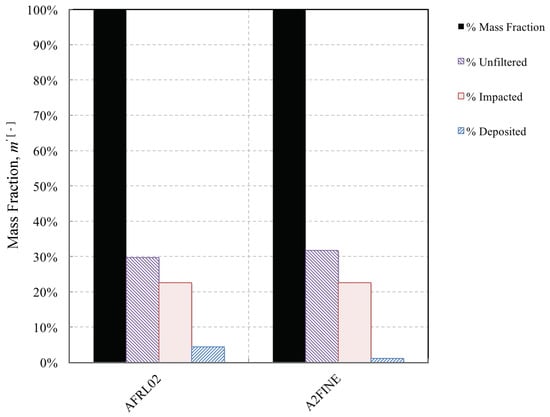
Figure 12.
Breakdown of changes in dust mass fraction between inlet and NGV for two test dusts.
To put these results into context, we simulated the engine performance over a sweep of mass flow rates, each subject to the same exposure dose (36 gs/m). The temperature and velocity at the entry to the HP turbine varied to the design point shown in Figure 6. At the design point power, the total mass ingested during a 20-s landing was 135 grams; 95 grams were removed by the IPS, and 31 grams of the remaining dust that passed through the engine impacted the NGV. Of this, just under six grams stuck to the NGV stage, under the current model. This is depicted in Figure 13. If the engine is operated at a lower power, the peak temperature and velocity are reduced. This in turn reduces the momentum Stokes number of each particle, which in both cases decreases the separation efficiency of the IPS and allows a greater proportion of particulate through, but for the same reason, lowering the overall impact efficiency.
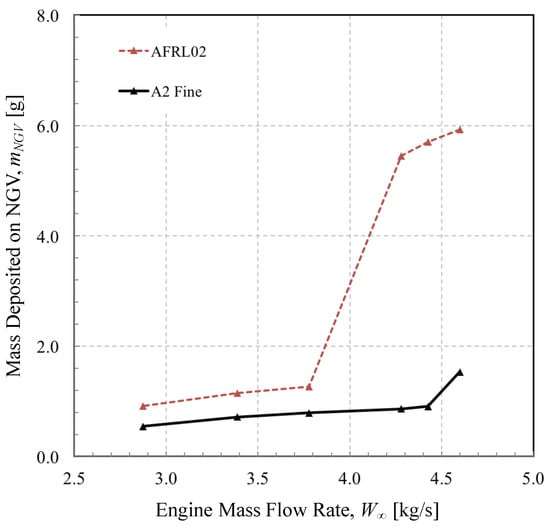
Figure 13.
Effect of engine mass flow rate on the mass of material deposited during a dose of 36 gs/m in a T700-GE-701c turboshaft engine.
Comparing the two test dusts, the different mineral composition of AFRL02 led to three-times as much deposit mass as the A2 Fine test dust at peak power rating. Interestingly, the reduction in turbine entry temperature achieved by running the engine at a lower power rating (mass flow of 3.78 kg/s and below) had a significant effect on the deposition rate of AFRL02, due to albite no longer melting. A similar, but less pronounced step change in deposition rate was evident in the A2 Fine test dust, due to the absence of sodium oxide mineral deposit at lower temperatures. However, it is perhaps the opposite trend when increasing mass flow rate that may cause problems. In contrast to ash, crystalline dust has a non-continuous melting behaviour. This may result in a sudden jump in the accumulation rate as the demand for engine power increases at such a critical flight phase as landing.
The data supporting these findings are somewhat hypothetical-(in reality, it would be difficult to know the composition and size distribution of the inbound dust) but this low order approach, with a simple model for the deposition behaviour of the mineral particles, does suggest that de-rating the engine may, in environments rich in salt and albite, reduce deposition in the hot section.
4. Conclusions
This study aimed to investigate the important parameters that influence the accumulation of mineral sands and dusts in a reduced order framework. With a simple engineering approach, we can postulate that engine durability tests based on Arizona road dust may not replicate the deposition effects in real-life conditions. Furthermore, the modification to the size distribution by an upstream filtration system installed on helicopter engines does not necessarily remove the threat of deposition. This is because deposition will occur if the Stokes number is large enough that the obstacle, in this case an NGV, cannot be negotiated by the particle. The particle is likely to adhere if it is in a molten state; if the mean gas temperature far exceeds the melting point of the particle and the particle thermal response time is much smaller than the residence time in the combustor, there is a good chance that adhesion will result. This becomes potentially troublesome if the engine is operating at a high power setting and ingesting large quantities of mineral dust, as is the case during a dust landing or take-off at many unprepared locations around the world.
The main conclusions of the work are as follows:
- Chemical properties of ingested dust should have equal prominence in the development of test dusts for engine durability tests, owing to the variation in heating rates and melting points of the constituents of real dusts. This may lead to an underprediction of the mass of material deposited in the field in comparison with the test bed.
- Particle size has a big influence on the likelihood of deposition in the external gas path. Generally, the smaller particles do not possess the inertia to deviate from flow streamlines and interact with surfaces in the core gas path, unless small enough to be transported by turbulent eddies or thermophoresis (not modelled here). The largest particles that do interact cannot reach their melting point in the short transit time. This effectively leads to an “inertial” and “thermal” sorting, which leads to a difference between the initial test dust and the constituents of the surface deposit. Predictions of this sorting effect could be used to create test dusts that more closely resemble the material deposited on engine components.
- The thermal Stokes number is likely to exhibit a greater variance than the momentum Stokes number, over a range of identical particle sizes for a given real-world dust. The significance of this is that there is likely to be more of a difference in the sticking efficiency than the impact efficiency for a dust of several constituent minerals.
- The Stokes numbers are both heavily influenced by particle size. An inertial particle separator removes a significant proportion of the ingested dust. The dust that evades removal, however, has a much narrower size distribution and a much smaller mass mean diameter. The mean Stokes numbers of the dust decrease. While this reduces the impact efficiency, this means that particles on average take less time to reach the melting point, thereby increasing their likelihood of capture.
- Due to the fact that the accumulation efficiency increases with momentum Stokes number, but decreases with thermal Stokes number, both of which increase with the square of particle diameter, there may exist a level of engine mass flow rate for which deposition rates remain low. Conversely, as the engine mass flow rate increases, the build up of molten dust may be non-linear, due to the discontinuous way crystalline material decomposes and changes phase.
There is clearly scope for more research in this area, in particular to implement a more realistic representation of the NGVs and a more accurate model for particle sticking potential. In particular, it would be interesting to develop a reduced order model that can generalise the effect of real-world effects of cooling and non-uniformity of the flow field. Nevertheless, this initial study affords a useful insight into the primary factors affecting deposition that are influenced by the mineralogical properties of the dust and provides a framework for computing dust exposure dose within a helicopter engine.
Author Contributions
N.B. conceived the models, designed the experiment, interpreted the results and wrote the paper; A.F. constructed and ran the T700 engine model, and contributed analysis and interpretation of the data.
Funding
This research received no external funding.
Acknowledgments
The authors would like to acknowledge Merren Jones and Alison Pawley of the DUST Research Group at the University of Manchester for their insights into mineral dusts. The authors would like to thank the University of Manchester for covering the costs to publish in open access.
Conflicts of Interest
The authors declare no conflict of interest.
Abbreviations
The following abbreviations are used in this manuscript:
| AFB | Air Force Base |
| AFRL | Air Force Research Laboratory |
| CMAS | Calcium-Magnesium Aluminosilicate |
| HP | High Pressure |
| IPS | Inertial Particle Separator |
| ISO | International Organisation for Standardization |
| RANS | Reynolds-Averaged Navier–Stokes |
| RPM | Revolutions per Minute |
| NGV | Nozzle Guide Vane |
References
- Milluzzo, J.; Leishman, J.G. Assessment of Rotorcraft Brownout Severity in Terms of Rotor Design Parameters. J. Am. Helicopter Soc. 2010, 55, 32009–320099. [Google Scholar] [CrossRef]
- Syal, M.; Martin, M.; Leishman, J.G. Development of a Lagrangian-Lagrangian Methodology to Predict Brownout Dust Clouds. Ph.D. Thesis, University of Maryland, College Park, MD, USA, 2012. [Google Scholar]
- Bojdo, N. Rotorcraft Engine Air Particle Separation. Ph.D. Thesis, University of Manchester, Manchester, UK, 2012. [Google Scholar]
- Dunn, M.G.; Padova, C.; Moller, J.E.; Adams, R.M. Performance Deterioration of a Turbofan and a Turbojet Engine Upon Exposure to a Dust Environment. J. Eng. Gas Turbines Power 1987, 109, 336. [Google Scholar] [CrossRef]
- Krisak, M. Environmental Degradation of Nickel-Based Superalloys Due to Gypsiferous Desert Dusts. Ph.D. Thesis, Air Force Institute of Technology, WPAFB, OH, USA, 2015. [Google Scholar]
- Smialek, J.; Archer, F.; Garlick, R. Turbine Airfoil Degradation in the Persian Gulf War. JOM 1994, 46, 39–41. [Google Scholar] [CrossRef]
- Barone, D.; Loth, E.; Snyder, P. Efficiency of an Inertial Particle Separator. J. Propuls. Power 2015, 31, 997–1002. [Google Scholar] [CrossRef]
- Singh, S.; Tafti, D. Particle deposition model for particulate flows at high temperatures in gas turbine components. Int. J. Heat Fluid Flow 2015, 52, 72–83. [Google Scholar] [CrossRef]
- Drew, J. Fatal MV-22 crash in Hawaii linked to excessive debris ingestion. FlightGlobal. 25 November 2015. Available online: https://www.flightglobal.com/news/articles/fatal-mv-22-crash-in-hawaii-linked-to-excessive-debr-419484/ (accessed on 6 December 2018).
- Clarkson, R.J.; Majewicz, E.J.; Mack, P. A re-evaluation of the 2010 quantitative understanding of the effects volcanic ash has on gas turbine engines. Proc. Inst. Mech. Eng. Part G J. Aerosp. Eng. 2016, 230, 2274–2291. [Google Scholar] [CrossRef]
- Clarkson, R.; Simpson, H. Maximising Airspace Use During Volcanic Eruptions: Matching Engine Durability against Ash Cloud Occurrence. In Proceedings of the Science and Technology Organisation Meeting STO-MP-AVT-272, Vilnius, Lithuania, 15–17 May 2017; pp. 1–20. [Google Scholar] [CrossRef]
- Cowherd, C. Sandblaster 2: Support of See-Through Technologies for Particulate Brownout; Technical Report 110565; Defence Advanced Research Projects Agency (DARPA): Arlington County, VA, USA, 2007.
- Boulanger, A.; Patel, H.; Hutchinson, J.; DeShong, W.; Xu, W.; Ng, W.; Ekkad, S. Preliminary Experimental Investigation of Initial Onset of Sand Deposition in the Turbine Section of Gas Turbines. In ASME Turbo Expo 2016, Volume 1: Aircraft Engine; Fans and Blowers; Marine; ASME: New York, NY, USA, 2016; p. V001T01A003. [Google Scholar] [CrossRef]
- Bojdo, N.; Filippone, A. Performance Prediction of Inlet Barrier Filters for Rotorcraft Engines. J. Aircr. 2011, 48, 1903–1912. [Google Scholar] [CrossRef]
- Barone, D.; Loth, E.; Snyder, P. Influence of particle size on inertial particle separator efficiency. Powder Technol. 2017, 318, 177–185. [Google Scholar] [CrossRef]
- Dunn, M.G. Operation of Gas Turbine Engines in an Environment Contaminated With Volcanic Ash. J. Turbomach. 2012, 134, 051001. [Google Scholar] [CrossRef]
- Venti, M.; Lekki, J.; Loy-Kraft, G. Vehicle Integrated Propulsion Research (VIPR) III Volcanic Ash Environment (VAE) Preliminary Visual and Teardown Observations; Technical Report; NASA: Washington, DC, USA, 2016.
- Hamed, A.; Tabakoff, W.C.; Wenglarz, R. Erosion and Deposition in Turbomachinery. J. Propuls. Power 2006, 22, 350–360. [Google Scholar] [CrossRef]
- Kim, J.; Dunn, M.G.; Baran, A.J.; Wade, D.P.; Tremba, E.L. Deposition of Volcanic Materials in the Hot Sections of Two Gas Turbine Engines. J. Eng. Gas Turbines Power 1993, 115, 641. [Google Scholar] [CrossRef]
- Kleinhans, U.; Wieland, C.; Babat, S.; Scheffknecht, G.; Spliethoff, H. Ash particle sticking and rebound behavior: A mechanistic explanation and modeling approach. Proc. Combust. Inst. 2017, 36, 2341–2350. [Google Scholar] [CrossRef]
- Suman, A.; Casari, N.; Fabbri, E.; Pinelli, M.; di Mare, L.; Montomoli, F. Gas Turbine Fouling Tests: Review, Critical Analysis, and Particle Impact Behavior Map. J. Eng. Gas Turbines Power 2018, 141, 032601. [Google Scholar] [CrossRef]
- Patel, H. Experimental Investigation of Initial Onset of Sand Deposition in the Turbine Section of Gas Turbines. Ph.D. Thesis, Virginia Polytechnic Institute and State University, Blacksburg, VA, USA, 2015. [Google Scholar]
- Bons, J.P.; Crosby, J.; Wammack, J.E.; Bentley, B.I.; Fletcher, T.H. High-Pressure Turbine Deposition in Land-Based Gas Turbines From Various Synfuels. J. Eng. Gas Turbines Power 2007, 129, 135. [Google Scholar] [CrossRef]
- Dean, J.; Taltavull, C.; Clyne, T. Influence of the composition and viscosity of volcanic ashes on their adhesion within gas turbine aeroengines. Acta Mater. 2016, 109, 8–16. [Google Scholar] [CrossRef]
- Giehl, C.; Brooker, R.A.; Marxer, H.; Nowak, M. An experimental simulation of volcanic ash deposition in gas turbines and implications for jet engine safety. Chem. Geol. 2017, 461, 160–170. [Google Scholar] [CrossRef]
- Brach, R.M.; Dunn, P.F. A Mathematical Model of the Impact and Adhesion of Microsphers. Aerosol Sci. Technol. 1992, 16, 51–64. [Google Scholar] [CrossRef]
- El-Batsh, H.; Haselbacher, H. Numerical Investigation of the Effect of Ash Particle Deposition on the Flow Field Through Turbine Cascades. In ASME Turbo Expo 2002, Volume 5: Parts A and B; ASME: New York, NY, USA, 2002; pp. 1035–1043. [Google Scholar] [CrossRef]
- Ai, W.; Fletcher, T.H. Computational Analysis of Conjugate Heat Transfer and Particulate Deposition on a High Pressure Turbine Vane. J. Turbomach. 2012, 134, 041020. [Google Scholar] [CrossRef]
- Singh, S.; Tafti, D. Predicting the Coefficient of Restitution for Particle Wall Collisions in Gas Turbine Components. In ASME Turbo Expo 2013, Volume 6B: Turbomachinery; ASME: New York, NY, USA, 2013; p. V06BT37A041. [Google Scholar] [CrossRef]
- Yu, K.; Tafti, D. Size and Temperature Dependent Deposition Model of Micro-Sized Sand Particles. In ASME Turbo Expo 2017, Volume 2D: Turbomachinery; ASME: New York, NY, USA, 2017; p. V02DT48A008. [Google Scholar] [CrossRef]
- Agati, G.; Borello, D.; Rispoli, F.; Venturini, P. An Innovative Approach to Model Temperature Influence on Particle Deposition in Gas Turbines. In ASME Turbo Expo 2016, Volume 5C: Heat Transfer; ASME: New York, NY, USA, 2016; p. V05CT12A012. [Google Scholar] [CrossRef]
- Bons, J.; Prenter, R.; Whitaker, S. A Simple Physics-Based Model for Particle Rebound and Deposition in Turbomachinery. J. Turbomach. 2017, 139, 081009. [Google Scholar] [CrossRef]
- Mills, K.; Sridhar, S. Viscosities of ironmaking and steelmaking slags. Ironmak. Steelmak. 1999, 26, 262–268. [Google Scholar] [CrossRef]
- Giordano, D.; Russell, J.K.; Dingwell, D.B. Viscosity of magmatic liquids: A model. Earth Planet. Sci. Lett. 2008, 271, 123–134. [Google Scholar] [CrossRef]
- Crowe, C.; Sommerfeld, M.; Tsuji, Y. Multiphase Flows with Particles and Droplets; CRC Press: Boca Raton, FL, USA, 1998. [Google Scholar]
- Shinozaki, M.; Roberts, K.A.; van de Goor, B.; Clyne, T.W. Deposition of Ingested Volcanic Ash on Surfaces in the Turbine of a Small Jet Engine. Adv. Eng. Mater. 2013, 15, 986–994. [Google Scholar] [CrossRef]
- Israel, R.; Rosner, D.E. Use of a Generalized Stokes Number to Determine the Aerodynamic Capture Efficiency of Non-Stokesian Particles from a Compressible Gas Flow. Aerosol Sci. Technol. 1982, 2, 45–51. [Google Scholar] [CrossRef]
- Wood, C.A.; Slater, S.L.; Zonneveldt, M.; Thornton, J.; Armstrong, N.; Antoniou, R.A. Characterisation of Dirt, Dust and Volcanic Ash: A Study on the Potential for Gas Turbine Engine Degradation; Technical Report; Australian Government Department of Defence Science and Technology: Victoria, Australia, 2017.
- Cengel, Y.; Turner, R.; Cimbala, J.; Kanoglu, M. Fundamentals of Thermal-Fluid Sciences; McGraw-Hill Education: New York, NY, USA, 2008. [Google Scholar]
- Waples, D. A review and evaluation of specific heat capacities of rocks, minerals, and subsurface fluids. Part 1: Minerals and nonporous rocks. Nat. Resour. Res. 2004, 13, 97–122. [Google Scholar] [CrossRef]
- Haynes, W. CRC Handbook of Chemistry and Physics; Taylor and Francis Group: Abingdon, UK, 2014. [Google Scholar]
- Lewis, R.; Hawley, G. Hawley’s Condensed Chemical Dictionary, 6th ed.; John Wiley and Sons: Hoboken, NJ, USA, 2016. [Google Scholar]
- Chase, M.W. NIST-JANAF Themochemical Tables, 4th ed.; National Institute of Standards and Technology: Gaithersburg, MD, USA, 1998.
- Qu, Y.; Yang, Y.; Zou, Z.; Zeilstra, C.; Meijer, K.; Boom, R. Melting and Reduction Behaviour of Individual Fine Hematite Ore Particles. ISIJ Int. 2015, 55, 149–157. [Google Scholar] [CrossRef]
- Kim, S.; Chen, J.; Cheng, T.; Gindulyte, A.; He, J.; He, S.; Li, Q.; Shoemaker, B.A.; Thiessen, P.A.; Yu, B.; et al. PubChem 2019 update: improved access to chemical data. Nucleic Acids Res. 2019, 47, D1102–D1109. [Google Scholar] [CrossRef]
- Zumdahl, S.S.; DeCoste, D.J. Chemical Principals; Cengage Learning: Boston, MA, USA, 2012. [Google Scholar]
- Brun, R.; Lewis, W.; Perkins, P.; Serafini, J. Impingement of Cloud Droplets on a Cylinder and Procedure for Measuring Liquid-Water Content and Droplet Sizes in Supercooled Clouds by Rotating Multicylinder; Technical Report; NACA: Cleveland, OH, USA, 1955. [Google Scholar]
© 2019 by the authors. Licensee MDPI, Basel, Switzerland. This article is an open access article distributed under the terms and conditions of the Creative Commons Attribution (CC BY) license (http://creativecommons.org/licenses/by/4.0/).