Abstract
Hybrid electric propulsion in the aviation field is becoming an effective alternative propulsion technology with potential advantages, including fuel savings, lower pollution, and reduced noise emission. On the one hand, the aeroengine manufacturers are working to improve fuel consumption and reduce pollutant emissions with new combustion systems; on the other hand, much attention is given to reducing the weight of the batteries increasing the energy density. Hybrid electric propulsion systems (HEPS) can take advantage of the synergy between two technologies by utilizing both internal combustion engines (ICEs) and electric motors (EMs) together, each operating at their respective optimum conditions. In the present work, some numerical investigations were carried out by using a zero-dimensional code able to simulate the flight mission of a turboprop aircraft, comparing fuel consumption and pollutant emissions of the original engine with other two smaller gas turbines working in hybrid configuration. An algorithm has been implemented to calculate the weight of the batteries for the different configurations examined, evaluating the feasibility of the hybrid propulsion system in terms of number of non-revenue passengers.
1. Introduction
The aviation industry is responsible for 12% of the total transportation impact of CO2 while awareness, for decreasing the total carbon footprint, is rising [1]. Both the aerospace and the automotive industry are facing an increasing pressure from society to make the transportation sector more sustainable. The Advisory Council for Aeronautics Research in Europe (ACARE) imposes, in the Vision 2020, an 80% and 50% reduction in NOx and CO2, respectively. The integrated performance is analyzed in terms of potential fuel reduction and vehicular efficiency in comparison to a suitable projected conventional aircraft employing only the turboprop target in year 2035 [2,3]. Therefore, more and more interest is turned toward hybrid propulsion systems in the aviation field too. On the basis of the hybrid electric aircraft configuration considered, thrust can be provided via a combination of turbine and electrical motor, or, only via the electrical motors. The electric engine could be used throughout the entire flight or in specific phases of the flight plan where the power demand is higher, or near urban areas, to reduce pollutant emission.
In the present work, a hybrid configuration is studied for a regional aircraft turboprop engine, similar to ATR42-300. A parallel propulsion system, composed of a gas turbine and an electric motor powered by batteries, was selected [4]. The particularity of the system lies in the existence of a gearbox system to couple/de-couple the electrical motor from the output shaft of the turbine, according to the flight phases. Therefore, the electric motor can be used to either add power to, or generate power from, the shaft. The aim of the simulations is to demonstrate that, through the use of a parallel configuration on aircraft, it is possible to obtain a reduction of pollutant emission, especially in the proximity of urban areas.
This research is placed in a scientific context that is increasingly of interest in the last years. In fact, many companies and researchers in the scientific community are investigating new configurations of hybrid propulsion for aircraft [5,6]. In the paper [7], the authors examine the state-of-the-art of hybrid electric propulsion system modeling, and suggest new methodologies for sizing such advanced concepts. Many prototypes of hybrid aircrafts have been studied and produced in the last years. The first demonstration of a hybrid electric (ICE and EM) manned aircraft was developed by Robertson from the Engineering Department at the University of Cambridge, in association with Flylight Airsports Ltd. This system utilized a 2.2 kW ICE and 11.2 kW EM in a parallel drive train powered by 16 LiPo cells of 40 Ah capacity, giving an electrical energy storage capacity of 2.4 kWh. A second hybrid electric aircraft was built by the Embry Riddle Eagle Flight Research Center. The team used a parallel hybrid propulsion system, based on a four-cylinder 75 kW Rotax 912 engine, and a 30 kW electric motor powered by lithium polymer batteries. An overrunning clutch system was installed to allow the engine to use the electric motor only during the cruise phase. In 2011, a series hybrid electric prototype aircraft was successfully demonstrated by Siemens AG, Diamond Aircraft, and EADS (European Aeronautic Defence and Space Company) at the Le Bourget air show in Paris. The power-train of the DA36 E-Star consists of a 70 kW EM made by Siemens and 30 kW Wankel ICE made by Austro Engine. The EM is powered by a generator that always runs at a constant power output of 30 kW. The battery system provides the required power during take-off and climb, and the cells are recharged during the cruise phase. A more advanced version of the DA36 E-Star, named DA36 E-Star 2, was presented in June 2013, with a reduction of empty weight of the motor glider by around 100 kg, and so an increase in flight range duration is expected [8]. Pornet, in [9], assess the potential of fuel-battery hybrid narrow-body transport aircraft according to different design ranges for an entry-into-service of 2035. The authors investigate and determine the most suited aircraft market segment for their development and application. In [10], the authors investigate the influence of emission thresholds and retrofit options on airline fleet planning by using an optimization model. The authors in [11] compare the traditional aircraft, more electric aircraft, and liquid hydrogen-fueled aircraft by using a multi-criteria scoring method. In [12], Thauvin et al. assess the benefits of transient energy storage for a hybrid regional aircraft by studying the opportunity of recovering energy in descent and during landing. In [13], the authors consider the design and sizing process of a hybrid electric propulsion system which provides not only a benefit in fuel saving but, also, a reduction in take-off noise and the emission levels. The paper [14] describes the modeling and design of an innovative partially electric distributed propulsive system architecture; for the application, a properly simulation environment is created in order to analyze the best configuration for a partially electric distributed regional jet. In [15], the author analyses a hybrid electric version of a regional propeller aircraft model (ATR72) comparing to baseline conventional system. Electric propulsion creates new design possibilities as distributed propulsion and variable shaft-speed. The main purpose is to gain more insight in modeling an (hybrid) electric aircraft, and the potential improvements with respect to well-to-propeller efficiency. In the paper [16], an electric power plant technology is compared to advanced gas turbine technology, including a variety of technical aspects, such as power plant sizing and performance characteristics, as well as aircraft integration and operation. The progress in electric motor/generator technology, power electronics, and electrical storage, has attracted considerable interest within the aerospace community. Many initial studies on the applicability of such components, as part of electric hybrid propulsion systems for aircraft, have been published [17,18,19]. A variety of hybrid system options involving battery elements, fuel cells, and gas turbines, and a summary of power densities and efficiencies expected for a potential entry-into-service 2035, are discussed in [20]. As previously mentioned, the present paper investigates the feasibility of the hybrid propulsion system for a regional aircraft, considering different turboprop sizes and performance; the impact of electric power-train has been analyzed in terms of number of non-revenue passengers.
2. Choice of Hybrid Propulsion Configuration
Depending on the variant of hybrid electric aircraft considered, the thrust may be provided via a combination of gas turbines and electrical propulsors, or only via the electrical propulsors, or only via the thermal engine during a specific segment of the flight. One of the most significant benefits of a hybrid configuration is the flexibility in operation. The topological options for the application of electric drives to the propulsion system of aircrafts are mainly two: series and parallel hybrid. In the series configuration, the propeller shaft is only driven by the electric motors. In general, the gas turbine is used to either charge the batteries or provide auxiliary power to drive the electric motor. This, combined with the need for a generator, implies that this topology is heavier than a parallel one. In the parallel topology, the internal combustion engine and the propeller are connected via a rigid shaft. This shaft turns the rotor of the electric motor/generator through which it passes, as shown in Figure 1. An advantage of this configuration is that it requires only two propulsion devices, where either the electric motor and/or the gas turbine can be downscaled, determining a weight reduction with respect to the series configuration. Regarding the hybrid parallel power-train of an aircraft, the operating mode is quite different with respect to automotive application: in fact, due to the high power required during the flight, usually, the electric motor mode is not feasible.
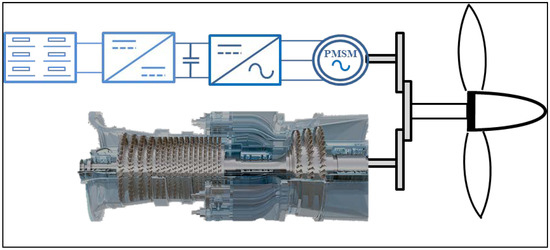
Figure 1.
Hybrid parallel configuration.
For the above reasons, with the aim of investigating a new low CO2 emission propulsion system for a regional aircraft turboprop engine, a parallel hybrid configuration is chosen in the present work. In particular, the hybrid power-train performance is considered a combined mode during take-off and climb phase, and only the turbine mode during cruise and landing. During cruise, if the required power is below the power of the maximum efficiency point of the turbine, the difference of the power can be used to recharge the battery pack and the energy can be used for taxiing mode too.
3. Modeling of Propulsion System
As said above, a hybrid parallel configuration was selected. Initially, some numerical investigations are carried out by using a commercial code able to simulate the flight mission, comparing fuel consumption and pollutant emissions of the original turboprop with the other two smaller, working in hybrid configuration. In a second phase, the battery pack’s weight is calculated through an optimization procedure through the use of MATLAB.
3.1. Base Configuration
The first simulations have been made considering the standard configuration currently used to obtain a reference behavior in terms of emissions and performance. The reference aircraft used to simulate a new electric hybrid propulsion system is the ATR 42-300. This aircraft gives room to a maximum of 48 passengers, can carry a maximum payload of 4640 kg, and the max take-off weight (MTOM) is 16,900 kg. The ATR 42-300 is propelled by two PW120A turboprop engines with a maximum power of 1491 kW each [21], characterized by a large diffusion in regional air transport industry, thanks to its reliability and profitability.
The main specification data of PW120A performances are reported in Table 1:

Table 1.
Engine1 (PW120) features.
The turbine inlet temperature (TIT) at the maximum power take-off condition was also unknown, but it was assumed to be 100 °C greater than the maximum cruise TIT [22]. In Figure 2 and Figure 3, the PW120 gas turbine scheme and the thermodynamic cycle at the design point are reported, respectively; the results are obtained assuming that the engine is a two spool turboprop, with a booster on high spool.
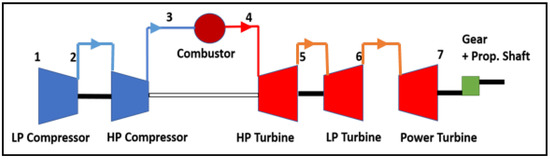
Figure 2.
Gas turbine scheme.
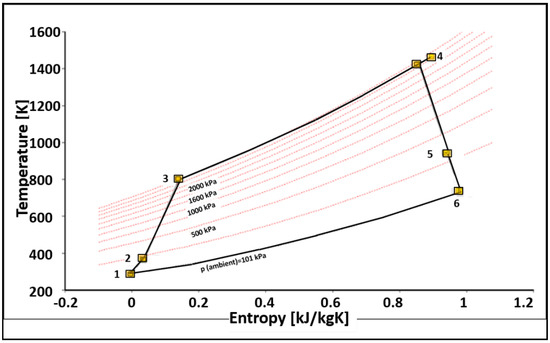
Figure 3.
Thermodynamic cycle at the design point.
To realize a flight cycle at the design point of PW120A (named in the following Engine1), the input data in Table 2 have been considered.
Table 2.
Input data for simulation of the “Engine1 at design point” and of the “power flight profile”.
Starting from the single cycle design point, some off-design simulations have been performed. Naturally, if more accurate simulations of a specific engine are desired, then special compressor and turbine maps should be used. Unfortunately, the company has never declared the component maps of the PW100 series, so there are different ways to obtain these maps with an admissible accuracy. In fact, it is important to underline that, because of the lack of knowledge of the real component maps, it can be possible to obtain estimated maps to try to minimize the gap from the real ones. In order to estimate the component maps, it is possible by either scaling maps of other components with similar characteristics or computerizing data from the PW120 compressor and turbine maps present in literature (Figure 4, Figure 5 and Figure 6).
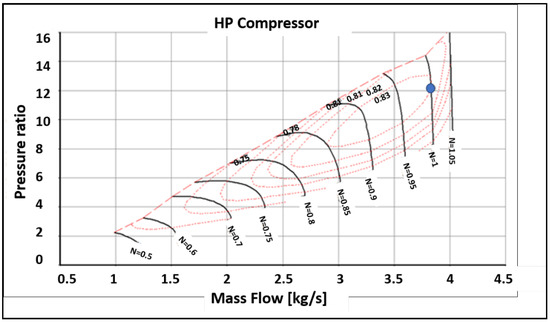
Figure 4.
HP compressor map of the Engine1.
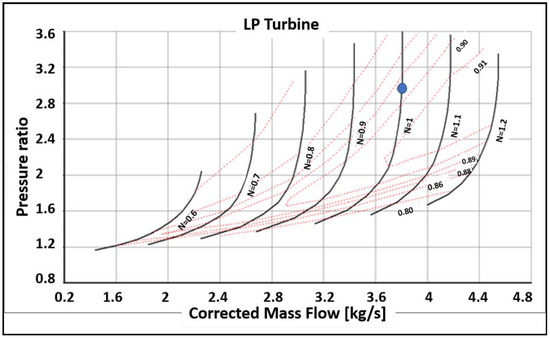
Figure 5.
LP turbine map of the Engine1.
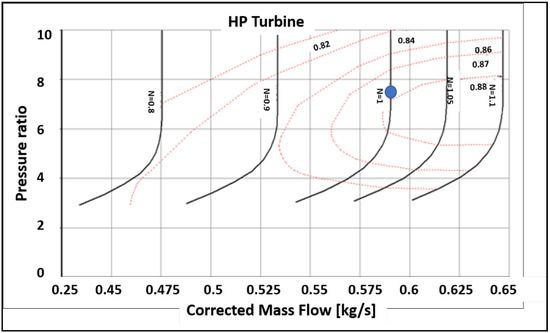
Figure 6.
HP turbine map of the Engine1.
The simulation of the engine during the descent, approach, and landing phase are carried out with the consideration that the engine control system, which is dependent on the throttle lever angle, guarantees that the certified spool speeds, temperatures, and pressures are not exceeded during both the transient and steady state operation. The diagram in Figure 7 shows the comparison between the thermodynamic cycle at the take-off, and during the cruise, with an altitude of 5516 m and a flight velocity of 0.333 Mach.
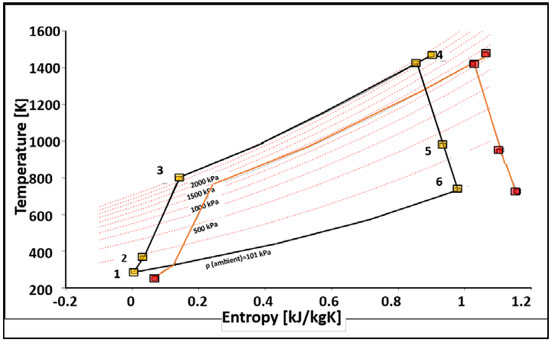
Figure 7.
Thermodynamic cycles for two points of the flight mission.
The performance of an aircraft is highly dependent on the mission profile. In this case study, a real flight has been considered (Figure 8) obtained by the website of the European Organization for the Safety of Air Navigation through Flightradar24, which is a flight tracker that shows live air traffic from around the world, and combines data from several data sources, including radar data [23], provides the altitude and velocity versus time information from the take-off phase until the descent phase of the chosen flight. In this case, the Toulouse–Rennes flight up to the descent phase at 2225 m has been considered for the simulations.
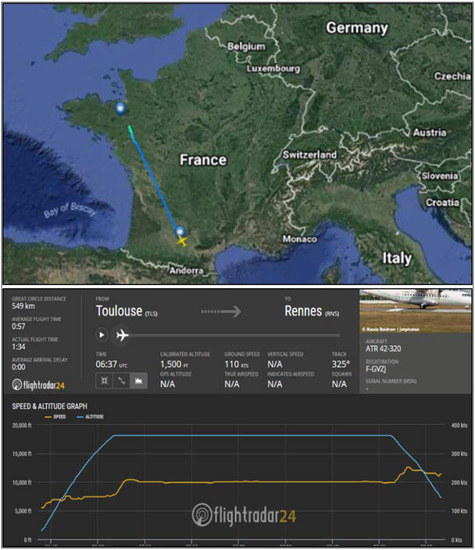
Figure 8.
Real flight profile.
Following the chart made available by Flightradar24, and considering this last premise, it was possible to build Figure 9 with Mach number versus time.
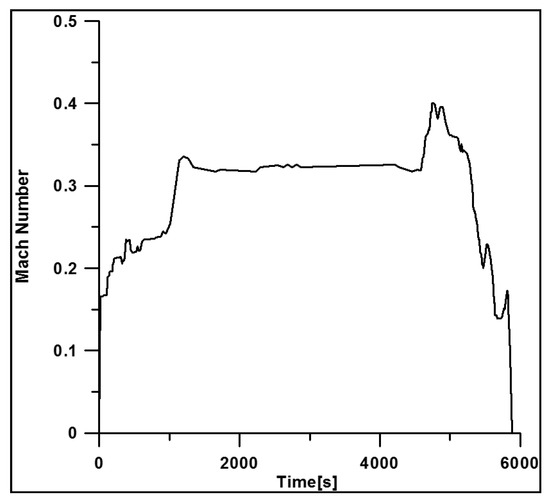
Figure 9.
Mach number profile.
In the Figure 10, the mission profile (altitude vs time) is plotted for the take-off, climb, and cruise phases. The results carried out from simulations are reported in the Figure 11 and Figure 12.
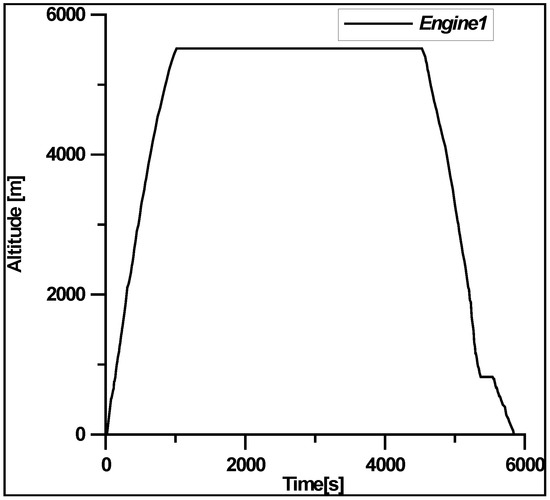
Figure 10.
Mission profile.
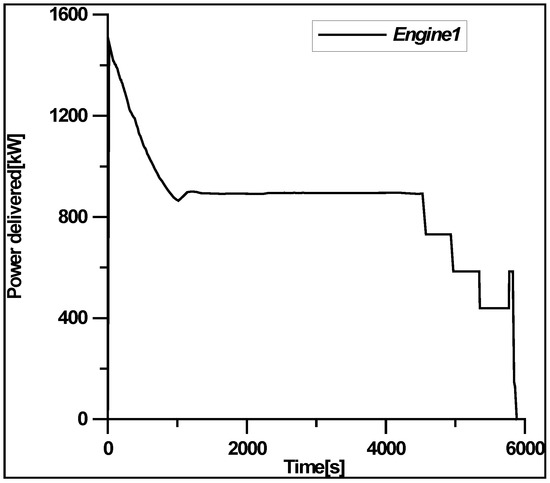
Figure 11.
Power delivered during the flight mission.
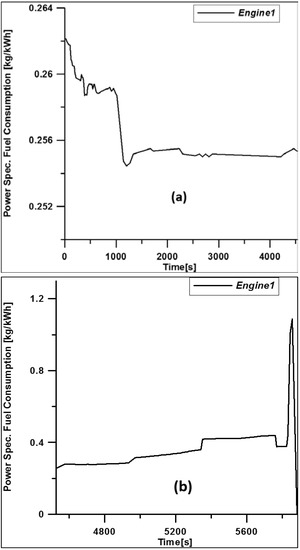
Figure 12.
Fuel consumption during the flight mission. In (a), the take-off, climb, and initial cruise phases; in (b), the last cruise and landing phases.
In particular, in Figure 11, the shaft power is plotted during the mission phases: the maximum value is reached during the take-off phase. The profile of power is calculated through the implementation of mechanical flight equations [24] in a MATLAB script; using as input data, the aerodynamics data of ATR42-300 (Table 2) and the altitude and speed profile, the values of the power in each point of the flight mission are calculated. In Figure 12, the specific fuel consumption (BSFC) is shown, with the left (a) and right sides (b) being several mission phases characterized by different scales; the lower value is obtained at the beginning of the cruise at load variation, at that point, keeping a rather constant value. According to the trend of required power, the thrust presents the maximum value at flight starting (take-off). The results obtained in Figure 11 are crucial for building the hybrid system. During the cruise phase, the power of the turbine is lower than the take-off and climbing phase: this could allow the use of a smaller size turboprop with a reduced nominal power until the power cruise phase, and supply the difference in power between the cruise power and the maximum power using an electric motor.
3.2. Emissions
Due to imperfect combustion, high combustion temperatures, and fuel impurities, pollutant emissions are also found in the exhaust of aeroengines. In spite of being greenhouse gases and, therefore, contributing to global warming, CO2 is not considered a pollutant species, because it is the natural consequence of the complete combustion of the fuel. Therefore, the emission of this species depends only on fuel consumption (4). From the BSFC trend (Figure 12) high levels of CO2 emissions are expected during take-off, climbing, and approaching phase. The emission of NOx (NO and NO2), besides damaging our planet, is also an important health problem. The emission of high levels of NO, the main compound of the emissions of NOx, at ground level, damages plant life, originates acid rain, and also contributes to the production of photochemical smog. The production of nitrogen oxides increases with pressure, temperature, and residence time in the combustor. The temperature is the main thermodynamic parameter which influences the thermal NO formation, but owing to the design of conventional burners, it also offers the greatest possibility for control. In the conventional engine, fuel is initially burned at approximately stoichiometric conditions and, subsequently, diluted to the desired leaner condition. The high temperatures in the primary combustion zone result in the rapid production of NO during its residence time, and set the value of the final emission level. The advantages of this arrangement are that the hot stoichiometric primary zone provides good stability, ignition, and relight, while the addition of dilution air allows convenient cooling of the combustor liner, and limits the temperature of the gas flow entering the turbine. The low-NOx burners are consequently designed to avoid the hot stoichiometric and dilution zones, thereby reducing emissions, but at the expense of stability and cooling problems [25].
The NOx emission index (EI) (g/kg fuel) increases linearly with the NOx severity parameter. For conventional combustors, it holds that
while for dual annular combustors, as in our case, the NOx emission is approximately
where
EI ~ 32 * SNOx,
EI ~ 23 * SNOx,
Otherwise, the carbon dioxide emission index EICO2 (usually expressed in (g/kWh)), is calculated starting by the fuel consumption, by means of the well-known expression
where BSFC is the brake-specific fuel consumption, and the mass ratio is obtained considering the combustion reaction of the kerosene (5) and the relatives molecular weights.
2 C12H26 + 37 O2 -> 24 CO2 + 26 H2O
4. Hybrid Configuration
In this section, hybrid configuration is simulated to replace the baseline gas turbine (Engine1), with two smaller gas turbines in terms of weight and take-off power. Then, a comparison between emissions of CO2 and NOx is performed. The two smaller engines have similar features to the PT6A-67-F (named Engine_2) and PT6A-68 (Engine_3) (Table 3). The calculations have been made considering the same arrangement of aircraft.
Table 3.
Gas turbine parameters.
4.1. Configurations with Engine_2
A first comparison between the Engine_2 and the PW120 gas turbine (Engine1) has been made, in terms of fuel consumption and emissions. The hybrid configuration with Engine_2 presents two different operating conditions during the cruise phase:
- −
- the gas turbine (Engine_2) keeps the same shaft power of the Engine1 (900 kW), which could allow the use of a permanent magnet synchronous electrical motor (PMSM) only during the take-off phase;
- −
- the gas turbine (now named Engine2_SFCmin) delivers a lower power that corresponds to the minimum specific fuel consumption of 760 kW (Figure 13). In this case, the electrical motor makes up for the power gap (Figure 14).
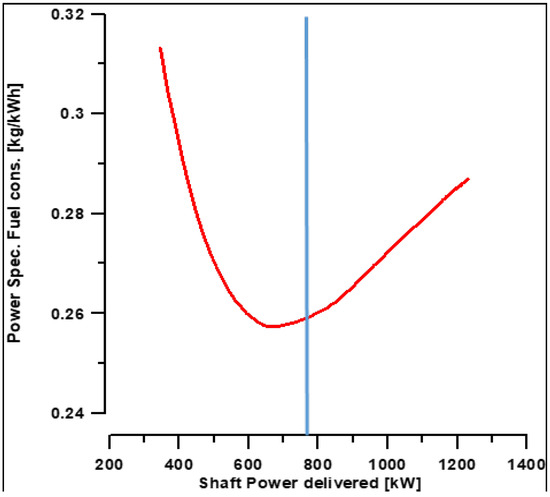 Figure 13. Specific fuel consumption vs power delivered at cruise altitude (5516 m). Engine_2.
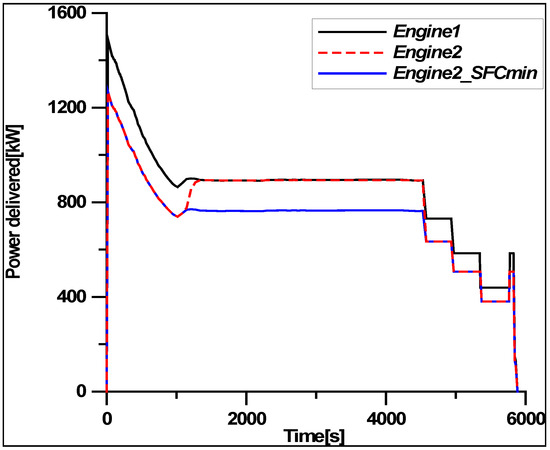 Figure 14. Power vs time of the Engine1 and Engine_2.
The results obtained in Figure 11, of the power delivered, are useful to build the hybrid system. In Figure 15, the specific fuel consumption (BSFC) is shown in the T/O and cruise phases: in both cases, with smaller gas turbine (Engine_2 and Engine2_SFCmin), the value is always higher than the one of the Engine1. As expected, at the cruise phase, a lower value is obtained with the Engine2_SFCmin with respect to the Engine_2.
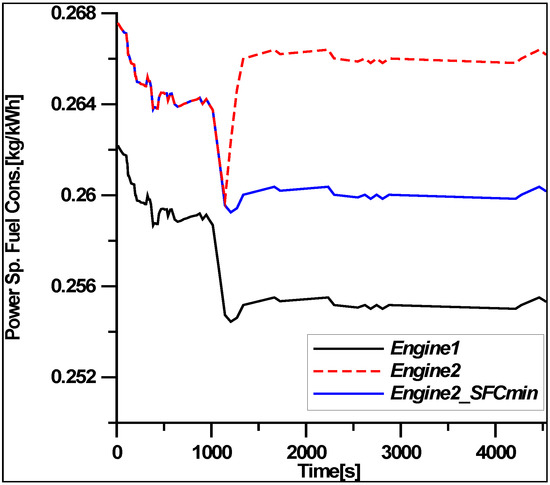
Figure 15.
Specific fuel consumption for the two configurations.
A comparison in terms of NOx and CO2 amounts is reported in Table 4, where the changes in percentage respect to the base case (Engine1) are written. The variation Δ2% and Δ2_SFCmin% are calculated for each flight phase to individuate the critical situation. From the results carried out, it is clear how Engine_2 and, especially, Engine2_SFCmin, foresee the use of a larger battery pack to the detriment of the payload. As expected, a significant improvement in terms of exhaust emissions could be achieved by working in hybrid configuration, even during the cruise phase.
Table 4.
Emissions results of Engine_2.
4.2. Configuration with Engine_3
The smallest gas turbine (Engine_3) is considered, in this last simulation, to investigate the feasibility of working more in electric mode, with the aim of reducing emissions. In Figure 16, the thermodynamic cycle is shown at fixed point.
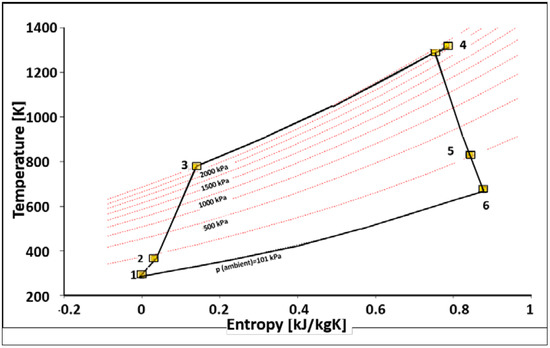
Figure 16.
Thermodynamic cycle for Engine_3 at the design point.
The calculations with Engine_3 have been made (Figure 17) in the only case of minimum fuel consumption mode in cruise phase (Figure 18), avoiding a wide increase of TIT temperature, not acceptable for turbine blades.
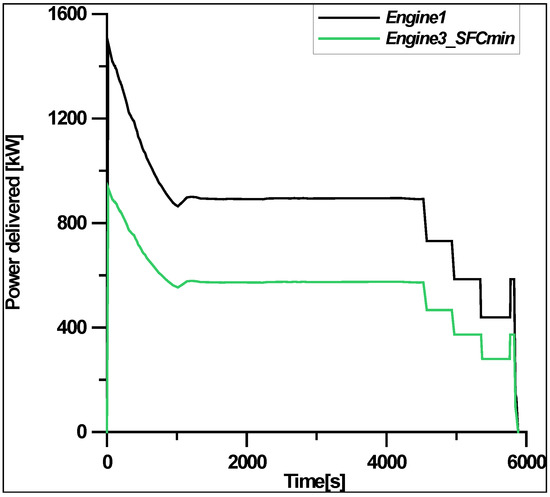
Figure 17.
Power vs time of the Engine_3.
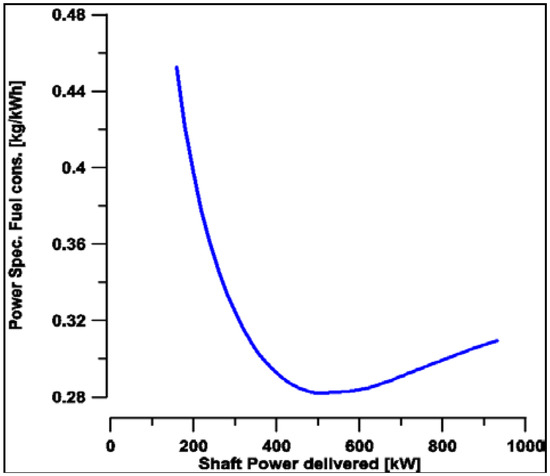
Figure 18.
Specific fuel consumption vs power delivered at cruise altitude (5516 m) of Engine_3.
As is possible to observe, the degree of hybridization for energy, defined in (6), is equal to 30% higher than the value obtained with Engine2_SFCmin, equal to 2.3%. This implies a natural reduction of CO2 and NOx emissions, as underlined in Table 5. In contrast, this hybrid configuration requires an energy significantly higher from the electric system and, consequently, an excessive weight of the batteries on board that makes this configuration not acceptable in the current aircraft arrangement.
Table 5.
Emissions results with Engine_3.
5. Sizing of the Battery Energy Storage System
The typical electrical power-train of a hybrid propulsion system is depicted in Figure 19. According to the topic of the paper, the figure shows the parallel hybrid configuration. The electrical drive is composed by the following parts:
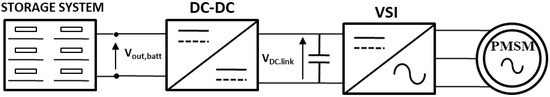
Figure 19.
Electrical scheme of the hybrid propulsion system.
- (1)
- High power density propulsion motor: due to the high power density and high efficiency, permanent magnet motors are the most suitable motors for the application; in order to increase the reliability, this motor can be realized in multiphase configurations [26]. The use of pitch control for the management of the propulsion power, gives the possibility to keep the angular speed practically constant and obtain a high value of efficiency;
- (2)
- DC–DC and DC–AC converters: the power converter chain is constituted by the DC–AC converters (typically a voltage source inverter) connected to the terminals of the electric motors [27]. The optimal management of the storage systems needs the use of a DC–DC, which can be made with a typical boost converter, or with the use of a dual active bridge with a rectifier. In the latter case, the use of a medium-high frequency stage permits the reduction of the weight and the achievement of a high ratio between the output and input voltage.
- (3)
- Storage system: in a hybrid power-train, the storage system could be based on battery, supercapacitors, or flywheel systems. The supercapacitors are widely used when the power profile has a large number of peak power, but their use is limited by the low energy density. Flywheels are characterized by a large lifetime with respect to the other type of storage systems here considered, but the use in electric vehicles is difficult due to safety problems. Therefore, now, a storage system based on Li-ion batteries is the most suitable solution for aircraft hybrid propulsion. The battery storage systems used on-board of the aircraft must be optimized to reduce the total weight. Usually, the optimal design of a battery storage system required respecting some equality and inequality constraints, which depend on the battery cell characteristics and on the type of power converters utilized.
5.1. Optimal Design of Battery Storage Systems
In this paper, an optimal design of the battery storage systems, which can be adapted in each one of the previous analyzed cases (Engine_2, Engine2_SFCmin, Engine_3), is proposed. The design is based on the solution of a single-objective optimization problem, described by the following equations:
subject to the following constraints:
The constraints referred to are the maximum discharge current of the battery cell, to the DC-link voltage adopted, and to the total electrical energy required in the flight. The first parameter is strictly related to the lifetime of the cells and, in order to maximize the life duration of the battery pack, must be satisfied in all conditions. The VDC,link influences the design of electric motors and their performances. According to the aeronautical standard [28], the maximum allowable DC voltage is 270 V, which cannot be sufficient when a high power is required. In the paper, the investigations shown in the following sections are carried out assuming the possibility to use both the 270 V and the 540 V voltage levels on the DC-link [29,30]. As previous mentioned, the storage system is connected to the DC-link using a DC–DC converter: the use of this converter allows the stabilization on the DC-link also during the performance of electric power-train, when the discharge of currents determines the reduction of output voltage of the battery pack. Obviously, the duty cycle of the boost converter is not fixed, and depends by the instant of calculation: this determines that the optimization problems, (4) and (5), must be solved for all the time instants of the flight. The evaluation of the electrical behavior is assured by the solution of the following mathematical model adopted for the calculation of the electrical parameters:
In the model, it is assumed that both the capacitances and the parasitic inductances of the battery cell are neglected. The global efficiency ηg takes into account all the efficiencies of the electrical power-train components (electric motor, power converters). Considering a constant temperature for all the devices (including the batteries) and a quasi-constant angular speed of the propellers, it is possible to assume that the global efficiency is constant. The two variables, d0 and d1, are measured in Volts, and are related to the discharge curve of the cells. It is important to note that the total propulsion power (which is the sum of the thermal engine and electric motor power) is fixed and equal to the total power required by the standard aircraft with the maximum take-off weight and for the considered flight. Hence, the adjunction of batteries, and of the electric power-train, determines a reduction of the payload and passenger numbers.
5.2. Solutions of the Optimization Problem
The optimization problems (4)–(6) have been solved using a random search method. This choice is due to the fact that two of the three independent variables must be integer numbers. The iterative procedure adopted is depicted in Figure 20.
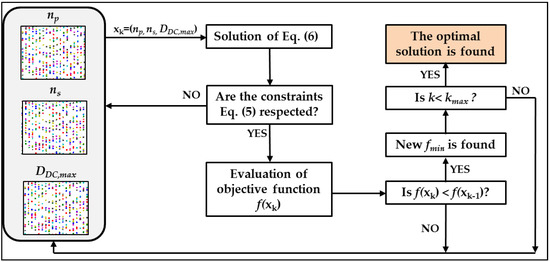
Figure 20.
Random search algorithm adopted for the solution of the optimization problem.
Considering a set of np, ns, and DDC,max, generated as a random uniform distribution, the mathematical model (6) is solved. If the constraints (5) are satisfied, the sets (np, ns, DDC,max) become feasible solutions for the problem, and the value of the objective function is stored. If the value of the objective function at kth iteration is less than the value at (k − 1)th iteration, a new optimal solution is found. If the total number of iterations reaches the value kmax (in our case, 2 × 10⁶), the last stored solution becomes the optimal solution.
6. Simulation Results
The solution of the previous problem is carried out using MATLAB. In order to obtain the best solution for the considered hybrid propulsion system, different numerical simulations are reported. In particular, as previous mentioned, two different levels of VDC,link are considered, and the simulations are performed using the cells reported in Table 6. The simulation of many cells with different capacity and discharge rate permits, also, finding the most suitable cells characteristics for the application. In the simulations, a maximum DDC,max of 6 has been assumed.
Table 6.
Cell characteristics.
In Table 7, the results obtained for Engine_2 are reported. In this case, the electric power-train supplies the power difference only during the take-off and the climb phase. The results are quite similar for both the two DC-link voltage levels. The best results are reached with Cell-9. Due to the absence of great peak power, the nearest results, in terms of weight, are all obtained with the cells characterized by a low value of discharge rate.
Table 7.
Engine_2.
The results obtained for the Engine2_SFCmin, with the optimization of fuel consumption and for Engine_3, are reported in Table 8 and Table 9, respectively.
Table 8.
Engine2_SFCmin.
Table 9.
Engine3_SFCmin.
In both cases, Cell-1 gives the best results in terms of mass; similar results are always obtained using cells with a low value of discharge current and battery capacity. In all three cases, the final SOC is about 20% of the full charge, while the value of DCDC,max is always respected. As it is possible to note, the results in terms of mass for the two DC-link voltage levels are the same and, therefore, the benefits in the use of greater voltage levels is only inherent in the reduction of wire weight and of the rated current of electric motor and power converters.
In order to consider the impact of the batteries’ mass on the flight, it is possible to define the number of non-revenue passengers (NNRP) as the ratio between the mass of the energy storage system and the average weight of a single passenger. Considering that only the best results obtained in the three cases (the mass of batteries must be doubled because the considered aircraft has two turboprops) and a standard mass for passengers plus baggage of 105 kg (88 kg and 17 kg respectively) [31], the NNRPs are reported in Table 10.
Table 10.
Number of non-revenue passengers due to the battery pack.
The results of Table 10 are obtained without any consideration of the variation of power-train mass: in fact, it is necessary to take into account the new mass of the turboprops (less than the original turboprops, as shown in Table 3), the mass of electric power-train, and the reduction of fuel mass. Assuming that the electric power-train mass is contained in the mass saved with the new turboprop, the reduction of fuel mass (data of Table 4 and Table 5) determines the values of NNRP reported in Table 11.
Table 11.
Number of non-revenue passengers.
From an economic point of view, the obtained values show that the solution with “Engine_2” appears, at the moment, to be the only feasible solution. This solution is unfortunately limited by the slightly increase of emissions during the cruise, but assures an emission reduction during the take-off and the climbing phase, (when the aircraft is often in the city area). A future increase of battery energy density will determine a reduction of NNRP also for the other two cases, which are more convenient in terms of emissions reduction.
7. Conclusions
The paper deals with the analysis of the hybridization of a regional turboprop aircraft. The hybridization of the power-train is carried out, substituting the original turboprop with other two of different power. The difference between the maximum take-off power and maximum turboprop power is supplied using an electric power-train. The thermal power-train is analyzed in three different cases of performance, and the evaluations of emissions and fuel consumption reduction are presented. Finally, the sizing of the battery storage system is obtained through a single objective optimization problem, solved using a random search approach. The results obtained, in terms of the number of non-revenue passengers, show that the actual feasibility of the hybrid flight is only during the take-off and the ascendant climb phase (Engine_2 results). Meanwhile, the use of the most convenient cases, in terms of emission/fuel consumption reduction, needs the increase of battery energy density and, considering the actual growth of battery technology, will become feasible in the next years.
Author Contributions
“Conceptualization and methodology”: M.C.C., A.D.P., C.P.; “Software and Investigation”: L.P.D.N., M.F.; “Writing—original draft preparation”: M.C.C., L.P.D.N., M.F.
Funding
This research received no external funding
Acknowledgments
This paper is supported by the Project “Power-train ad elevate prestazioni energetiche e dimensionali per la propulsione elettrica/ibrida di veicoli aerei, marini e terrestri”.
Conflicts of Interest
The authors declare no conflict of interest.
Abbreviations
| ACARE | Advisory Council for Aviation Research |
| BSFC (kg/kWh) | brake-specific fuel consumption |
| DDC,max | maximum duty ratio of the DC–DC converter |
| Δ (J/kg) | energy density of cell |
| Eele,req (J) | total electrical energy required during the flight |
| EI (g/kg) | emission index |
| EMs | electric motors |
| F (N) | thrust |
| HP | high pressure |
| h (m) | altitude |
| HEPS | hybrid electric propulsion systems |
| LP | low pressure |
| ICE | internal combustion engine |
| Ibatt (A) | current of a battery cell |
| Imax,disch (A) | maximum discharge current of a battery cell |
| LTO | landing take-off |
| M | Mach number (-) |
| MTOW (kg) | max take-off weight |
| mcell (kg) | mass of a single cell |
| np | number of parallel branches of battery storage system |
| ns | number of series cells of battery pack |
| p (kPa) | pressure |
| Qb (Ah) | cell capacity |
| Rb (Ω) | cell resistance |
| S (g/kg) | severity parameter |
| SOC | state of charge |
| SNOX (g/kg) | NOX severity parameter |
| TIT (K) | turbine inlet temperature |
| TOC | top of climb |
| T/O | take-off |
| t0 (s) | initial time instant of hybrid flight |
| tfin (s) | final time instant of hybrid flight |
| VDC,link (V) | DC-link voltage |
| Vout,batt (V) | output voltage of battery pack |
| ηg | global efficiency of electrical power-train |
References
- ICAO Enviromental Report 2010 Aviation and Climate Change. Available online: https://www.icao.int/environmental-protection/Documents/Publications/ENV_Report_2010.pdf (accessed on 31 October 2018).
- Advisory Council for Aeronautical Research in Europe (ACARE). European Aeronautics: A Vision for 2020. Available online: https://www.acare4europe.org/sites/acare4europe.org/files/document/Vision%202020_0.pdf (accessed on 31 October 2018).
- Pornet, C.; Isikveren, A.T. Conceptual design of hybrid-electric transport aircraft. Prog. Aerosp. Sci. 2015, 79, 114–135. [Google Scholar] [CrossRef]
- Cameretti, M.C.; Del Pizzo, A.; Di Noia, L.P.; Ferrara, M. Preliminary analysis of Hybrid-Electric propulsion system integrated in a regional aircraft. In Proceedings of the AEIT Congress, Bari, Italy, 3–5 October 2018. [Google Scholar]
- Frosina, E.; Senatore, A.; Palumbo, L.; Di Lorenzo, G.; Pascarella, C. Development of a lumped parameter model for an aeronautic hybrid-electric propulsion system. Aerosp. J. 2018, 5, 105. [Google Scholar] [CrossRef]
- Frosina, E.; Senatore, A.; Caputo, C.; Marinaro, G.; Di Lorenzo, G.; Pascarella, C. Modelling of a hybrid-electric light aircraft. Energy Proced. 2017, 126, 1155–1162. [Google Scholar] [CrossRef]
- Perullo, C.; Mavris, D. A review of hybrid-electric energy management and its inclusion in vehicle sizing. Aircraft Eng. Aerosp. Technol. 2014, 86, 550–557. [Google Scholar] [CrossRef]
- Friedrich, C.; Robertson, P.A. Hybrid electric-propulsion for automotive and aviation applications. CEAS Aeronaut. J. 2015, 6, 279–290. [Google Scholar] [CrossRef]
- Pornet, C.; Kaiser, S.; Isikveren, A.T.; Hornung, M. Integrated fuel-battery hybrid for a narrow-body sized transport aircraft. Aircraft Eng. Aerosp. Technol. 2014, 86, 568–574. [Google Scholar] [CrossRef]
- Müller, C.; Kieckhäfer, K.; Spengler, T.S. The influence of emission thresholds and retrofit options on airline fleet planning: An optimization approach. Energy Policy J. 2017. [Google Scholar] [CrossRef]
- Baharozu, E.; Soykan, G.; Baris Ozerdem, M. Future aircraft concept in terms of energy efficiency and environmental factors. Energy 2017, 140, 1368–1377. [Google Scholar] [CrossRef]
- Thauvin, J.; Barraud, G.; Roboam, X.; Sareni, B.; Budinger, M.; Leray, D. Hybrid propulsion for regional aircraft: A comparative analysis based on energy efficiency. In Proceedings of the ESARS-ITEC 2016, Toulouse, France, 2–4 November 2016. [Google Scholar]
- Friedrich, C.; Robertson, P.A. Hybrid-electric propulsion for aircraft. J. Aircr. 2015, 52, 176–189. [Google Scholar] [CrossRef]
- Gladin, J.; Trawick, D.; Perullo, C.; Tai, J.C.M.; Mavris, D.N. Modeling and design of a Partially electric distributed aircraft propulsion system with GT-HEAT. In Proceedings of the 55th AIAA Aerospace Sciences Meeting, Grapevine, TX, USA, 9–13 January 2017. [Google Scholar]
- Lenssen, R.H. Series Hybrid Electric Aircraft: Comparing the Well-to-Propeller Efficiency with a Conventional Propeller Aircraft. Master’s Thesis, Delft University of Technology, Delft, The Netherlands, 2016. [Google Scholar]
- Seitz, A.; Schmitz, O.; Isikveren, A.T.; Hornung, M. Electrically powered propulsion: Comparison and contrast to gas turbines. In Proceedings of the Deutscher Luft- und Raumfahrtkongress 2012, Berlin, Germany, 10–12 September 2012. ID: 281358. [Google Scholar]
- Bradley, M.; Droney, C.; Gowda, S.; Kirby, M.; Paisley, D.; Roth, B. NASA N+3 Subsonic Ultra Green Aircraft Research SUGAR Final Review; Boeing Research and Technology Presentation, Boeing Airplane Company; NASA: Washington, DC, USA, 2010.
- Masson, P.J.; Brown, G.V.; Soban, D.S.; Luongo, C.A. HTS machines as enabling technology for all-electric airborne vehicles. Supercond. Sci. Technol. 2007, 20, 748–756. [Google Scholar] [CrossRef]
- Brown, G.V. Weights and efficiencies of electric components of a turboelectric aircraft propulsion system. In Proceedings of the 49th AIAA Aerospace Sciences Meeting including the New Horizons Forum and Aerospace Exposition, Orlando, FL, USA, 4–7 January 2011. [Google Scholar]
- Kuhn, H.; Seitz, A.; Lorenz, L.; Isikveren, A.T.; Sizmann, A. Progress and perspectives of electric air transport. In Proceedings of the 28th International Congress of the Aeronautical Sciences (ICAS), Brisbane, Australia, 23–28 September 2012. [Google Scholar]
- ART First Generation. Available online: http://www.atraircraft.com/products_app/media/pdf/ATR_42-300-320.pdf (accessed on 31 October 2018).
- Specific Range Solutions Ltd. Parametric Specific Fuel Consumption Analysis of the PW120A Turboprop Engine. Available online: http://www.srs.aero/wordpress/wp-content/uploads/2009/03/srs-tsd-002-rev-1-pw120a-sfc-analysis.pdf (accessed on 31 October 2018).
- Flightradar 24. Available online: https://www.Flightradar24.Com/How-It-Works (accessed on 31 October 2018).
- Hull, D.G. Fundamentals of Airplane Flight Mechanics; Springer: New York, NY, USA, 2007. [Google Scholar]
- Committee of Aeronautical Technologies; Aeronautics and Space Engineering Board; Commission on Engineering and Technical Systems; National Research Council. Aeronautical Technology for the 21st Century; National Academy Press: Washington, DC, USA, 1992. [Google Scholar]
- Di Noia, L.P.; Rizzo, R. Design of a five-phase permanent-magnet motor for the electric steering of an aircraft nose landing gear. IET Electr. Syst. Transp. 2017, 7, 327–333. [Google Scholar] [CrossRef]
- Brando, G.; Dannier, A.; Del Pizzo, A.; Coppola, M. An all-electric-aircraft tailored SiC-based power factor correction converter with adaptive DC-link regulator. Energies 2017, 10, 1227. [Google Scholar] [CrossRef]
- Military Standard. Aircraft Electric Power Characteristics; Department of Defense Interface Standard (MIL-STD-704); United States Department of Defense: Arlington, VA, USA, 2004.
- Nya, B.H.; Brombach, J.; Schulz, D. Benefits of higher voltage levels in aircraft electrical power systems. In Proceedings of the 2012 Electrical Systems for Aircraft, Railway and Ship Propulsion, Bologna, Italy, 16–18 October 2012; pp. 1–5. [Google Scholar]
- Brombach, J.; Lücken, A.; Nya, B.; Johannsen, M.; Schulz, D. Comparison of different electrical HVDC-architectures for aircraft application. In Proceedings of the 2012 Electrical Systems for Aircraft, Railway and Ship Propulsion, Bologna, Italy, 16–18 October 2012; pp. 1–6. [Google Scholar]
- Berdowski, Z.; van den Broek-Serlé, F.N.; Jetten, J.T.; Kawabata, Y.; Schoemaker, J.T.; Versteegh, R. Survey on Standard Weights of Passengers and Baggage; Report No.: EASA 2008.C.06/30800/R20090095/30800000/FBR/RLO; EASA: Cologne, Germany, 2009. [Google Scholar]


© 2018 by the authors. Licensee MDPI, Basel, Switzerland. This article is an open access article distributed under the terms and conditions of the Creative Commons Attribution (CC BY) license (http://creativecommons.org/licenses/by/4.0/).