Article

Crack Growth in a Range of Additively Manufactured Aerospace Structural Materials

1
Computational Multiphysics Systems Laboratory, Code 6394, Center for Materials Physics and Technology, US Naval Research Laboratory, Washington, DC 20375, USA
2
Centre of Expertise for Structural Mechanics, Department of Mechanical and Aerospace Engineering, Monash University, Clayton, VIC 3800, Australia
3
Structures Division, Naval Air Systems Command, Patuxent River, MD 20670, USA
*
Author to whom correspondence should be addressed.
Aerospace 2018, 5(4), 118; https://doi.org/10.3390/aerospace5040118
Submission received: 26 September 2018 / Revised: 25 October 2018 / Accepted: 2 November 2018 / Published: 9 November 2018
(This article belongs to the Special Issue Civil and Military Airworthiness: Recent Developments and Challenges)

Abstract

:
The aerospace industry is now beginning to adopt Additive Manufacturing (AM), both for new aircraft design and to help improve aircraft availability (aircraft sustainment). However, MIL-STD 1530 highlights that to certify airworthiness, the operational life of the airframe must be determined by a damage tolerance analysis. MIL-STD 1530 also states that in this process, the role of testing is merely to validate or correct the analysis. Consequently, if AM-produced parts are to be used as load-carrying members, it is important that the d a / d N versus ΔK curves be determined and, if possible, a valid mathematical representation determined. The present paper demonstrates that for AM Ti-6Al-4V, AM 316L stainless steel, and AM AerMet 100 steel, the d a / d N versus ΔK curves can be represented reasonably well by the Hartman-Schijve variant of the NASGRO crack growth equation. It is also shown that the variability in the various AM d a / d N versus Δ K curves is captured reasonably well by using the curve determined for conventionally manufactured materials and allowing for changes in the threshold and the cyclic fracture toughness terms.

1. Introduction

Structural issues that have arisen because of aging aircraft have motivated a focus on the analytical tools needed to assess the growth of small naturally occurring material discontinuities and methods for extending the fatigue life of operational aircraft [1,2,3,4,5]. In this context, Appendix X3 of the ASTM fatigue test standard E647-13a and [6,7,8,9,10] indicate that the fatigue life of an operational aircraft is largely governed by the growth of cracks that nucleate and grow from small sub-mm material discontinuities. The NASGRO crack growth, expressed by Equation [11], viz:
da/dN = D ΔK(m-p)K − ΔKthr)p/(1 − Kmax/A)q
where D, m, p and q are constants, A is the cyclic fracture toughness, and Δ K t h r is defined as an apparent fatigue threshold which is dependent on the crack length and the R ratio, is perhaps the most widely used crack growth equation. A problem with Equation (1) is that the constants D, m, p and q are not unique, i.e., they are a function of the crack length. Consequently, in order to assess the crack growth in operational aircraft the challenge is to obtain a form of the NASGRO equation where this “artificial” crack length dependency vanishes. In this context, Ritchie, Yu, Blom and Holm [12], and subsequently [4], explained that the da/dN versus ΔK relationship associated with the growth of cracks from small naturally occurring defects follows from long crack data by removing the effect of crack closure and other crack tip shielding effects. This is achieved by adopting the Hartman-Schijve variant of the NASGRO crack growth equation [2,3,4,5,10,13,14,15,16] by setting m = p and q = p/2. This yields
da/dN = DK − ΔKthr)p/(1 − Kmax/A)p/2
When expressed in this form, the Hartman-Schijve variant of the NASGRO equation not only captures the long crack da/dN versus ΔK relationship but the same formulation with the same values of D and p and q and with, as per Appendix X3 of the ASTM fatigue test standard E647-13a, ΔKthr set to a small value (for small cracks, Appendix X3 questions the existence of a fatigue threshold) also captures the small crack da/dN versus ΔK relationship, and can be used to accurately predict the growth of small naturally occurring cracks under operational (variable amplitude) flight load spectra [2,3,4,5,10,13,14,15,16]. As such, Equation (2) represents a form of the NASGRO equation that, with the values of D, m (=p), p and q (=p/2) held constant, can be used to compute the growth of both long cracks and also naturally occurring cracks under operational flight loads. To the best of the authors’ knowledge, Equation (2) is the only form of the NASGRO equation that both fulfils the Ritchie, Yu, Blom and Holm requirement and has also been shown to capture the growth of small sub mm cracks under a large number of operational flight load spectra, viz: combat aircraft, civil aircraft, maritime aircraft, etc. [2,5,10,13,16]. Furthermore, to the best of the authors’ knowledge, Equation (2) is the only form of the NASGRO equation that has been shown to capture crack growth in AM Ti-6Al-4V fabricated in a wide range of AM processes [17]. With this in mind, and since if AM is to be used for replacement parts on operational aircraft the ability to assess the parts’ performance under operational flight loads is essential, this paper focuses on the use of Equation (2) to represent crack growth in a range of AM materials.
An additional feature of the Hartman-Schijve equation [18], i.e., Equation (2), is that, for traditionally manufactured structures and for structures repaired using either externally bonded composite patches or using additively metal deposition, the scatter in the d a / d N versus Δ K curves is captured by allowing for the variability in the term Δ K t h r [3,4,10,13,14,15,16]. Furthermore, as discussed in [4,10,16], the d a / d N versus Δ K curve needed to assess the growth of small naturally occurring cracks often can be determined from the corresponding d a / d N versus Δ K long crack curve by setting the term Δ K t h r to a small value, typically of the order of 0.1–0.2 MPa m .
Reference [16] also indicated that while it is commonly believed that two materials with different microstructures will have different (long crack) d a / d N versus Δ K curves, the experimental data suggest that this is not necessarily true. Furthermore, as shown in [16], even if the growth of long cracks in two materials with different microstructures have different d a / d N versus Δ K curves, the corresponding small crack curves can be similar [16].
We also know [19,20,21,22,23] that the Hartman-Schijve equation, i.e., Equation (2) with the term Δ K replaced by Δ G and K m a x replaced by G m a x where G is the energy release rate (for metals, G is linearly proportional to K ), also holds for cracking in adhesives and delamination growth in both composites and nano-composites. It is also known [20,21] that the large scatter seen in the delamination growth curves is also captured by allowing for the variability in the term Δ G | t h r and the effect of the test protocol on the cyclic fracture toughness term A .
With these in mind, and noting that the US Navy has announced [24] that the US Navy aircraft carrier John C. Stennis will become the first US Navy ship to have an advanced manufacturing lab, which will have four 3D printers, the present paper focuses on the topic of the use of AM to ensure continued aircraft availability. There are several ways for this to be achieved, viz:
  • The repair of damage using additive metal technologies [25,26,27,28], or by utilizing multiplicative manufacturing [29], which involves the combination of both additive and subtractive manufacturing.
  • The replacement of damaged components with additively manufactured parts [30].
In this context, References [25,26,27,28] have shown how additive metal technology can be used to:
  • Restore the load-carrying capacity of corroded wing skins;
  • Restore the load-carrying capacity of rib-stiffened wing skins with stress corrosion cracking in the ribs;
  • Seal fasteners and thereby help alleviate the effect of environmental damage;
  • Help alleviate the effect of multi-site damage in fuselage lap joints;
  • Increase the fatigue life of wing skins with intergranular cracking at fastener holes; and
  • Withstand approximately three lifetimes, without cracking or delamination from the airframe, when applied to an F/A-18 center barrel fatigue test article subjected to a measured (operational) flight load spectra.
We have also shown [5] that crack growth in structures repaired using additive metal technology can be accurately modelled using the Hartman-Schijve crack growth equation, i.e., Equation (2). Consequently, the present paper focuses on the ability of Equation (2) to model crack growth in AM Ti-6Al-4V, AM 316L stainless steel and AM AerMet100 steel. To this end, the present paper builds on the authors’ prior work [17] where it was shown that, regardless of whether the AM process is:
  • Electron Beam Melting (EBM);
  • Direct Metal Laser Sintering (DMLS);
  • Selective Laser Melt (SLM);
  • Hot Isostatic Pressing (HIP);
  • Laser engineered Net Shaping (LENS);
  • whether the LENS process is low- or high-power;
  • whether the build direction was horizontal or vertical.
The d a / d N versus Δ K curves, obtained using tests performed as described in the main body of the ASTM E-64-13a fatigue test standard, can be represented reasonably well by the Hartman-Schijve variant of the NASGRO crack growth equation, i.e., Equation (2), with allowance made for changes in the terms Δ K t h r and A . This finding mimics that discussed above for modelling the variability in the crack growth curves seen in conventionally manufactured metallic structures, structures repaired using additive metal deposition and for modelling the variability of delamination/disbond growth in composite and bonded structures.
The experimental data presented in this paper indicate that for the materials studied (namely AM Ti-6Al-4V, AM 316L stainless steel, and AM AerMet100 steel) the corresponding d a / d N versus ΔK curves can be represented reasonably well by the Hartman-Schijve variant of the NASGRO crack growth equation. It is also shown that the variability in the various AM d a / d N versus Δ K curves is captured reasonably well by using the curve determined for conventionally manufactured materials and allowing for changes in the threshold and the cyclic fracture toughness terms.

2. Crack Growth in Additively Manufactured Ti-6AL-4V

While AM offers the potential to economically fabricate customized parts with complex geometries, Reference [31] explained that the mechanical behavior of these materials must be better understood (related statements can be found in the US Federal Aviation Administration review paper [32], as well as in [17,33]) before AM can be utilized for critical load-bearing applications. This is particularly true for aircraft applications where, as detailed in MIL-STD 1530 [34], the design and certification approval requires analytical tools that are capable of modelling crack growth.
Reference [32] revealed the d a / d N versus Δ K curves associated with crack growth in 34 different AM Ti-6Al-4V tests, which covered a wide range of AM processes including EBM, DML, SLM, HIP, and LENS, could be represented using the Hartman-Schijve, viz:
d a d N = 2.79 × 10 10 ( Δ K Δ K t h r ( 1 K m a x A ) ) 2.12
In this study, the constants Δ K t h r and A were determined using a global optimization scheme that was based on a latin hypercubes approach. The objective function used in the scheme was:
f = ( i = 1 N k i = 1 K i | l o g ( d a d N ( D , p , Δ K t h r , A , R i , Δ K k i ) ) l o g ( d a d N | k i ) K i | ) / N ,
where N is the number of tests, i = 1 , ,   N is an index representing the i th test, R i is the value of R for test i , K i is the number of data points of test i , k i = 1 , ,   K i is an index representing the k i th data point of test i , Δ K k i is the value of Δ K for the i th test for the k i th data point and similarly d a d N | k i is the relevant data value of d a / d N . The objective function defined in Equation (4) was chosen such that it provides a measure of fit quality. Specifically, this value represents the average absolute error of the exponent base 10 of the fit to the measured d a / d N data. For each data point we can, in addition, establish the exponent error metric, as follows:
e = | l o g ( d a d N ( D , p , Δ K t h r , A , R i , Δ K k i ) ) l o g ( d a d N | k i ) | ,
The expression presented by Equation (5) can be plotted to provide a visual depiction of the goodness-of-fit associated with the various instances Equation (2). In this section, we first show that the AM Ti-6Al-4V crack growth data presented in [35,36,37], which were not studied in [17], also conform to Equation (3).

2.1. BELL Helicopter Crack Growth Data

Let us first consider the R = 0.1 d a / d N versus Δ K curves given by Bell Helicopters [35] for crack growth in AM Ti-6Al-4V samples that were obtained from several different suppliers, see Figure 1a. Although [35] does specifically state what AM process was used to manufacture the test specimens, it states that: “All builds were stress relieved and received Hot Isostatic Pressing (HIP) to ensure optimal mechanical properties”. Equation (3) was used to compute the curves associated with these tests. As per [4,10,31], the values of A and Δ K t h r were chosen to fit the data. The values used are given in Table 1. As can be seen in Figure 1, the resultant computed curves are in excellent agreement with the measured data. Furthermore, the error plots of Figure 1b indicate that the exponent error is well below 1.0, further corroborating the excellent agreement of the fitted parameters with the experimental data. It is interesting to note that the range of the threshold terms is similar to that obtained in [31] for fatigue tests performed on a range of other AM Ti-6Al-4V specimens.
Table 1 reveals a large variability in the cyclic fracture toughness parameter A. It is postulated that this may be attributed to either lack of data at Region III that does not allow us to obtain estimates with high certainty, or to the nature of AM processes. Further investigation on this matter will be conducted in follow-up work.

2.2. Laser Metal Wire Deposition (LMwD) Crack Growth Data

To further illustrate that crack growth in AM Ti-6Al-4V can be represented by Equation (3), consider the crack growth data given in [36] for specimens fabricated using Laser Metal wire Deposition (LMwD). In LMwD, a laser heat source melts a metal wire into the desired shape, and it is, in general, an attractive AM process for larger structures in which a higher deposition rate is required. In these tests, an initial semi-circular fatigue crack, approximately 0.7 mm in depth (except for specimen (2), where the pre-crack was 1.2 mm deep), was created from the notch by cyclic loading at a stress ratio R = 0.0 , a frequency F = 10 Hz and a maximum stress of 500 MPa . The tests were stopped at crack lengths around 2.5 mm, and the specimens were subsequently fractured in tension at room temperature. Figure 2 presents the resultant room temperature d a / d N versus Δ K curves for tests where crack growth was either parallel or perpendicular to the build direction. All specimens were post-weld heat-treated and annealed at 704 °C for 2 h and cooled in the furnace to 538 °C, after which the samples were taken out of the furnace and air cooled to room temperature. Reference [36] stated that this heat treatment is not expected to introduce any significant changes to the microstructure. The specimen surfaces were not machined.
Equation (4) was again used through a global optimization scheme to compute these curves. The identified values of Δ K t h r and A are given in Table 2. As per References [4,10,17], and as can be seen in the experimental data, the threshold values for these two tests differ. This is a somewhat expected result, since data are available only in the Paris region. As can be seen in Figure 2a, the resultant computed curves are in reasonably good agreement with the measured data, an observation that is also corroborated by the error plots in Figure 2b.

2.3. Boeing India Crack Growth Data

Next consider crack growth data presented by the Boeing India Research Centre [37] for crack growth in SLM Ti-6AL-4V specimens B3090 and S3090, where growth was parallel to and perpendicular to the build direction, respectively. In these tests, the samples were stress relieved by annealing them at 650 °C for 3 h. The surfaces were not machined. Figure 3 presents the measured growth data together with those presented in the Bell Helicopter and in the LMwD tests [35,36]. Here we see that these three different studies yielded similar d a / d N versus ΔK data. It would therefore be expected that the Boeing India d a / d N versus Δ K curves could again be represented as per [4,17] by Equation (3), albeit with similar values of Δ K t h r and A . To confirm this, the measured and predicted curves, using the values of A and Δ K t h r given in Table 3, are shown in Figure 4.

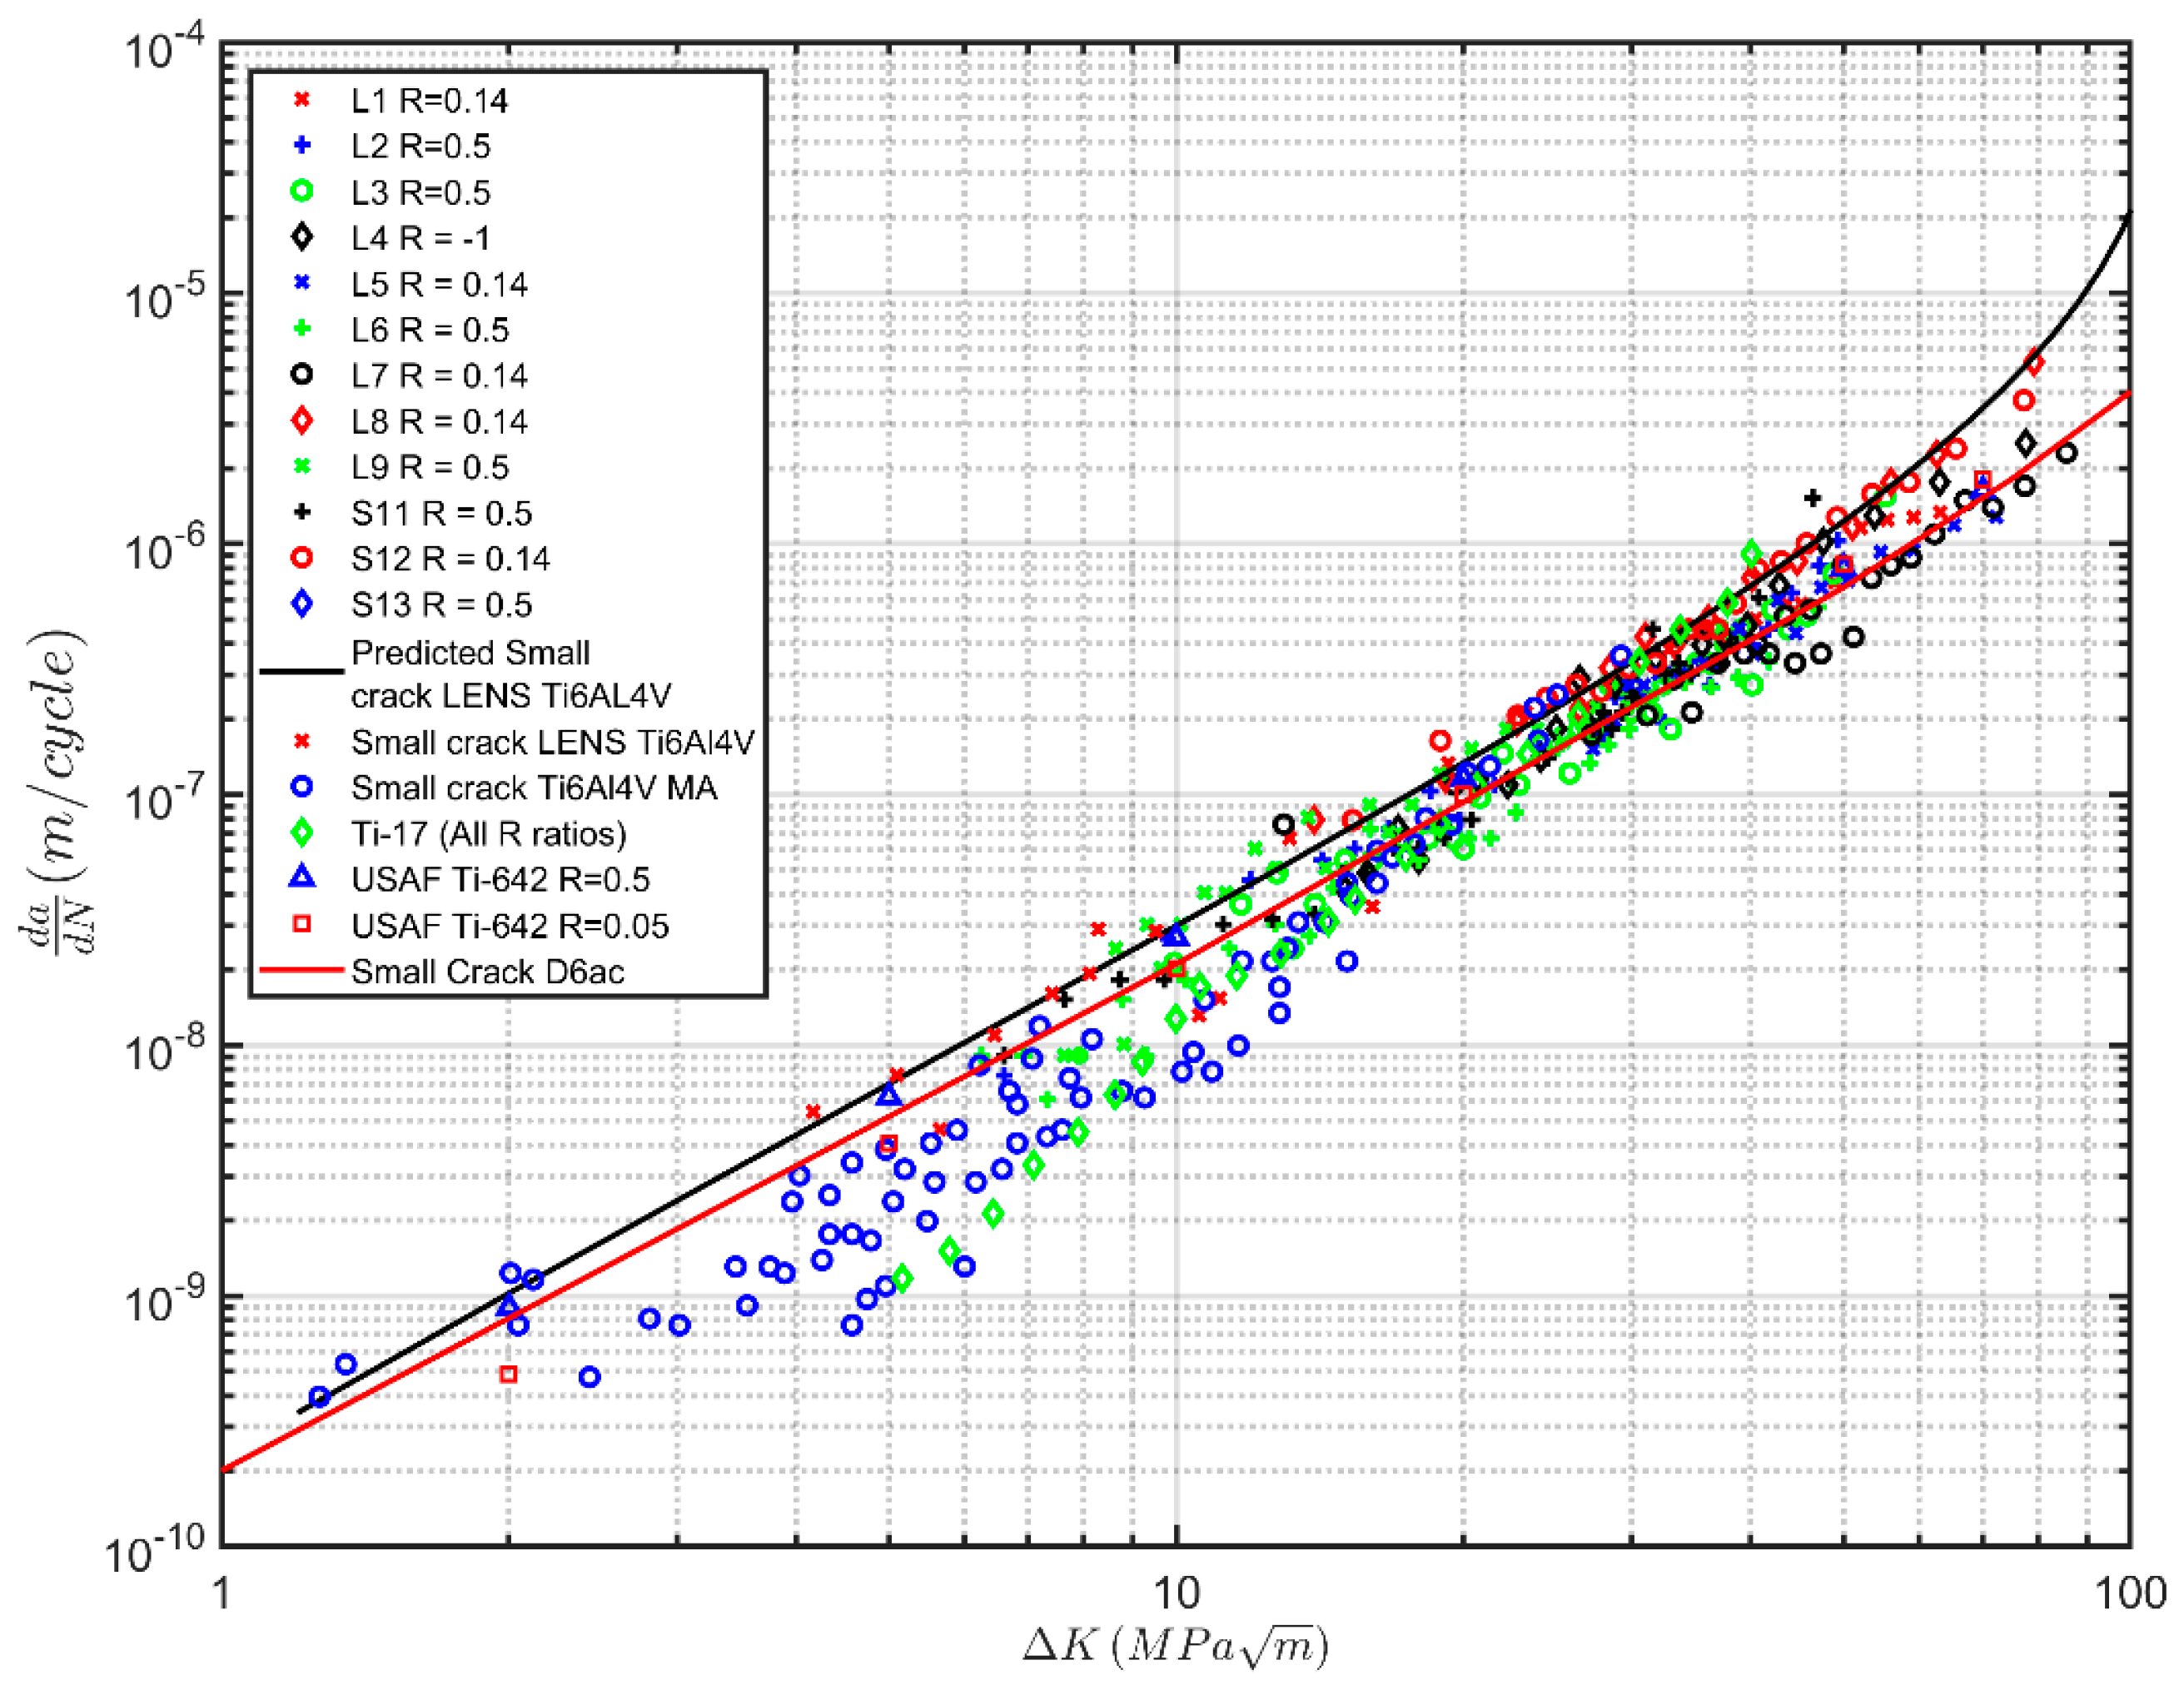
2.4. Small Crack Growth in LENS Ti-6Al-4V

The paper by Zhai et al. [38] noted that the use of long crack growth d a / d N versus Δ K curves to estimate the fatigue life of AM components may be non-conservative (Figure 5, from [39], illustrates how cracks can initiate and grow from small sub-mm material discontinuities, in this case a lack of fusion).
As such, let us next consider the growth of sub mm cracks in AM Ti-6Al-4V. As previously noted [2,3,4,10,13,14,15,16], it has been shown that the growth of small cracks under both constant amplitude and operational flight load spectra can often be estimated from the Hartman-Schijve long crack representation, i.e., Equation (3), by setting the threshold term Δ K t h r to a small value, typically of the order of 0.1 ( MPa m ) . As such, the results presented in [17] suggest that small crack growth in Mil Annealed Ti-6Al-4V should (approximately) conform to Equation (6):
d a d N = 2.79 × 10 10 ( Δ K 0.1 ( 1 K m a x 128 ) ) 2.12
To this end, Figure 6 presents the d a / d N versus Δ K curves associated with the growth of small cracks given in [40] for post-heat-treated LENS Ti-6Al-4V where the surfaces were not machined. For comparison, Figure 6 also presents:
  • The LENS Ti-6Al-4V small crack d a / d N versus Δ K curve predicted by Equation (6).
  • The small crack curve for Ti-17 [41]. In Reference [41], this curve was shown to be essentially R ratio-independent.
  • The R = 0.1 small crack curve for Ti-6246 [42].
  • The R = 0.1 short crack curve for Mil Annealed Ti-6Al-4V [43].
  • The R ratio-independent small crack curve for D6ac steel [4].
At this point, it should be noted that the review paper [16] revealed that the short crack d a / d N versus Δ K curves for the two different aerospace quality Titanium alloys Ti-17 and Ti-6246 were similar to that of a 350 MPa -grade locomotive mild steel. Consequently, Figure 6 also presents the d a / d N versus Δ K small curves associated with a 350 MPa -grade locomotive (mild) steel tested at a range of R ratios [44], see Table 4.
Figure 6 reveals that the d a / d N versus Δ K curve associated with the growth of small cracks in LENS Ti-6Al-4V is very similar to that seen for small crack d a / d N versus Δ K curves of Mil Annealed Ti-6Al-4V, Ti-6246, and Ti-17, and also to the small crack d a / d N versus Δ K curves seen by both D6ac steel and a 350 MPa -grade locomotive steel. We also see that the growth of small cracks in LENS Ti-6Al-4V can be reasonably well represented by Equation (6), which has the value of the fatigue threshold Δ K t h r set to a small value.
As such, Figure 6 supports the findings presented in [16] that, while the growth of specimens containing cracks that have been grown from artificially induced notches, as per E647-13a [6], can show significant microstructural effects, such effects may be not significant in the growth of small cracks. We also see that the small crack growth curve associated with LENS Ti-6Al-4V is similar to that of small cracks in MA Ti-6Al-4V, Ti-17 and Ti-642.

2.5. Discussion

The d a / d N versus Δ K t h r curves associated with each of these studies are consistent with Equation (3), and hence with the 34 different AM Ti-6Al-4V specimen test results (previously) analyzed in [17]. It is also clear that, as per [17], the cyclic fracture toughness ( A ) can vary significantly. The variation in the fatigue threshold ( Δ K t h r ) is also similar to that seen in [17], and as discussed in [17], is consistent, albeit in these tests slightly larger, with the variation seen in traditionally manufactured materials. However, according to the statements in Appendix X3 of the tests standard E647-13a [6]:
  • “Fatigue cracks of relevance to many structural applications are often small or short for a significant fraction of the structural life.”
  • “The growth rates of such cracks usually cannot be measured with the standard procedures described in the main body of Test Method E647, which emphasizes the use of large, traditional fracture mechanics specimen geometries.”
  • “Of greater importance, the growth behavior of these small cracks is sometimes significantly different from what would be expected based on large-crack growth rate data and standard fatigue crack growth analysis techniques. Direct measurement of small-crack growth rates may be desirable in these situations.”
  • “It is not clear if a measurable threshold exists”.
It follows that the fatigue threshold ( Δ K t h r ) associated with naturally occurring cracks in operational AM parts (this assumes that the parts will be annealed) will (in all likelihood) be small. Hence, the variation in the threshold, associated with the fastest growing (lead) cracks in these parts will (likely) be correspondingly small. This now leads us to the question: What is the effect of the variability in the cyclic fracture toughness ( A ) on the fatigue life of AM parts. In this context, E647-13a notes that for conventionally manufactured materials, the majority of the operational life of a structure is consumed in the short/small crack regime and that for such naturally occurring cracks the fatigue threshold is small. Consequently, for conventionally manufactured materials the effect on total life of the variability of the apparent toughness term A is generally small. In contrast, for AM materials, the variability in A can be quite large. As such, the effect of this (large) variability in the cyclic fracture toughness ( A ) on the fatigue lives of AM replacement parts needs further investigation.

3. Crack Growth in Two AM Steels

3.1. AM 316L Stainless Steel

In the previous analysis, we presented a method to identify the coefficients of the Hartman-Schijve variant of the NASGRO crack growth equation using a global optimization scheme. In cases were the availability of optimization or computational tools is limited, an alternative approach based on regular spreadsheet software can be used. Such a methodology for determining the constants in the Harman-Schijve variant of the Nasgro equation, i.e., Equation (2), from the measured d a / d N versus ΔK data was outlined in [16,44] and will be described in this section. The process outlined in [16,44] was: for a given R ratio, plot d a / d N against Δ K Δ K t h r 1 K m a x / A using log-log scales. Here, the value of A is chosen to be a typical value for the given material and thickness. In the near-threshold region, the effect of any errors in the assumed value of A in the term K m a x / A in the denominator will generally be small. As such, the value of Δ K t h r is now chosen such that plot of the d a / d N versus Δ K Δ K t h r 1 K m a x / A data in the near-threshold region, i.e., the low- d a / d N region, appears as a (nearly) straight line. The value of A is then fine-tuned to improve linearity in the high- Δ K region. This process is repeated for each of the R ratio data sets, with the A value used being kept the same for each R ratio. This process will generally result in d a / d N versus Δ K Δ K t h r 1 K m a x / A plots that differ slightly in the high- Δ K region. The value of A is then adjusted slightly, keeping the (adjusted) A the same for each R ratio, to minimize this difference, i.e., to better collapse the curves in the high- Δ K region. This process will sometimes result in the various d a / d N versus Δ K Δ K t h r 1 K m a x / A curves associated with different R ratio’s slightly diverging in the near-threshold region. This can be alleviated by slightly tweaking the values of Δ K t h r until the various curves now essentially coincide, while allowing for experimental error. At this stage, the values of Δ K t h r for each R ratio and the value of A have been obtained. The values of D and p are then obtained directly from a linear fit to the data.
To illustrate this, let us first consider the R = 0.1 ,   0.3 and 0.5 d a / d N versus Δ K presented in [45] for Annealed 316L stainless steel data. The resultant d a / d N versus Δ K Δ K t h r 1 K m a x / A curves are shown in Figure 7. This yields D = 1.49 × 10 10 and p = 1.99 with the values of A and Δ K t h r listed in Table 5, and the associated crack growth equation is:
d a d N = 1.49 × 10 10 ( Δ K 0.1 ( 1 K m a x A ) ) 1.99
These constants were then used to predict the d a / d N versus Δ K curves presented in [46] for AM 316L steels. The specific manufacturing processes studied in [46] were Selective Laser Melting (SLM) without post-processing and SLM followed by Hot Isostatic Pressing (HIP). In [46], tests were performed on specimens where crack growth was parallel to the build direction, in Figure 8, these specimens are labelled “SLM 1” and “SLM, HIP 1”. Tests were also performed on specimens where crack growth was parallel to the build direction, in Figure 8 these curves are labeled “SLM 2” and “SLM, HIP 2”. The corresponding computed crack growth curves are also shown in Figure 8.
Figure 8 also contains the measured [47] R = 0.3 tests on AM 316L steel specimens manufactured using laser rapid manufacturing (LRM), which employs a high-power laser beam to melt and deposit the raw material (in the form of wire or powder) in a layer-by-layer manner to build-up a three-dimensional functional component of desired geometry. The corresponding computed curves are also shown. The values of A and Δ K t h r used in Figure 8 are given in Table 6. Figure 8 also contains lower and upper bound predictions, and the corresponding values of A and Δ K t h r are also given in Table 6.
Figure 8 reveals that using the Hartman-Schijve equation for the growth of long cracks in conventionally manufactured 316L and allowing for the changes in A and the threshold captures the experimental data associated with AM 316L reasonably well, as was also noted in [17]. The higher values of the exponent error in Figure 8b can be attributed to the relative scatter of the experimental data, which is higher than that of the tests presented in the previous figures.
Furthermore, Figure 9 presents:
(a)
The crack growth curves given in [47] for the R = 0.3 tests on AM 316L steel specimens manufactured using laser rapid manufacturing (LRM).
(b)
The crack growth curves given in [48] for carburized (CT) and non-treated (NT) 316L.
(c)
The R = 0.05 d a / d N versus Δ K curves contained in the NASGRO materials data base for 316L steel in the Annealed and Fully Annealed condition.
(d)
A comparison with the (long) crack growth curves presented in [44] for bridge steels, and in [49] for crack growth in the high-strength aerospace steels 4340 and D6ac steel.
(e)
The d a / d N versus Δ K curves associated with a “Puddle steel” that was manufactured in Europe circa 1850 [50].
(f)
The predicted crack growth curves for test specimen SLM1 and the predicted upper and lower bound curves shown in Figure 8.
Figure 9 reveals that despite the differences in yield stress and microstructure, the da/dN versus Δ K curves associated with these very different steels largely fall between the upper and lower bound predictions.

3.2. AM AerMet100 Steel

AerMet 100 is widely used for landing gear and fasteners. It is an interesting material in that in the Paris region, it shows very little R ratio dependency and is relatively unaffected by the test environment [51]. This is shown in Figure 10, which presents the R = 0.3 and 0.5 data obtained by the US Navy [51] for tests performed in both dry hydrogen and in a 3.5% NaCl environment. For comparison, Figure 10 also reveals that the AerMet 100 d a / d N versus Δ K curves are quite similar to that of D6ac steel (which as shown in [49] is also essentially R ratio independent), and the bridge steel d a / d N versus Δ K master curve.
The resultant d a / d N versus [ Δ K Δ K t h r { 1 K m a x / A } ] curves are shown in Figure 11. This yields D = 5.06 × 10 10 and p = 1.81 . The values of A and Δ K t h r used in Figure 11 are listed in Table 7. The resultant crack growth equation for conventionally manufactured AerMet 100 steel is:
d a d N = 1.49 × 10 10 ( Δ K 0.1 ( 1 K m a x A ) ) 1.99
Figure 10 reveals that, with the values of A and Δ K t h r given in Table 7, the AerMet R = 0.1 and 0.5 crack growth curves can be reasonably well represented by Equation (8), and that the variation in the d a / d N versus Δ K curves is captured reasonably well by allowing the term to vary from 1.6 to 3.9 MPa m ; see Table 7.
Having characterized crack growth in conventionally manufactured AerMet 100, let us next examine crack growth in AM AerMet 100 [52]. The R = 0.1   d a / d N versus Δ K curves presented in [52] for Laser additive manufacturing (LAM) AerMet 100 are shown in Figure 12. Three different heat treatments were used. The heat treatment procedures resulted in three kinds of heat-treated microstructures, viz:
  • Coarse Grain Tempered Martensite microstructure (CG-TM);
  • Fine Grain Tempered Martensite microstructure (FG-TM);
  • Fine Grain Tempered Martensite microstructure with High contents of Retained Austenite (FG-TM-HRA).
Figure 11 also presents a comparison of the crack growth curves for conventionally manufactured D6ac steel and bridge steels with the computed curves for the AM AerMet 100 obtained using Equation (8) together with the values of A and Δ K t h r given in Table 7. Here we see that the coarse and fine grain microstructures essentially exhibit the same performance, and that they are in reasonably good agreement with the computed curves. As a result, Figure 11 only presents the computed curve for the FG material. We also see that the AM AerMet 100 d a / d N versus Δ K curves are similar to the d a / d N versus Δ K curves associated with crack growth in both D6ac and bridge steels.
Figure 12 also indicates that using the Hartman-Schijve representation for the growth of long cracks in conventionally manufactured AerMet 100 and allowing for the changes in A and Δ K t h r captures the experimental data associated with AM AerMet 100 quite well.

4. Conclusions

This paper has examined crack growth in three different additively manufactured aerospace materials. It is shown that, in each case, the various da/dN versus ΔK curves can be represented reasonably well by the Hartman-Schijve variant of the NASGRO crack growth equation. It is also shown that, as first revealed in [17] for crack growth in AM Ti-6Al-4V, the variability in the various da/dN versus ΔK curves is captured reasonably well by using the curve determined for conventionally manufactured materials and allowing for changes in the threshold and the cyclic fracture toughness terms.
Consequently, noting that
  • it is now known that the effects of micro-structure on the growth of small sub-mm naturally occurring cracks in conventionally manufactured aerospace materials is often small [16];
  • that crack growth in conventionally manufactured and AM materials appears to be able to be modelled using the Hartman-Schijve crack growth equation, i.e., Equation (1); and
  • that the growth of small cracks in LENS Ti-6Al-4V can be reasonably well predicted using the long crack Hartman-Schijve representation and setting the threshold term ΔKthr to a small value.
It is hypothesized that, in Regions I and II, the effect of different microstructures on the growth of naturally occurring sub-mm cracks in AM materials may also be small. This hypothesis needs to be evaluated further via tests on small naturally occurring cracks in AM materials.
If this hypothesis is true, and noting that for small naturally occurring cracks in operational aircraft, the fatigue threshold is likely to be small, then the next question to be addressed is: What is the effect of the variability in the cyclic fracture toughness A on the fatigue life of AM parts in operational aircraft. In this context, E647-13a notes that for conventionally manufactured materials, the majority of the operational life of a structure is consumed in the short/small crack regime, and that for such naturally occurring cracks, the fatigue threshold is small. Consequently, for conventionally manufactured materials, the effect on total life of the variability in the apparent toughness term A is generally small. In contrast, for AM materials, the variability in A can be quite large. This realization can result in a significant but informed AM part design process and subsequent maintenance cycle specification. In particular, the stochastic variability of the cyclic fatigue threshold can be determined, and appropriate reliability metrics can be incorporated in the design. The relevant metrics can then be used to establish maintenance specifications that include AM part lifetime predictions and replacement timelines. An additional extension can include studies that correlate the cyclic fatigue fracture toughness and the static fracture toughness. This correlation could lead to a significant reduction in the time needed to perform experimental determination of the fatigue crack life of the AM part. It is thus apparent that the effect of this (large) variability in the cyclic fracture toughness ( A ) on the fatigue lives of AM replacement parts needs further investigation.

Author Contributions

Conceptualization, R.J.; Methodology, R.J. and A.I.; Software, A.I.; Validation, A.I., R.J., J.M. and R.K.S.R.; Data Curation, R.J.; Writing-Original Draft Preparation, R.J.; Writing-Review & Editing, All authors.; Visualization, A.I.; Supervision, N.P., J.M. and R.J.; Funding Acquisition, J.M., R.J.

Funding

Support for this work by the Office of Naval Research through the Naval Research Laboratory’s core funding was provided to co-authors A.I. and J.M.

Acknowledgments

A.I. and J.M. acknowledge support for this work by the Office of Naval Research through the Naval Research Laboratory’s core funding.

Conflicts of Interest

The authors declare no conflict of interest.

References

  1. Tiffany, C.F.; Gallagher, J.P.; Babish, I.V.; Charles, A. Threats to Aircraft Structural Safety, Including a Compendium of Selected Structural Accidents/Incidents; ASC-TR-2010-5002; Aeronautical Systems Center, Engineering Directorate, Wright-Patterson Air Force Base: OH, USA, 2010. [Google Scholar]
  2. Jones, R.; Peng, D.; Singh, R.R.; Huang, P.; Tamboli, D.; Matthews, N. On the growth of fatigue cracks from corrosion pits and manufacturing defects under variable amplitude loading. JOM 2015, 67, 1385–1391. [Google Scholar] [CrossRef]
  3. Jones, R.; Molent, L.; Barter, S. Calculating crack growth from small discontinuities in 7050-T7451 under combat aircraft spectra. Int. J. Fatigue 2013, 55, 178–182. [Google Scholar] [CrossRef]
  4. Jones, R. Fatigue crack growth and damage tolerance. Fatigue Fract. Eng. Mater. Struct. 2014, 37, 463–483. [Google Scholar] [CrossRef]
  5. Jones, R.; Matthews, N.; Baker, A.; Champagne, V. Aircraft Sustainment and Repair; Butterworth-Heinemann Press: Oxford, UK, 2018; ISBN 9780081005408. [Google Scholar]
  6. ASTM Standard E647-13a Standard Test Method for Measurement of Fatigue Crack Growth Rates; ASTM International: West Conshohocken, PA, USA, 2013.
  7. Berens, A.P.; Hovey, P.W.; Skinn, D.A. Risk Analysis for Aging Aircraft Fleets—Volume 1: Analysis; WL-TR-91-3066; Flight Dynamics Directorate, Wright Laboratory, Air Force Systems Command, Wright-Patterson Air Force Base: OH, USA, 1991. [Google Scholar]
  8. Barter, S.A.; Molent, L.; Wanhill, R.H. The lead crack lifing framework. Int. J. Fatigue 2012, 41, 1–198. [Google Scholar]
  9. Molent, L.; Jones, R. A Stress versus Crack Growth Rate Investigation (aka Stress—Cubed Rule). Int. J. Fatigue 2016, 87, 435–443. [Google Scholar] [CrossRef]
  10. Jones, R.; Peng, D.; McMillan, A. Crack growth from naturally occurring material discontinuities. In Aircraft Sustainment and Repair; Jones, R., Matthews, N., Baker, A.A., Champagne, V., Jr., Eds.; Butterworth-Heinemann Press: Oxford, UK, 2018; Chapter 5; pp. 129–190. ISBN 9780081005408. [Google Scholar]
  11. Forman, R.G.; Mettu, S.R. Behavior of Surface and Corner Cracks Subjected to Tensile and Bending Loads in Ti-6Al-4V Alloy. In Fracture Mechanics 22nd Symposium, ASTM STP 1131; Ernst, H.A., Saxena, A., McDowell, D.L., Eds.; American Society for Testing and Materials: Philadelphia, PA, USA, 1992. [Google Scholar]
  12. Ritchie, R.O.; Yu, W.; Blom, A.F.; Holm, D.K. An analysis of crack tip shielding in aluminium alloy 2124: A comparison of large, small through-crack and surface fatigue cracks. Fatigue Fract. Eng. Mater. Struct. 1987, 10, 343–363. [Google Scholar] [CrossRef]
  13. Tamboli, D.; Barter, S.; Jones, R. On the growth of cracks from etch pits and the scatter associated with them under a miniTWIST spectrum. Int. J. Fatigue 2018, 109, 10–16. [Google Scholar] [CrossRef]
  14. Jones, R.; Huang, P.; Peng, D. Crack growth from naturally occurring material discontinuities under constant amplitude and operational loads. Int. J. Fatigue 2016, 91, 434–444. [Google Scholar] [CrossRef]
  15. Molent, L.; Jones, R. The influence of cyclic stress intensity threshold on fatigue life scatter. Int. J. Fatigue 2016, 82, 748–756. [Google Scholar] [CrossRef]
  16. Jones, R.; Singh Raman, R.K.; McMillan, A.J. Crack growth: Does microstructure play a role? Eng. Fract. Mech. 2018, 187, 190–210. [Google Scholar] [CrossRef]
  17. Jones, R.; Michopoulos, J.G.; Iliopoulos, A.P.; Raman, R.S.; Phan, N.; Nguyen, T. Representing Crack Growth in Additively Manufactured TI-6AL-4V. Int. J. Fatigue 2018, 111, 610–622. [Google Scholar] [CrossRef]
  18. Hartman, A.; Schijve, J. The effects of environment and load frequency on the crack propagation law for macro fatigue crack growth in aluminium alloys. Eng. Fract. Mech. 1970, 1, 615–631. [Google Scholar] [CrossRef]
  19. Jones, R.; Hu, W.; Kinloch, A.J. A convenient way to represent fatigue crack growth in structural adhesives. Fatigue Fract. Eng. Mater. Struct. 2015, 38, 379–391. [Google Scholar] [CrossRef]
  20. Jones, R.; Kinloch, A.J.; Michopoulos, J.G.; Brunner, A.J.; Phan, N. Delamination growth in polymer-matrix fibre composites and the use of fracture mechanics data for material characterisation and life prediction. Compos. Struct. 2017, 180, 316–333. [Google Scholar] [CrossRef]
  21. Yao, L.; Alderliesten, R.; Jones, R.; Kinloch, A.J. Delamination Fatigue Growth in Polymer-Matrix Fibre Composites: A Methodology for Determining the Design and Lifing Allowables. Compos. Struct. 2018, 96, 8–20. [Google Scholar] [CrossRef]
  22. Jones, R.; Steltzer, S.; Brunner, A.J. Mode, I., II and mixed mode I/II delamination growth in composites. Compos. Struct. 2014, 110, 317–324. [Google Scholar] [CrossRef]
  23. Jones, R.; Pitt, S.; Brunner, A.J.; Hui, D. Fatigue crack growth in nano-composites. Compos. Struct. 2013, 99, 375–379. [Google Scholar] [CrossRef]
  24. Stennis to Be First Aircraft Carrier with Additive Manufacturing Lab. Available online: https://insidedefense.com/daily-news/stennis-be-first-aircraft-carrier-additive-manufacturing-lab (accessed on 25 August 2018).
  25. Jones, R.; Matthews, N.; Peng, D.; Phan, N.; Nguyen, T. Applications of SPD to enhance the structural integrity of corroded airframes. In Aircraft Sustainment and Repair; Jones, R.N., Matthews, A.A.B., Champagne, V., Jr., Eds.; Elsevier Butterworth-Heinemann Press: Oxford, UK, 2018; Chapter 16; pp. 863–906. ISBN 9780081005408. [Google Scholar]
  26. Champagne, V., Jr.; Matthews, N.; Champagne, V., III. Introduction to Supersonic Particle Deposition. In Aircraft Sustainment and Repair; Jones, R., Matthews, N., Baker, A.A., Champagne, V., Jr., Eds.; Butterworth-Heinemann Press: Oxford, UK, 2018; Chapter 14; pp. 799–844. ISBN 9780081005408. [Google Scholar]
  27. Matthews, N. Additive Metal Technologies for Aerospace Sustainment. In Aircraft Sustainment and Repair; Jones, R., Matthews, N., Baker, A.A., Champagne, V., Jr., Eds.; Butterworth-Heinemann Press: Oxford, UK, 2018; Chapter 15; pp. 845–862. ISBN 9780081005408. [Google Scholar]
  28. Matthews, N.; Molent, L.; Barter, S.; Jones, R. Application of SPD to enhance the structural integrity of fuselage skins and centre barrels. In Aircraft Sustainment and Repair; Jones, R., Matthews, N., Baker, A.A., Champagne, V., Jr., Eds.; Elsevier Butterworth-Heinemann Press: Oxford, UK, 2018; Chapter 17; pp. 907–930. ISBN 9780081005408. [Google Scholar]
  29. Jones, R.; Peng, D.; Matthews, N. Multiplicative Manufacturing and Aircraft Sustainment. In Aircraft Sustainment and Repair; Jones, R., Matthews, N., Baker, A.A., Champagne, V., Jr., Eds.; Elsevier Butterworth-Heinemann Press: Oxford, UK, 2018; Chapter 18; pp. 931–938. ISBN 9780081005408. [Google Scholar]
  30. NAVAIR Marks First Flight with 3-D Printed, Safety-Critical Parts. NAVAIR News Release, NAVAIR Headquarters. Patuxent River, MD, USA, July 2016. Available online: http://www.navair.navy.mil/index.cfm?fuseaction=home.printnewsstory&id=6323 (accessed on 5 August 2018).
  31. Li, P.; Warner, D.H.; Fatemi, A.; Phan, N. Critical assessment of the fatigue performance of additively manufactured Ti-6Al-4V and perspective for future research. Int. J. Fatigue 2016, 85, 130–143. [Google Scholar] [CrossRef]
  32. Gorelik, M. Additive manufacturing in the context of structural integrity. Int. J. Fatigue 2017, 94, 168–177. [Google Scholar] [CrossRef]
  33. Yadollahi, A.N.; Shamsaei, N. Additive manufacturing of fatigue resistant materials: Challenges and opportunities. Int. J. Fatigue 2017, 98, 14–31. [Google Scholar] [CrossRef]
  34. MIL-STD-1530D; Department of Defense Standard Practice: Washington, DC, USA, 2016.
  35. Maxime, L.; Éric, T.; Gilles, R. Comparison of Mechanical Properties of Additively Manufactured Ti-6Al-4V Alloy Made Using Different Manufacturing Processes. In Proceedings of the AHS International 74th Annual Forum & Technology Display, Phoenix, AZ, USA, 14–17 May 2018. [Google Scholar]
  36. Åkerfeldt, P.; Colliander, M.H.; Pederson, R.; Antti, M.L. Electron backscatter diffraction characterization of fatigue crack growth in laser metal wire deposited Ti-6Al-4V. Mater. Charact. 2018, 135, 245–256. [Google Scholar] [CrossRef] [Green Version]
  37. Kumar, P.; Prakash, O.; Ramamurty, U. Micro-and meso-structures and their influence on mechanical properties of selectively laser melted Ti-6Al-4V. Acta Mater. 2018, 154, 246–260. [Google Scholar] [CrossRef]
  38. Zhai, Y.; Lados, D.A.; Brown, E.J.; Vigilante, G.N. Fatigue crack growth behavior and microstructural mechanisms in Ti-6Al-4V manufactured by laser engineered net shaping. Int. J. Fatigue 2016, 93, 51–63. [Google Scholar] [CrossRef]
  39. Walker, K.F.; Liu, Q.; Brandt, M. Evaluation of fatigue crack propagation behaviour in Ti-6Al-4V manufactured by selective laser melting. Int. J. Fatigue 2018, 104, 302–308. [Google Scholar] [CrossRef]
  40. Sandgren, H.R.; Zhai, Y.; Lados, D.A.; Shade, P.A.; Schuren, J.C.; Groeber, M.A.; Kenesei, P.; Gavras, A.G. Characterization of fatigue crack growth behavior in LENS fabricated Ti-6Al-4V using high-energy synchrotron x-ray microtomography. Addit. Manuf. 2016, 12, 132–141. [Google Scholar] [CrossRef]
  41. Cadario, A.; Alfredsson, B. Fatigue growth of short cracks in Ti-17: Experiments and simulations. Eng. Fract. Mech. 2017, 74, 2293–2310. [Google Scholar] [CrossRef]
  42. Jha, S.K.; John, R.; Larsen, J.M. Incorporating small fatigue crack growth in probabilistic life prediction: Effect of stress ratio in Ti-6Al-2Sn-4Zr-6Mo. Int. J. Fatigue 2013, 51, 83–95. [Google Scholar] [CrossRef]
  43. Wang, K.; Wang, F.W.; Cui, W.; Hayat, T.; Ahmad, B. Prediction of short fatigue crack growth of Ti-6Al-4V. Fatigue Fract. Eng. Mater. Struct. 2014, 37, 1075–1086. [Google Scholar] [CrossRef] [Green Version]
  44. Ali, K.; Peng, D.; Jones, R.; Singh, R.R.K.; Zhao, X.L.; McMillan, A.J.; Berto, F. Crack growth in a naturally corroded bridge steel. Fatigue Fract. Eng. Mater. Struct. 2017, 40, 1117–1127. [Google Scholar] [CrossRef]
  45. Alpas, A.T.; Edwards, L.; Reid, C.N. The effect of R-ratio on near threshold fatigue crack growth in a metallic glass and a stainless steel. Eng. Fract. Mech. 1990, 36, 71–92. [Google Scholar] [CrossRef]
  46. Riemer, A.; Leuders, S.; Thone, M.; Richard, H.A.; Troster, T.; Niendorf, T. On the fatigue crack growth behavior in 316L stainless steel manufactured by selective laser melting. Eng. Fract. Mech. 2014, 120, 15–25. [Google Scholar] [CrossRef]
  47. Ganesh, P.; Kaul, R.; Sasikala, G.; Kumar, H.; Venugopal, S.; Tiwari, P.; Rai, S.; Prasad, R.C.; Kukreja, L.M. Fatigue Crack Propagation and Fracture Toughness of Laser Rapid Manufactured Structures of AISI 316L Stainless Steel. Metallogr. Microstruct. Anal. 2014, 3, 36–45. [Google Scholar] [CrossRef]
  48. Hsu, J.-P.; Wang, D.; Kahn, H.; Ernst, F.; Michal, G.M.; Heuer, A.H. Fatigue crack growth in interstitially hardened AISI 316L stainless steel. Int. J. Fatigue 2013, 47, 100–105. [Google Scholar] [CrossRef]
  49. Forth, S.C.; James, M.A.; Newman, J.A.; Everett, R.A., Jr.; Johnston, W.M., Jr. Mechanical Data for Use in Damage Tolerance Analyses; NASA/TM-2004-213503 and ARL-TR-3375; NASA Technical Reports Server (NTRS): Washington, DC, USA, 2014.
  50. Lesiuka, G.; Szatab, M.; Correiac, J.A.F.O.; De Jesus, A.M.P.; Berto, F. Kinetics of fatigue crack growth and crack closure effect in long term operating steel manufactured at the turn of the 19th and 20th centuries. Eng. Fract. Mech. 2017, 185, 160–174. [Google Scholar] [CrossRef]
  51. Lee, E.U. Fatigue Crack Growth in AerMet 100 Steel; Report No. NADC-91111-60; Naval Air Development Center: Warminster, PA, USA, 1991. [Google Scholar]
  52. Ran, X.Z.; Liu, D.; Li, J.; Wang, H.M.; Cheng, X.; Zhang, J.K.; Tang, H.B.; Liu, X. Effects of microstructures on the fatigue crack growth behavior of laser additive manufactured ultrahigh-strength AerMet100 steel. Mater. Sci. Eng. A 2018, 721, 251–262. [Google Scholar] [CrossRef]
Figure 1. (a) Measured, from [35], and computed crack growth curves in the various directions (XY and YX) of AM and HIPed Ti-6Al-4V; (b) Exponent error of the fitted curves as computed using Equation (5).
Aerospace 05 00118 g001
Figure 2. (a) Measured, from [36], and computed crack growth curves in two directions of laser metal wire deposited Ti-6Al-4V; (b) Exponent error of the fitted curves as computed using Equation (5).
Aerospace 05 00118 g002
Figure 3. Measured crack growth in the Boeing India SLM specimens [37] compared with crack growth in the Bell Helicopter [35] and the LMwD [36] tests.
Aerospace 05 00118 g003
Figure 4. (a) Measured, from [37], and computed crack growth curves in the perpendicular (B3090) and parallel (S3090) directions of SLM-manufactured specimens; (b) Exponent error of the fitted curves as computed using Equation (4).
Aerospace 05 00118 g004aAerospace 05 00118 g004b
Figure 5. SEM image of the fatigue crack origin, a lack of fusion defect, in the SLM Ti-64, from [39] with its outline (in green) superimposed. Image Courtesy of Dr. Milan Brandt.
Aerospace 05 00118 g005
Figure 6. Comparison of small crack growth in LENS Ti-6Al-4V, Ti-6Al-4V MA, Ti-17, Ti-642, and a 350 MPa locomotive mild steel, which were tested at a range of R ratios, with the predicted small crack growth in small crack growth in LENS Ti-6Al-4V.
Aerospace 05 00118 g006
Figure 7. Plot of d a / d N versus Δ K Δ K t h r 1 K m a x / A for R = 0.1 ,   0.3 and 0.5 .
Aerospace 05 00118 g007
Figure 8. (a) Comparison of measured and computed curves for AM 316L; (b) Exponent error of the fitted curves as computed using Equation (5). Index “1” indicates crack growth parallel to the build direction, while index “2” indicates crack growth perpendicular to the build direction.
Aerospace 05 00118 g008
Figure 9. Measured and computed growth in AM 316L specimens.
Aerospace 05 00118 g009
Figure 10. (a) Measured and computed growth in conventionally manufactured AerMet 100 and comparison with crack growth curves for D6ac steel and bridge steels; (b) Exponent error of the fitted curves as computed using Equation (5).
Aerospace 05 00118 g010
Figure 11. Plot of d a / d N versus Δ K Δ K t h r 1 K m a x / A for R = 0.1 and 0.5 .
Aerospace 05 00118 g011
Figure 12. Measured and computed R = 0.1 crack growth curves for additively manufactured AerMet 100 and comparison with the crack growth curves for conventionally manufactured AerMet 100, D6ac steel and bridge steels.
Aerospace 05 00118 g012
Table 1. Values of Δ K t h r and A used in Figure 1 and identified by global optimization of Equation (4).
Bell Helicopter Tests [35]ΔKthr (MPa m )A (MPa m )
Supplier 1 XY3.74134.9
Supplier 1 YX3.2632.1
Supplier 2 XY4.05330
Supplier 2 YX4.3971.7
Supplier 4 XY3.8575
Supplier 4 YX4.0874.7
Supplier 5 XY3.9277.4
Supplier 5 YX2.6484.6
Table 2. Values of Δ K t h r and A used in Figure 2 and identified by global optimization of Equation (4).
Laser Metal Wire Deposition Tests [36]ΔKthr (MPa m )A (MPa m )
Perpendicular RT3.1146.9
Parallel RT8.5952.3
Table 3. Values of Δ K t h r and A used in Figure 1 and identified by global optimization of Equation (4).
Boeing India SLM Tests [37]ΔKthr (MPa m )A (MPa m )
B30904.12200
S30903.0760.4
Table 4. Test envelope, from [16], for small cracks growth in a locomotive steel.
Specimen NumberRσmax (MPa)σmin (MPa)Δσ (MPa)σmean (MPa)
L10.14330.046.2283.8188.1
L20.50330.0165.0165.0247.5
L30.50330.0165.0165.0247.5
L4−1.0240.0−240.0240.00.0
L50.14330.046.2283.8188.1
L60.50330.0165.0165.0247.5
L70.14330.046.2283.8188.1
L80.14330.046.2283.8188.1
L90.50330.0165.0165.0247.5
S110.50330.0165.0165.0247.5
S120.14330.046.2283.8188.1
S130.50330.0165.0165.0247.5
Table 5. Values of Δ K t h r and A used in Figure 7.
R RatioΔKthr (MPa m )A (MPa m )
0.111.169
0.38.069
0.56.269
Table 6. Values of Δ K t h r and A used in Figure 8.
R RatioΔKthr (MPa m )A (MPa m )
HIP 1, R = −13.5720.7
HIP 2, R = −13.8820.7
SLM 1, R = −12.5937
SLM 2, R = −13.9220.4
Upper bound prediction220
Upper bound prediction745
Table 7. Values of Δ K t h r and A used in Figure 11 and Figure 12.
TestΔKthr (MPa m )A (MPa m )
US Navy Tests [51]:
R = 0.1, dry hydrogen3.11300
R = 0.1, 3.5% NaCl3.89300
R = 0.5, dry hydrogen1.61300
R = 0.5, 3.5% NaCl2.36300
From [52]:
AM AerMet 100, CG-TM [52]5300 *
AM AerMet 100, FG-TM 5300 *
AM AerMet 100, FG-TM-HRA7.5300 *
* Having determined a value of A = 300 MPa m for conventionally manufactured AerMet 100, it was logical to first assess if, when using that value, the computed da/dN versus ΔK curves associated with AM AerMet 100 were in reasonable agreement with the measured curves. Since they were, see Figure 12, no attempt was made to refine the value of A.

