Abstract
This paper describes a case study for applying a hybrid electric propulsion system for general aviation aircraft. The work was performed by a joint team from the Centro Italiano Ricerche Aerospaziali (CIRA) and the Department of Industrial Engineering of the University of Naples Federico II. The use of electric and hybrid electric propulsion for aircraft has gained widespread and significant attention over the past decade. The driver of industry interest has principally been the need to reduce the emissions of combustion engine exhaust products and noise; however, studies have revealed the potential for overall improvement in the energy efficiency and mission flexibility of new aircraft types. The goal of the present study was to demonstrate the feasibility of aeronautic parallel hybrid electric propulsion for light aircraft, varying mission profiles and electric configurations. Through the creation and application of a global model with AMESim® software, in which every aspect of the components chosen by the industrial partners can be represented, some interesting studies were carried out. The numerical model used was more complete and more accurate compared to some others available in the literature. In particular, it was confirmed that, for particular missions, integrating state-of-the-art technologies provides notable advantages for aircraft hybrid electric propulsion for light aircraft.
1. Introduction
The aviation industry is responsible for 12% of the total transportation impact of CO2. Since awareness of the need to decrease the total carbon footprint is rising, both the aerospace and automotive industries are facing increasing pressure from society to make the transportation sector more sustainable. Within the automotive industry, quick growth in electric vehicles can be noticed. Additionally, in the aerospace industry, a rise in electrification can be observed, with small aircraft such as the E-Star and E-Fan [1] (two-seaters) being commercial examples of this. The electrification of the transportation sector could further result in decreased noise and an increased lifespan of parts as vibrations are decreased.
The present research is focused on the study of aeronautical hybrid electric propulsion to analyze consumption and emission saving compared to a benchmark internal combustion engine (ICE). The request for greener propulsive systems is dictated by near future targets in terms of air pollution and noise. Currently, aviation is responsible for a considerable proportion of CO2 introduced into the atmosphere: about 12% as reported by National Geographic in 2015 [2]. Aircraft emitted about 700 million tons of CO2 during 2013 [2], and it has been estimated that, without any changes, this figure will triple by 2050 [2]. Another interesting study has been carried out by British Airways [3]. The local quality of air near airports presents high concentrations of NOx and CO, and these concentrations are regulated by an EU directive [4,5]. Aircraft electrification represents the best option to reach ideal “clean” and high-efficiency mobility. For this reason, in recent years, electricity has been applied to achieve reductions in noise and emissions. Electrical technology has developed new systems to improve velocity and autonomy, however the electrification of aircraft has many obstacles, which are essentially related to the battery pack and density of energy. The aim of many studies is to improve the energy density of batteries to support modern electric motors for greater endurance.
Fully replacing fossil fuels with green energies is impossible in the near future, and consequently, different technological solutions to reduce the environment impact of emissions must be applied. For this reason, the European Union has established a program called Clean Sky, which is the largest European research program to develop innovative cutting-edge technology aimed at reducing environmental and noise emissions due to aeronautical vehicles.
In this scenario, hybrid propulsion technology can represent a solution for the near future. Propulsive hybridization consists of mechanically coupling, in series or in parallel, an ICE with an electric machine connected to a battery system, where the ICE is the principal powering device. The use of two different types of propulsion allows benefits from the advantages to be realized and eventual issues of each type to be compensated for. In this way, the power unit increases in efficiency. Hybrid propulsion systems are showing success in the transportation sector by integrating the best of thermal power with electrical power, thus causing a reduction in total pollution. However, this reduction must be maximized compared with the normal propulsion system.
The specific energy of liquid fossil fuel is 50 times higher than that of batteries. Therefore, this aspect must be considered in the study of a hybrid architecture.
Cui et al. [6] modeled, simulated and optimized the operation of an aeronautic hybrid electric system similar to that used in the current study. The electric machine is located on the same shaft of the ICE, and therefore both components rotate at the same speed. The shaft is then connected to the propeller. In 2012, Ausserer and Harmon [7] simulated and prototyped a hybrid electric system for a small, remotely-piloted airplane. This airplane was powered by the ICE of a Honda GX 35 (35 cm3), with a power of 0.97 kW at 7000 rpm, and the AXI 4130/20 electric motor, with a power of 0.64 kW, powered by six TP3300-4S batteries (lithium polymer, 0.248 kWh). In 2014, Friedrich and Robertson [8] simulated and prototyped a hybrid electric system for an ultralight aircraft. The plane was the type SONG, developed by Gramex Ltd., which is usually equipped with a Bailey V5 (200 cm3) engine capable of delivering up to 15 kW. The Bailey engine was replaced by a Honda GX160 (7.5 kW at 7000 rpm in 12 kg) engine connected with a DC brushless JM1 of Joby Motors (12 kW in 2.8 kg), which is also able to work as a generator to recharge the battery.
This paper focuses on the hybridization of an ultralight aircraft called the Tecnam P2010 [9].
The sizing and choice of each component was determined using a numerical approach with the commercial code AMESim®, developed by Siemens®. The model results were subsequently compared with the performance of the baseline configuration. A model of the baseline propulsion system was also built. The simulations predict fuel savings of over 12% for the training profile and 6% for the cruise profile.
The research presented in this paper is in line with all previous studies that addressed the improvement of technologies to respond to the requests of enabling more electric flights, especially for higher-power classes (starting from commuter class).
The main contribution of this work is the demonstration that a hybrid propulsive system can be used for light general aviation with a useful, robust and accurate numerical model of the entire system.
This research is still in progress in order to experimentally demonstrate the results obtained with the numerical model.
2. Description of the Hybrid Electric Propulsion System
Since the aim of the present study was to demonstrate the feasibility of hybrid electric propulsion for an ultra-light aircraft, it was conducted on an aircraft already available on the market and powered by a conventional ICE. The results show that a hybrid electric solution is optimal for this category of aircraft to reduce both emissions and fuel consumption.
The analyzed ultra-light aircraft was a Tecnam P2010, which is usually equipped with the IO-360-M1A (powered by AVGas 100LL) engine, built by AVCO Lycoming [10]. The IO-360-M1A has four opposing cylinders, is air cooled and has a maximum power of 130 kW and a displacement of 5900 cm3. The total weight of the engine is 135 kg, and when installed in the ultra-light aircraft the total weight is 190 kg. A hybrid electric motor must have the same power and the same weight to be proposed as an alternative to the ICE.
The hybridization of the engine consists of the introduction of a smaller ICE combined with an electric machine, an inverter and a battery pack.
The Hybrid Electric Configuration, System Propulsion Scheme and Hybridization Grade
A parallel hybrid electric architecture was chosen after a complete analysis of the various configuration alternatives. With a parallel architecture, the ICE was chosen to ensure the power required for cruising, while the electric motor (EM) intervened at the stage where maximum power is required (takeoff and climb). In this way, the ICE can operate at minimum specific consumption (maximum efficiency) during cruising, while using the electric machine as a generator to recharge the battery pack. The layout of the chosen architecture is presented in Figure 1.
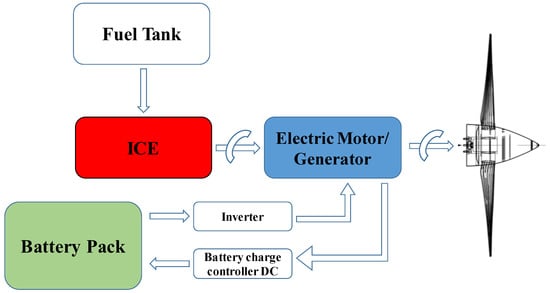
Figure 1.
Layout of the hybrid propulsion system.
As shown in Figure 1, the EM/generator and the ICE were linked to the same shaft, working at the same speed. The rotating speed of both motors was reduced, with a ratio of 2:1 before the propeller. This configuration allowed a remarkable saving of weight, since both motors are located in a one single block.
Each component of the system was chosen by considering that the hybrid electric solution must cover the aircraft requests, replace the original propulsion and add an electrical machine, which can also function as generator, and a battery pack [11,12].
The ICE chosen in this research was the CMD 22, manufactured by the Italian company CMD. The CMD 22 is a positive ignition engine for ultra-light aircraft (maximum takeoff mass of 1200 kg), which is powered by an automotive fuel with four cylinders in a boxer configuration. Its displacement is 2200 , its maximum power is 102 kW and the total weight is 82 kg [13].
The injection system (direct injection) was made by two electrical injectors, placed on the aspiration manifold of each cylinder, and by two ignitions. The cylinders were located opposite horizontally, and closed in one block in which the camshaft managed the four intake and exhaust valves for each cylinder. The CMD engine is shown in Figure 2 and the main features are listed in Table 1.
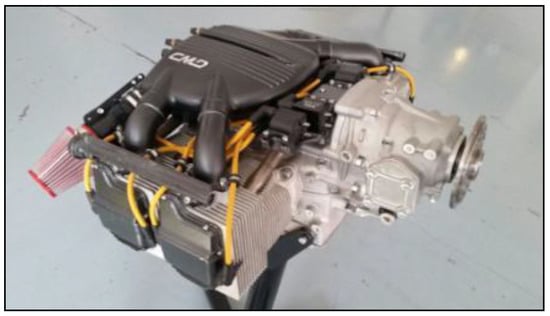
Figure 2.
The CMD 22 internal combustion engine.

Table 1.
Technical data for the CMD 22 engine.
Since the propeller must work at 2700 rpm, both engines will run at about 5400 rpm. At this rotation speed, the CMD 22 ICE gives a power output of 90 kW while the remaining 35 kW comes from the electric engine, replacing the performance of the original propulsion. An important aspect is that, as said, the overall weight of the entire system must be below the weight (135 kg) of the Lycoming IO-360-M1A engine. For this reason, since the CMD 22 engine had a weight of 82 kg, the total weight of the electric machine, the battery and the control systems had to be about 65 kg.
Today, there are some ultra-light motors in production with a kW–kg ratio of 5. Considering a small motor of 6–8 kg, the control systems and the auxiliaries, the maximum weight of the battery pack is 55 kg.
The total weight of the aircraft can be reduced by about 15 kg by also using the electric machine as a starter motor. Another important aspect that must be considered in the choice of the EM is its capacity to run under several operative conditions, as indicated in Table 2.

Table 2.
Starter torque for different temperature conditions.
EMs for aeronautical applications must respect many other peculiarities. There are examples in the literature in which the practical applicability of HTS (high temperature superconducting) has been demonstrated in a full-electric aircraft [14,15]. HTS motors have high power density and lower dimensions than traditional motors. On the other hand, these electric machines require low temperatures (about 50 K) to operate at the best performance. Therefore, their use requires an efficient cooling system. Despite the cooling system, the motor was installed with a 60 kg cryocooler, however, overall the weight was reduced. The cryocooler produces cryogenic gas, which is able to maintain the superconductor at a low temperature. This weight saving can be used to increase the aircraft’s autonomy with many batteries.
Many motors are available on the market that fit our project. The final choice was the EMRAX 208 [12] motor, manufactured by ENSTROJ. This EM is an axial flux synchronous permanent magnet motor/generator, with a sinusoidal three-phase motor.
The main features of the EMRAX 208 motor are listed in Table 3.

Table 3.
Technical data of the EMRAX 208 High Voltage.
The hybridization factor (HF) of the hybrid electric propulsion under investigation was defined after the choice of the ICE and the EM. There are three categories of hybridization:
- Full hybrid (also called full hybridization): the electric system is able to move the aircraft by itself on a normalized guide cycle without battery support (HF > 0.38);
- Mild hybrid (also called light hybridization): the full-electric motor is not able to follow all the guide cycles (0.23 < HF < 0.38);
- Minimal hybrid: lower distance obtained in pure electrical mode (HF < 0.23).
- The HF is obtained by the following expression:
Where is the power coming from the electrical system and is the rate from the ICE. The follows in the range (0–1), where zero indicates a conventional endothermic vehicle and one indicates a full-electric vehicle. In our case, the HF assumes a value of 0.26, as 32 kW of power comes from the EM and 90 kW from the ICE. For this reason, the system falls into the light hybridization category, since the EM cannot operate alone at any stage of a normalized cycle.
The main components of the proposed hybrid electric propulsion system were selected mainly for their performance and weight. In the next section, a numerical model of the entire propulsion system is described. The model was constructed using the lumped parameter code AMESim LMS® (developed by Simerics®, 1750 112th Ave NE, Ste C250, Bellevue, WA, USA) [16]. The numerical model was then used for predicting the performance of the overall system to allow the assessment and validation of the control strategies. Each part of the propulsion that was included in the model was divided into mechanical elements, signals, propeller, mission profiles, EM and ICE.
3. Lumped Parameter Model/Model Assumption
The structure of the lumped parameter numerical model used for the simulation of the hybrid electric propulsion system is shown in Figure 3. The hybrid propulsion of the ultra-light aircraft was modeled by splitting the system into five units:
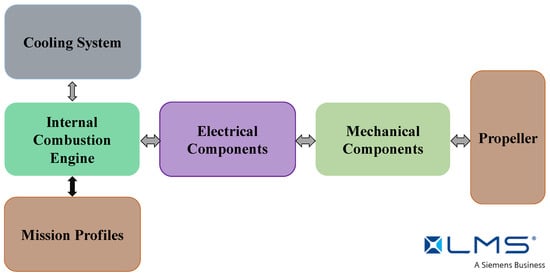
Figure 3.
Structure of the lumped parameter model of the hybrid electric propulsion system.
- -
- The internal combustion engine.
- -
- The electrical components sub-model, which includes all the components already shown in Figure 1. This sub-model consists of the electrical machine (EM/generator), the battery pack, the inverter and the battery charge controller.
- -
- The cooling system.
- -
- The propeller.
- -
- Mission profiles.
Each unit shown in Figure 3 was modelled using the commercial code AMESim® developed by Siemens®. The entire model of the hybrid electric propulsion system is shown in Figure 4.
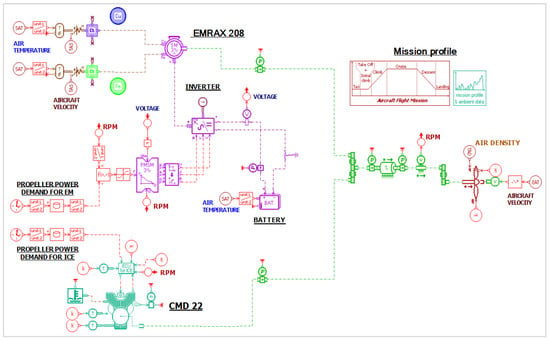
Figure 4.
The complete model of the hybrid electric propulsion system.
Figure 4 shows the four sub-systems of the propulsion unit. Before running the simulation, the input parameters for the numerical model were defined. The four sub-models are shown in this section with importance to the mission profiles (training and cruising) and the flight speed.
The main goal of the modeling task is to build a tool able to estimate the performance of the hybrid system for each mission profile. The mission profiles and the flight speed assigned are described in the following section.
3.1. The CMD 22 Internal Combustion Engine
The sub-model of the CMD 22 engine was included in the entire scheme adding the components in Figure 5a. The software had a specific tool for the ICE, using as input the data already presented in Table 1 and the torque curve. The model consequently generated a power curve (Figure 5b) and then, with post-processing, defined the consumption, BMEP, IMEP, FMEP and pollution, according to a mathematical predictive model.
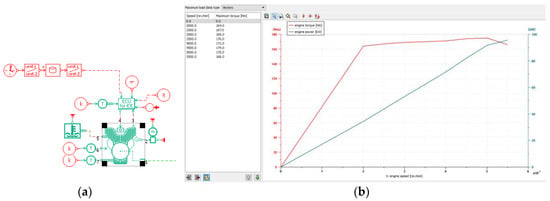
Figure 5.
(a) Sub-model of the ICE. (b) Input torque and output power curves.
3.2. Mission Profiles
3.2.1. Training Profile
Before describing the model result, the input to the model must be defined. Inputs are the mission profiles and the flight speed of the aircraft. The “training” is one of the mission profiles analyzed in this paper, and is composed of repeated segments. Excluding the takeoff and taxiing segments, which occur only once, the other segments are repeated, and interspersed with “touch and go” phases for climbing again. For this reason, this mission profile is also called the “touch and go” profile. The training profile is shown in Figure 6.

Figure 6.
Training profile.
Depending on the battery energy storage capability, the aircraft can perform several “touch and go” phases, as shown in the Table 4.

Table 4.
Training profile.
In Table 4, the power available at the propeller is split into the contribution of the ICE and of the electric motor. During takeoff, both motors must work at their maximum power, with consequently less power from the EM during the climb and a small amount during cruising (with just 8 kW). During the base leg and the landing phases only, the ICE is the only component that drives the propeller; part of the ICE power is also used to recharge the battery. As said, the ICE contributes 35 kW, which means that during the base leg and the landing only 23 kW are requested, with the other 12 kW going to the generator (1/3 of its maximum power).
The last parameter required for the simulation is the flight velocity during the training mission profile. Speed values for each phase of the mission profile are listed in Table 5. These data were provided by the company Tecnam, the manufacturer of the aircraft under investigation [9].

Table 5.
Flight velocity during the training profile.
3.2.2. Cruise Profile
The cruise profile is completely different to the training profile. There is a single cycle during which the maximum power has to be guaranteed from the ICE for all of the cruise phase and a minimum recovery goes to the electric machine that works like a generator.
The cruise profile, as shown in both Table 6 and Figure 7, consists of four segments. The first is the takeoff, which lasts 60 s, followed by the climb, with a duration of 720 s, and the main part is the cruise segment, with a duration of 8400 s. The final segment is the landing, with a duration of 720s. Therefore, for this profile, there is no “touch and go” as in the training profile.

Table 6.
Cruise profile.

Figure 7.
Cruise profile.
As performed for the cruise and training profiles, the flight speed needed to be inserted as an input for the numerical model. During the takeoff segment, the aircraft has a speed of 88 knots; subsequently, during the climb, the speed is 88 knots and increases to 120 knots in the cruise segment. During the final phase, landing, which lasts 70 s, the speed is 70 knots (Table 5).
Of the five sub-parts of the numerical propulsion model, one concerns the electrical part where the battery is one of the main components. Therefore, before running the simulation an accurate study was performed in order to choose the best battery pack for the specific application.
3.3. Battery and the Electrical Motor/Generator
All of the electrical components of the sub-models are shown in Figure 8c. The electric machine was implemented, adding as input the features listed in Table 3.
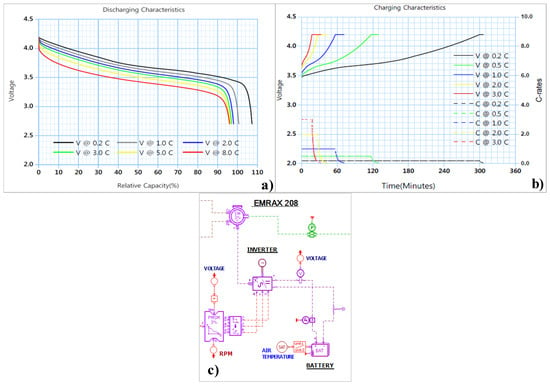
Figure 8.
(a) Discharging characteristics of the KOKAM 16 Ah battery. (b) Charging characteristics of the KOKAM 16 Ah battery. (c) Numerical model.
The principal step of the study performed on the electrical part was the choice of the battery pack. This aspect was crucial to this project as it had to satisfy several requirements imposed by the mission profiles already described. However, there are two other important aspects to consider: the weight and volume limits [17,18].
The battery must be able to deliver current (at a specific intensity and voltage) to the EM to provide the required power. Therefore, the choice of the number of cells depends not only on the weight but also on the current that can be delivered and on the reduction of the voltage. Of the several types of cells available on the market, for this project the lithium–polymer cell was chosen for its high specific energy value; this means that, for the same energy required, these batteries have smaller mass. As said, the battery pack is able to guarantee two different mission profiles (training and cruise). The energy that the battery has to store for only one training profile was 1.58 kWh, while for the cruise profile it was 5.13 kWh.
The battery capacity for the training profile was defined considering the maximum voltage that the EM can accept from the battery, namely 500 V. Therefore, it assumes a value of almost 16 Ah.
The final choice for the battery pack was the Superior Lithium Polymer Battery SLPB78205130H, produced by KOKAM, South Korea’s leading manufacturer of lithium–polymer.
The feature of the KOKAM battery cells are listed in Table 7.

Table 7.
Summary table of the KOKAM SLPB78205130H battery.
KOKAM battery cells have a weight of 0.406 g and an energy density of 146 Wh/kg; therefore, in order to reach the 8 kWh required by the electrical motor, the final battery pack weight was 55 kg. This confirms that both the five cycles of the training and the cruise profile are achievable using this battery pack.
The model of the battery pack is shown in Figure 8. All the inputs to the numerical model were implemented as the number, the disposition and the capacity of the cells, resistance and the open circuit voltage as a function of the state of charge (SoC). The resistance and the open circuit voltage, as functions of the SoC, were valued including the discharge curves in Figure 9. Those trends have been plotted as a function variation of the C-rate. In the numerical model, the input of the battery pack (shown in Figure 8a,b) was obtained for the datasheet of the chosen battery pack. The numerical model, as output, evaluates the open circuit voltage (OCV) and the resistance at 25 °C as a function of SoC (Figure 9). All of the evaluated information was sufficient to calculate the true SoC during the simulation, as well as the variation of current and voltage and the apparent power guaranteed.
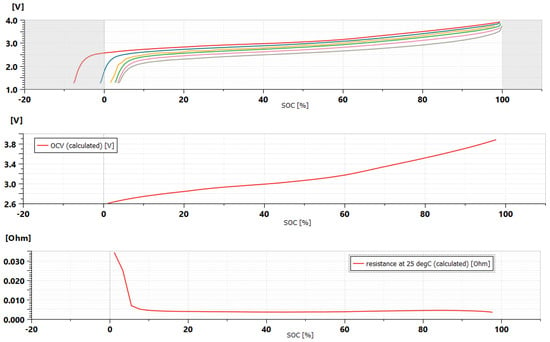
Figure 9.
Open circuit voltage (OCV) and resistance at 25 °C as a function of state of charge (SoC).
3.4. Propeller
The P2010 is equipped with a two-blade propeller made by the company MT-Propeller. Blades are characterized by several profiles from the base to the top, and the twist angle changes with respect the base angle. Table 8 shows the values of the chord and twist angle for the several stations from the blade base to the blade top, considering Clark Y as the profile. The table starts by considering the first station (200 mm), beginning from the hub axis.

Table 8.
Blade station, chord and twist angle.
The data in Table 8 were used as input to the model that, using the Clark Y profile, was able to generate the propeller shown in Figure 10.
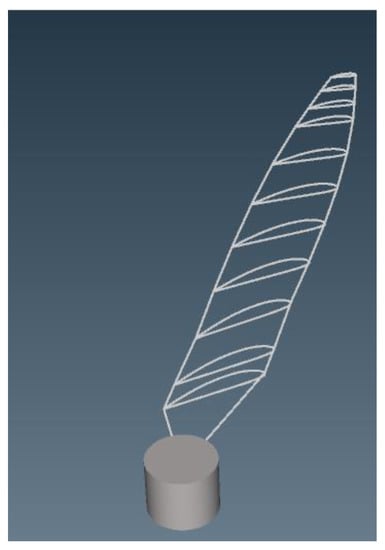
Figure 10.
Propeller definition.
4. Study of the Battery Pack
In this section of the paper, the numerical model was used to verify the battery pack choice. For this reason, simulations were run for both mission profiles considering the weight constraint (55–60 kg). The first test, called “Test 1”, was run with the training mission profile doing between three and five “touch and go” cycles. Meanwhile, the second test, called “Test 2”, referred to the cruise mission profile.
4.1. Test 1: Training Profile
In Test 1, the numerical model was run considering the performance requested during the training profile, as listed in Table 4. Table 9 summarizes all the information of the chosen battery pack, which had a total weight of 53.6 kg. With this solution, three “touch and go” phases were guaranteed. The first model results are shown in Figure 11a, where the temperature trend as a function of the altitude and the battery heat exchange are represented. In Figure 11b, the maximum heat exchange is relative to the phases in which the maximum electric power is required (climbing segment of the training profile). Figure 11c shows the voltage and current trends of the battery.

Table 9.
Training profile characteristics.

Figure 11.
Training profiles of: (a) Air temperature vs. battery heat flow rate; (b) electric machine power; (c) battery voltage and current.
From the data in Figure 11, it is clear that, for all of the phases, the voltage tended to decrease with time, and the current tended to increase as a consequence. It is important to understand that, in Figure 11c, the current is negative when the battery is powering the motor, whereas it is positive when the electric machine works as a generator and recharges the battery.
Another important output of the numerical model is shown in Figure 12. The graph presents the SoC of the battery pack in the training profile as a function of the electric power required during the simulation time.
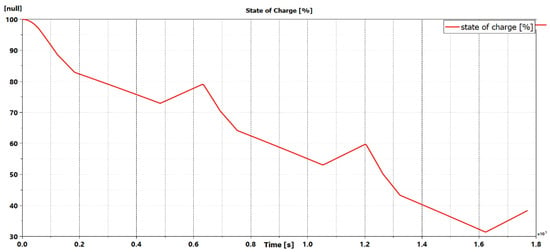
Figure 12.
Training profile of the state of charge (SoC) of the battery pack.
From Figure 12, it is clear that the system works in a fully electric configuration during the taxi phase (1 min), and that the slope of the curve is greater in the first phase. The electric machine, as said, also works as a generator, and in these phases the battery’s SoC increased. By the end, after three cycles, the battery still had 38.3% of charge. Even if the battery had a SoC close to 40% at the end of the third cycle, this percentage was too low to allow the fourth cycles to be completed.
It is important to underline that the chosen battery pack configuration respects the weight limits, guarantees the power demand and respects the actual standards on maximum voltage and the security between two branches in parallel.
4.2. Test 2: Cruise Profile
The project performed the simulation of two different mission profiles. After representing the possible configurations for the training profile, the numerical results obtained during the simulation in the cruise profile were reported. The boundary conditions set in the model for the cruise mission profile were the same as those in Table 7, except for the number of cycles (in the cruise profile this consisted of a single cycle).
As shown in Figure 13a, the SoC at the end of the profile mission was 47%, and the overall simulation time was 9960 s. The chosen battery pack was able to guarantee this flight profile (of 9960 s). The power demand was perfectly guaranteed, as shown in Figure 13. Hence, the numerical simulations demonstrated that the KOKAM Superior Lithium Polymer Battery SLPB78205130H can be used for both mission profiles, additionally allowing three “touch and go” cycles for the training. As stated, the SoC at the end of the cruise mission profile was 47%. This can be justified looking at the lower peak of the trend in the Figure 13a, after the take-off and the climb phases. At that time, the SoC of the battery was around 5–8%. Then, as a result of the cruise mission phase, the electric machine works as generator, and consequently the SoC increases to 47%.
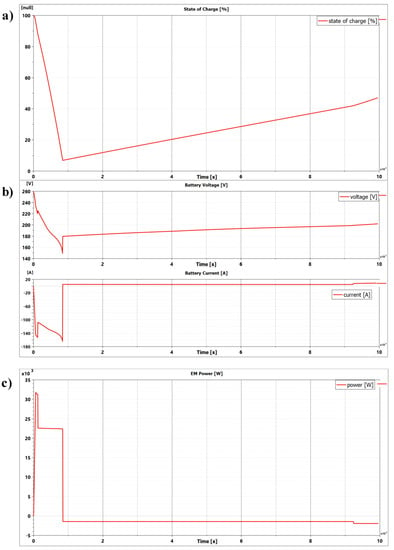
Figure 13.
Cruise profiles of: (a) The state of charge. (b) The battery voltage and current. (c) The electric machine power.
The numerical model that was used, as demonstrated in this section, is a good methodology with which to choose a new component in the hybrid-propulsion system. In the following paragraph, the numerical methodology was adopted in order to investigate the real improvement of the environmental emissions achieved with the hybrid electric solution
5. Numerical Model Results
The numerical model described in the previous paragraph was run following both mission profiles to evaluate the overall performance of the hybrid propulsion system.
5.1. Model Results: Training Profile
The numerical model shown in Figure 4 was run for three consequent cycles. However, since the trend of the magnitudes was the same for each graph, in the following figures only one cycle is reported. Figure 14a and 14b represent the power and rotary speed of the internal combustion engine (red) and the electric machine EM (green) as a function of the simulation time for one cycle.
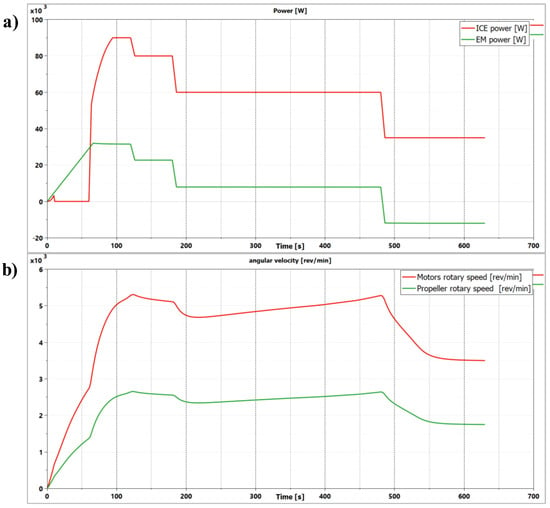
Figure 14.
Training profiles of: (a) ICE power and EM power. (b) Motor speed vs. propeller speed.
In Figure 14a, the power comparison shows that the green line, related to the electric machine, becomes negative when it works as a generator. Figure 14b represents the speed of both motors and the propeller speed, i.e., half of the motor speed.
The overall efficiency of the engine depends on the efficiencies of the combustion, mechanical and thermodynamic cycles.
These parameters are functions of the power loss due to the combustion, the exhaust and the mechanical components. These powers are represented in Figure 15.
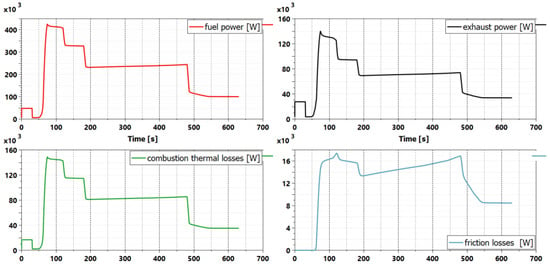
Figure 15.
Training profiles of CMD22 engine power losses.
Considering a maximum power of 122 kW at 100 s, Table 10 presents the values of the fuel power, exhaust power, friction power losses and mechanical power. These values allow the efficiencies at maximum mechanical power to be calculated. The engine performance relative to the maximum mechanical power are shown in Table 11.

Table 10.
Power type at propeller (training).

Table 11.
Performance at maximum power before gearbox (training).
5.2. Model Results: Cruise Profile
Model results related to power, torque, engine speed, specific consumption, pressure, efficiency, power losses and relative efficiencies, relative to the cruise profile, are reported in Figure 16 and Figure 17.
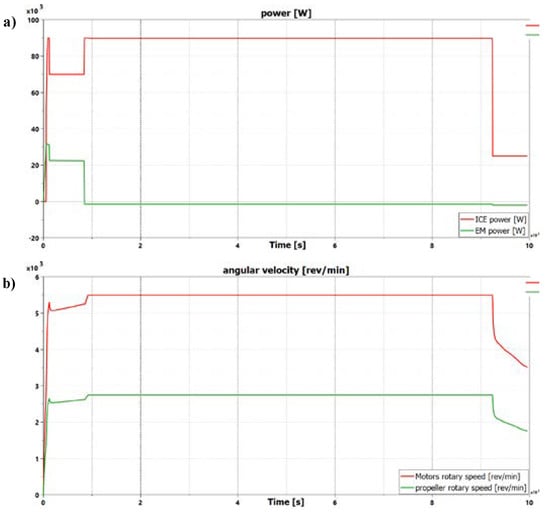
Figure 16.
Cruise profiles of: (a) Mechanical power of ICE and EM; and (b) motor speed vs. propeller speed.

Figure 17.
CMD22 engine power losses.
Additionally, for the cruise mission profile, considering a maximum power of 122 kW, the fuel power, the exhaust power, the friction of losses power and the mechanical power at 100 s are listed in Table 12. Table 13 presents the engine performance relative to the maximum mechanical power at a determinate time.

Table 12.
Power type at maximum power at propeller (cruise).

Table 13.
Performance at maximum power before gearbox (cruise).
6. Comparison between “Baseline” and “Hybrid” Configurations
The numerical results obtained by running simulations on the hybrid electric propulsion solution verified that the designed system was able to perform both mission profiles, respecting the weight limits. In this section, the “hybrid” and the “baseline” configurations of the propulsion system are shown [13].
In order to perform the comparison, a model of the ICE Lycoming IO-360 (baseline propulsion system) was constructed. The model of the baseline configuration is shown in Figure 18.
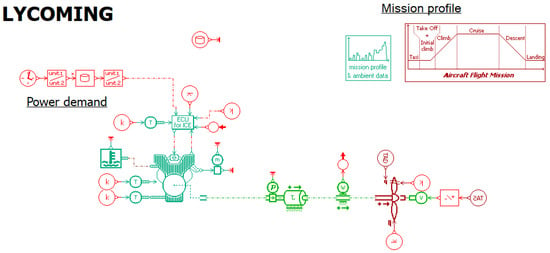
Figure 18.
Model of the actual propulsion system (Lycoming IO-360).
The model architecture is similar to that of the hybrid system; however, in this case, the engine and the propeller are connected on the same shaft, without speed reducer. The management and the model inputs are the same as already explained. The significant differences between models concern the engine geometry and consequently the input to the model (Figure 19).
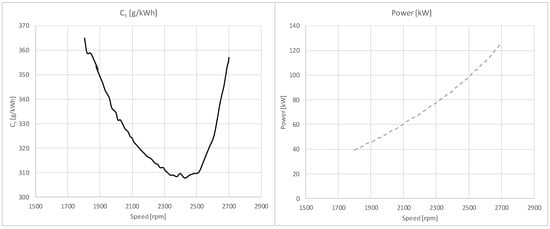
Figure 19.
Lycoming IO-360 performances (Cs—power vs. engine speed).
In this paragraph, a comparison between the “baseline” and “hybrid” configurations is made in terms of the power, the speed, the torque, the fuel saving and the CO2 emitted into the environment. The comparison between the propulsion configurations is performed for both mission profiles.
6.1. Training Profile: Performance and Consumption
Both model configurations were run in the training mission profile. Figure 20 shows the trends of the power, the torque and rotary speed that, for the hybrid configuration, were read before the speed reducer. In Figure 20, the “baseline” configuration is shown in red and the “hybrid” is shown in black.
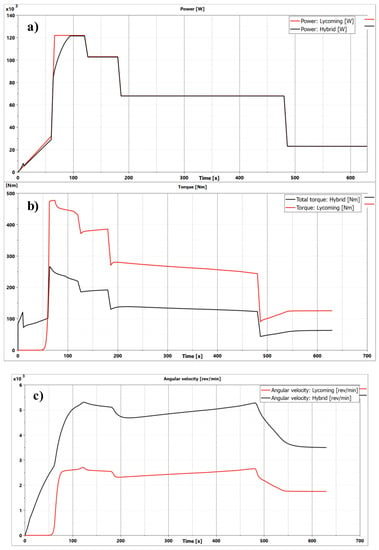
Figure 20.
Comparison of training profiles for configurations: (a) power; (b) torque; and (c) speeds.
The power profiles shown in Figure 20a are the same, while the torque of the hybrid configuration is one half of the other, and vice versa for the rotary speed, Figure 20b,c respectively. After the speed reducer is applied to the hybrid configuration, the torques and speeds become equal to the baseline configuration.
Figure 21 shows a comparison between the powers used to define efficiencies. The engine efficiency depends on the combustion efficiency, the mechanical efficiency and the thermodynamic efficiency. These parameters are a function of the power loss due to the combustion, the exhaust and the mechanical components.
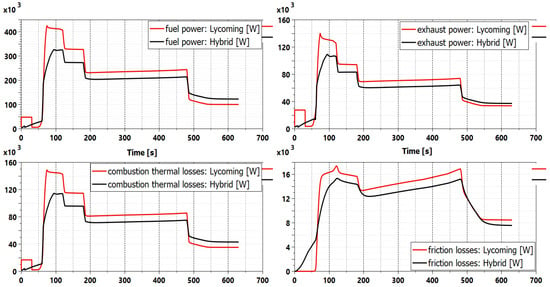
Figure 21.
Training profile comparison between the powers.
As said, the baseline configuration had a bigger engine with higher nominal power able to cover the power demand by itself. Conversely, the ICE of the hybrid system was smaller and had less nominal power, and accordingly it was used to cover only a part of the power demand, depending on the missions and consequently on the segments analyzed. For these reasons, the trends of the powers relative to the baseline configurations were higher than the hybrid configuration.
Figure 22a shows a comparison between the fuel consumption during the first cycle of the mission profile. Differences between the configurations have also been found for the other cycles (3–5). Other important data are shown in Figure 22b, which shows a comparison of CO2 emissions.
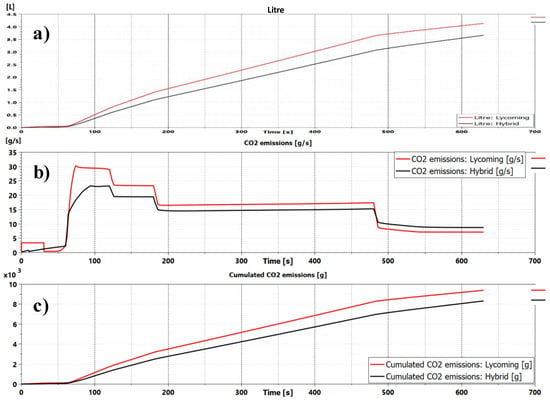
Figure 22.
Training profiles of: (a) fuel consumption; (b) CO2 emissions; (c) cumulated CO2 emissions.
Table 14 summarizes the numerical results shown in the previous figures, reposting the consumption and emissions of the two configurations for the training profile.

Table 14.
Training profile consumption and emissions.
Table 15 shows the savings in terms of consumption and CO2 emissions passing from the baseline configuration to the hybrid configuration for the training mission profile.

Table 15.
Training profile delta consumption and percentage saving.
6.2. Cruise Profile: Performance and Consumption
As already performed for the training mission profile, models of both configurations were run following the cruise mission profile. As expected, the values and the trends changed, although the concepts expressed regarding power, torque and speed were the same for this mission profile (Figure 23). The comparison was also performed for the fuel power, exhaust power, combustion thermal losses and friction losses, as shown in Figure 24.

Figure 23.
Cruise profile comparison between configurations: (a) power; (b) torque; and (c) speeds.

Figure 24.
Cruise profile comparison between the powers.
Figure 25 shows the fuel savings for the cruise profile, confirming that there is also a reduction of consumption and emissions for this mission profile. Therefore, the goal of this research was achieved.
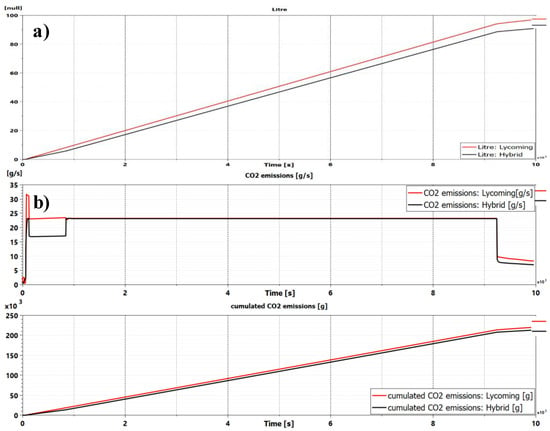
Figure 25.
Cruise profiles of: (a) fuel consumption; (b) CO2 consumption.
Table 16 and Table 17 present the amount of savings and consequently the percentage of reduction for the cruise profile.

Table 16.
Cruise profile consumption and emissions.

Table 17.
Cruise profile delta consumption and percentage saving.
7. Conclusions
The feasibility and the potential environmental benefits of a hybrid electric propulsion system for light aircraft was investigated.
This study presented an analysis of a parallel hybrid electric propulsion system for the general aviation aircraft.
This system was modeled with a multi-physical and multi-domain commercial code, AMESim®. Each component of the system was characterized: ICE, electric machine, mission profiles (training and cruise), battery pack, system inertia, propeller, power demands and flight speed.
The numerical model was demonstrated to be a useful tool for the choice and the sizing of system components. In particular, it allowed different battery configurations to be investigated.
The comparison between the benchmark propulsion system, with only the ICE, and the hybrid electric system was the conclusive part of simulations to validate the tool. The results showed that the hybrid electric propulsion system for a light aircraft is advantageous in terms of saving fuel and decreasing pollutant emissions. In particular, the simulations highlight a fuel saving of over 12% for the training profile and of 6% for the cruise profile.
All of the achieved results relate to a system modeled using off-the-shelf components and technologies, which suggests that such a system could already be possible to operate with an aircraft powered by a hybrid electric propulsive system.
This research is still in progress, in order to demonstrate experimentally the results obtained with the numerical model.
Author Contributions
Methodology and software, E.F., G.D.L. and L.P.; Formal analysis, resources and supervision, C.P. and A.S.; Writing—original draft preparation, E.F., G.D.L. and L.P.; Writing—review and~editing, C.P. and A.S.
Funding
This research received no external funding.
Acknowledgments
This research was supported by the Centro Italiano Ricerche Aerospaziali (CIRA), the company CMD and the Department of Industrial Engineering of the University of Naples “Federico II”. The authors appreciate the technical support of the companies: BSim srl and Costruzioni Aeronautiche TECNAM S.r.l.
Conflicts of Interest
The authors declare no conflict of interest.
References
- Available online: https://www.aerospace-technology.com/projects/e-fan-electric-aircraft/ (accessed on 29 June 2018).
- Available online: https://news.nationalgeographic.com/energy/2015/04/150409-epa-aviation-emissions-rules-for-airplanes/ (accessed on 29 June 2018).
- Available online: https://www.britishairways.com/cms/global/pdfs/csr/CSR_web_LAQ_1_pdf_07_KMM.pdf (accessed on 29 June 2018).
- Available online: http://www.europarl.europa.eu/RegData/etudes/BRIE/2017/603925/EPRS_BRI(2017)603925_EN.pdf (accessed on 29 June 2018).
- Available online: https://ec.europa.eu/clima/policies/transport/aviation_en (accessed on 29 June 2018).
- Cui, M.; Kreuter, A.; Kutil, G.; Miller, B.; Packard, C.; Rahimpour, M.; Soin, G. SOLSTICE: Standalone-electric Optimized Lifting System, Transitional Internal Combustion Engine. In Proceedings of the 50th AIAA Aerospace Sciences Meeting including the New Horizons Forum and Aerospace Exposition, At Nashville, Tennessee, 9–12 January 2012. [Google Scholar] [CrossRef]
- Ausserer, J.K.; Harmon, F.G. Integration, Validation, and Testing of a Hybrid-Electric Propulsion System for a Small Remotely-Piloted Aircraft. In Proceedings of the 10th International Energy Conversion Engineering Conference, International Energy Conversion Engineering Conference (IECEC), Atlanta, GA, USA, 30 July–1 August 2012. [Google Scholar] [CrossRef]
- Friedrich, C.; Robertson, P.A. Hybrid-Electric Propulsion for Aircraft. AIAA J. Aircr. 2015, 52, 176–189. [Google Scholar] [CrossRef]
- Tecnam P2010. Available online: https://www.tecnam.com/aircraft/p2010/ (accessed on 29 June 2018).
- Available online: https://www.lycoming.com/content/operator%27s-manual-%28L%29IO-360-M1A-60297-36 (accessed on 29 June 2018).
- CMD 22 engine. Available online: http://cmdavio.com/cmd22-aircraft-engine/ (accessed on 29 June 2018).
- EM Emrax 208. Available online: http://emrax.com/products/emrax-208/ (accessed on 29 June 2018).
- Frosina, E.; Caputo, C.; Marinaro, G.; Senatore, A.; Pascarella, C.; Di Lorenzo, G. Modelling of a Hybrid-Electric Light Aircraft. Energy Procedia 2017, 126, 1155–1162. [Google Scholar] [CrossRef]
- Masson, P.J.; Luongo, A. High Power Density Superconducting Motor for All-Electric Aircraft Propulsion. IEEE Trans. Appl. Supercond. 2005, 15, 2226–2229. [Google Scholar] [CrossRef]
- Masson, P.J.; Soban, D.S.; Upton, E.; Pienkos, J.E.; Luongo, C.A. HTS Motors in Aircraft Propulsion: Design Considerations. IEEE Trans. Appl. Supercond. 2005, 15, 2218–2221. [Google Scholar] [CrossRef]
- Available online: https://www.plm.automation.siemens.com/it/products/lms/imagine-lab/amesim/ (accessed on 29 June 2018).
- Antón, J.Á.; Nieto, P.G.; de Cos Juez, F.J.; Lasheras, F.S.; Vega, M.G.; Gutiérrez, M.R. Battery state-of-charge estimator using the SVM technique. Appl. Math. Model. 2013, 37, 6244–6523. [Google Scholar] [CrossRef]
- Zhang, X.; He, W.; Zhang, Y.; Pandey, M.D. An effective approach for probabilistic lifetime modelling based on the principle of maximum entropy with fractional moments. Appl. Math. Model. 2017, 51, 626–642. [Google Scholar] [CrossRef]
© 2018 by the authors. Licensee MDPI, Basel, Switzerland. This article is an open access article distributed under the terms and conditions of the Creative Commons Attribution (CC BY) license (http://creativecommons.org/licenses/by/4.0/).