1. Introduction
The rapid advancement of drone technology has positioned unmanned aerial vehicles (UAVs) at the forefront of Urban Air Mobility (UAM) applications, promising to revolutionize transportation in congested urban environments. For drones to operate safely and effectively, they rely heavily on Positioning, Navigation, and Timing (PNT) information provided by Global Satellite Navigation Systems (GNSSs) [
1]. This reliance on GNSS underscores its critical role in ensuring the operational safety and reliability of UAVs. However, various threats can compromise GNSS-based solutions, particularly in urban and suburban environments where signal degradation, interference, and cyber threats are prevalent [
2,
3].
Drones operating in urban settings face unique challenges, including multipath effects, where GNSS signals reflect off buildings and other structures, leading to inaccurate positioning. Multipath effects can cause positioning errors that significantly impact the navigational accuracy required for safe drone operations, particularly during critical phases such as takeoff and landing [
4]. Additionally, electromagnetic (EM) interference, both unintentional and intentional, can disrupt GNSS signals, complicating the navigation processes for drones [
5]. This interference poses a particular challenge in urban environments, where infrastructure can obstruct signals and increase the likelihood of navigation errors.
Moreover, cyber threats such as spoofing and jamming are increasingly recognized as significant risks for GNSS reliability in drone applications. Spoofing attacks involve transmitting false GNSS signals to mislead UAVs into incorrect positioning, while jamming can incapacitate GNSS receivers, leaving drones without critical navigation data [
6,
7]. These vulnerabilities underscore the necessity for robust and resilient navigation solutions in UAM, where safety and operational integrity are paramount.
Historically, the issue of navigation reliability has been addressed with techniques such as Receiver Autonomous Integrity Monitoring (RAIM), which was originally developed for aviation safety [
8]. Over the years, several RAIM algorithms have been proposed and refined [
9], including Fault Detection and Exclusion (FDE) techniques, which extend the basic RAIM concept to not only detect but also isolate the faulty measurement and recompute a corrected navigation solution. These methods laid the foundation for integrity monitoring in satellite navigation and were later expanded into Advanced RAIM (ARAIM), which incorporates multi-constellation and multi-frequency data, aligning well with the resilience goals of modern GNSS systems [
10].
To effectively evaluate the safety and reliability of GNSS-based technologies for drones in UAM contexts, a comprehensive GNSS security impact simulator is essential. This paper details the design, implementation and testing of a GNSS Threat Simulator (GTS) designed specifically to replicate the unique challenges faced by drones in urban environments. The GTS is capable of simulating various critical threats, including satellite visibility conditions, considering the actual line of sight from the drone’s antenna in relation to urban obstacles, multipath effects, EM interference, and cyber threats such as spoofing and jamming, along with satellite failures. Moreover, GTS also aims to reproduce conditions under which RAIM and similar integrity monitoring algorithms may fail or be stressed, offering a realistic framework to test the limits and robustness of navigation fault detection strategies in challenging urban environments.
The GTS modifies and elaborates dual-frequency, multi-constellation (DFMC) GNSS observables to inject the desired threats into the simulation. DFMC GNSS systems provide users with signals from several satellite constellations and on at least two frequencies per constellation (e.g., L1/L5 for GPS or E1/E5a for Galileo), improving navigation accuracy, availability, and especially robustness against ionospheric errors and certain classes of interference. They enhance resilience against specific interferences, making them particularly suitable for urban drone operations [
11].
The effectiveness of the proposed simulator has been validated through both fast-time and real-time simulations of a drone flying in an urban environment. These tests highlight the GTS’s capability to mimic real-world GNSS challenges specific to drone applications, offering valuable insights for evaluating GNSS solutions tailored for UAM.
In the following sections, after presenting the state-of-the-art concerning the simulation of effects and threats typical of urban and suburban environments, the high-level architecture of the GTS and the implemented algorithms are described. Finally, the results of both fast-time and real-time simulations are presented.
2. Related Work
This chapter contains an analysis of the literature and experimental data associated with characterizing the threats to a GNSS system in a UAM environment.
2.1. Low Visibility
Satellite visibility is a crucial aspect related to the use of GNSS for navigation means; in fact, satellite trilateration as well as integrity monitoring algorithms require a minimum number of satellite signals in Line-of-Sight (LOS) for a proper and reliable computation of the position, velocity and time solution in terms of WGS84 positions (i.e., latitude, longitude and altitude) and north-east-up velocities in time. Unfortunately, the proper functioning of a GNSS receiver requires uninterrupted signal reception, but radio wave signals cannot effectively penetrate obstacles such as mountains, water surfaces, soil, vegetation, or man-made structures like walls, dams, buildings, and bridges. Nonetheless, with reference to UAM application in the inner-city streets of urban areas lined with skyscrapers, the visibility of GNSS satellites is often further limited for extended periods or simply unavailable [
12]. This so-called “signal outages situation” can also happen in forestry applications with dense canopy area and at high banking angles, when signal shading through the aircraft fuselage and wings can also happen in airborne applications [
13]. As reported above, satellite visibility is completely dependent on the instantaneous geometrics (line-of-sight conditions) between each single satellite (transmitter) and the user (antenna receiver) based on both possible obstacles and the vehicle attitude.
2.2. Multipath
It is well known that signal propagation through the ionosphere and troposphere introduces a ranging error that translates to a receiver positioning error through the visible satellite geometry; furthermore, in the so-called urban environment, positioning availability and accuracy are adversely affected by receiver antenna obscuration and severe signal multipath. These phenomena are referred to as natural sources of interference.
Non-Line-of-Sight (NLOS) and multipath are accepted as being the dominant error sources in urban and suburban environments. As such, a number of methods have been developed to model signal reflection and their impact on positioning error. These methods can be either purely deterministic, which includes asymptotic methods such as ray-tracing [
14,
15], statistical [
16], or hybrid methods [
17]. A hybrid model based on ground vehicle measurement campaign data can be found in [
18,
19]. Regarding the simplification of the propagation environment, it has been found in [
20] that simple canonical shapes representing building facades can be used to predict positioning error when wideband channel models are employed.
2.3. Electromagnetic Interference
Any electromagnetic source interacting with the GNSS signals is interfering with the process of estimating the propagation time.
The signal impinging the GNSS receiver antenna at a given frequency is the combination of the signals broadcast by all the satellites in view. GNSS Radio Frequency (RF) compatibility addresses the issue of intrasystem (from the same system) and intersystem (from other systems) interference. Signals belonging to the same satellite constellation are designed to be theoretically orthogonal (exploiting code or frequency diversity), and thus they can be separated by the receiver processing. However, such orthogonality is not perfect, and a residual power is always generating intrasystem interference. Intersystem interference is due to the fact that several GNSS systems share the same carriers, and again, some power from the signals of another system can disrupt the signal of interest. Several methodologies, such as the effective carrier-power-to-noise-density theory introduced in [
21], are used during the design phase of the systems to ensure that a maximum acceptable level of intersystem interference is respected [
22,
23]. Due to the growing number of operational satellites in the new GNSS constellations, the number of satellites that are in view to a user receiver at the same time is growing as well; this implies increased intersystem interference.
Regarding the so-called artificial interferences, the intrinsic power weakness of GNSS signals affects the performance of any type of receiver, since all the communication systems transmitting at carrier frequencies close to the band of interest are potential sources of interference for a GNSS receiver, and even small leakages out of their allocated bandwidth can be threatening to GNSS signals. Even though unintentional Radio Frequency Interference (RFI) events are generally unpredictable, their presence has been experienced in the past and the increasing number of wireless communication infrastructures is increasing the probability that some power spillover from signal frequencies located near the GNSS bands could affect the performance of GNSS receivers in a certain region. The presence of interfering power can be due to several reasons, but the main effects are caused by harmonics or spurious components generated by intermodulation products in the communication transmitter [
24].
Jamming refers to intentional transmission of RF energy to hinder a navigation service by masking GNSS signals with noise. The malicious objective of jammers is to cause the receiver to lose tracking and to impede signal reacquisition [
25]. Although jamming is a well-known threat in military applications, it represents a growing threat for many GNSS-based applications. Systems involving safety and liability-critical operations (e.g., UAM) could potentially be heavily impaired by jamming attacks. The level of threat associated with jamming cannot be disregarded, considering that portable jammers are available online and can be purchased at a very low cost. Although the use of jammers is not legal, the interest of individuals willing to break the law may result in fraudulent actions toward GNSS-enabled systems. Several studies have addressed the characterization of commercial jammers and their effect on GNSS receivers, demonstrating that they can affect GPS receivers’ functionality even if located up to 9 km away [
26,
27].
In [
28], the authors present a way through which the interference impact is computed in terms of Signal-to-Noise Ratio (SNR) gain. Different threat scenarios are simulated according to the nature of the interference, i.e., continuous or pulsed emissions.
2.4. Cyber Threats
The impact of cybersecurity threats in aviation is becoming increasingly significant. Indeed, the networks between aviation systems (both on-board and on the ground) are increasing, introducing new cyber vulnerabilities, which may also be exploited by means of novel and sophisticated attack vectors.
This is particularly true for GNSS because of [
29] its centrality in an avionic architecture, which makes it an attractive target for attackers; its openness (at least for civil GNSS signal structure) makes it considerably vulnerable to cyberattacks; its weak transmitting and receiving power makes it susceptible to interferences, both natural and malicious. For example, technological progress and the availability of advanced Software Defined Radio (SDR) platforms are making the development of GNSS spoofers not only feasible but also affordable [
30].
As a consequence of the aforementioned considerations, a GNSS cyberthreat simulator is an essential tool to characterize the impact of cyberattacks exploiting GNSS vulnerabilities and verify and validate GNSS-intrusion detection and mitigation systems.
Moreover, considering the multidimensional and multilevel nature of GNSS evaluations, the research groups are working according to different objectives. For example, in the case of spoofing, the main research initiatives consider [
31]:
- •
Spoofing implementation, which focuses on the analysis of the spoofing-attack mechanisms and serves as the basis for impact analysis and validation of anti-spoofing methods;
- •
Spoofing impact assessment, which evaluates the spoofing effects on GNSS receivers and systems that depend on GNSS;
- •
Spoofing detection and mitigation, which develops methods to reveal, classify and eliminate spoofing threats.
In [
28], the authors compute the spoofing impact in terms of pseudo-range drifts and spoofing-to-signal power ratios.
2.5. Satellite Failures
When testing integrity monitoring algorithms and related failure detection and exclusion capabilities, it is necessary to inject fault modes on the ranging satellites so to assess the actual capabilities of the algorithms to challenge such failure situations, even if they have low likelihood but are still in the possible range of integrity risks that are usually assumed for critical aeronautical safety applications, such as take-off and landing.
Unfortunately, so far, systematically monitored fault modes have been experienced and recorded related only to GPS constellation, as reported in [
32,
33]. No or minimal information is available related to other GNSS constellations, such as GALILEO and BeiDou, which, indeed, have a relatively short operational life and would not allow for the gathering of reliable fault mode models and associated probabilities. This is also one of the key issues related to the deployment of the Advanced Receiver Autonomous Integrity Monitoring (A-RAIM) algorithm that requires known a priori constellation and satellite failure probabilities.
With reference to a generic GNSS/INS navigation unit, a summary of failure types and related mathematical models of failure is listed in [
34]. Key root causes and a failure mode database derived from analyzing data from the UK Civil Aviation Authority GPS monitoring program up to 2007 is reported in [
35].
Moreover, based on [
33],
Table 1 reports the types of failures (i.e., step, ramp and acceleration) with related probability distributions that have to be considered for the position determination when testing integrity algorithms for blended GPS/INS PNT solutions.
Finally, it shall be noted that constellation-wide faults have been assumed in the fault model for some integrity algorithms (e.g., A-RAIM). This category of faults is mainly related to a wrong computation and/or communication of the Earth Orientation Parameters (EOPs) that are uploaded to the ranging satellites. Potential EOP faults can be separated into two general types. Type A faults are said to occur when EOPs are correctly computed, but the earth’s motion might have changed since uploading them to the ranging satellites, such as after a strong earthquake. Type B faults happen when EOPs used in the orbit determination process were badly computed and the situation is not detected by the master station of the ground segment prior to upload. The two types have similar impacts on GPS ephemerides and user positioning errors but can differ in magnitude and in the methods of detection. Here, we consider it reasonable to assume that while Type A EOP faults are common to any constellation, any Type B EOP fault is independent across GNSS constellations because even though observations used to generate EOPs are collected and used internationally, the raw data are processed by different organizations. Therefore, while Type B can be detected by some integrity algorithms, Type A shall be detected and excluded by the respective constellation control segments.
3. GNSS Threat Simulator Architecture
3.1. GTS Functional Context
The GTS is a detailed GNSS measurement error simulator to be integrated in a fast-time simulation environment and in real time for being used in a laboratory and flight environment to reproduce the typical GNSS threats to be injected in emulated/real GNSS receivers.
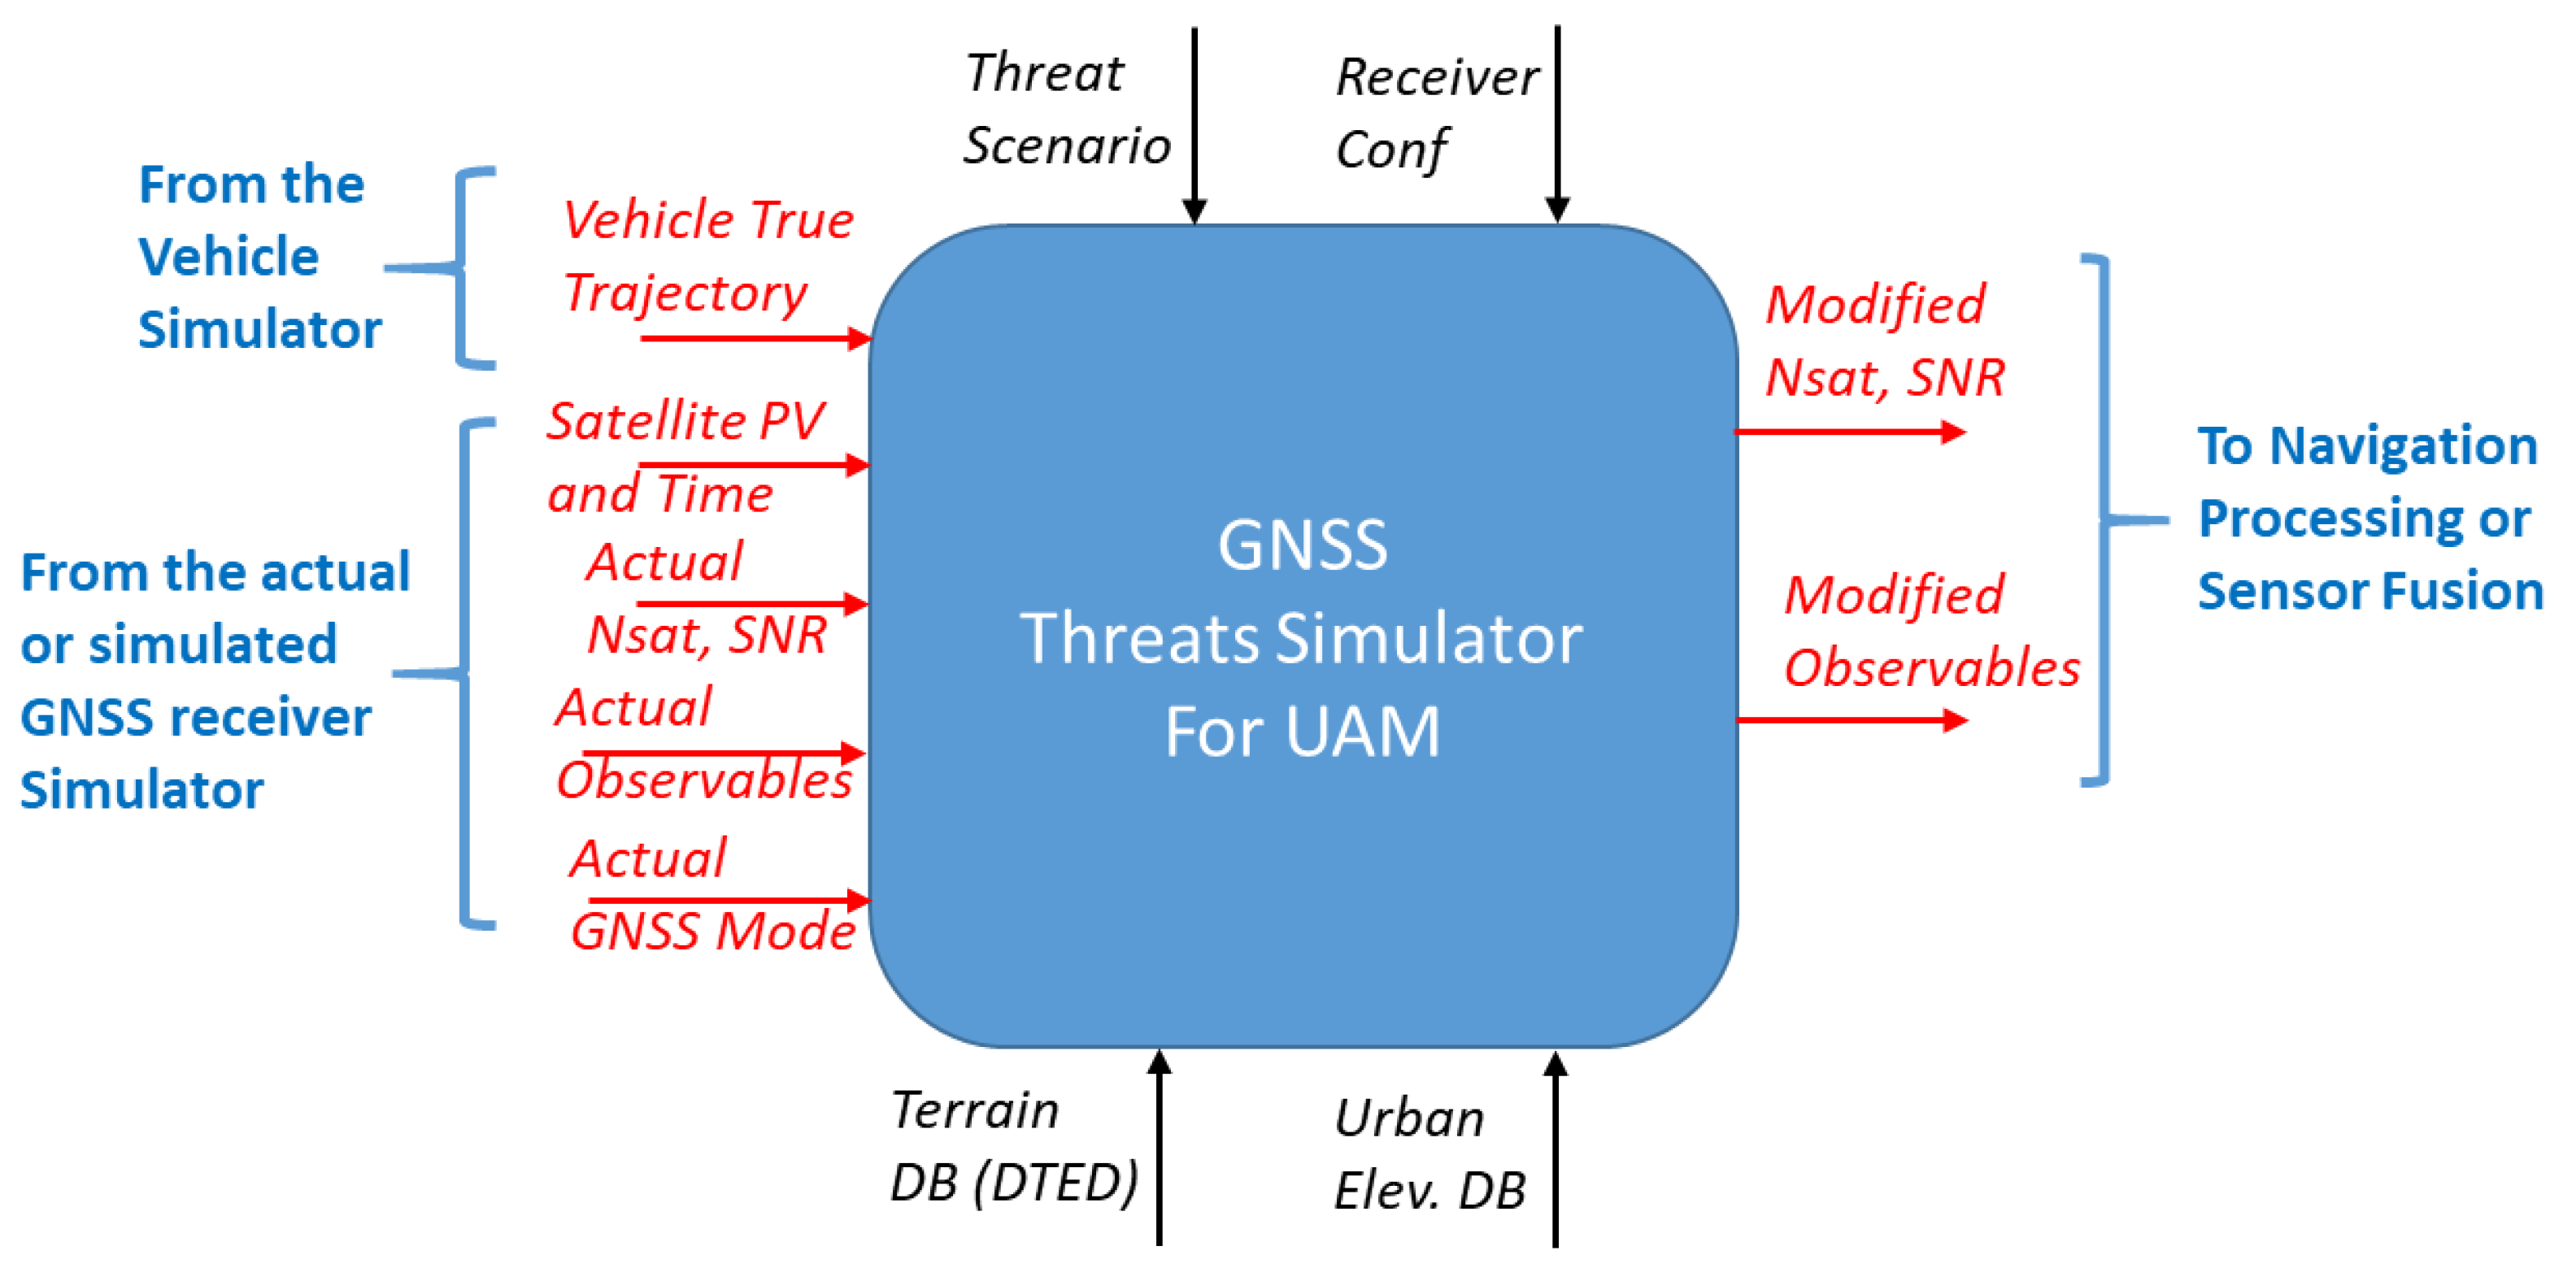
Figure 1 shows the functional context in which this simulator can be employed, related key input/output data, depicted in red, and configuration parameters, depicted in black.
This module is capable of reproducing the main UAM GNSS threats (low visibility, multipath, EM interference, intentional/unintentional spoofing, jamming, failures) typically present in urban and suburban scenarios for DFMC GNSS receivers.
Inputs of the model are:
- •
From the vehicle simulator (or a source of high-accuracy data in case of its use in flight), the vehicle’s true trajectory in terms of position, velocity, and attitude is provided;
- •
From the actual or simulated GNSS receiver, the SNR of actual visible satellites, actual observables (i.e., pseudo-ranges), actual GNSS navigation mode (i.e., single/dual frequency, with/without Satellite-Based Augmentation System—SBAS service, etc.) and position, velocity, and time of actual visible satellites.
Outputs of the model are:
- •
Modified number of visible satellites;
- •
Signal-to-noise ratio corresponding to visible satellites;
- •
Modified observables (i.e., pseudo-ranges) describing the modified measurements of the receiver due to the injected threats;
Configuration parameters of the model are:
- •
Threat scenario to be injected among RF interference, cyber threat and satellite failures;
- •
Receiver configuration, i.e., a set of parameters that identify the type and class of the GNSS receiver (e.g., GPS/SBAS, DFMC, number of constellations, update frequency, GPS Class I, Class II, etc.) and related receiver configurations in terms of mask angle, sensitivity, etc.;
- •
Terrain and urban elevation data, i.e., elevation data from database (e.g., buildings, mountains) to be used for determining the mission environment.
Actually, based on the true vehicle position and velocity, and the given failure scenario that the user wants to inject, this module opportunely modifies the number of visible satellites and the key observables of the GNSS receiver in open sky (e.g., the pseudo-ranges and delta ranges of phase shift) so that the resulting data are affected by the desired urban threat or failure. The visible satellite information and related observables can come from a GNSS receiver simulator or even from the raw measurements available from a real GNSS receiver operating in open sky conditions, so to provide to the navigation processing algorithms a set of data that is modified considering the urban environment. When used in this modality, this module actually modifies the vehicle trajectory used by the terrain and urban elevation data so to insert the vehicle into a virtual urban environment with simulated surroundings that would induce the threat.
3.2. GTS High-Level Architecture
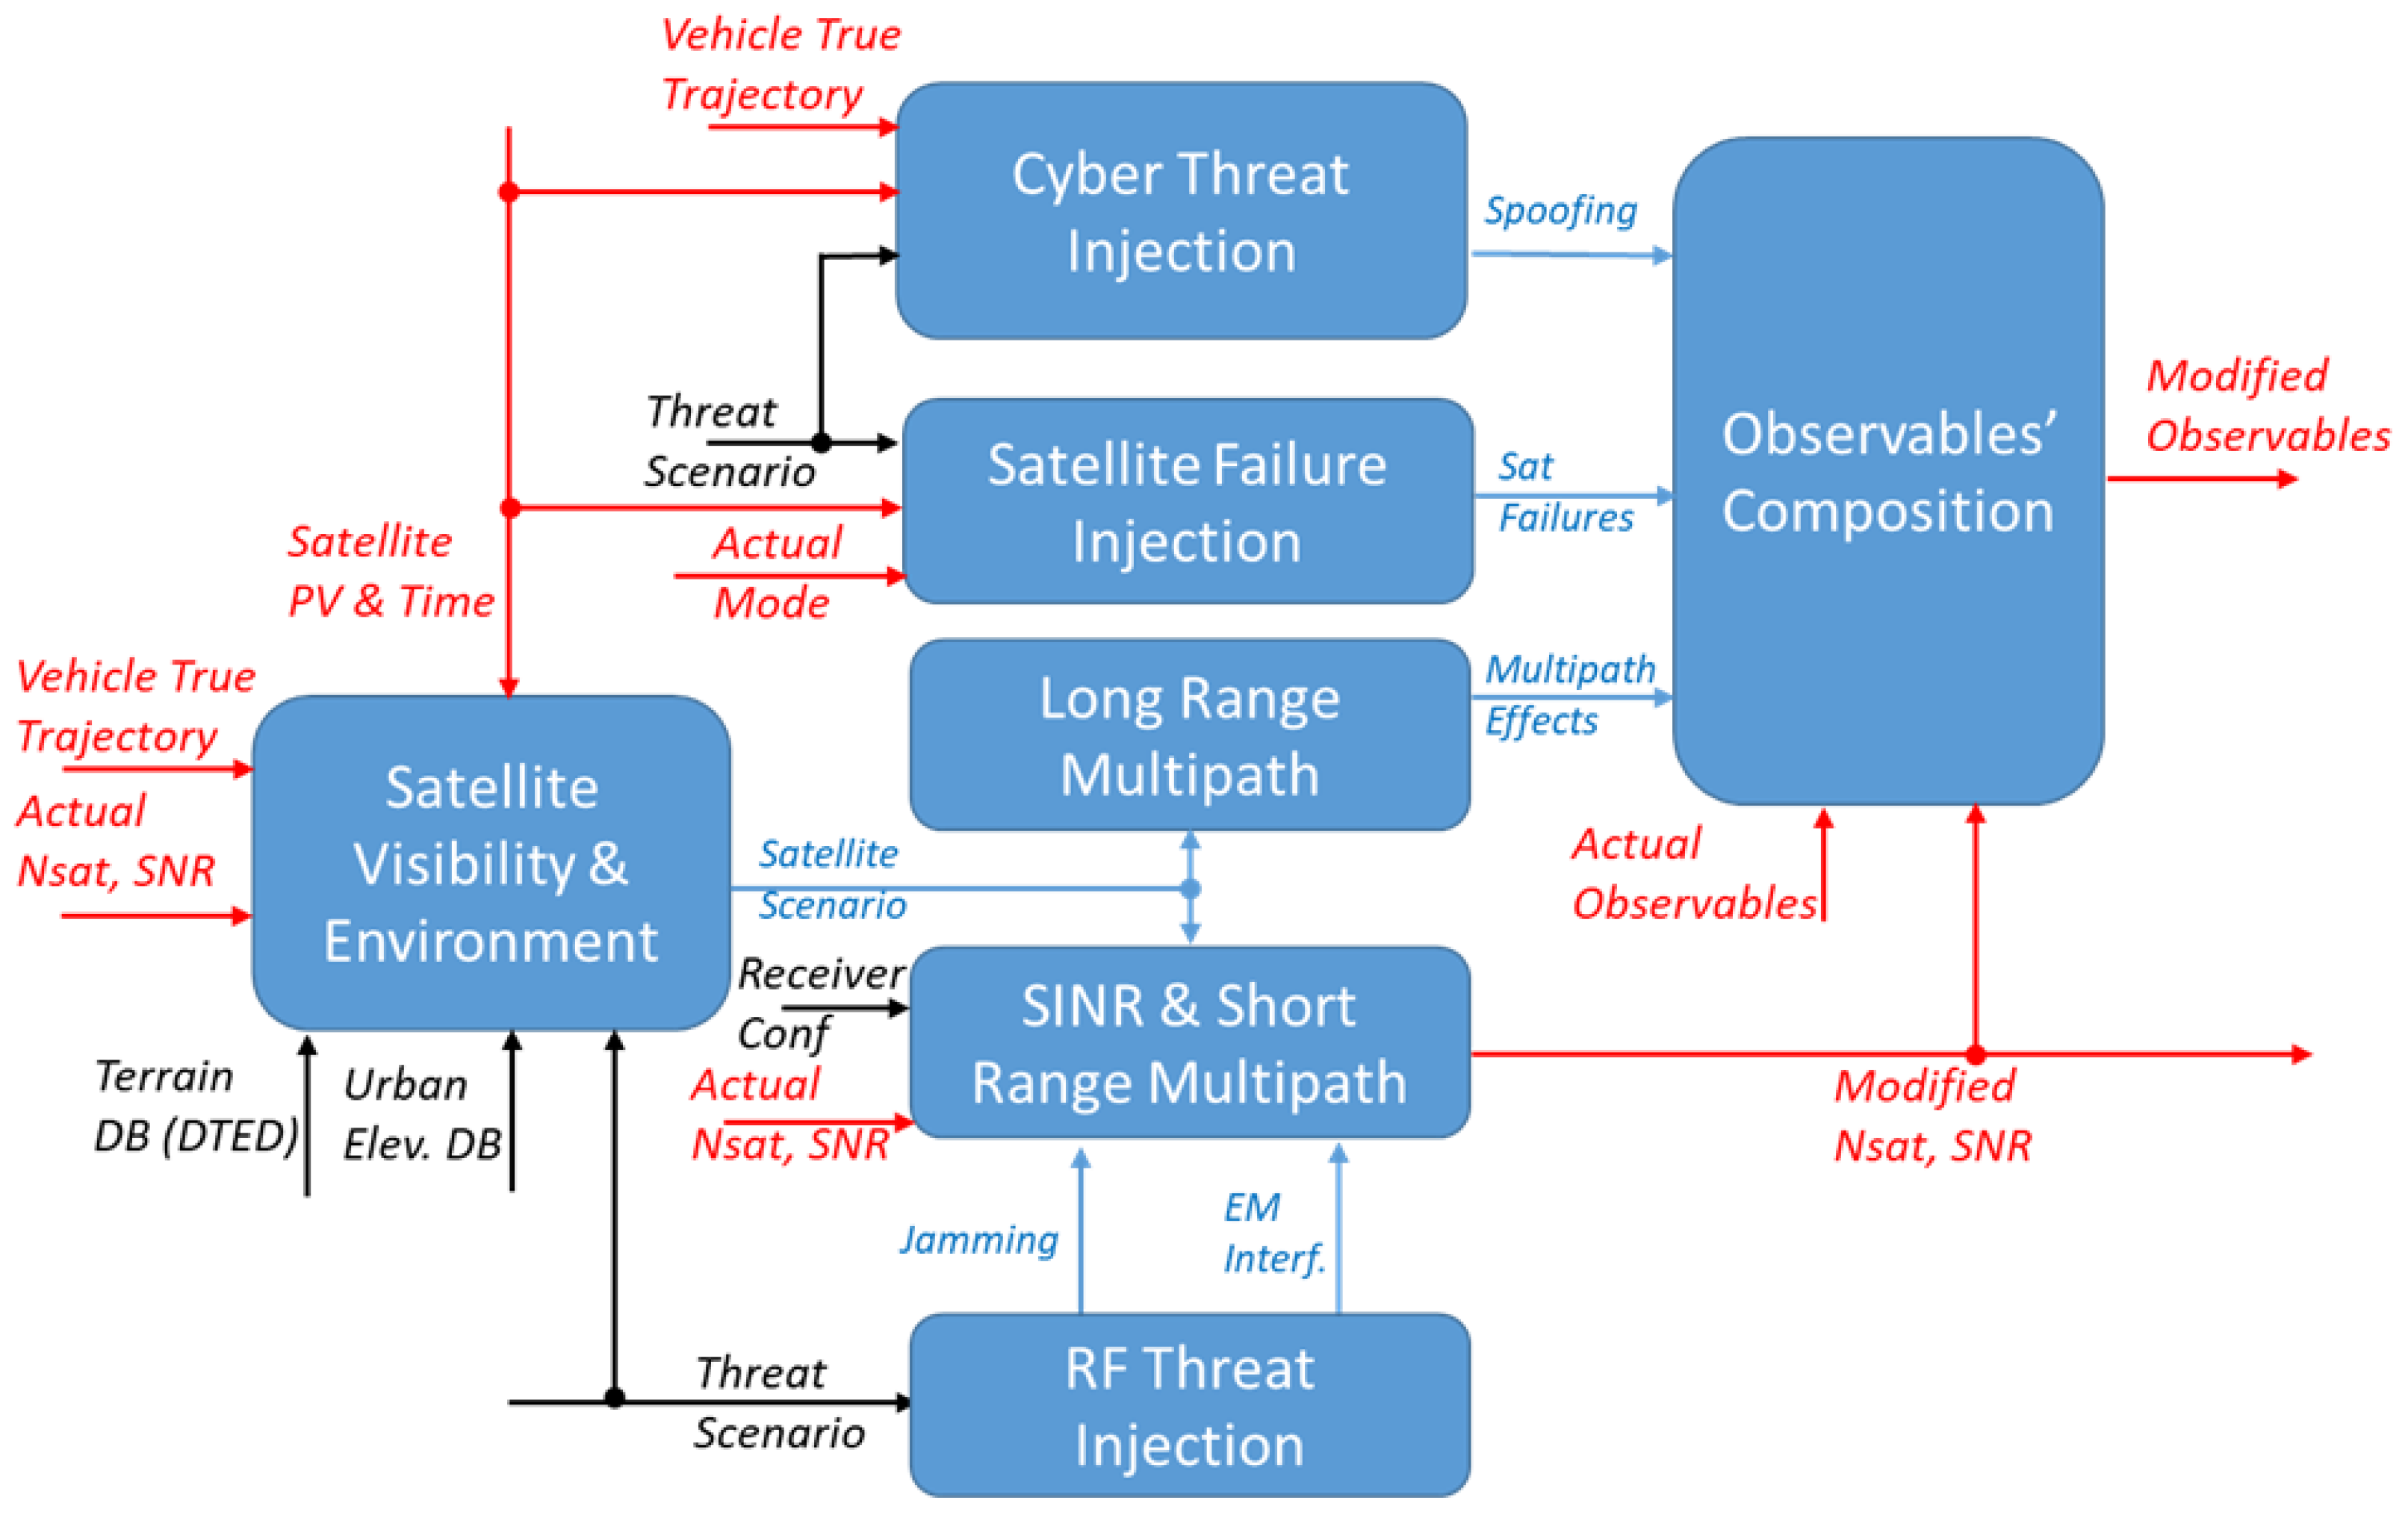
Figure 2 shows the first hierarchy level of the GNSS receiver simulator model. Input/output data of the simulator are depicted in red, configuration parameters are depicted in black, and internal data that are exchanged between each model are in blue.
The Satellite Visibility and Environment, using the available terrain and urban elevation data, computes the altitude above ground of the vehicle, the distances of the vehicle from the terrain and the other obstacles on the horizontal plane (with a given azimuth angle grid) and the satellites (with their azimuth and elevation angles) that are in LOS of the antenna considering the available terrain and urban elevation DB and assuming an ideal hemispherical radiation pattern. Finally, based on all of the above computations for each satellite, a specific visibility/multipath condition is declared (i.e., open sky, mountain or canyon) that would form the Satellite Scenario information to be used by the subsequent error models.
The RF Threat Injection module, based on the specified threat scenario, evaluates the interfering power at the output of the correlator due to several jamming waveforms and possible (unintentional) EM interferences.
SINR and Short-Range Multipath computes an estimation of the Signal-to-Interference-plus-Noise Ratio (SINR) for each received satellite in line-of-sight, using the antenna radiation pattern model, the information coming from the Satellite Visibility and Environment block, and the interfering power due to jamming and EM interferences coming from the RF Threat Injection block.
Long-Range Multipath, using information coming from the Satellite Visibility and Environment block, evaluates the possibility of having reflection from the ground, nearby obstacles and from the vehicle itself. It estimates some parameters that are used to compute the multipath variance portion for the satellites’ pseudo-ranges. Based on these parameters, the errors related to this effect on each satellite’s pseudo-range are generated.
Satellite Failure Injection defines the failure events to be included in the simulation and generates the required fictitious errors in the GNSS receiver observables. Each failure occurs at a specified simulation time and could end at a later time; failure effects are computed for both pseudo-range and delta-range measurements, but based on the current receiver mode, these effects could be different (e.g., in the case of SBAS, they could disappear after a few seconds).
The Cyber Threats Injection module, according to the threat scenario, provides fake pseudo-ranges to emulate possible spoofing attacks. The true trajectory of the vehicle is also needed for carrying out smart spoofing attacks that exploit dynamic techniques that virtually modify the behavior of the vehicle.
Finally, the Observables’ Composition module combines the input observables with the error contributions generated by each configured threat, as previously discussed. It receives the PR and DR from the GNSS receiver and adds to them the PR and DR deviations generated by each simulated threat. Note that the PR and DR from the GNSS receiver are assumed to be in ‘Open Sky’ conditions. For threats such as multipath and cyber-attacks, which only generate pseudorange modifications, the module also computes the corresponding delta range.
4. GNSS Threat Simulator Implementation
The GTS can be used in different ways, as follows:
- •
For standalone fast-time evaluation of the effects that an urban/suburban environment and related threats can have on a (either simulated or real) GNSS receiver signals in open sky conditions (i.e., far away from terrain and human artefacts and without other threats);
- •
For being integrated in a fast-time simulator that includes the model of a GNSS receiver that has no threat simulation (i.e., is a ‘standard’ avionic receiver simulator);
- •
For being integrated in an HW-in-loop simulation with real-time emulation of a GNSS receiver on-board a piloted aircraft (either manned or unmanned) to perform a realistic simulation of the effects on the aircraft avionics that can be experienced during a flight in an urban or suburban environment;
- •
For being integrated in a flight control computer on-board an actual aircraft flying in open sky conditions and having a real GNSS receiver that performs online measurements to be used for the aircraft navigation.
In any of the above usage modalities, the main aim of GTS is to allow the user to evaluate the effect of the urban environment on the PR/DR and SNR of an open sky receiver for supporting the development and preliminary validation (also in flight) of new navigation processing algorithms.
In the next sections, the algorithm details of the GTS modules depicted in
Figure 2 will be given, taking advantage of the previous work made by the authors in [
28,
36], where preliminary implementation of some models has been described.
4.1. Satellite Visibility and Environment
The aim of this module is to check satellite visibility using a pre-defined elevation map of the terrain and of the human artefacts. Moreover, the module classifies the environment surrounding the vehicle to provide the characterization of the possible multipath severity that can affect each visible satellite.
As reported in [
36], the module first converts the trajectory data into the ECEF reference system and calculates the required rotation matrix using standard conversion and rotation formulas. Then, for each satellite, visibility is verified by first computing the line-of-sight in the local tangential plane (NED with respect to the WGS-84 datum) and rotating it relative to the antenna base plate using the antenna base plate’s mounting angles. At this point, the visibility checks consist of verifying that the LOS elevation angle is greater than the minimum threshold value (mask angle) in the NED plane.
The next step involves defining the latitude and longitude checkpoints necessary to assess the multipath scenario according to the altitude map. For each satellite, we compute the minimum “elevation margin” (Δ
Hmin) between the LOS vector and the elevation profile and compare this value to a threshold Δ
HMount_thd (set at the default value of 40 m). To ensure accurate elevation data management, we also integrate the EGM96 mean sea level altitude model. The checkpoints for LOS checks are evaluated along the LOS direction, using a parametric distance vector (i.e., from 50 m up to 4950 m with 100 m steps for a total of 50 evaluations). This criterion serves as the primary basis for determining the Mountain Scenario, in conjunction with an assessment of the current user height related to AGL and the satellite elevation (
Table 2).
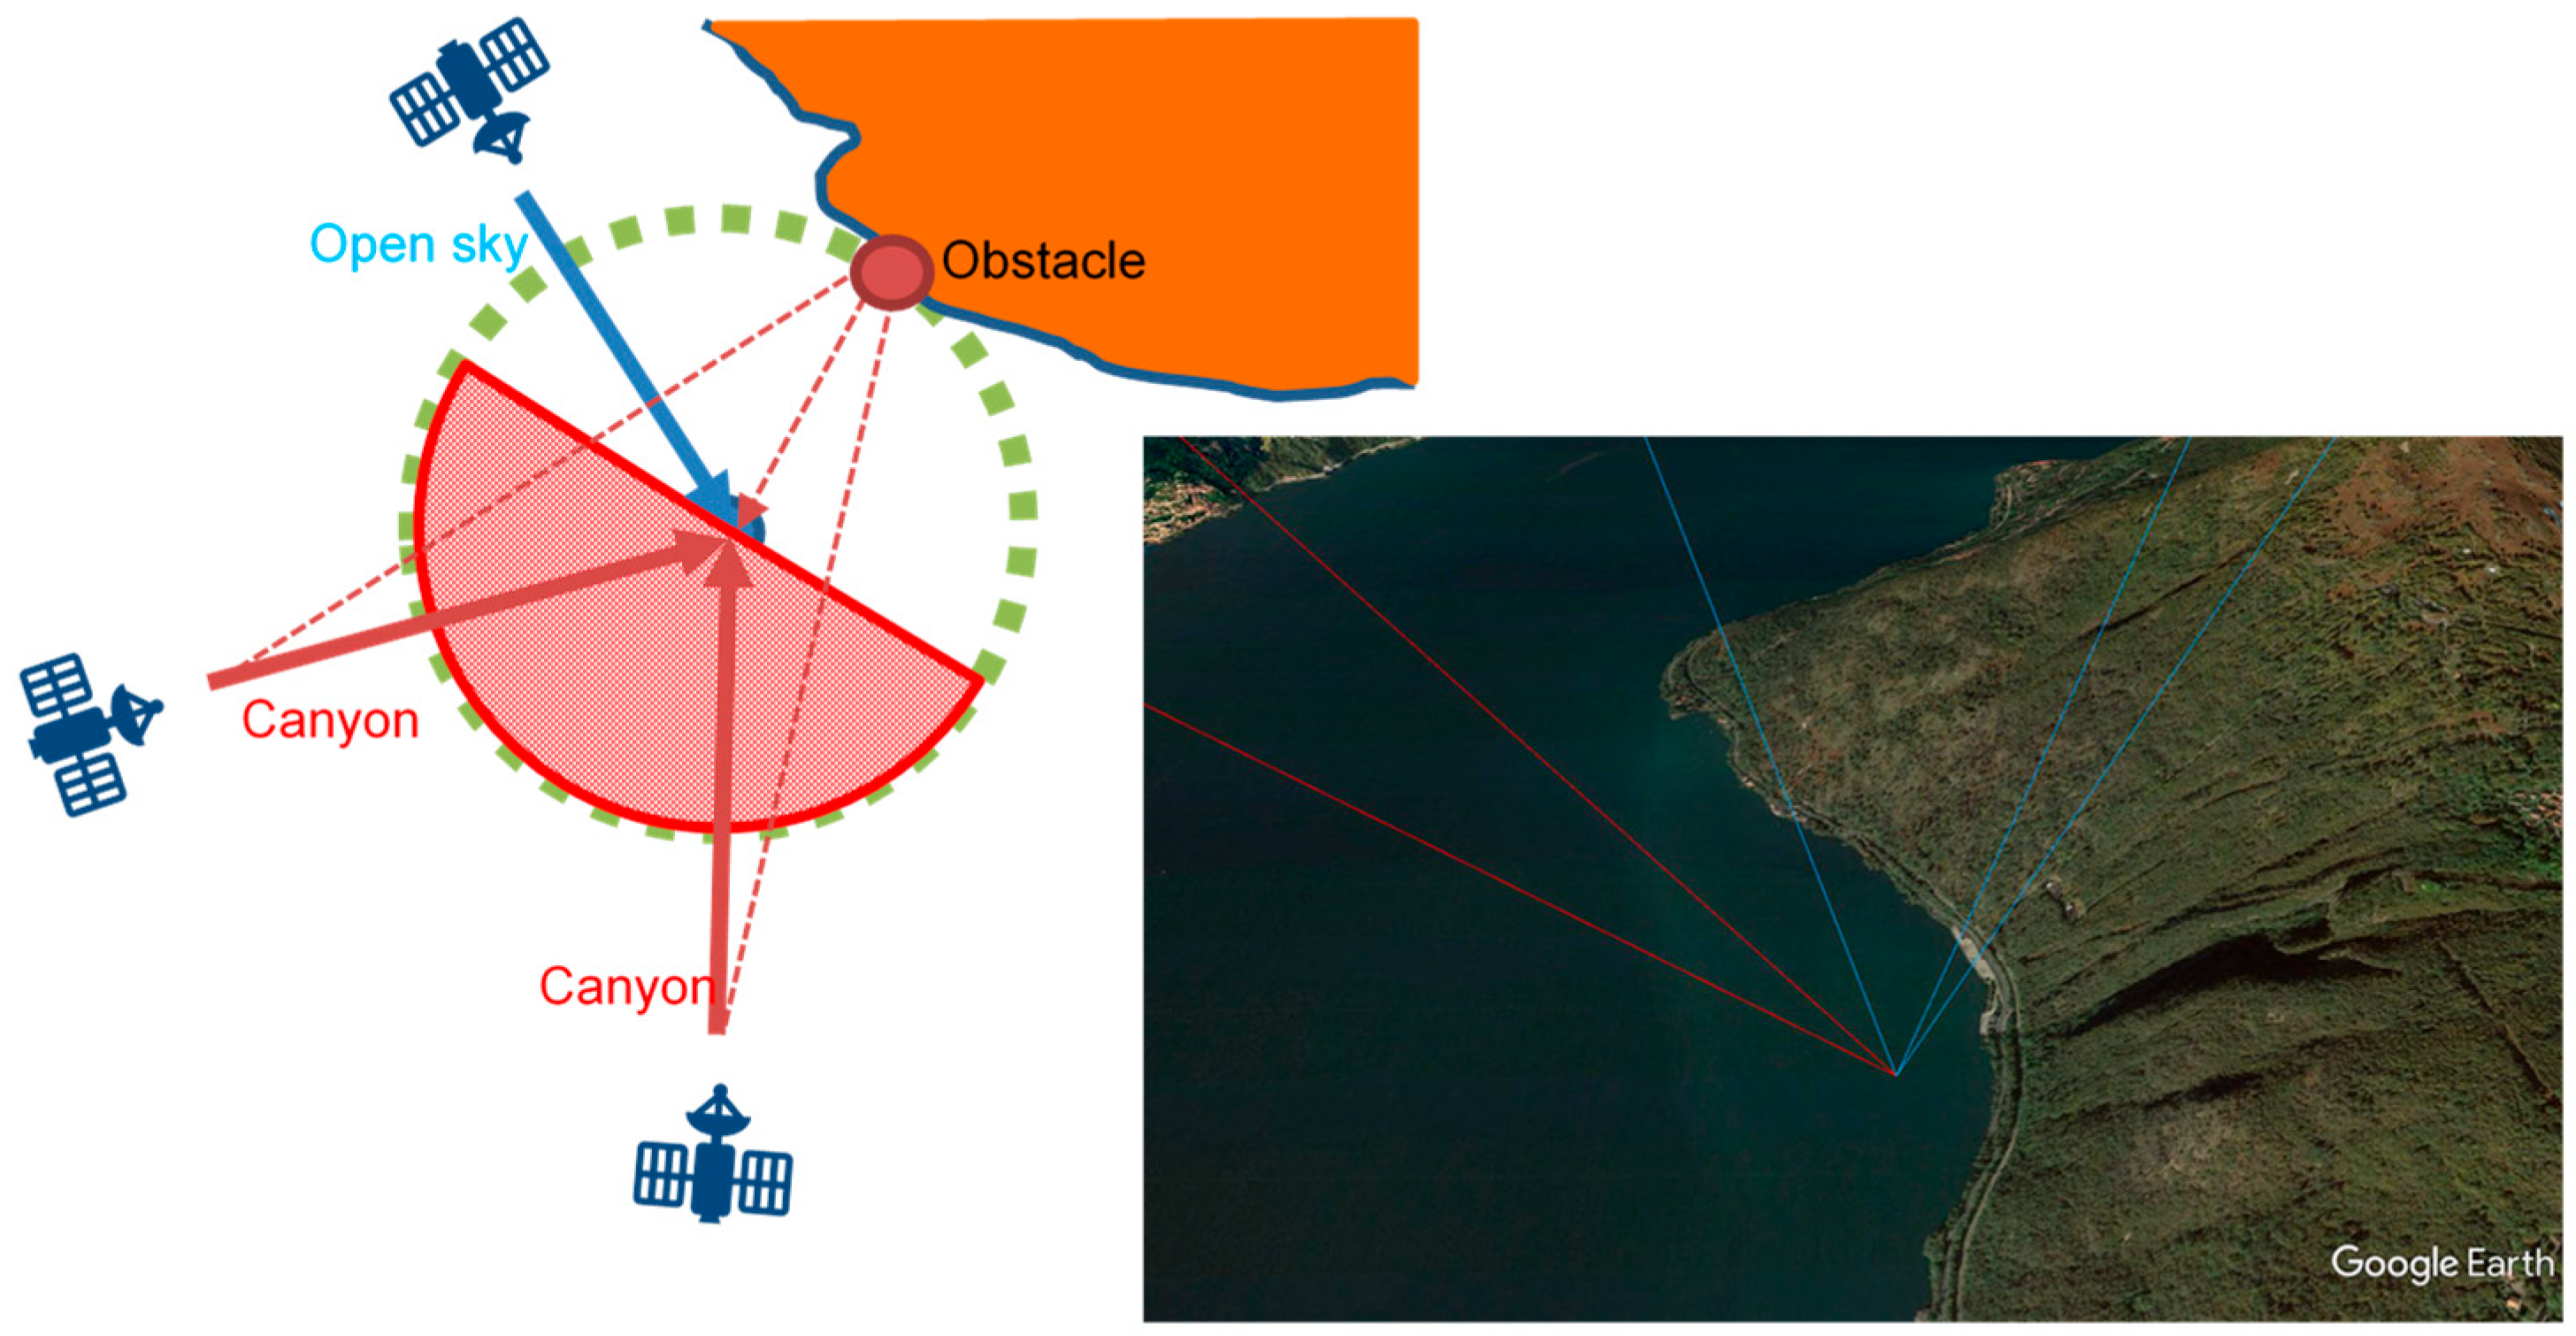
To determine the canyon scenario, we analyze a dedicated set of checkpoints surrounding the user’s position. In the current implementation, these checkpoints are evenly spaced in azimuth at a predefined distance from the user (i.e., at about 350 m). Each checkpoint is evaluated against the user’s height. If the height of a checkpoint exceeds the user’s height by a specified threshold Δ
HCanyon_thd (set at the default value of 20 m), it is classified as a reflective obstacle (
Table 2). This obstacle will be treated as a source of signal replicas for satellite signals received from the opposite semicircle in terms of azimuth (see
Figure 3).
The key changes in the current software with respect to the previous one reported in [
36] are
- •
The use of raster surface elevation maps derived from different data sources, such as the Digital Terrain Elevation Data (DTED) Level 1 with horizontal spatial resolution of about 90 m, the DSM Level 2 map with horizontal resolution of about 30 m, and a high-resolution map (0.2 arcsec about 6 m) extracted from Flight Gear and integrated with OpenStreetMap;
- •
The evaluation of the surrounding scenario considering not only the terrain elevation but also human artefacts;
- •
The storage in global memory blocks of the mean sea level elevation data matrix, as well as the EGM96 geoid altitude data matrix, initialized only at the simulation starting time. In this way, the algorithm no longer has the need to build a runtime 3-deg-by-3-deg map area tile on the basis of the actual aircraft position, allowing better performance for real-time applications.
4.2. Long-Range Multipath
The aim of this module is to address the effects of long-range multipath components, specifically reflections from obstacles far enough to induce relative delays, potentially leading to errors in pseudo-range estimates. This is achieved by utilizing scenario information from the previous model, each characterized by specific statistical parameters modeling the propagation paths. The defined environments are correlated with the classical simulation scenarios outlined in [
37] (i.e., open sky, suburban, urban) and the corresponding simulation parameters are applied. Multipath delay effects are simulated by quantifying a standard deviation based on the model reported in [
36,
37] and summarized in
Table 3.
For each satellite, the multipath model will compute the delay effect on the L1 carrier (assumed valid also for E1 and B1). This delay will then be used to build the pseudo-range error model for both standalone and SBAS mode (i.e., single-frequency mode), while for the dual-frequency mode, it is amplified with the factor
where
f1 is the first frequency, and
f2 is the second one [
38].
Figure 4 reports a schematic view that summarizes the computation of the effect of the long-range multipath described in this section.
4.3. SINR and Short-Range Multipath
The aim of this module is to introduce the effects due to the multipath short-range components, i.e., the reflections occurring close to the receiver position for which the relative delays are negligible with respect to the GNSS signal chirp period, using the current scenario information coming from the Satellite Visibility module. Indeed, even if short-range reflections produce a random fading of the signal strength, typically they have no effects on the pseudo-range delay evaluation. For this reason, they are accounted for by simulating the 3D gain pattern of the antenna installed on the vehicle and providing an attenuation value depending on the satellite’s relative position (with respect to the vehicle) and the attitude of the vehicle itself.
Specifically, the SNR gain is computed as [
36,
37,
39]:
where
is assumed to be the antenna magnitude gain, such that
is the antenna power gain along the instantaneous direction of the satellite with respect to the vehicle coordinate system, and:
where the parameter
represents the power of the signal shadowing components modeled with log-normal distribution
, with
and
being, respectively, the mean and variance of the normal distribution
,
, the probability of shadows, and
, the Rice factor, all defined as functions of the current scenario (i.e., Open Sky, Mountain or Canyon). The parameters actually used by the current simulation model for typical scenarios are reported in
Table 4.
Figure 5 reports a schematic view that summarizes the computation of the
SNR described in this section.
4.4. RF Threats Injection
This module aims at injecting RFI threats by simulating intentional/unintentional interferences to the target GNSS receiver. The interference impact is computed in terms of SNR gain. Different threat scenarios are simulated according to the nature of the interference: continuous RFI, such as jamming signals emitted by hostile agents and intersystem interferences produced by operational satellites in other GNSS constellations; pulsed RFI, related to unintentional RF interferences due to harmonics or spurious components coming from out-of-band communication systems (e.g., transponders, Very High Frequency—VHF radios).
The SNR gain is evaluated as the composition of three distinct contributions, i.e., continuous RFI (e.g., jamming, intersystem interferences), pulsed RFI (e.g., transponders, VHF radios) and cyber threats (e.g., spoofing). In detail, for the
-th satellite operating at the frequency
, the overall SNR gain is computed using the following expression,
where
in which
represents the so-called blanker duty-cycle, often used on GNSS receivers in order to mitigate pulsed interferences;
represents the maximum signal-to-noise power ratio, i.e.,
;
stands for the overall signal-to-continuous interference power ratio;
and
, respectively, correspond to the signal-to-pulsed interference power ratio and the duty cycle of the
-th pulsed interference, for all
;
refers to the spoofing-to-signal power ratio of the
-th satellite, evaluated according to the model described in
Section 4.5. Further details are available in [
28].
4.5. Cyber Threat Injection
This module aims at injecting cyber threats by simulating spoofing cyberattacks to the target GNSS receiver. The spoofing impact is computed in terms of pseudo-range-drifts and spoofing-to-signal ratios. Different threat scenarios are simulated according to the capabilities of the spoofer in regard to the prediction of legitimate navigation bits and signal power management.
For the computation of the pseudorange-drift, we extend the model available in [
31]. In detail, a measurement of the pseudorange
between a satellite
and a receiver
at time
may be modeled as,
where
is the speed of light;
is the signal transmission delay between
and
;
is the receiver clock offset from the GNSS time scale;
is the clock offset of the satellite from the GNSS time scale.
For an authentic signal (not spoofed) from
, the signal delay
is modeled as,
where
,
and
are, respectively, the geometric range, the ionospheric delay and the tropospheric delay between
and
. Then, the authentic pseudorange
is modeled as,
For a spoofed signal related to the satellite
and a receiver
by means of the spoofer
, the signal delay
is modeled as,
where
is the geometric range between
and
is the geometric range between
and
,
is the ionospheric delay between
and
;
is the tropospheric delay between
and
;
is the signal-processing delay of
for the signal of satellite
;
is the signal-controlled delay of
for the signal of satellite
.
Assuming that atmospheric delays are the same for the receiver and the spoofer, it can be demonstrated that [
28]
with
The term
represents the spoofing-signal delay of the spoofer
for the satellite
and the target receiver
, i.e., the additional signal delay introduced by the
at the target
for the signal of
. In general, we may assume that
, i.e., that the signal-processing delay of the spoofer
is the same for all satellites and does not depend on
. Moreover, the spoofer
may exhibit a prediction capability of the navigation data bits of the authentic signal. Thus, this capability introduces a further offset
that should be considered in the spoofed pseudorange. Based on the aforementioned considerations, the spoofed pseudorange
between
and
by means of
may be modeled as,
Considering the expression of
in (13), Equation (14) models
as the following function,
In the case of meaconing, the spoofer replays a recorded signal, i.e., it records an authentic GNSS signal and retransmits the recorded authentic signal to a target receiver to be spoofed. Thus, for meaconing,
. Moreover, a spoofed pseudorange (i.e., pseudorange-drift) is actually produced for satellite
only if the spoofing-signal delay
is less than the chip period of
.
Strictly speaking, the spoofing model (14) holds in case the target receiver is in single-frequency mode. Instead, if the target receiver is in multi-frequency mode, the following equation is applied,
where
and
are, respectively, the spoofed pseudoranges for L5 and L1 frequencies according to the spoofing model (14), and
. Further details are available in [
28].
4.6. Satellite Failure Injection
The primary function of this module is to simulate satellite and constellation failures by introducing a specific bias time history into the pseudo-range and delta-range measurements.
For each failure scenario, the module applies an increment to the pseudo-range and delta-range at each time step, but only if the current GPS time falls within the designated failure interval [t0i, tfi]. This allows the module to inject the failure during the specified period.
The module requires storing the cumulative value of previous biases. Using these increments, it generates the failure signals for both the pseudo-range (
PR_Fail) and delta-range (
DR_Fail) until the time reaches
tfi:
where
Ai,
Ri, and
Mi are the magnitudes of the acceleration, ramp and step failures (for each satellite index
i, only one of these quantities is different from 0),
u(.) is the step function and
δ(.) is the pulse function. It is worth noting that when a constellation failure is specified, a ramp failure is generated for any of the satellites within that constellation.
Finally, the module can also ‘force’ a failure in the SBAS-received signal so that the GNSS receiver is forced to not use SBAS-corrected PR and the related integrity-monitoring algorithm.
5. Results
The GTS module has been integrated in both fast-time and real-time simulation environments to validate a Hybrid Navigation Unit (HNU) [
40,
41] for UAM applications, leveraging a dual-frequency, multi-constellation GNSS model [
36] and a drone dynamic model. In these demonstrations, the GTS module was used to inject typical urban and suburban environment effects into the GNSS measurements in order to test the HNU.
The following reports both the fast-time and real-time test results of the GTS’ functionalities.
5.1. GTS Fast-Time Simulation
In this section, a dedicated verification activity is presented to demonstrate the correct functioning of the GTS module. As described in detail in
Section 4, the module is designed to emulate typical urban and suburban GNSS signal degradation. The following analysis aims to confirm that the module behaves as expected, ensuring its reliability for use in testing navigation algorithms under realistic conditions.
The fast-time simulation results of the RF Threat and the Cyber Threat modules are discussed in [
28]. This paper extends the latter work by discussing the fast-time simulation results of the other modules of the GTS.
5.1.1. Satellite Visibility and Environment
To assess the impact of different elevation map formats on GNSS signal simulation, a dedicated test was carried out in two main phases. The objective was twofold: first, to compare the level of urban detail captured by each elevation map format; second, to evaluate the differences in satellite visibility and multipath characterization resulting from the use of each format.
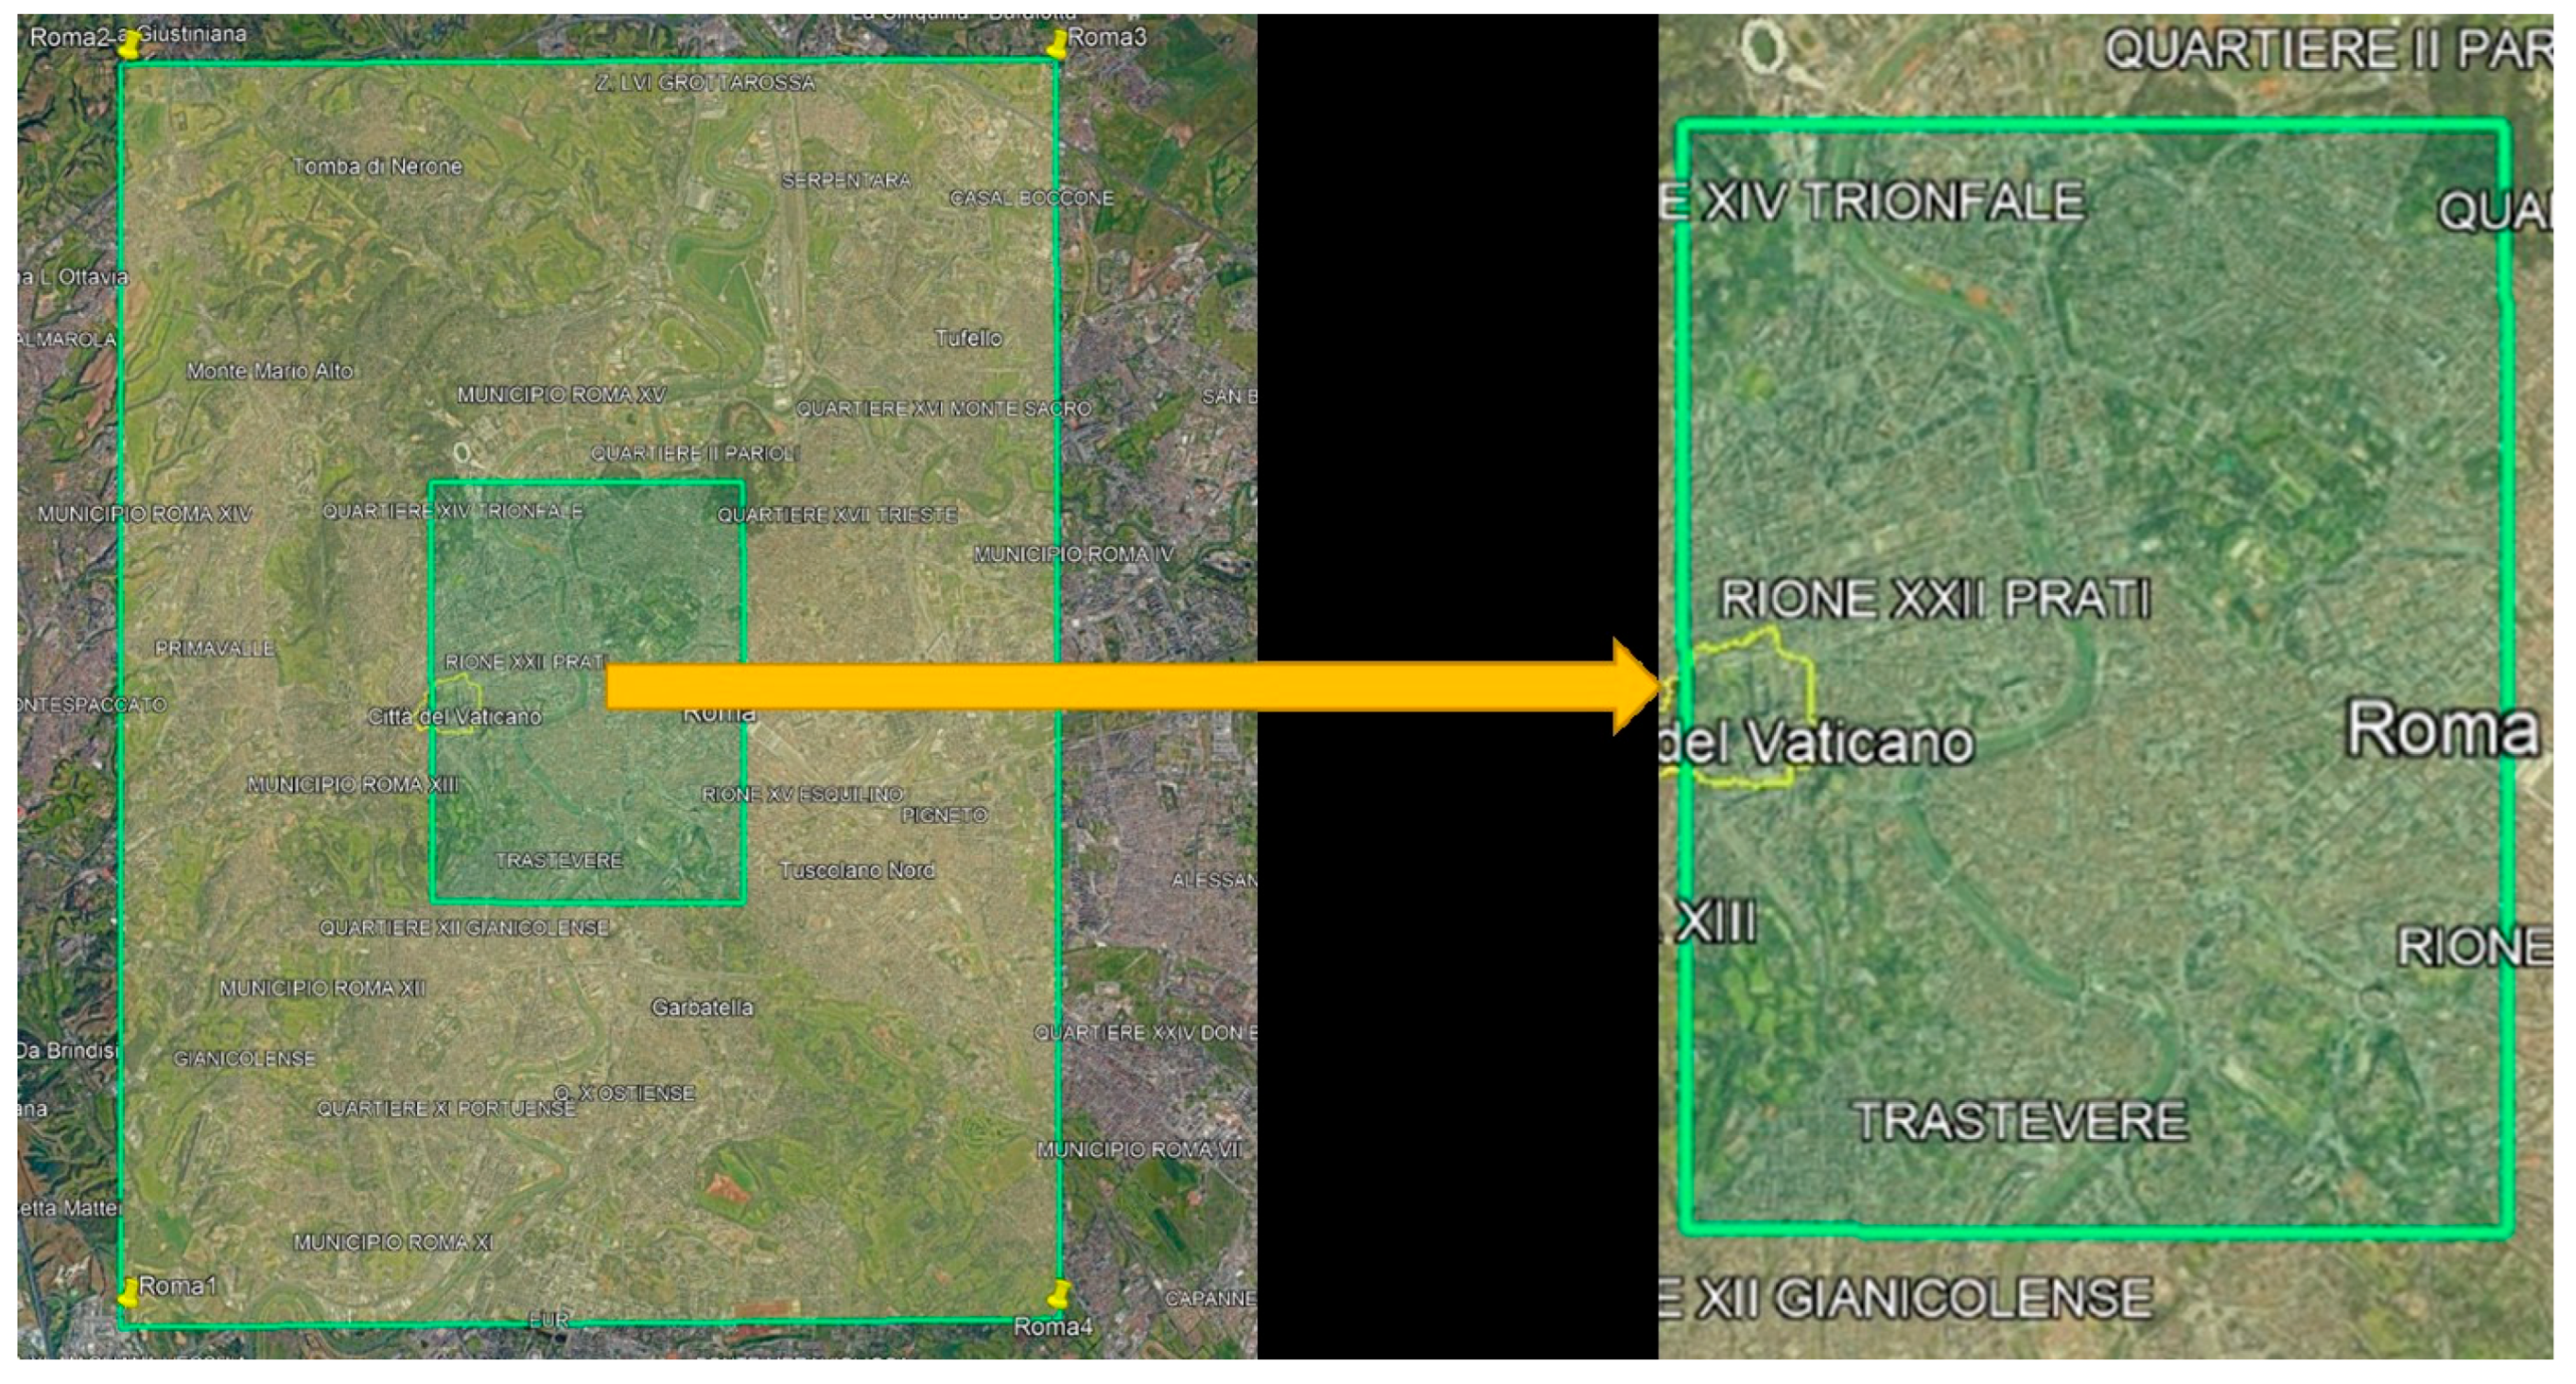
The test focused on a representative area located in the historical center of Rome, covering approximately 15 × 15 km. This area was selected due to its dense urban morphology, which poses significant challenges for GNSS signal propagation and therefore provides a meaningful scenario for performance comparison.
Figure 6 illustrates both the entire test area and a zoomed-in view of its central region, as extracted from Google Earth. The analysis aimed to determine how accurately each elevation data source captures the structural complexity of an urban environment and how this influences the simulated GNSS measurement in such an environment.
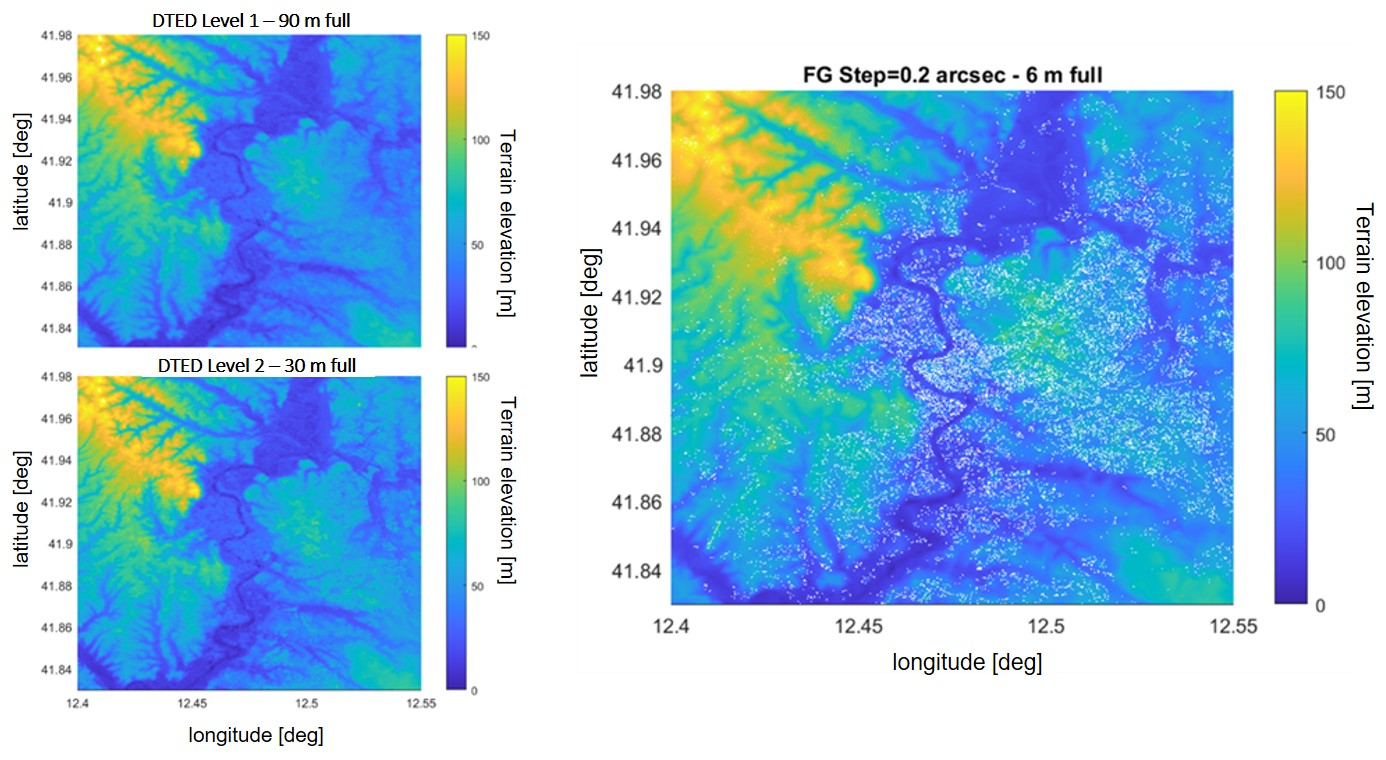
Figure 7 presents the elevation maps of the entire test area as derived from three different sources: DTED Level 1, DSM Level 2, and Flight Gear/Open Street Map. The elevation values, expressed in meters, range from 0 to 150 m above sea level.
A more detailed comparison is shown in
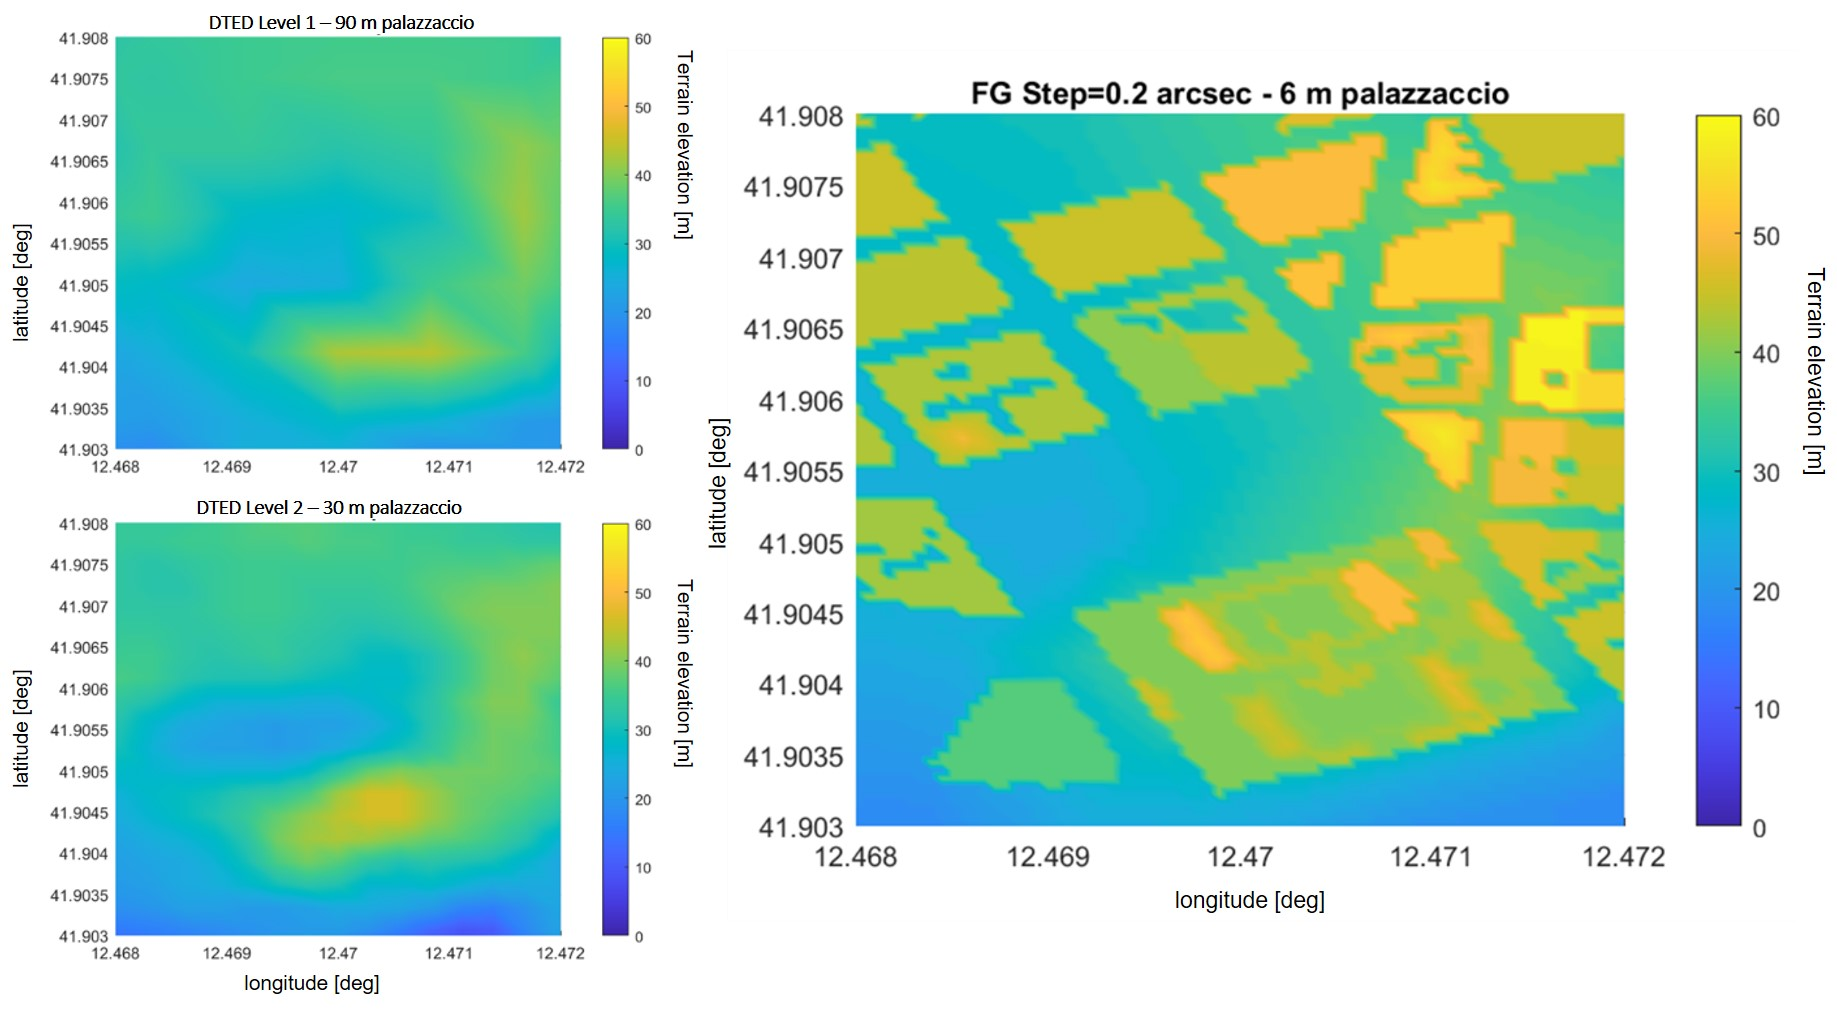
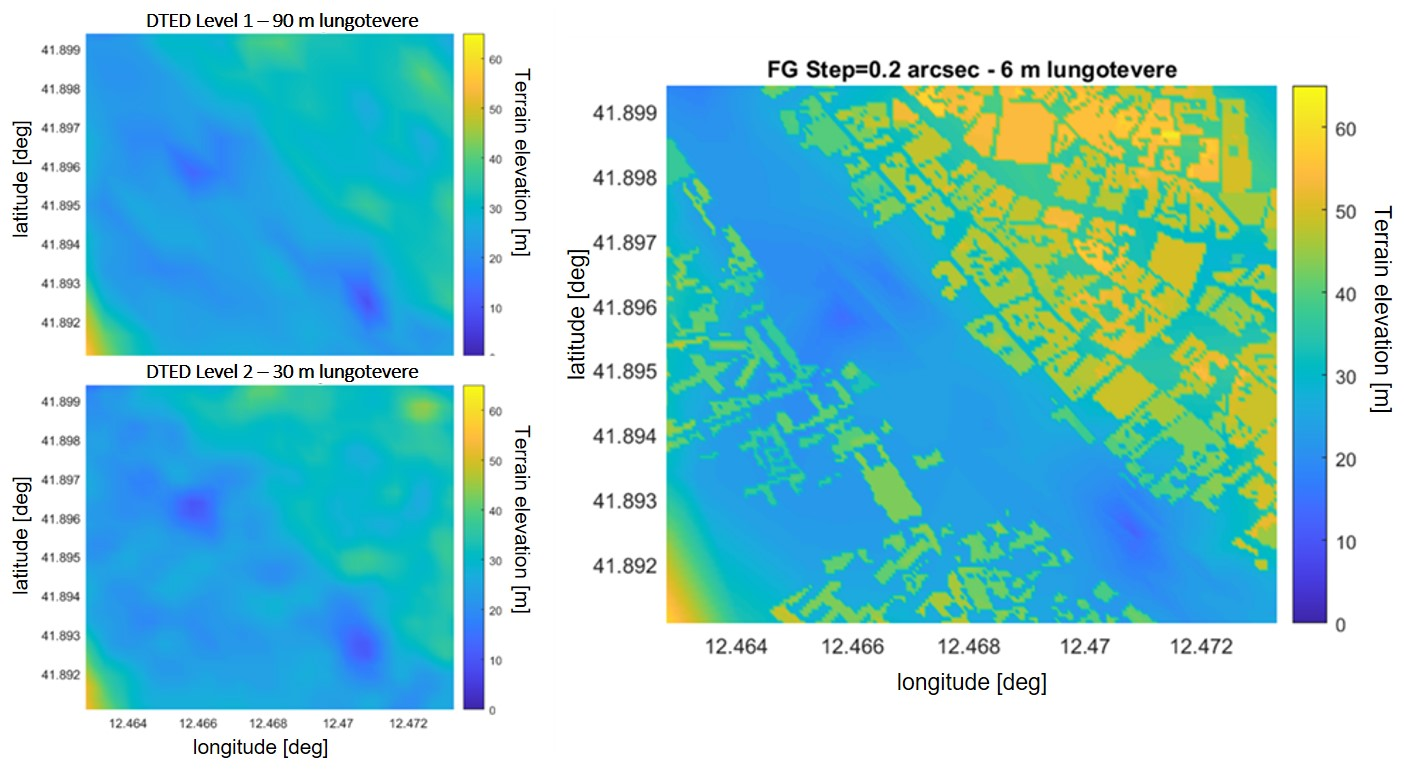
Figure 8 and
Figure 9, which focus on two representative sub-areas within the central tile of the map, namely “Palazzaccio,” and “Lungo Tevere”. These areas were selected due to their diverse urban morphology and relevance in evaluating elevation data accuracy.
The visual analysis of these figures clearly highlights the limitations of DSM Level 2 and, to a greater extent, DTED Level 1 in accurately capturing the vertical structure of buildings. This inadequacy becomes particularly critical in scenarios involving low-altitude flight operations (≤500 m AGL), where precise modeling of the urban environment is essential for reliable satellite visibility and multipath prediction.
Based on the analysis presented above, it is evident that the elevation data of human artefacts in dense urban environments is accurately represented only when using high-resolution 3D building models, such as those available through the Flight Gear simulator integrated with Open Street Map data.
However, for GNSS threat simulation purposes, it is essential to assess the practical implications of using different elevation data sources on the final simulation outcomes.
To this end, numerical simulation tests were conducted to evaluate the impact of each elevation data source on the output of the satellite visibility simulator. One of the test scenarios consisted of a low-altitude (125 m, mean sea level), low-speed (25 knots) flight mission over the previously defined urban test area. The corresponding flight trajectory, in terms of latitude and longitude, is depicted in
Figure 10.
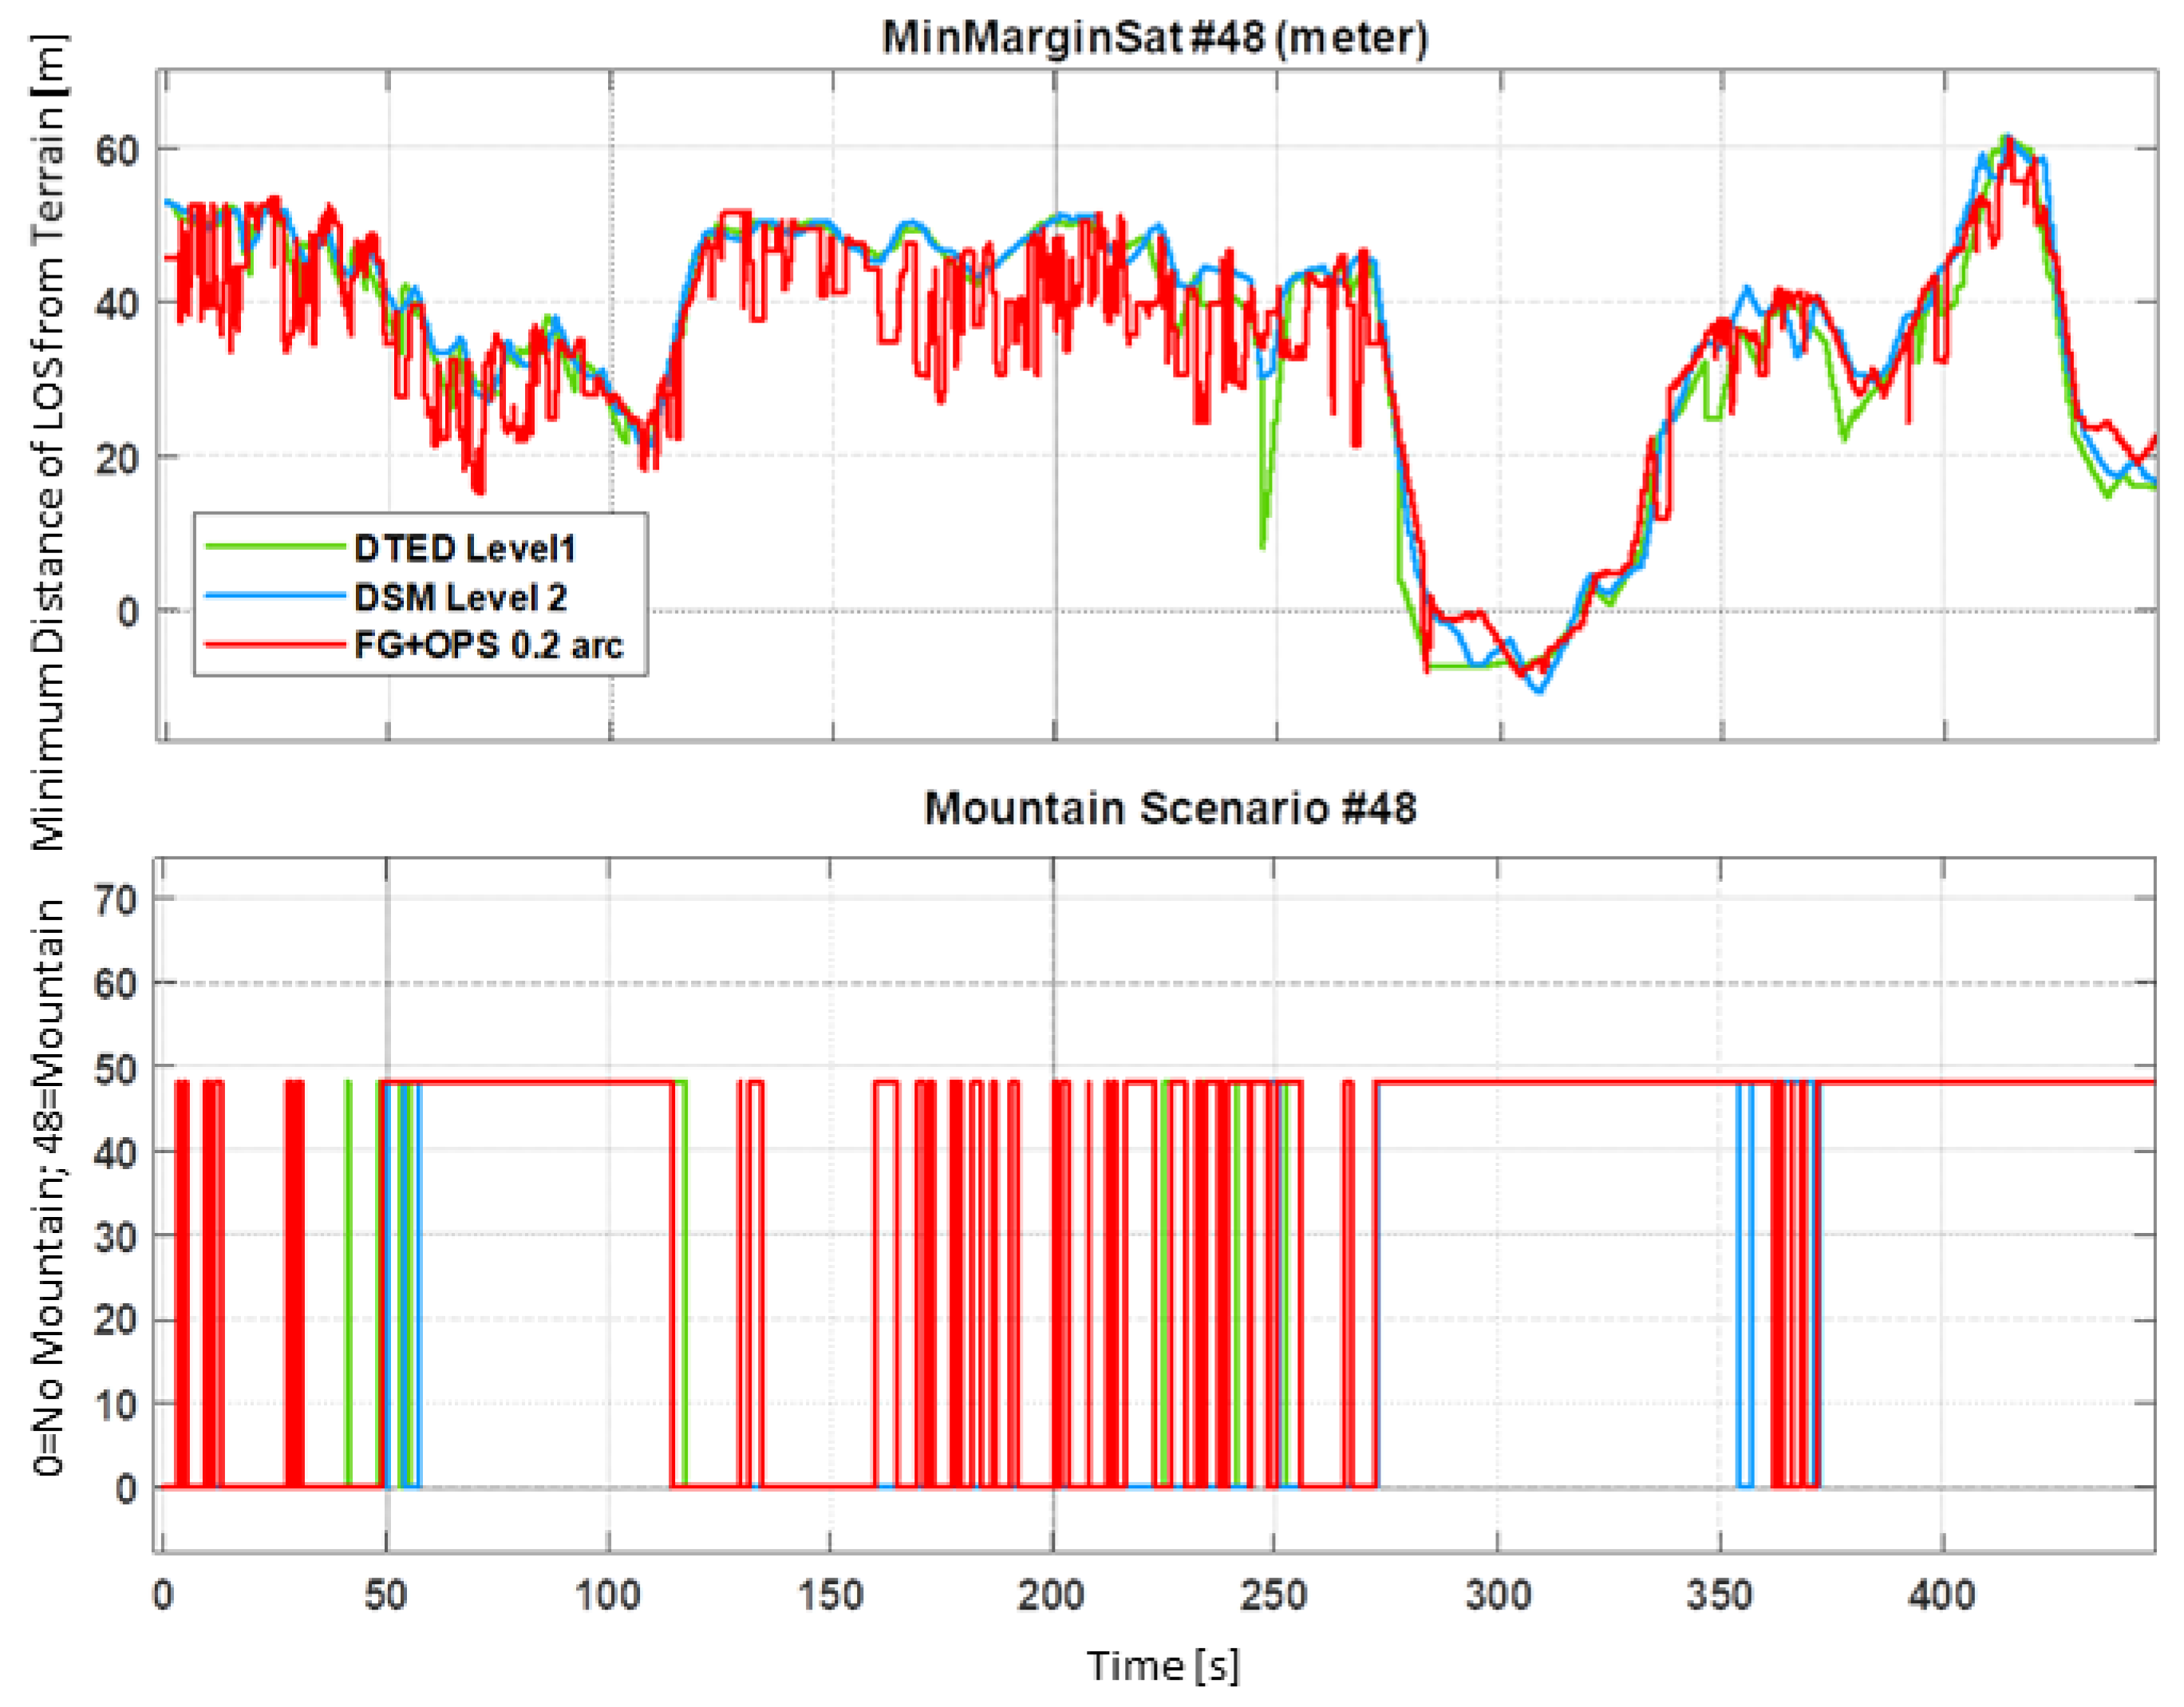
In
Figure 11, the time behavior along the given test trajectory of the mountain scenario of satellite #8 of the Galileo constellation is shown. The upper graph shows the margin in meters of the satellite LOS vector from the obstacles as computed using different terrain databases. The lower graph is simply a flag (0 or 48 value) that tells when satellite #8 is declared in a multipath condition that has been identified as ‘Mountain’ (i.e., in between a full canyon and open sky); see
Section 4.1The comparison among the results obtained using DTED Level 1, DSM Level 2, and Flight Gear combined with OpenStreetMap data clearly indicates that only the latter is capable of accurately reproducing the effects of building elevation on satellite visibility. While DSM Level 2 offers an intermediate level of accuracy and, on average, tends to follow the behavior of the detailed model, DTED Level 1 often produces inaccurate results, particularly in scenarios with significant urban complexity.
5.1.2. Long-Range Multipath
Long-range multipath effects on the pseudorange strictly depend on the current scenario evaluated by the satellite visibility function.
Figure 12 illustrates the impact of transitioning from an open-sky environment to a mountain scenario on the pseudorange measurements of the Galileo satellite Pseudorandom Noise (PRN) #12. As shown, the introduction of terrain obstructions leads to a significant increase in the pseudorange error. Conversely, when the scenario returns to open-sky conditions, the pseudorange error correspondingly decreases, highlighting the effects of GTS on GNSS measurements.
5.1.3. Short-Range Multipath
Short-range multipath effects on the SNR strictly depend on the current scenario evaluated by the satellite visibility function.
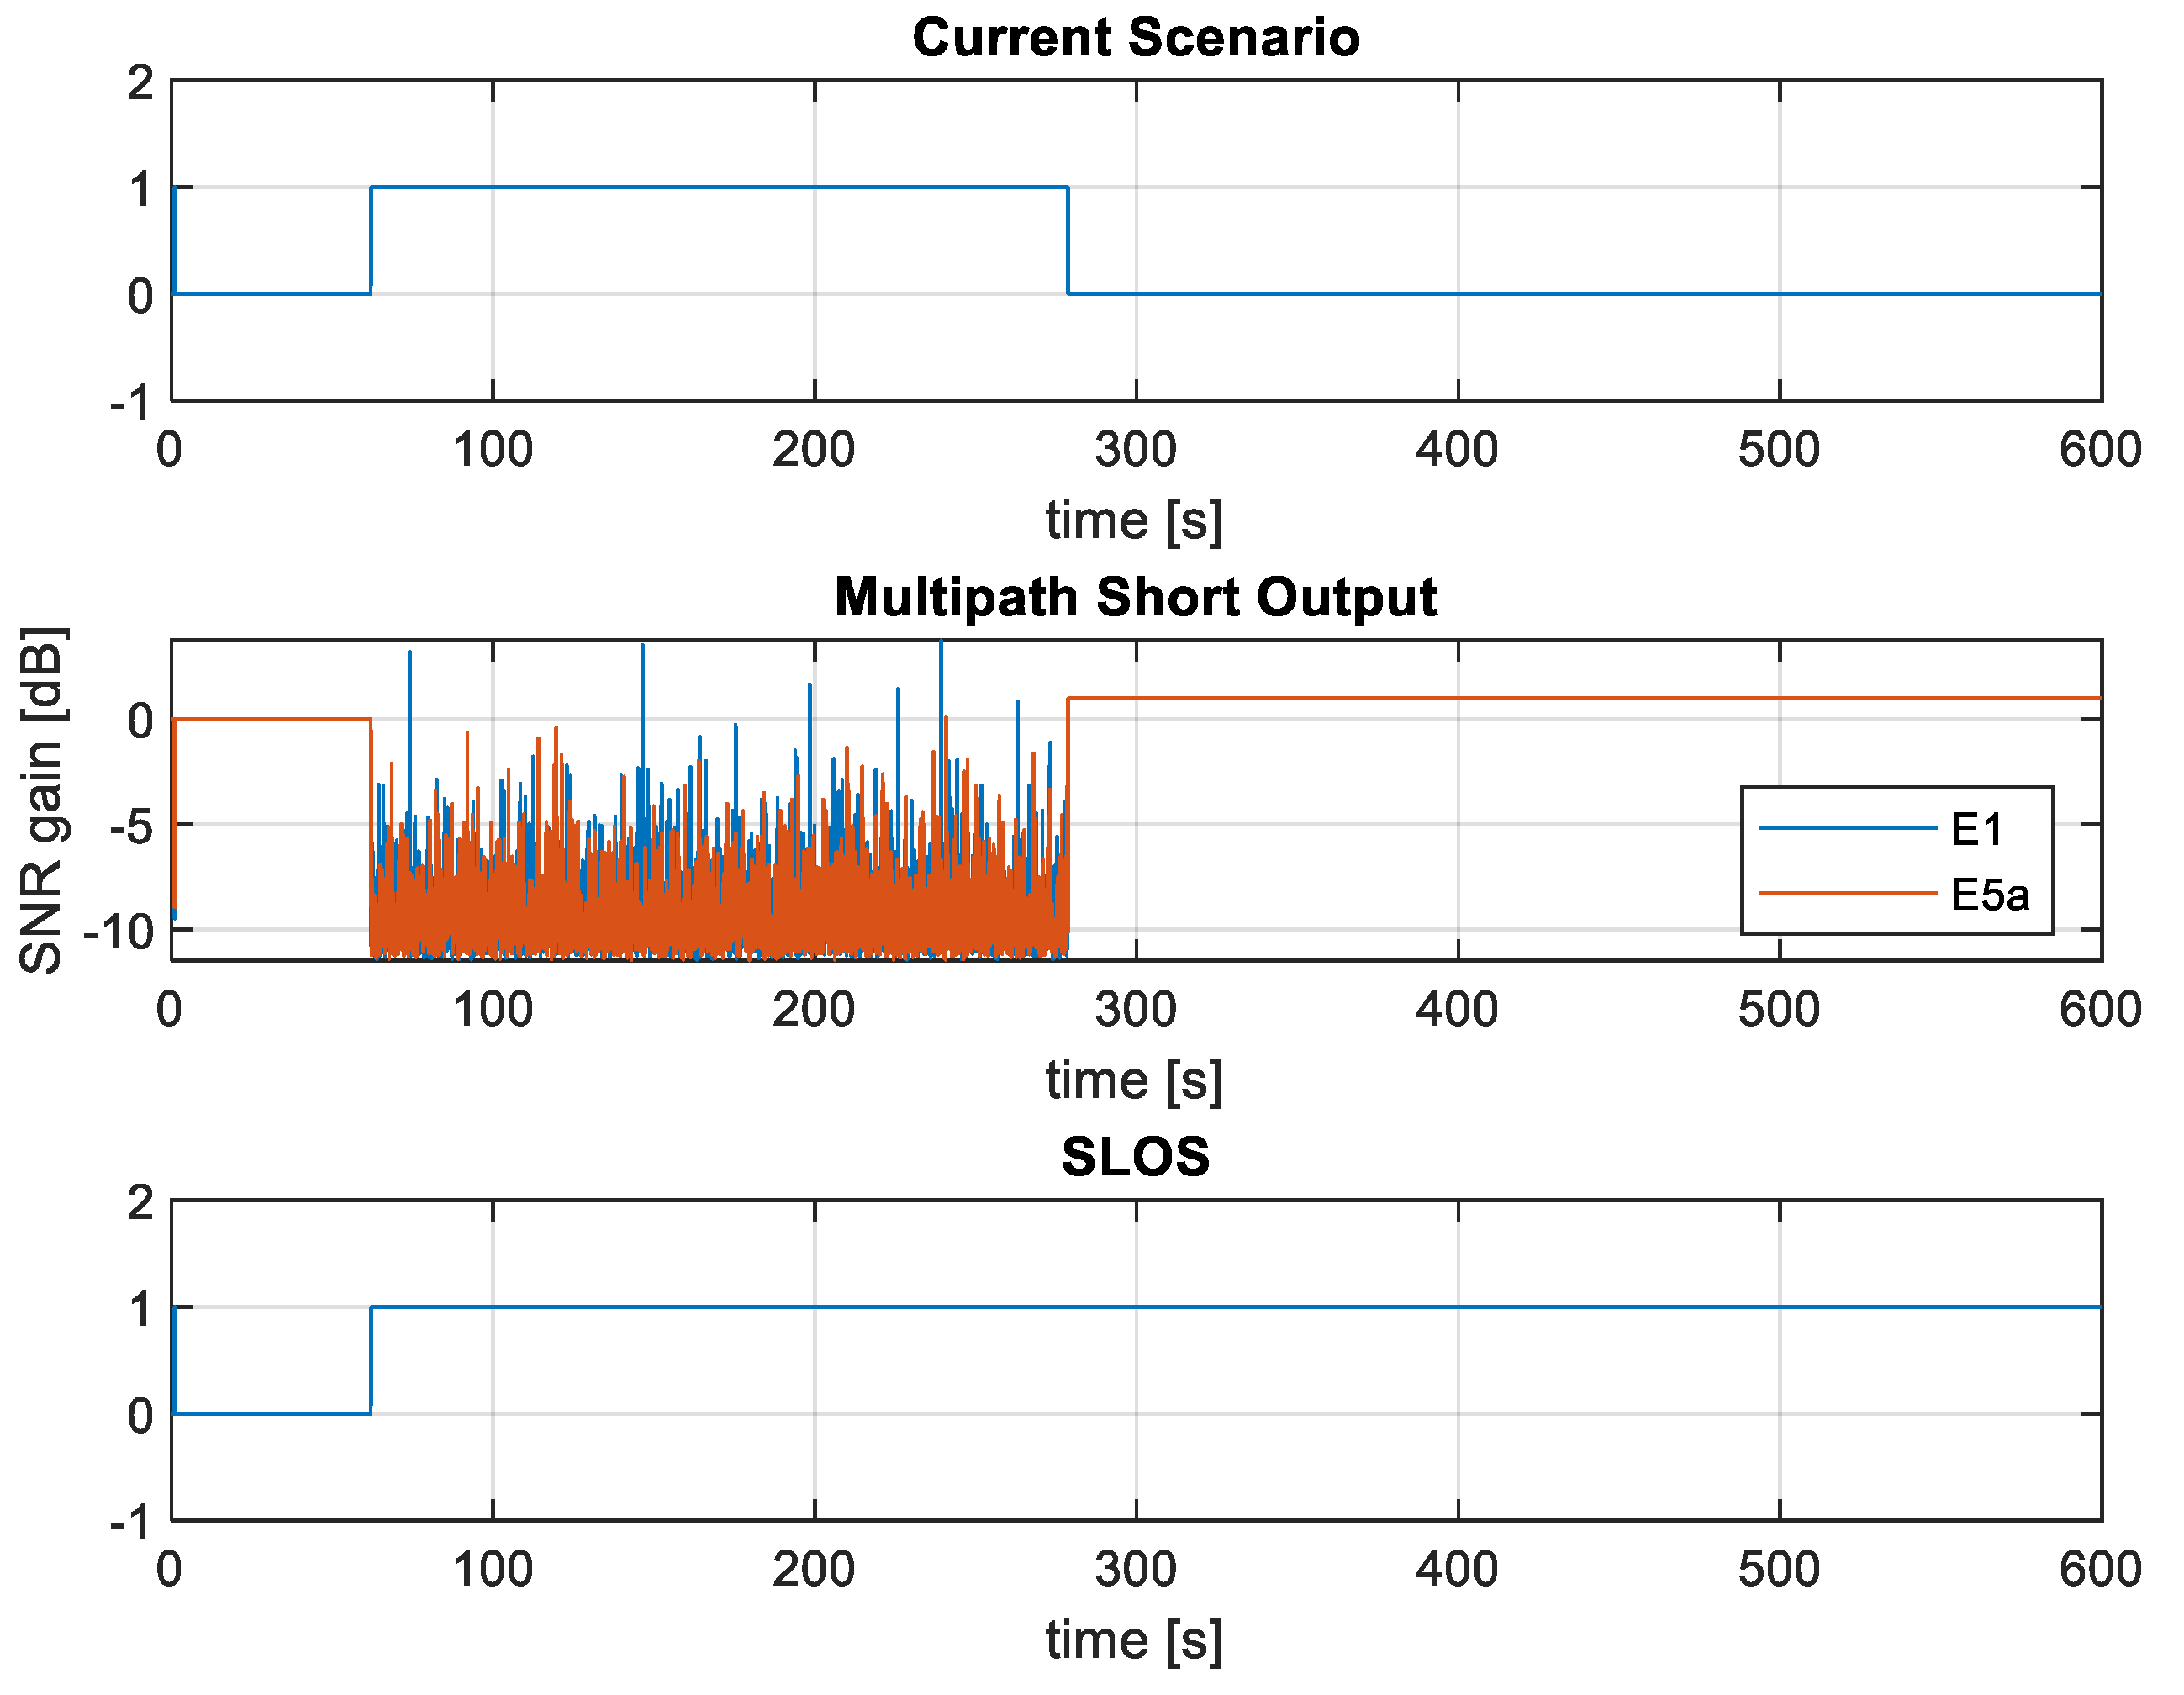
Figure 13 illustrates the impact of transitioning from an open-sky environment to a mountain scenario on the SNR, both E1 and E5a bands, associated to the Galileo satellite PRN #12. As shown, the introduction of terrain obstructions leads to a significant variation in SNR. Conversely, when the scenario returns to open-sky conditions, the SNR returns to a normal value, highlighting the effects of GTS on GNSS measurements.
5.2. GTS Real-Time Simulation
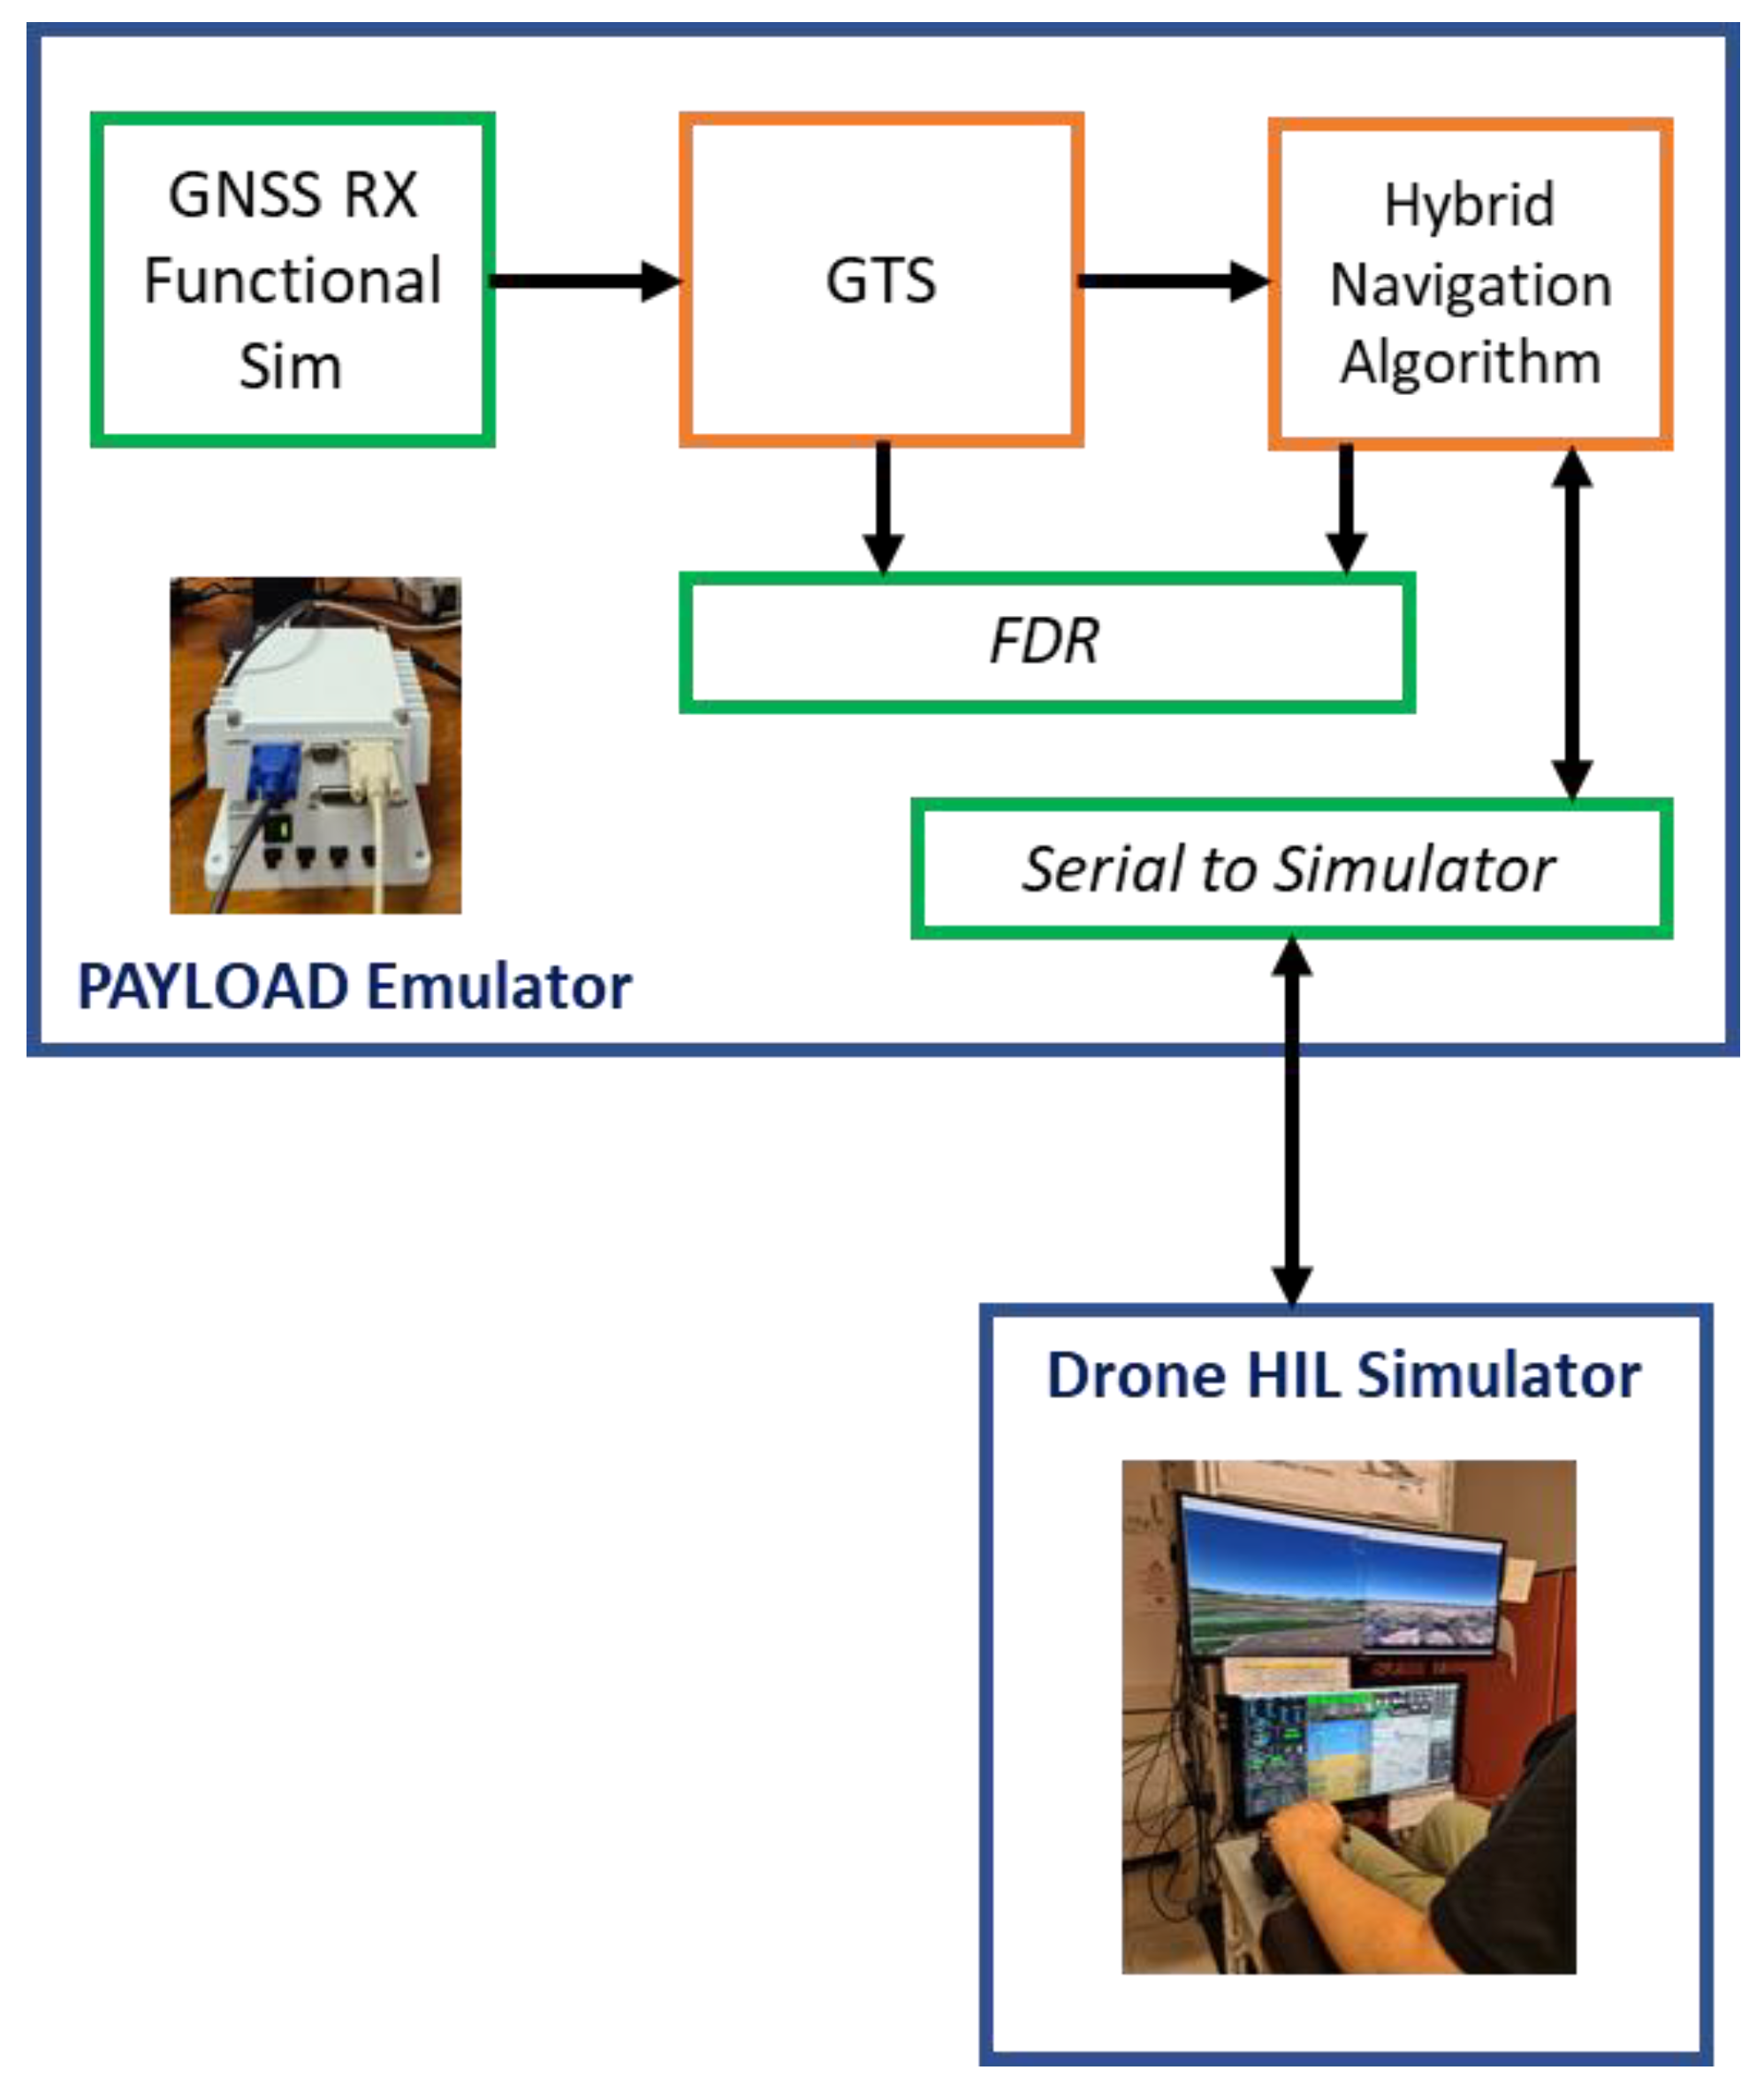
In this section, the real-time hardware in-the-loop verification architecture and some results concerning the executed tests are reported.
5.2.1. Real-Time Hardware In-the-Loop Test Rig
Figure 14 illustrates the laboratory test rig configured for hardware-in-the-loop (HIL) real-time simulation (RTS). The GTS was employed to validate a Hybrid Navigation Unit (HNU) [
40,
41], leveraging a GNSS functional simulator [
36]. The GTS captures GNSS observables and modifies them to simulate typical effects encountered in urban and suburban environments, providing these as inputs to the navigation algorithm.
All modules are executed on a PC-104 platform, which interfaces with an HIL simulator that reproduces a six degrees-of-freedom (6-DOF) model of a drone. The GTS runs on the payload hardware, as the outputs of the HNU are not fed back into the drone’s autopilot (AP) or flight management system (FMS) functionalities.
5.2.2. Real-Time Simulation Results
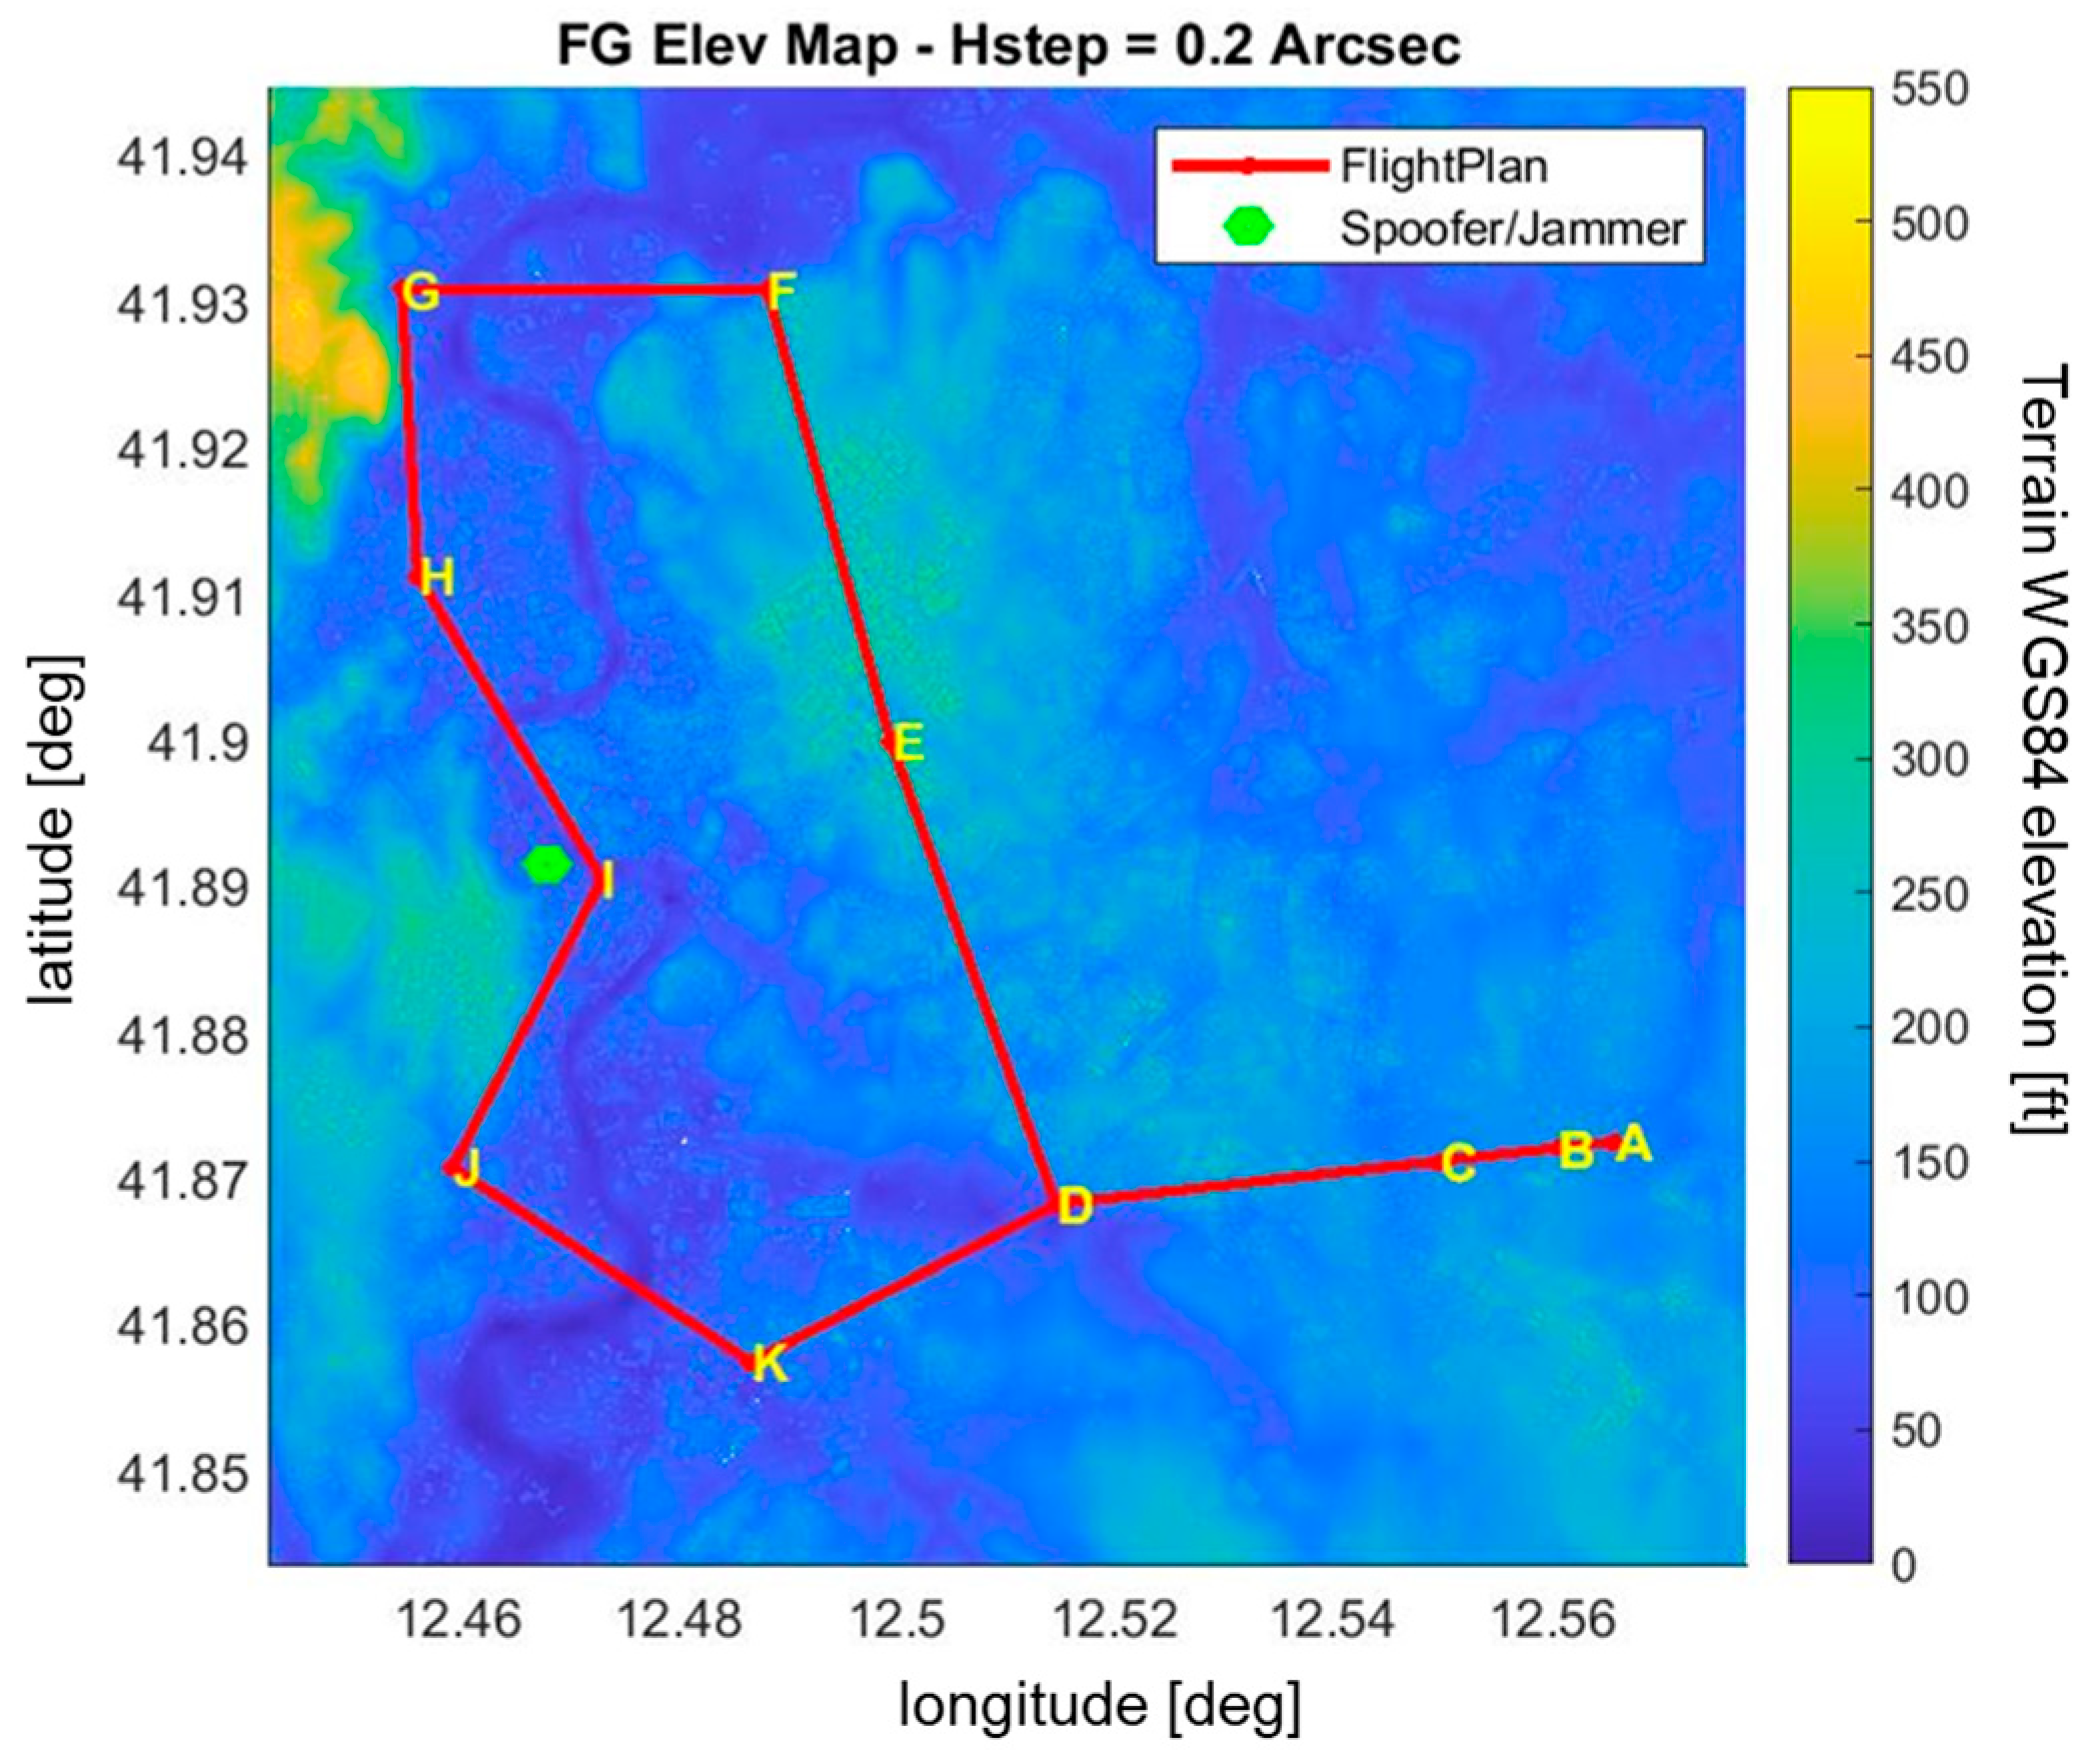
The simulated scenario consists of a photogrammetry mission over the urban area of Rome, carried out through a fully autonomous drone flight (see
Figure 15). After take-off, the drone climbs at a rate of 350 ft/min to a QFE-based altitude of 160 ft (i.e., barometric height relative to the airfield elevation). At waypoint C, it enters level flight, maintaining a ground speed of 65 knots along the predefined flight plan.
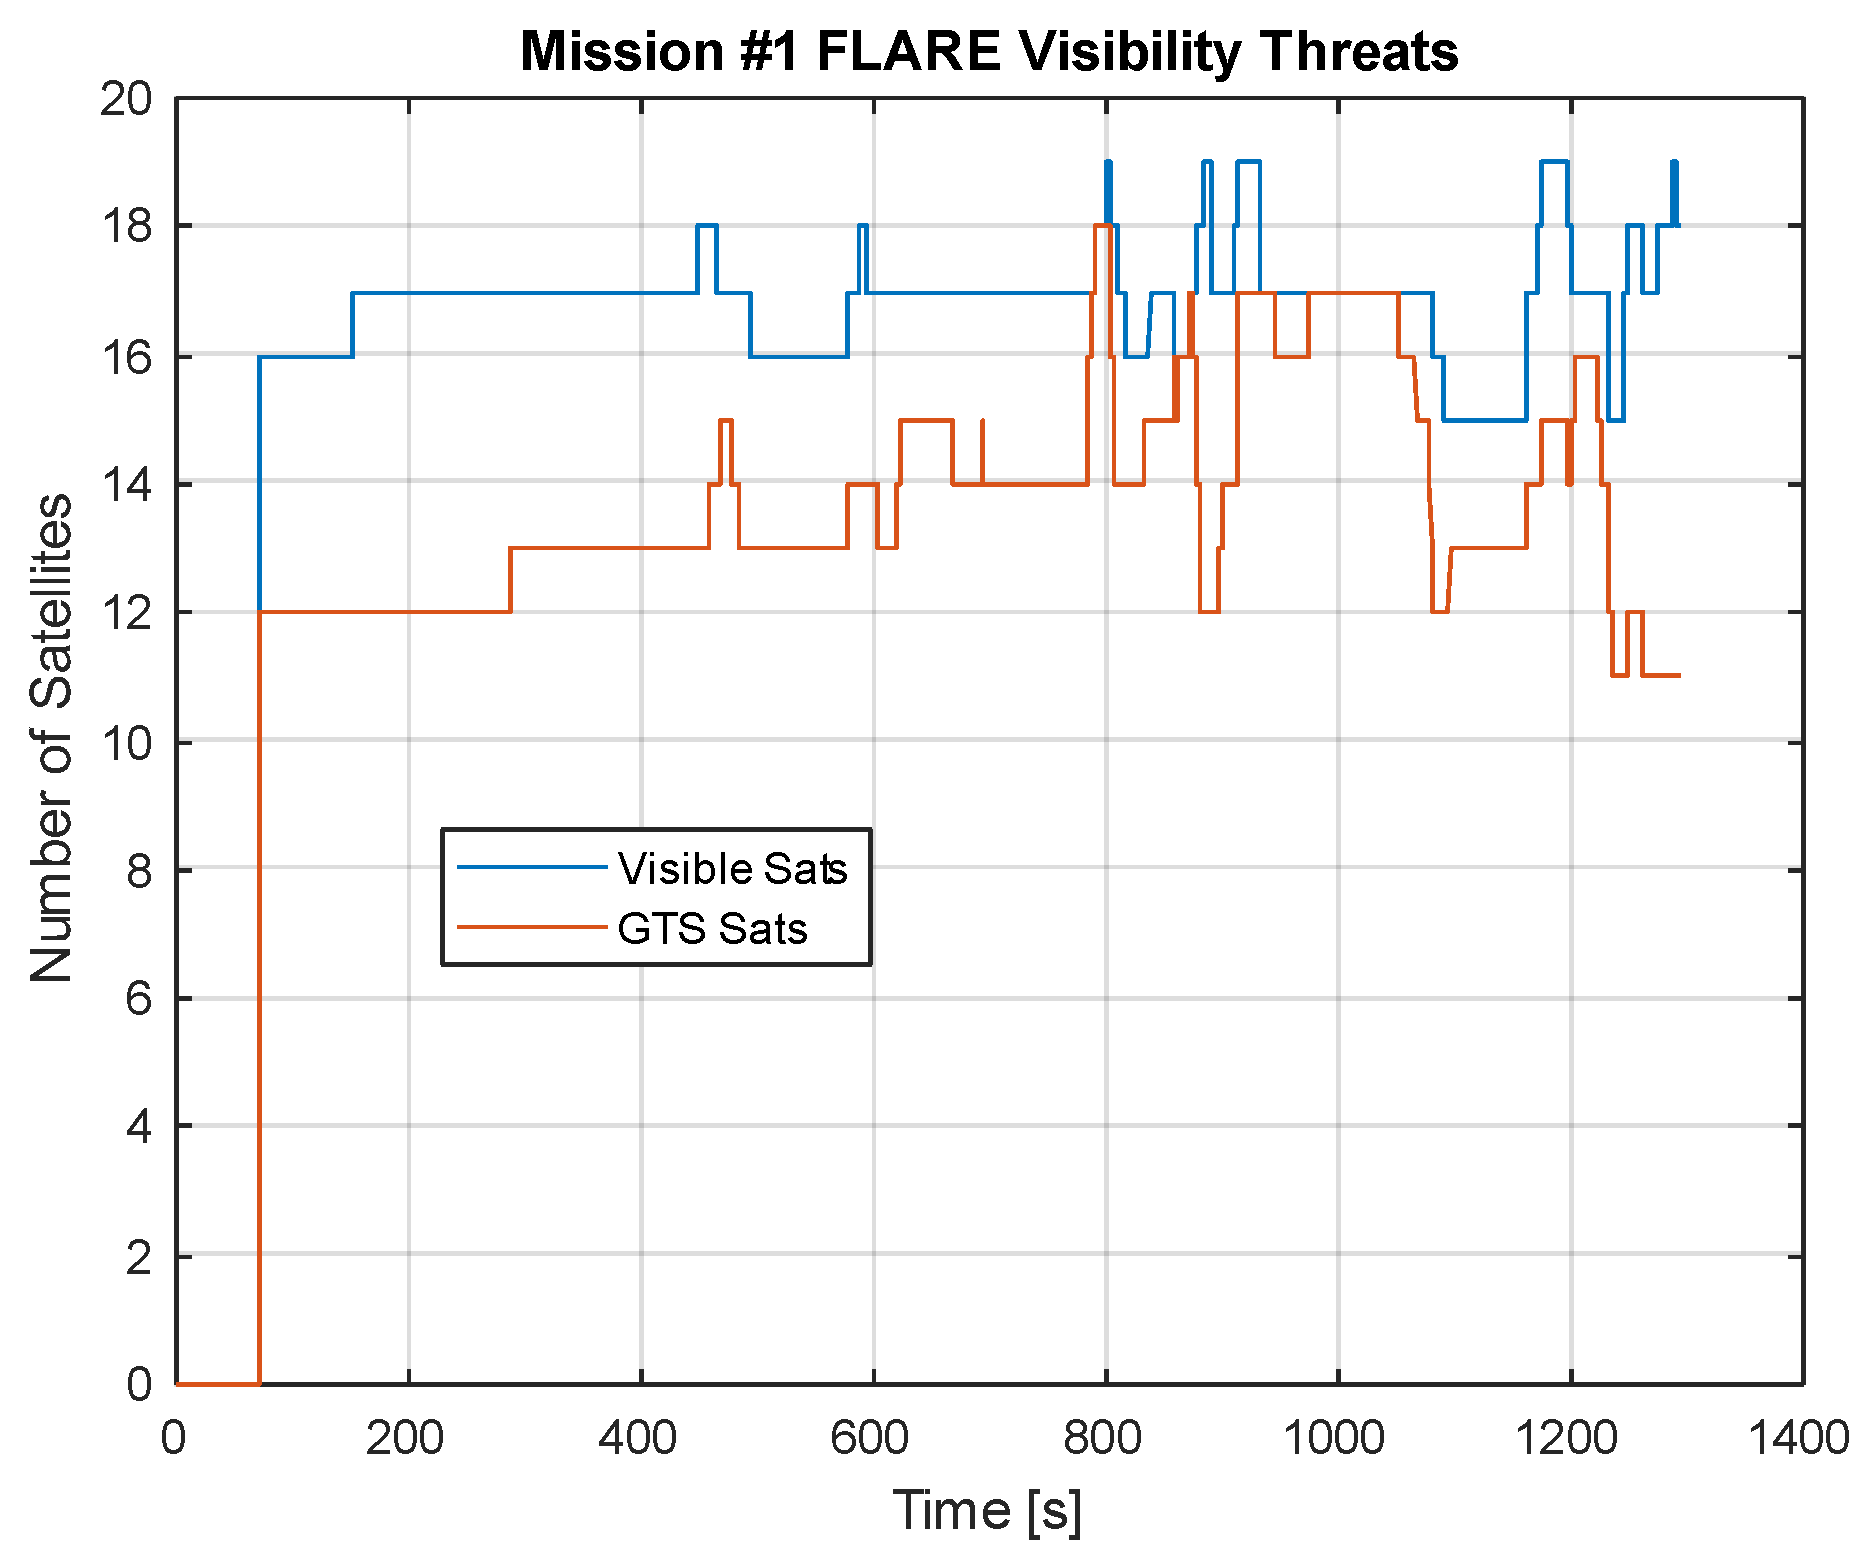
Figure 16 shows the number of visible satellites as a result of the ephemeris generated by the GNSS constellation (in this case, only for GPS and GAL) and the (reduced) number of satellites available for HNU after GTS applied the terrain and obstacle visibility threats.
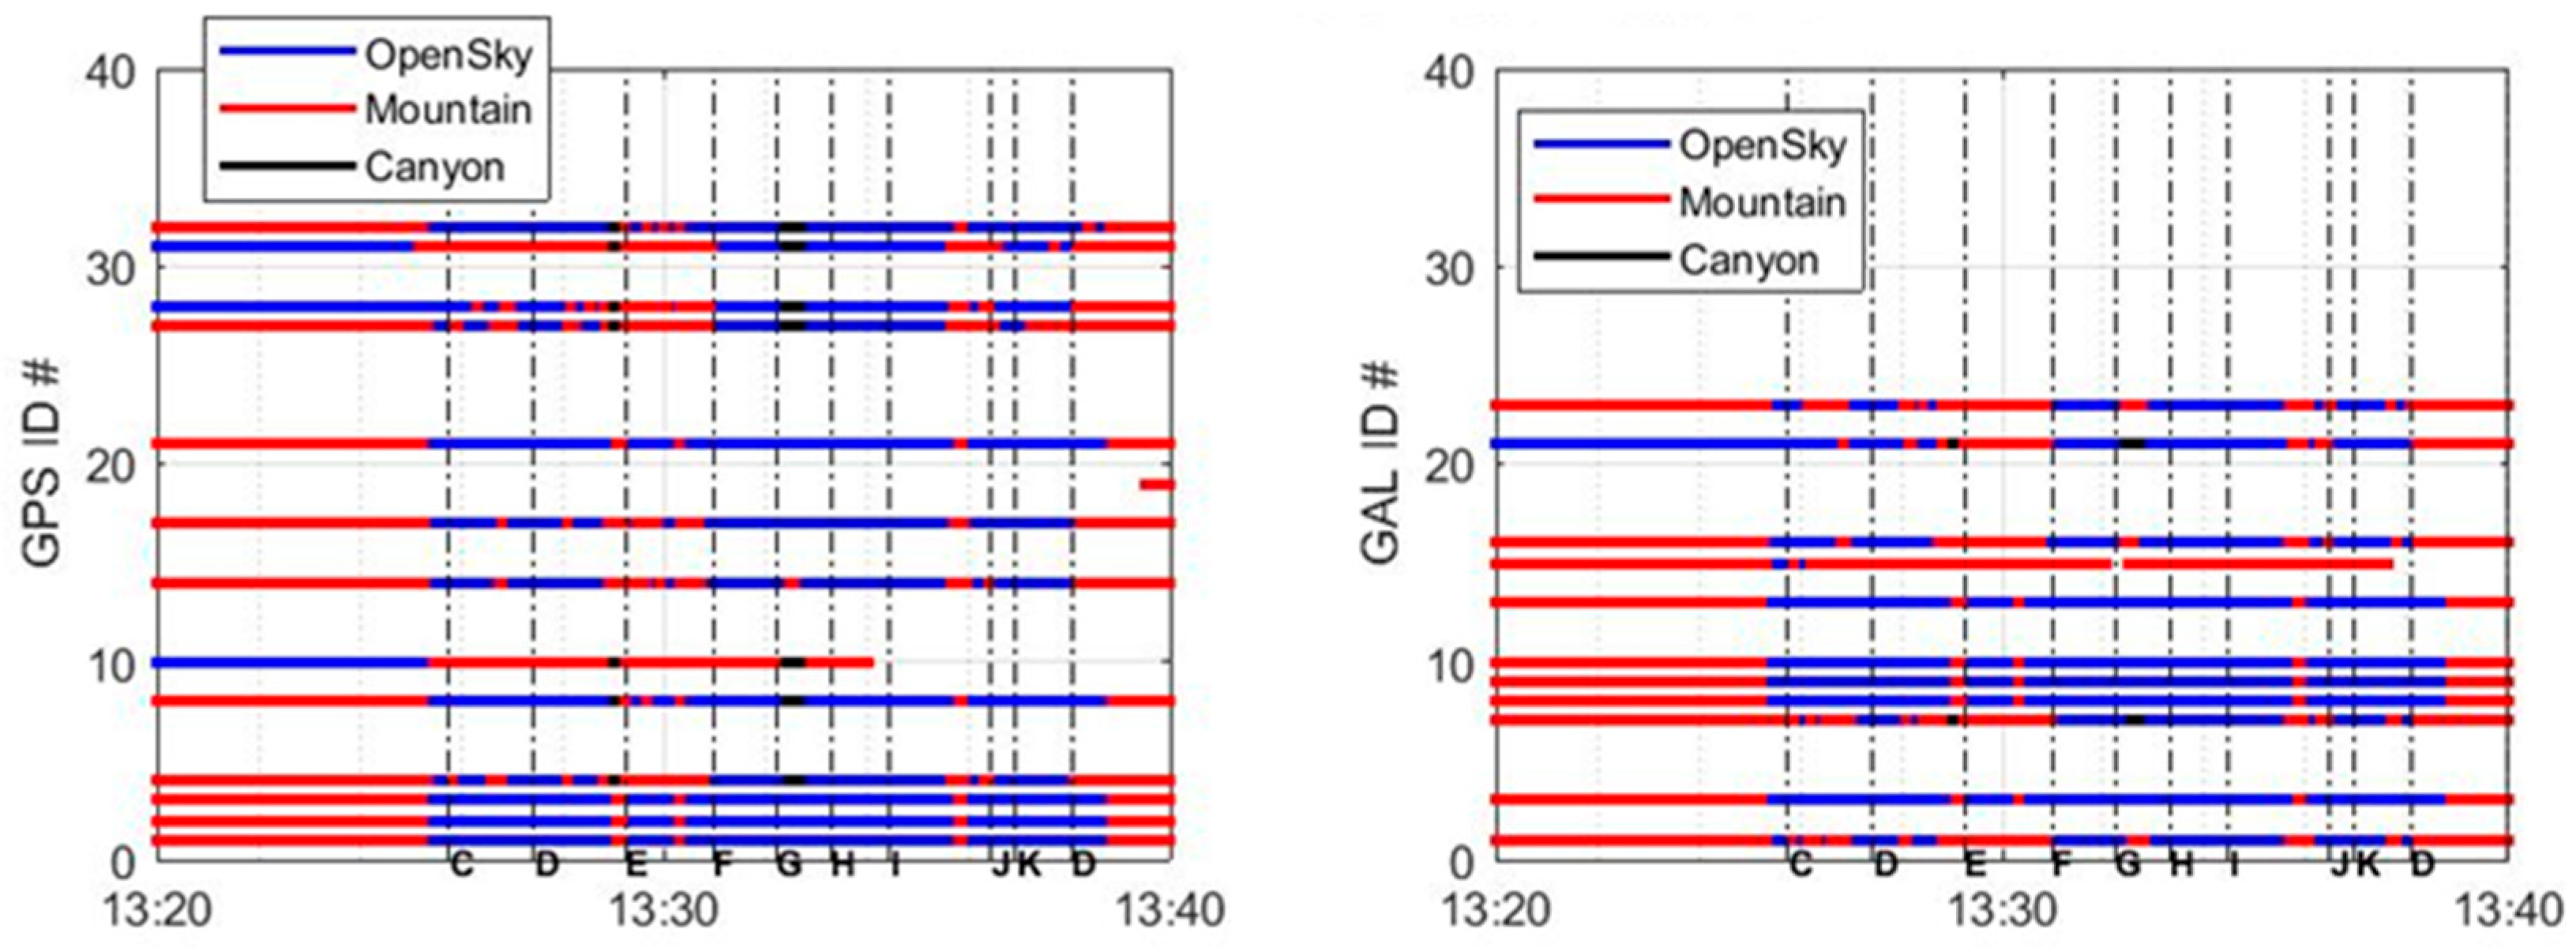
Figure 17 shows the multipath scenario associated with the simulated flight, demonstrating the capability of the GTS to inject visibility threats in the HNU in real time.
From the figures above, it can be observed that, apart from the initial phase when the vehicle is on the ground (up to approximately 13:25 GPS time), most visibility and multipath issues occur between waypoints E and H, as the vehicle passes in close proximity to a hill.
The same test was repeated setting the GTS to simulate a static spoofing attack carried out from the roof of a building located near waypoint I (see
Figure 15). The spoofer was activated when the vehicle approached the spoofing location, approximately 4.5 km away. In this scenario, the GTS injected a meaconing attack with a spoofing-to-signal power ratio of about 45 dB, occurring between 980 and 1150 s from the start of the simulation. The spoofed position was fixed in close proximity to the aircraft’s actual position at the time of the spoofing onset.
Figure 18 shows the output of the GTS on the GPS satellite ID#1 in terms of (from the top to bottom) L1 SNR comparison with GNSS output, L5 SNR comparison with GNSS output, difference between the un-spoofed GNSS and spoofed GTS pseudorange, and difference between the un-spoofed GNSS and spoofed GTS delta range.
From the above figure, the spoofing attack is evident, whereas the SNR on L1/L5 first drops (the spoofer is disturbing the HNU GNSS RF receiver) and then rises up when the HNU GNSS receiver locks on the spoofer, as shown by the difference between the un-spoofed and spoofed pseudoranges and the outliers on the delta ranges. It is worth noting that the difference between the spoofed and un-spoofed pseudorange is due to the clock shift related to the delay of the re-transmission process and to the different receiver positions when the spoofer is activated, which is indeed a few tens of meters.
6. Discussion
The presented results confirm the GTS as a powerful and flexible tool for simulating and injecting a wide range of GNSS threats under urban operational conditions, with a focus on UAM. By analyzing both visibility reduction and spoofing scenarios, the GTS demonstrates its effectiveness in reproducing realistic interference patterns, thus enabling robust performance testing of navigation algorithms and avionics systems. In this regard, the GTS could also support the validation of data-driven spoofing detection methods recently proposed in the literature, such as deep learning-based classifiers [
42].
Compared to traditional RF-based simulators, especially those relying on ray-tracing techniques, the GTS offers substantial advantages in terms of computational efficiency and cost-effectiveness. Ray-tracing-based RF simulators typically require significant computational resources due to their detailed electromagnetic modeling and involve expensive hardware for RF signal generation and capture. In contrast, the GTS operates entirely at the GNSS observables level (pseudorange, delta range), enabling faster simulation cycles and seamless integration with software-based GNSS processing chains, without the need for physical RF front ends.
Beyond supporting technical validation, the GTS can provide valuable theoretical insights for regulatory development and standardization in the UAM domain. For instance, it may support stakeholders in defining essential performance metrics such as alert limits, integrity risk, and time-to-alert. Moreover, by enabling the simulation of advanced threat scenarios in realistic urban environments, the GTS can aid in the evaluation of integrity monitoring strategies such as RAIM, ARAIM, and DFMC-based FDE. Recent works have also highlighted the role of machine learning-based approaches for environment-aware GNSS integrity monitoring in UAM scenarios [
43], which could be further explored using the GTS framework.
The GTS’s ability to model diverse threats and simulate them both in fast-time and real-time makes it particularly suitable for iterative testing, early algorithm design, and hardware-in-the-loop validation. Thanks to its modular architecture and use of open-source tools like Flight Gear and Open Street Map, the GTS remains both highly customizable and accessible for academic and industrial users alike.
These features establish the GTS not only as a practical testbed for validating GNSS resilience in urban drone operations but also as a potential enabler for drafting the Minimum Operational Performance Standards for UAM GNSS receivers, standards which are currently not yet defined.
Nevertheless, some limitations of the GTS should be acknowledged. While the system effectively simulates GNSS threats at the observables level, full integration into a certified avionics validation chain still requires extensive hardware-in-the-loop (HIL) testing under controlled laboratory conditions. These tests are essential to assessing the impact of simulated threats on real GNSS receivers and navigation systems, considering hardware-specific effects such as RF front-end distortions, signal tracking dynamics, and time-synchronization delays.
7. Conclusions
This paper presented the design, implementation, and validation of a GNSS threat simulator aimed at enhancing the safety and robustness evaluation of GNSS-based navigation solutions in UAM contexts. The GTS is capable of reproducing a wide range of environmental and cyber threats, such as satellite visibility obstructions, multipath, electromagnetic interference, spoofing, and jamming, that typically affect GNSS signal integrity in urban and suburban environments. The simulator was integrated within both fast-time and real-time testing frameworks and applied to validate a hybrid navigation unit designed for autonomous drone operations.
Results from fast-time simulations highlighted the importance of using high-resolution elevation data, such as those derived from Flight Gear and OpenStreetMap, for accurately modeling urban morphology and predicting GNSS visibility and multipath effects. Simulations with lower-resolution data (e.g., DTED Level 1) exhibited significant inaccuracies, underscoring the critical role of detailed 3D models for realistic threat injection. Moreover, the impact of environmental transitions on GNSS observables, such as pseudorange and signal-to-noise ratio, was clearly demonstrated.
Real-time hardware-in-the-loop simulations further validated the GTS’s effectiveness in dynamically degrading GNSS signals during actual flight missions. The simulator successfully introduced complex urban threats in real-time, including a spoofing attack scenario, where the GNSS receiver behavior clearly reflected spoofing effects on both SNR and pseudorange measurements. These results confirm the GTS as a reliable and versatile tool for stress-testing navigation systems in realistic urban scenarios. Future work will include additional hardware-in-the-loop testing campaigns, with the objective of fully assessing the GTS for supporting the in-flight validation of navigation algorithms at higher operational altitudes. In this context, the GTS will be employed to replicate urban and suburban environmental effects on GNSS observables, enabling a safe and realistic assessment of navigation system performance during flight operations. Furthermore, the GTS will be extended with advanced models for emulating smart spoofing scenarios, including control laws based on the real trajectory of the GNSS receiver; the physical layer for both jamming and spoofing attacks.
Author Contributions
Conceptualization, all authors; methodology, all authors; validation, G.C. (Gianluca Corraro) and G.C. (Giovanni Cuciniello); writing—original draft preparation, G.C. (Gianluca Corraro) and D.P.; writing—review and editing, G.C. (Giovanni Cuciniello), U.C. and I.I. All authors have read and agreed to the published version of the manuscript.
Funding
This research was supported by the European Space Research and Technology Centre (ESTEC)/European Space Agency (ESA) under contract NAVISP-EL3-018 (itAlian Urban aiR mObility technologies & distrRibuted test-fAcility, AURORA).
Data Availability Statement
The data presented in this study are available on request from the corresponding author. The data are not publicly available due to funding contract restrictions.
Acknowledgments
The authors would like to thank Federico Corraro from Honeywell for his valuable contribution to the conceptualization of the GNSS Threat Simulator, and Luca Garbarino from CIRA for his support in setting up the hardware-in-the-loop simulation environment.
Conflicts of Interest
The authors declare no conflicts of interest.
Acronyms
| A-RAIM | Advanced Receiver Autonomous Integrity Monitoring |
| DB | Database |
| DFMC | Dual-Frequency Multi-Constellation |
| DoF | Degree of Freedom |
| DR | Delta range |
| DTED | Digital Terrain Elevation Data |
| ECEF | Earth-centered Earth-fixed |
| EM | Electromagnetic |
| EOP | Earth Orientation Parameters |
| FMS | Flight Management System |
| GAL | Galileo |
| GNSS | Global Satellite Navigation Systems |
| GPS | Global Positioning System |
| GTS | GNSS Threat Simulator |
| HMU | Hybrid Navigation Unit |
| INS | Inertial Navigation System |
| LOS | Line-of-Sight |
| NED | North-East-Down |
| NLOS | Non-Line-of-Sigh |
| PR | Pseudorange |
| PRN | Pseudorandom Noise |
| PNT | Positioning, Navigation, and Timing |
| RF | Radio Frequency |
| RFI | Radio Frequency Interference |
| SBAS | Satellite Based Augmentation System |
| SDR | Software Defined Radio |
| SINR | Signal-to-Interference-plus-Noise Ratio |
| SNR | Signal-to-Noise Ratio |
| UAM | Urban Air Mobility |
| UAV | Unmanned Aerial Vehicle |
References
- Bijjahalli, S.; Sabatini, R.; Gardi, A. GNSS Performance Modelling and Augmentation for Urban Air Mobility. Sensors 2019, 19, 4209. [Google Scholar] [CrossRef] [PubMed]
- Groves, P.D. Principles of GNSS, Inertial, and Multisensor Integrated Navigation Systems; Artech House: Norwood, MA, USA, 2013. [Google Scholar]
- Psiaki, M.L.; Humphreys, T.E. GNSS Spoofing and Detection. Proc. IEEE 2016, 104, 1258–1270. [Google Scholar] [CrossRef]
- Zhao, X.; Zhang, Y.; Wang, J.; Li, M.; Liu, H. Experimental Analysis of Multipath Effects on GNSS Positioning in Urban Canyon. In Proceedings of the 2021 IEEE 4th International Conference on Electronic Information and Communication Technology (ICEICT), Xi’an, China, 18–20 August 2021; pp. 557–562. [Google Scholar] [CrossRef]
- Novák, A.; Kováčiková, K.; Kandera, B.; Sedláčková, A.N. Global Navigation Satellite Systems Signal Vulnerabilities in Unmanned Aerial Vehicle Operations: Impact of Affordable Software-Defined Radio. Drones 2024, 8, 109. [Google Scholar] [CrossRef]
- Radoš, K.; Brkić, M.; Begušić, D. Recent Advances on Jamming and Spoofing Detection in GNSS. Sensors 2024, 24, 4210. [Google Scholar] [CrossRef] [PubMed]
- Alhoraibi, L.; Alghazzawi, D.; Alhebshi, R. Detection of GPS Spoofing Attacks in UAVs Based on Adversarial Machine Learning Model. Sensors 2024, 24, 6156. [Google Scholar] [CrossRef] [PubMed]
- RTCA. Minimum Operational Performance Standards for Airborne Supplemental Navigation Equipment Using Global Positioning System (GPS); RTCA DO-208; RTCA: Washington, DC, USA, 1991. [Google Scholar]
- Brown, R.G. A Baseline GPS RAIM Scheme and a Note on the Equivalence of Three RAIM Methods. Navig. J. Inst. Navigation 1992, 39, 301–316. [Google Scholar] [CrossRef]
- Blanch, J.; Walter, T.; Enge, P.; Lee, Y.; Pervan, B.; Rippl, M.; Spletter, A. Advanced RAIM User Algorithm Description: Integrity Support Message Processing, Fault Detection, Exclusion, and Protection Level Calculation. In Proceedings of the 25th International Technical Meeting of the Satellite Division of the Institute of Navigation (ION GNSS 2012), Nashville, TN, USA, 17–21 September 2012. [Google Scholar]
- ICAO. Concept of Operations (CONOPS) for Dual-Frequency Multi-Constellation (DFMC) Global Navigation Satellite System (GNSS); International Civil Aviation Organization: Montreal, QC, Canada, 2022. [Google Scholar]
- Wang, B.; Zhao, W.J.; Liu, E.X.; Gao, R.X.K.; Zhang, W.; Png, C.E. Satellite Visibility and Geometry Analysis for GNSS Positioning in an Urban Environment. In Proceedings of the 2019 8th Asia-Pacific Conference on Antennas and Propagation (APCAP), Incheon, Republic of Korea, 4–7 August 2019. [Google Scholar]
- Yahya, M.H. Analysis of GPS Visibility and Satellite-Receiver Geometry over Different Latitudinal Regions. In Proceedings of the International Symposium on Geoinformation (ISG 2008), Kuala Lumpur, Malaysia, 13–15 October 2008. [Google Scholar]
- Chen, A.; Chabory, A.; Escher, A.-C.; Macabiau, C. Development of a GPS Deterministic Multipath Simulator for an Efficient Computation of the Positioning Errors. In Proceedings of the ION GNSS 2009, 22nd International Technical Meeting of the Satellite Division of the Institute of Navigation, Savannah, GA, USA, 22–25 September 2009. [Google Scholar]
- Ercek, R.; de Doncker, P.; Grenez, F. Study of Pseudo-Range Error Due to Non-Line-of-Sight Multipath in Urban Canyons. In Proceedings of the 18th International Technical Meeting of the Satellite Division of the Institute of Navigation (ION GNSS 2005), Long Beach, CA, USA, 13–16 September 2005. [Google Scholar]
- Wang, Y.; Chen, X.; Liu, P. Statistical Multipath Model Based on Experimental GNSS Data in Static Urban Canyon Environment. Sensors 2018, 18, 1149. [Google Scholar] [CrossRef] [PubMed]
- Steingass, A.; Lehner, A.; Pérez-Fontán, F.; Kubista, E.; Arbesser-Rastburg, B. Characterization of the Aeronautical Satellite Navigation Channel through High-Resolution Measurement and Physical Optics Simulation. Int. J. Satell. Commun. Netw. 2007, 26, 1–18. [Google Scholar] [CrossRef]
- Lehner, A.; Steingaß, A. On Land Mobile Satellite Navigation Performance Degraded by Multipath Reception. In Proceedings of the 2007 European Navigation Conference (ENC-GNSS), Geneva, Switzerland, 29 May–1 June 2007. [Google Scholar]
- Steingaß, A.; Lehner, A. Land Mobile Satellite Navigation—Characteristics of the Multipath Channel. In Proceedings of the 16th International Technical Meeting of the Satellite Division of the Institute of Navigation (ION GNSS 2003), Portland, OR, USA, 9–12 September 2003. [Google Scholar]
- Ait-Ighil, M.; Lemorton, J.; Perez-Fontan, F.; Lacoste, F.; Artaud, G.; Bourga, C.; Michel, B. Simplifying the Propagation Environment Representation for LMS Channel Modelling. EURASIP J. Wirel. Commun. Netw. 2012, 2012, 110. [Google Scholar] [CrossRef][Green Version]
- Betz, J.W. Effect of Narrowband Interference on GPS Code Tracking Accuracy. In Proceedings of the 2000 National Technical Meeting of the Institute of Navigation, Anaheim, CA, USA, 26–28 January 2000. [Google Scholar]
- Titus, B.M.; Betz, J.; Hegarty, C.; Owen, R. Intersystem and Intrasystem Interference Analysis Methodology. In Proceedings of the ION GPS/GNSS 2003, Portland, OR, USA, 9–12 September 2003. [Google Scholar]
- Liu, W.; Zhan, X.; Liu, L.; Niu, M. GNSS RF Compatibility Assessment: Interference Among GPS, Galileo, and Compass. GPS World 2010, 21, 34–40. [Google Scholar][Green Version]
- Hegarty, C.J.; Bobyn, D.; Grabowski, J.; Van Dierendonck, A.J. An Overview of the Effects of Out-of-Band Interference on GNSS Receivers. In Proceedings of the 24th International Technical Meeting of the Satellite Division of the Institute of Navigation (ION GNSS 2011), Portland, OR, USA, 20–23 September 2011. [Google Scholar]
- Borio, D.; O’Driscoll, C.; Fortuny, J. GNSS Jammers: Effects and Countermeasures. In Proceedings of the 2012 6th ESA Workshop on Satellite Navigation Technologies (Navitec 2012) & European Workshop on GNSS Signals and Signal Processing, Noordwijk, The Netherlands, 5–7 December 2012. [Google Scholar]
- Mitch, R.H.; Psiaki, M.L.; O’Hanlon, B.W.; Powell, S.P.; Bhatti, J.A. Civilian GPS Jammer Signal Tracking and Geolocation. In Proceedings of the 25th International Technical Meeting of The Satellite Division of the Institute of Navigation (ION GNSS 2012), Nashville, TN, USA, 17–21 September 2012. [Google Scholar]
- Borio, D.; O’Driscoll, C.; Fortuny, J. Jammer Impact on Galileo and GPS Receivers. In Proceedings of the 2013 International Conference on Localization and GNSS (ICL-GNSS), Turin, Italy, 25–27 June 2013. [Google Scholar]
- Iudice, I.; Pascarella, D.; Corraro, G.; Cuciniello, G. A Real/Fast-Time Simulator for Impact Assessment of Spoofing & Jamming Attacks on GNSS Receivers. In Proceedings of the 2024 11th International Workshop on Metrology for AeroSpace (MetroAeroSpace), Lublin, Poland, 24–26 June 2024; pp. 309–314. [Google Scholar] [CrossRef]
- Wang, W.; Wang, J. GNSS Induced Spoofing Simulation Based on Path Planning. IET Radar Sonar Navig. 2022, 16, 29–39. [Google Scholar] [CrossRef]
- Borio, D.; Gioia, C. A Dual-Antenna Spoofing Detection System Using GNSS Commercial Receivers. In Proceedings of the 28th International Technical Meeting of the Satellite Division of the Institute of Navigation (ION GNSS+ 2015), Tampa, FL, USA, 14–18 September 2015. [Google Scholar]
- Liu, Y.; Li, S.; Fu, Q.; Liu, Z. Impact Assessment of GNSS Spoofing Attacks on INS/GNSS Integrated Navigation System. Sensors 2018, 18, 1433. [Google Scholar] [CrossRef] [PubMed]
- RTCA. Minimum Operational Performance Standards for GNSS Aided Inertial Systems; DO-384; RTCA: Washington, DC, USA, 2020. [Google Scholar]
- RTCA. Minimum Operational Performance Standards for Global Positioning System/Wide Area Augmentation System Airborne Equipment; DO-229 Rev. F; RTCA: Washington, DC, USA, 2020. [Google Scholar]
- Bhatti, U.; Ochieng, W.; Feng, S. Integrity of an Integrated GPS/INS System in the Presence of Slowly Growing Errors. Part I: A Critical Review. GPS Solut. 2007, 11, 173–181. [Google Scholar] [CrossRef]
- Milner, C.D.; Ochieng, W.Y. Failure Modes and Effects Analysis (FMEA) of GNSS Aviation Applications. In Proceedings of the NAV08/ILA37 Conference and Exhibitions, Meeting #8, London, UK, 28–30 October 2008; Imperial College London, Centre for Transport Studies, Department of Civil and Environmental Engineering: London, UK, 2008. [Google Scholar]
- Corraro, F.; Cuciniello, G.; Iudice, I.; Ferraro, D.; Negro, G. Development and Experimental Validation of a GNSS Receiver Simulator for Flight Missions in Hostile Environments. In Proceedings of the 35th International Technical Meeting of the Satellite Division of the Institute of Navigation (ION GNSS+ 2022), Denver, CO, USA, 19–23 September 2022; pp. 2163–2177. [Google Scholar] [CrossRef]
- Zhu, N. GNSS Propagation Channel Modelling in Constrained Environments: Contribution to the Improvement of the Geolocation Service Quality. Ph.D. Thesis, Université de Lille, Lille, France, 2018. [Google Scholar]
- EUROCAE. Minimum Operational Performance Standard for Galileo/Global Positioning System/Satellite-Based Augmentation System Airborne Equipment; ED-259, Draft Version; EUROCAE: Paris, France, 2020. [Google Scholar]
- Fortin, M.; Landry, R., Jr. Implementation Strategies for a Universal Acquisition and Tracking Channel Applied to Real GNSS Signals. Sensors 2016, 16, 624. [Google Scholar] [CrossRef] [PubMed]
- Corraro, G.; Cuciniello, G.; Garbarino, L.; Ciniglio, U.; Corraro, F.; Flora, A.; Senatore, R.; Pizzarulli, A. Robust Hybrid Navigation Unit for Urban Air Mobility Scenarios. In Proceedings of the 2024 AIAA DATC/IEEE 43rd Digital Avionics Systems Conference (DASC), San Diego, CA, USA, 3 October 2024; pp. 1–7. [Google Scholar] [CrossRef]
- Corraro, G.; Corraro, F.; Flora, A.; Cuciniello, G.; Garbarino, L.; Senatore, R. Dual-Frequency Multi-Constellation Global Navigation Satellite System/Inertial Measurements Unit Tight Hybridization for Urban Air Mobility Applications. Aerospace 2024, 11, 955. [Google Scholar] [CrossRef]
- Borhani-Darian, P.; Li, H.; Wu, P.; Wang, Y.; Tsourdos, A. Detecting GNSS Spoofing Using Deep Learning. EURASIP J. Adv. Signal Process. 2024, 14, 14. [Google Scholar] [CrossRef]
- Isik, O.K.; Petrunin, I.; Tsourdos, A. Machine Learning-Based Environment-Aware GNSS Integrity Monitoring for Urban Air Mobility. Drones 2024, 8, 690. [Google Scholar] [CrossRef]
Figure 1.
GNSS Threat Simulator functional context with input/output and configuration parameters depicted in red and black, respectively.
Figure 1.
GNSS Threat Simulator functional context with input/output and configuration parameters depicted in red and black, respectively.
Figure 2.
GTS high-level architecture. Input/output data of the simulator are highlighted in red, configuration parameters in black, and internal data exchanged between the internal models are shown in blue.
Figure 2.
GTS high-level architecture. Input/output data of the simulator are highlighted in red, configuration parameters in black, and internal data exchanged between the internal models are shown in blue.
Figure 3.
Canyon Scenario: checkpoints surrounding the user are assessed by height; those exceeding the user height are classified as reflective obstacles and considered potential sources of signal replicas from satellites in the opposite azimuth semicircle.
Figure 3.
Canyon Scenario: checkpoints surrounding the user are assessed by height; those exceeding the user height are classified as reflective obstacles and considered potential sources of signal replicas from satellites in the opposite azimuth semicircle.
Figure 4.
Schematic view of long-range multipath computation in both single- and dual-frequency mode.
Figure 4.
Schematic view of long-range multipath computation in both single- and dual-frequency mode.
Figure 5.
Schematic view of SNR computation.
Figure 5.
Schematic view of SNR computation.
Figure 6.
Urban testing area centered on downtown Rome, extracted from Google Earth.
Figure 6.
Urban testing area centered on downtown Rome, extracted from Google Earth.
Figure 7.
Comparison of elevation maps of the whole testing area derived from DTED Level 1, DSM Level 2, and Flight Gear/Open Street Map data sources.
Figure 7.
Comparison of elevation maps of the whole testing area derived from DTED Level 1, DSM Level 2, and Flight Gear/Open Street Map data sources.
Figure 8.
Elevation maps of the “Palazzaccio” area from DTED Level 1, DSM Level 2, and Flight Gear/Open Street Map. The comparison illustrates differences in vertical resolution and urban detail representation.
Figure 8.
Elevation maps of the “Palazzaccio” area from DTED Level 1, DSM Level 2, and Flight Gear/Open Street Map. The comparison illustrates differences in vertical resolution and urban detail representation.
Figure 9.
Elevation maps of the “Lungo Tevere” area from DTED Level 1, DSM Level 2, and Flight Gear/Open Street Map. The comparison illustrates differences in vertical resolution and urban detail representation.
Figure 9.
Elevation maps of the “Lungo Tevere” area from DTED Level 1, DSM Level 2, and Flight Gear/Open Street Map. The comparison illustrates differences in vertical resolution and urban detail representation.
Figure 10.
Low speed (25 kts), low altitude (125 m MSL) testing trajectory, depicted in red, over the urban testing area defined to evaluate the impact of different elevation data sources on satellite visibility outcomes.
Figure 10.
Low speed (25 kts), low altitude (125 m MSL) testing trajectory, depicted in red, over the urban testing area defined to evaluate the impact of different elevation data sources on satellite visibility outcomes.
Figure 11.
Mountain scenario for satellite #8 along a low-altitude testing trajectory. In both figures, the results reported are in green for DTED Level 1, in blue for DSM Level 2 and in red for Flight Gear combined with OpenStreetMap data.
Figure 11.
Mountain scenario for satellite #8 along a low-altitude testing trajectory. In both figures, the results reported are in green for DTED Level 1, in blue for DSM Level 2 and in red for Flight Gear combined with OpenStreetMap data.
Figure 12.
Output of long-range multipath module for the PRN#12 Galileo satellite. The transition from open-sky to mountain scenario causes a marked increase in pseudorange error, which decreases when returning to open-sky conditions.
Figure 12.
Output of long-range multipath module for the PRN#12 Galileo satellite. The transition from open-sky to mountain scenario causes a marked increase in pseudorange error, which decreases when returning to open-sky conditions.
Figure 13.
Output of short-range multipath module for the PRN#12 Galileo satellite. The transition from open-sky to mountain scenario causes a change in the SNR, which decreases when returning to open-sky conditions.
Figure 13.
Output of short-range multipath module for the PRN#12 Galileo satellite. The transition from open-sky to mountain scenario causes a change in the SNR, which decreases when returning to open-sky conditions.
Figure 14.
Laboratory test rig for HIL real-time simulation of the GTS. The setup includes a GNSS functional simulator and a 6-DOF drone model. The GTS modifies GNSS observables to emulate urban effects and feeds them to a Hybrid Navigation Unit (HNU) running on a PC-104 platform.
Figure 14.
Laboratory test rig for HIL real-time simulation of the GTS. The setup includes a GNSS functional simulator and a 6-DOF drone model. The GTS modifies GNSS observables to emulate urban effects and feeds them to a Hybrid Navigation Unit (HNU) running on a PC-104 platform.
Figure 15.
Terrain elevation along the drone flight plan (in red) in Rome operational area. The spoofer/jammer position is highlighted in green, and the waypoints of the trajectory are highlighted in yellow.
Figure 15.
Terrain elevation along the drone flight plan (in red) in Rome operational area. The spoofer/jammer position is highlighted in green, and the waypoints of the trajectory are highlighted in yellow.
Figure 16.
Number of visible satellites (open sky) and GTS selection after applying terrain and obstacle visibility threats.
Figure 16.
Number of visible satellites (open sky) and GTS selection after applying terrain and obstacle visibility threats.
Figure 17.
Satellite IDs and related multipath scenario as computed by GTS, with waypoints of the trajectory in
Figure 15 shown alongside time.
Figure 17.
Satellite IDs and related multipath scenario as computed by GTS, with waypoints of the trajectory in
Figure 15 shown alongside time.
Figure 18.
Comparison between the GNSS output (in blue) and the GTS output (in red) during the GTS spoofing on the GPS Satellite ID#1 in the time interval 980 s–1150 s. The spoofing attack near waypoint I (~980 s) is evidenced by the initial SNR drop, followed by a rise when the HNU locks onto the spoofed signal.
Table 1.
Probability of failure types for GPS.
Table 1.
Probability of failure types for GPS.
| Fault Modes and Assigned Test Range for Position Bounding | Assigned Fault Rates as a Fraction of
10−5/Hour/Satellite |
|---|
| Ramp 0.03–1.00 m/s | 10/15 |
| Step 300–700 m | 3/15 |
| Acc. 0.00005–0.025 m/s2 | 2/15 |
Table 2.
Scenario determination.
Table 2.
Scenario determination.
| Scenario Assessment for the i-th Satellite | Check for All Checkpoints |
|---|
| NLOS | At least one surface elevation intersection occurs (ΔHmin < 0) |
| Mountains | (ΔHmin < ΔHMount_thd) |
| Canyon | For each checkpoint j belonging to a circle around the user position (currently at Rdeg = 35/10,000 deg distance in terms of latitude and longitude from the user):- •
Obstacle is identified if
HDTEDj − Huser > ΔHCanyon_thd- •
For each identified obstacle i, a satellite is in the Canyon Scenario if
(Elavationi < CanyonElevthd) and not (−90 + k180 < (Azimuthj − Azimuthi) < −90 + k180)
where CanyonElevthd is 40 degrees. |
| Open Sky | None of the above scenarios |
Table 3.
Multipath error model and parameters for different scenarios.
Table 3.
Multipath error model and parameters for different scenarios.
| Scenario | Model | Parameters |
|---|
| Canyon | |
: 29.075
: Elevation [deg] |
| Mountain | |
: Elevation [deg] |
| Open Sky |
: Elevation [deg] |
Table 4.
Short-range multipath algorithm parameters.
Table 4.
Short-range multipath algorithm parameters.
| Scenario | Elevation [deg] | Shadowing
Probability
| Rice Factor
[dB]
| Shadow Component
[dB] |
|---|
| |
|---|
| Open Sky | 15 | 0 | 6 | N/A |
| 25 | 0 | 10.3 |
| 35 | 0 | 12 |
| 45 | 0 | 10.4 |
| 55 | 0 | 9 |
| Mountains | 15 | 0.77 | 4.7 | −12.6 | 4.8 |
| 25 | 0.59 | 4.7 | −6 | 3.5 |
| 35 | 0.54 | 10.7 | −7.6 | 3.2 |
| 45 | 0.43 | 4 | −7.2 | 3.2 |
| 55 | 0.35 | 11.8 | −7.7 | 2.6 |
| Canyon | 15 | 0.97 | 9 | −15.2 | 5.2 |
| 25 | 0.79 | 3.2 | −12.1 | 6.3 |
| 35 | 0.60 | 4.8 | −4.4 | 5.1 |
| 45 | 0.56 | 8.5 | −3 | 2.7 |
| 55 | 0.30 | 6 | −3 | 2.7 |
| Disclaimer/Publisher’s Note: The statements, opinions and data contained in all publications are solely those of the individual author(s) and contributor(s) and not of MDPI and/or the editor(s). MDPI and/or the editor(s) disclaim responsibility for any injury to people or property resulting from any ideas, methods, instructions or products referred to in the content. |
© 2025 by the authors. Licensee MDPI, Basel, Switzerland. This article is an open access article distributed under the terms and conditions of the Creative Commons Attribution (CC BY) license (https://creativecommons.org/licenses/by/4.0/).
