Abstract
The ignition and combustion characteristics of the afterburner directly affect the engine performance. In this study, a numerical simulation model was created for both the novel gliding arc assisted combustion system and the conventional spark plug system. The ignition and combustion characteristics of the afterburner were then numerically investigated. Results indicate that gliding arc can enhance ignition and combustion compared to traditional spark plug. In terms of ignition characteristics, gliding arc extends the lean ignition limit by 50% and reduces ignition delay time by up to 33.8%. Regarding combustion performance, gliding arc improves combustion efficiency by up to 7.6% and increases combustor outlet temperature by up to 7%. However, due to more intense combustion dynamics within the chamber, gliding arc reduces the total pressure recovery coefficient by approximately 8% compared to baseline.
1. Introduction
The afterburner is a critical component in military aircraft engines for thrust augmentation, capable of significantly increasing engine thrust [1]. Its ignition and combustion characteristics, as one of the primary performance metrics of aeroengines, directly determine operational effectiveness and safety. Under high-altitude conditions, the incoming flow temperature and pressure can drop to −50 °C and below 30 kPa, respectively, severely degrading fuel atomization and ignition reliability, resulting in low ignition possibility [2].
Additionally, the airflow entering the afterburner consists of exhaust gases from the engine’s main combustor, which contains one quarter less oxygen than pure air. This reduced oxygen concentration inhibits combustion, markedly lowering combustion reaction rates and flame propagation speeds [3,4,5]. Furthermore, the high-velocity incoming flow destabilizes the combustion process [6,7]. With the continuous improvement of engine performance and function of military aircraft, the working envelope of the new afterburner is getting wider and wider, and the operational conditions of the afterburner are deteriorating. Especially when the engine is working in the full envelope, the intake parameters of the afterburner will change significantly, the ignition difficulty will become greater, and the flameout limit will be difficult to meet operational requirements [8,9,10,11].
The reliable ignition and stable combustion of afterburners under harsh operating conditions are critical to achieving their performance. Current afterburner ignition systems predominantly rely on spark plug ignition, which suffers from narrow ignition limits, low reliability, and insufficient success rates. There is an urgent demand for innovative ignition technologies capable of enabling robust ignition in extreme conditions while enhancing flame stability and combustion efficiency.
Plasma-enhanced ignition and combustion assistance are cross-disciplinary research between aerospace technology and plasma technology [12]. Many scholars have validated through research that it plays an important role in broadening engine ignition boundaries [13,14,15,16], enhancing combustion stability, and improving combustion efficiency [17]. The characteristics of the plasma source are the decisive factors affecting its ignition and combustion assistance effects. Among them, gliding arc plasma possesses thermal effects which are capable of generating high-temperature gas clusters and its higher electron temperature can excite more reactive species [18,19]. Therefore, it has attracted increasing attention in the ignition and combustion research community. Scholars have developed a multi-channel gliding arc structure to enhance the ignition and combustion of ethylene fuel in scramjet engines [20]. Experimental studies show that gliding arc plasma can overcome the shortcomings of traditional spark plug ignition, broaden ignition boundaries, shorten ignition delay time, and stabilize flame combustion [21,22].
Overall, current research on ignition and combustion enhancement in combustion chambers has primarily focused on experimental investigations, while numerical simulation studies on the characteristics of spark plugs and gliding arcs within combustors remain relatively scarce. This study develops models for spark plug and gliding arc based on the numerical simulation software platform, and a comparative study on the ignition and combustion characteristics of the afterburner combustor under different conditions was conducted.
2. Numerical Simulation Methods
2.1. Geometric Model
The airflow velocity in the afterburner is much higher than the flame propagation velocity. Therefore, the afterburner is usually arranged with flame stabilization structures in the flow channel to ignite and stabilize the flame in the low-speed airflow in the reflux area. At present, the evaporation tank, cavity–strut combination, and the standing vortex structure are relatively typical afterburner pilot ignition and flame stabilization forms. Their working principle is to construct a backflow in a limited space and inject fuel into it to ignite, thereby forming a stable ignition source. The nozzle configurations and ignition methods of these three layouts are fundamentally similar. Establishing a universal ignition performance prediction model for afterburners based on this similarity is of significant engineering importance [23,24,25,26]. Davoudzadeh, F., Lee, J. et al. studied the ignition and combustion characteristics of an RTA engine afterburner using a cavity-trapped vortex stabilizer as the main stabilizer. The research results show that this afterburner has wide ignition boundaries and high combustion efficiency [27,28].
This study employs a simplified model of a certain type of afterburner combustion chamber; the simplified afterburner model is shown in Figure 1. The mainstream direction of the afterburner is from left to right. The model has a cavity and a strut flame stabilizer. An igniter and two pilot fuel nozzles are installed on the upper side of the cavity. The igniter is located in the middle of the cavity near the direction of incoming flow. The fuel nozzles are located in the middle of the igniter and the two side walls. The igniter and the fuel nozzle are used to form the pilot flame in the cavity, and the strut flame stabilizer is used to transmit the flame and ignite the mainstream fuel to form a stable combustion area.
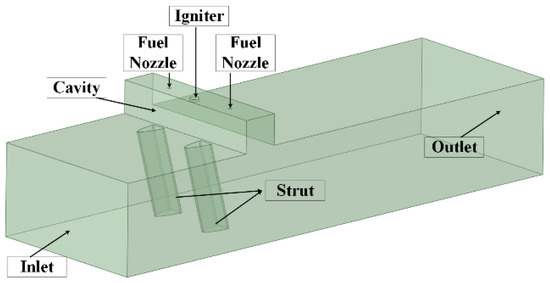
Figure 1.
Afterburner model diagram.
This study will conduct numerical simulations of both spark plug igniter and gliding arc igniter to evaluate their ignition performance in a specified afterburner configuration. The investigations will be performed using commercial CFD software (FLUENT 24.0), with detailed numerical methodologies and boundary conditions presented in subsequent sections.
2.2. Spark Ignition Model
In this study, an electric spark model was established to simulate the ignition of a spark plug igniter. Spark plug igniters are mainly ignited by instantaneous discharge breakdown of air to produce ignition kernel. The form of electric sparks varies depending on the nozzle design and discharge mode. In this study, the high-energy electric spark model is simplified to a model that releases energy in a spherical region within the duration, and the ignition process of the spark plug is simulated by implanting energy source terms and component source terms in the form of user-defined function (UDF) at the ignition position. We assume the electric spark follows a Gaussian heat source distribution in both temporal and spatial domains, and its model is shown in Equation (1) [29],
where Q is the power density (W/m3), Q0 is the discharge energy (J), η is the discharge efficiency (%), (a, b, c) is the center of the igniter outlet, R is the radius of the ignition core (mm), t1 indicates the maximum ignition energy at this time, and tr is the discharge time.
The parameters measured for the spark plug used in the laboratory are as follows: discharge energy Q0 = 7.5 J, discharge efficiency η = 20%, discharge time tr = 100 μs, t1 = 50 μs, and ignition core radius R = 5.17 mm. Heat source is hemispherical.
2.3. Gliding Arc Ignition Model
The gliding arc breakdown discharge process comprises three distinct phases: breakdown, evolution, and rupture. In this study, the gliding arc can be characterized as a repetitive excitation thermal jet enriched with reactive species. The operational parameters of the gliding arc were determined through integrated experimental measurements and numerical simulations, where the velocity of the thermal jet is selected from the average velocity of the gliding arc plasma jet igniter outlet of 30 m/s. The temperature of the thermal jet varies as a function of time. The outlet temperature of a single excitation is shown in Figure 2. When the excitation power supply remains energized, the gliding arc maintains a dynamic thermal equilibrium (around 1800 K) from 1 ms until the next re-ignition. During this period, the heat production, which is dominated by chemical reactions and electron elastic collisions, is approximately balanced by its heat losses. After the generated species stabilizes, the plasma jet outlet components containing the oxygen element (as active radicals) include O2, O, O(1D), O+, and other components. Since the content of O2 and O is much higher than that of other components, other components can be ignored in the actual simulation. Finally, the species fractions are as follows: O2 is 12.96%, O is 9.87%, and N2 is 77.2% [30].
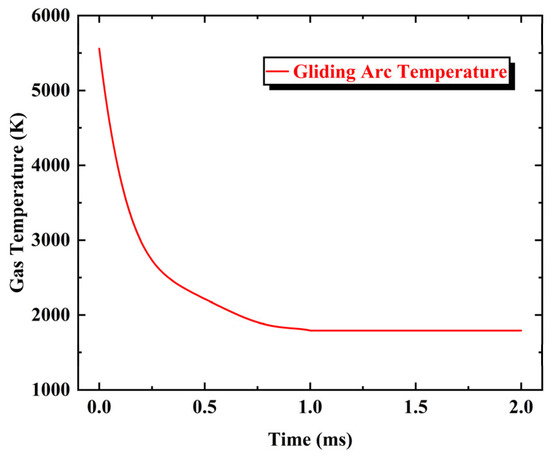
Figure 2.
Temperature variation of gliding arc igniter outlet under a single excitation.
2.4. Boundary Conditions
In order to more accurately simulate the working environment of the actual afterburner, the ignition reference conditions of the afterburner are set as shown in Table 1.

Table 1.
Standard operating condition of afterburner ignition.
Ignition performance is an important index for the reliable operation of the engine. The key parameter to evaluate the ignition performance of the combustion chamber is the lean oil–gas ratio of ignition [31]. The ignition oil–gas ratio is defined as,
where mf is the flow rate of fuel and ma is the flow rate of air. The simulated operating conditions are set as shown in Table 2.
Table 2.
Simulated operating condition table.
To evaluate combustion efficiency under thermally active conditions, the streamwise total pressure recovery coefficient and the combustion efficiency are defined as follows [32,33]:
where is the total pressure at the corresponding cross-section, is the total pressure at the upstream of the cavity, is the mass flow rate at afterburner inlet, is the fuel mass flow rate, is the gliding arc air inlet mass flow rate, , , , and are the heat capacity at constant pressure for exhaust gas, inlet air, fuel, and gliding arc inlet air, respectively. , , , and are the temperature of combustor outlet, inlet air, fuel, and gliding arc inlet, respectively. The parameters on the cross-sectional plane are calculated using a mass-weighted average, defined by the following formula [34]:
where is the physical quantity to be calculated, is the density, is the dot product of the momentum vectors, is the dot product of the facet area, and is the lower heating value of kerosene, taken as 43,200 kJ/kg.
2.5. Cross-Section
Four cross-sections were defined to enable comparative visualization of parameters in distinct slices during post processing. Figure 3 shows cross-section locations of the afterburner chamber, where the red slice (slice 1) is a symmetric cross-section of the igniter outlet, perpendicular to the direction of inlet flow; the green slice (slice 2) is a symmetric cross-section of the cavity, perpendicular to the direction of incoming flow; the blue slice (slice 3) is a symmetric cross-section of the combustion chamber, parallel to the direction of incoming flow; and the yellow slice (slice 4) is a symmetric cross-section of the strut, parallel to the direction of incoming flow.
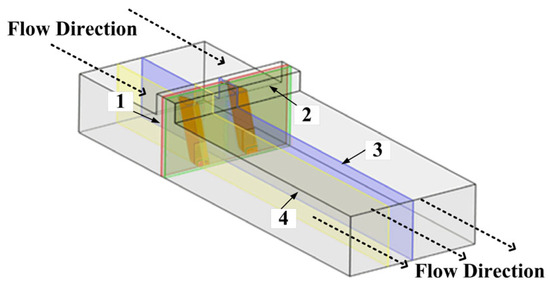
Figure 3.
Schematic diagram of afterburner model slice and flow direction.
2.6. Numerical Setup
Numerical simulation is conducted using the commercial computational fluid dynamics software FLUENT 24.0. This study utilized a three-dimensional compressible Reynolds-averaged Navier–Stokes to analyze the results. Turbulence was calculated using the standard turbulence model, which was shown as an appropriate model for the afterburner combustion [35,36]. The near-wall flow was simulated using the standard wall functions. For pressure–velocity coupling, the SIMPLE algorithm was employed. All of the equations are discretized with the second-order upwind scheme. The finite-rate/eddy-dissipation model is adopted as the combustion model. Jet series aviation kerosene is commonly used in laboratories. In this study, C10H22 was employed as a substitute for liquid fuel. Gao et al. [37] developed a global 10-step reaction mechanism based on C10H22. Therefore, this 10-step chemical mechanism was adopted.
2.7. Grid Independence Verification
To validate grid independence for the afterburner model, five models with varying grid counts (3.08 million, 4.51 million, 6.07 million, 7.11 million, and 8.63 million grids) were established. The axial cross-section average temperature under combustion was calculated for each configuration. As shown in Figure 4, when the grid count reached 7.11 million grids, the differences in temperature became negligible, confirming sufficient mesh resolution. To optimize computational efficiency, the 7.11 million grids model was selected for simulations.
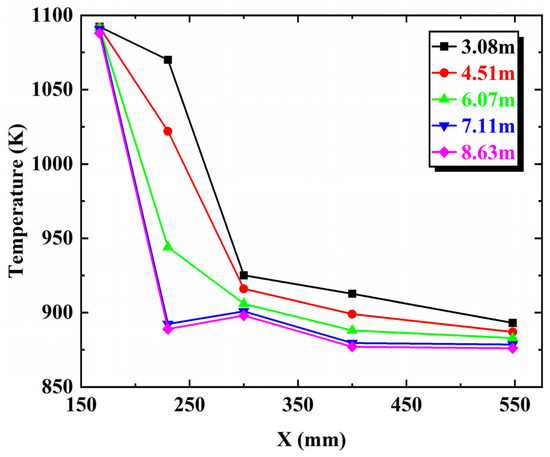
Figure 4.
Axial cross-section average temperature of different number of grid models.
3. Results Analysis and Discussion
3.1. Distribution of Oil Mist Field and Velocity Field in Cold State
Before performing the numerical simulation of the thermal state, the structure of the cold flow field is firstly described and analyzed briefly, which is helpful to analyze the interaction between the fuel and the material field. In this section, mf = 2 g/s is taken as an example for detailed assessment, and the flow field structure in the cold state is analyzed by intercepting different cross-sections, which provides the theoretical analysis basis for the numerical simulation of the hot state.
As shown in Figure 5, in the spreading direction, Figure 5a and Figure 5b are respectively, mass fraction of C10H22 and velocity streamline distribution diagrams of the outlet section of the igniter (slice 1) and the symmetrical section of the cavity (slice 2). In the axial direction, Figure 5c and Figure 5d show the fuel distribution and velocity streamline distribution of the symmetrical section of the afterburner (slice 3) and the symmetrical section of the strut (slice 4), respectively. By observing the velocity streamline distributions in Figure 5a,b, it can be seen that, in the direction of spreading, under the joint action of cavity and strut, a more complex vortex structure and recirculation zone are formed inside the cavity, which are generally two large recirculation zones and a number of small low-speed recirculation zones. The vortex structure of the exit section of the igniter and the symmetrical section of the cavity are different, but the distribution of the low-speed recirculation zone is generally similar. This is because the symmetrical section of the cavity is more backward than the section of the igniter, so the entrapment of the cavity is more intense, and the vortex structure is larger and more complex. The velocity in the recirculation zone is much lower than the inlet velocity of the combustion chamber and is basically symmetrical. It can be seen from the fuel distribution map that the distribution trend of fuel is basically the same as that of the recirculation zone. Obviously, after the igniter ignites the fuel, the flame can develop to the fuel-rich area and spread to both sides and the lower side in the exhibition.
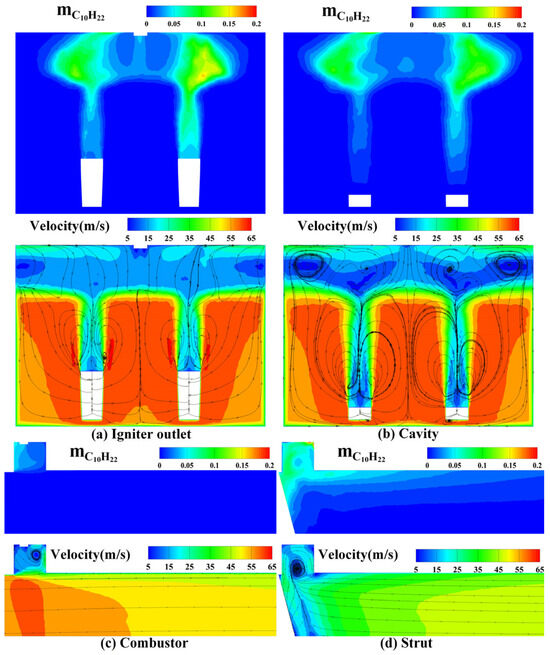
Figure 5.
Mass fraction of C10H22 and velocity in different symmetrical sections under mf = 2 g/s.
It can be seen from Figure 5c,d that, in the axial direction, after passing through the cavity and the strut, the airflow velocity is significantly reduced. Under the action of the pressure layer and the airflow entrainment, a large recirculation zone and several low velocity areas are formed inside the cavity. Because the symmetrical section of the strut is also blocked by the strut to the airflow, the vortex structure and the recirculation zone are more forward and larger, while the symmetrical section of the combustion chamber is less affected by the strut, so the vortex structure is more backward and smaller. It can be seen from the fuel distribution map that an obvious fuel-rich area is formed in the recirculation zone at the front of the cavity. Obviously, after the fuel-rich area is ignited, the flame can spread to the lower and rear sides in the axial direction. The amount of fuel injection under different working conditions is different, but the overall flow field distribution is basically not affected by the amount of fuel injection, and the flow field distribution of other working conditions is similar, which will not be repeated here.
Figure 6 shows the fuel distribution patterns in the symmetric cross-section of the igniter (slice 1) under different fuel flow rates. Observations reveal that, as the fuel flow rate increases, fuel is progressively entrained and concentrated within the recirculation zone. The shape of this fuel aggregation directly determines the geometry of the initial flame and subsequent combustion structure formed in the recirculation zone during ignition. Fuel is predominantly distributed along both sides of the igniter exit, thus facilitating flame propagation toward the recirculation zone while avoiding localized fuel-rich conditions that could hinder ignition. Notably, at a fuel flow rate of 6 g/s, fuel accumulation is observed beneath the fuel injection holes, creating a localized fuel-rich zone. This phenomenon highlights the critical role of oil–gas mixing dynamics in optimizing ignition performance under high fuel load conditions.
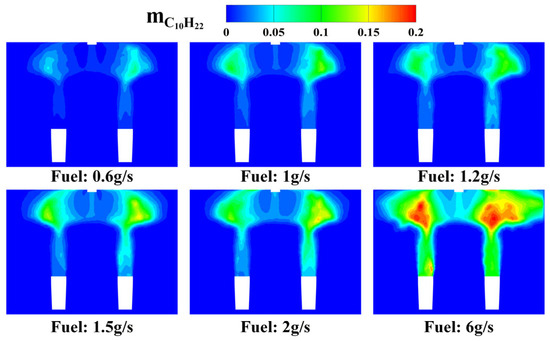
Figure 6.
Mass fraction of C10H22 in the symmetric cross-section of the igniter under different fuel flow rates.
3.2. Ignition Analysis
3.2.1. Ignition Results Analysis
In this study, the ignition processes of the gliding arc igniter and the spark plug igniter under various oil–gas ratio conditions were investigated through numerical simulations. The ignition kernel definition for both gliding arc and spark plug follows an identical criterion: the temperature attained upon discharge completion. The spark plug achieves 0.1 ms with its ignition kernel temperature exceeding 2400 K, while the gliding arc requires 1 ms with ignition kernel temperature above 1800 K. The detailed ignition characteristics are summarized in Table 3.
Table 3.
Ignition performance of gliding arc igniters and spark plugs under different oil–gas ratios.
3.2.2. Gliding Arc Ignition Analysis
To analyze the flame development and propagation during gliding arc ignition, the flame propagation under the condition of mf = 2 g/s was presented, as shown in Figure 7. The temporal reference (t = 0 ms) in this section aligns exactly with the initiation of gliding arc (Figure 2). Figure 7a and Figure 7b illustrate the dynamic ignition process simulated using the gliding arc igniter in the symmetric cross-section at the igniter outlet (slice 1) and at the strut symmetric plane (slice 4), respectively.
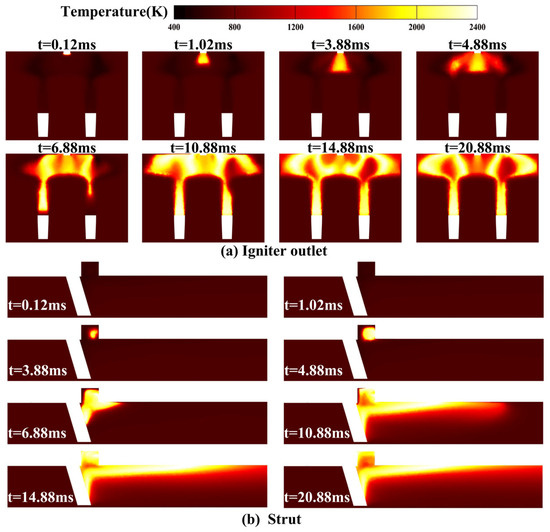
Figure 7.
Ignition process of gliding arc igniter in different symmetrical sections under mf = 2 g/s.
At t = 0.12 ms, the ignition kernel forms at the igniter exit. At t = 1.02 ms, the ignition kernel exhibited significant thermal dissipation due to strong velocity gradients, with the core temperature declining to approximately 2000 K while demonstrating distinct outward jetting characteristics. At t = 3.88 ms, the temperature at the ignition kernel had further decreased to almost 1700 K as it reached maximum spatial expansion, indicating that the initial ignition kernel just vanished, accompanied by rapid heating in adjacent fuel-rich zones and emerging flame at the strut symmetry plane. Subsequent evolution at t = 4.88 ms revealed stabilized flame in the cavity with bilateral ignition of fuel-rich zones, forming new flame that progressively expanded into the cavity. By t = 6.88 ms, bidirectional flame propagation became evident along both cavity sidewalls and the strut wake region, with gradually intensifying combustion temperatures. The system reached complete fuel-rich zone ignition at t = 10.88 ms, sustaining active flame propagation toward downstream combustion areas. Full fuel consumption was achieved at t = 14.88 ms, establishing stable flame anchoring that matured into organized combustion by t = 20.88 ms, demonstrating successful flame stabilization throughout the combustion chamber.
3.2.3. Spark Ignition Analysis
To investigate flame development and propagation during spark plug ignition, Figure 8 presents flame propagation diagrams under the condition of mf = 2 g/s. Figure 8a and Figure 8b illustrate the dynamic ignition process in the afterburner, captured at the symmetric cross-section of the igniter outlet (slice 1) and the strut (slice 4), respectively.
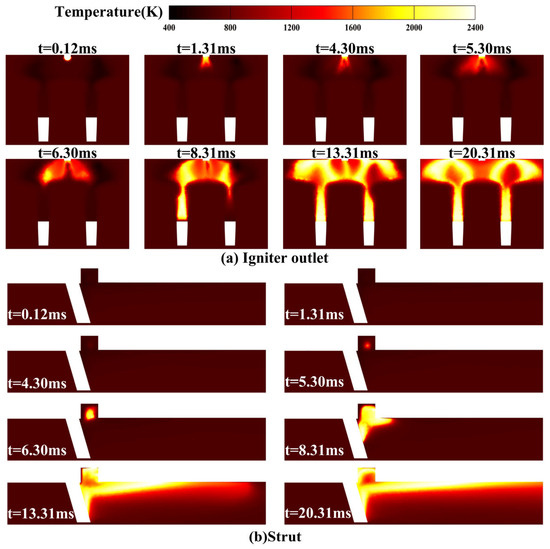
Figure 8.
Ignition process of spark plug igniter in different symmetrical sections under mf = 2 g/s.
At the initial stage (t = 0.12 ms), a semi-circular ignition kernel forms near the igniter exit. By t = 1.31 ms, the temperature at the original ignition kernel rapidly decreases to about 1800 K, indicating that the initial ignition kernel has already vanished, and the temperature of the hemispherical zone dissipates due to flow field effects, with thermal energy propagating toward the fuel-rich zone. Unlike the gliding arc, the spark-plug-generated initial ignition kernel persists for a significantly shorter time. At t = 4.30 ms, a noticeable temperature rise appears in the fuel-rich zone. Subsequent evolution shows accelerated heating in the fuel zone, with clear ignition observed at t = 5.30 ms, accompanied by emerging flame near the strut symmetry plane.
By t = 6.30 ms, a new clearly flame part forms in the fuel zone and continues expanding outward. Flame propagation extends bidirectionally along the cavity walls and downstream of the strut at t = 8.30 ms. Complete ignition of the fuel-rich zone is achieved at t = 13.31 ms, with sustained flame propagation toward the strut wake and rear combustion chamber. A stabilized flame front is fully established by t = 20.31 ms, confirming successful combustion organization.
3.2.4. Analysis of Spark Ignition Failure
The spark plug achieved successful ignition with a pilot nozzle fuel flow rate of 1.5 g/s, while ignition failed at 1.2 g/s. Figure 9 and Figure 10 compare the ignition processes under these two different oil–gas ratios, where Figure 9a and Figure 10a illustrate the process at the symmetric cross-section of the igniter outlet (slice 1), and Figure 9b and Figure 10b illustrate the process at the symmetric cross section of the combustion chamber (slice 3).
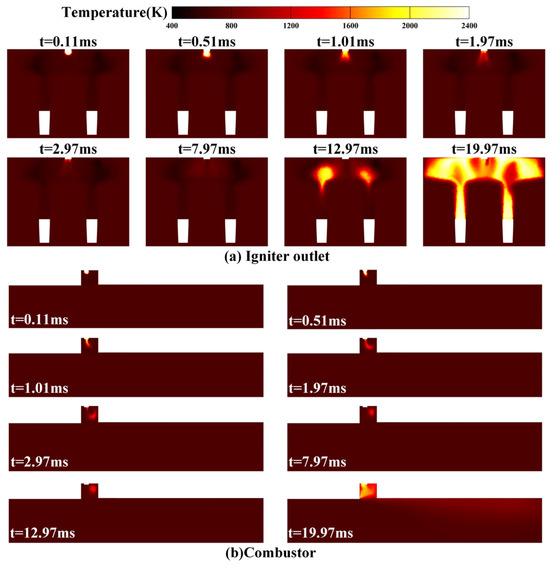
Figure 9.
Ignition process of spark plug igniter in different symmetrical sections under mf = 1.5 g/s.
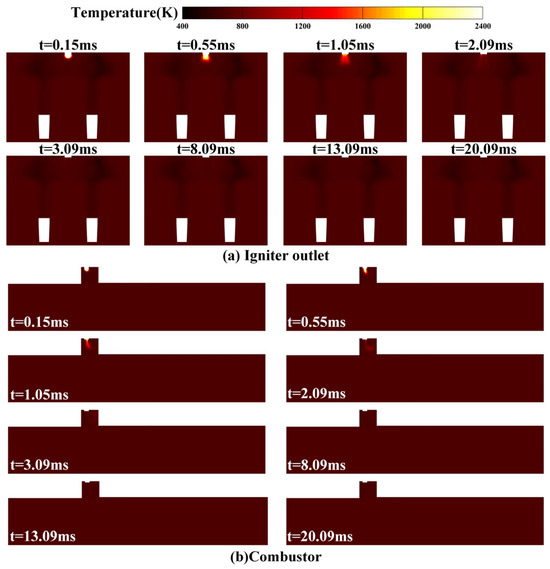
Figure 10.
Ignition failure process of spark plug igniter in different symmetrical sections under mf = 1.2 g/s.
At t = 0.11 ms (1.5 g/s) and t = 0.15 ms (1.2 g/s), when spark discharge ended, both cases showed nearly identical ignition kernel sizes. By t = 0.51 ms (1.5 g/s) and t = 0.55 ms (1.2 g/s), measurable kernels existed at the igniter exit for both conditions, with the 1.5 g/s case exhibiting a slightly larger kernel. At t = 1.01 ms (1.5 g/s) and t = 1.05 ms (1.2 g/s), the 1.5 g/s condition maintained a reduced but stable kernel with small flame formation at the exit, while the 1.2 g/s kernel had nearly vanished with significantly smaller flame area.
During t = 1.01–2.97 ms (1.5 g/s) and t = 1.05–3.09 ms (1.2 g/s), the 1.5 g/s case demonstrated initial flame expansion followed by contraction, ultimately forming a stable micro flame at the exit and visible cavity flame by 2.97 ms. Conversely, the 1.2 g/s flame area progressively diminished, nearly disappearing by 3.09 ms.
From t = 2.97–7.97 ms (1.5 g/s) and t = 3.09–8.09 ms (1.2 g/s), the 1.5 g/s exit flame gradually decreased and fully vanished by 7.97 ms, while showing a little flame develops within the cavity, exhibiting a relatively low temperature (around 1100 K). The 1.2 g/s case exhibited no significant flame development.
After t = 7.97 ms (1.5 g/s) and t = 8.09 ms (1.2 g/s), the 1.5 g/s cavity successfully ignited kerosene, achieving full cavity flame propagation by t = 19.97 ms (successful ignition). The 1.2 g/s condition showed no observable flame formation or propagation beyond 8.09 ms, confirming ignition failure at this fuel flow rate.
3.2.5. Ignition Delay Time
In this study, the ignition delay time under various operating conditions was calculated based on simulation results. Under successful ignition conditions, the temporal interval between initial spark discharge and first attainment of maximum flame area is defined as the ignition delay time: ti [38].
To precisely measure the flame stabilization time, zone S0 downstream of the combustor strut (slice 4) was designated within the combustion chamber as illustrated in Figure 11a. Through image recognition, the area where temperature exceeds 1200 K at time instant tn was identified as S1tn (ignited) as illustrated in Figure 11b,c, where Figure 11b is the flame area at time tb, and Figure 11c is the maximum flame area formed under that operating condition. When tb = 0, ti = tc − tb.
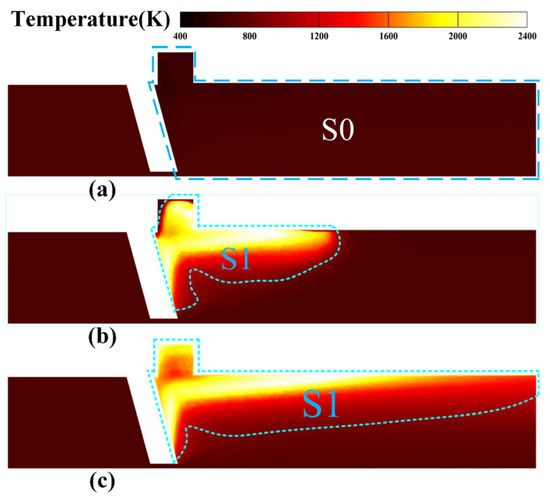
Figure 11.
Determination of flame stabilization time based on temperature measurements. (a) zone S0; (b) flame area at time tb; (c) maximum flame area.
The ignition delay times under different conditions are shown in Figure 12. As observed, with the decrease in oil gas ratio, the ignition delay time of both igniters increases. However, the increase for the spark plug igniter is steeper compared to that of the gliding arc igniter. Under various oil–gas ratio conditions, the ignition delay time of the gliding arc igniter is significantly shorter than that of the spark plug igniter. When the fuel mass flow rate is 6 g/s, the ignition delay times of both igniters are similar and both can ignite the fuel within a short period. As the fuel flow rate decreases to 2 g/s, the ignition delay times of both igniters increase sharply, with a more rapid increase observed for the spark plug igniter. At this point, the ignition delay times for the spark plug and gliding arc igniters are 15.3 ms and 12.88 ms, respectively. When the fuel flow rate further decreases to 1.5 g/s, the ignition delay times increase to 20.97 ms for the spark plug igniter and 13.87 ms for the gliding arc igniter. Under fuel flow rate reduction from 6 g/s to 1.5 g/s, the reduction ratio of ignition delay time achieved by the gliding arc (compared to spark plug ignition) progressively increased from 8.6% at 6 g/s to 33.85% at 1.5 g/s. This demonstrates that the gliding arc’s effectiveness in decreasing ignition delay time becomes significantly stronger under increasingly fuel-lean conditions.
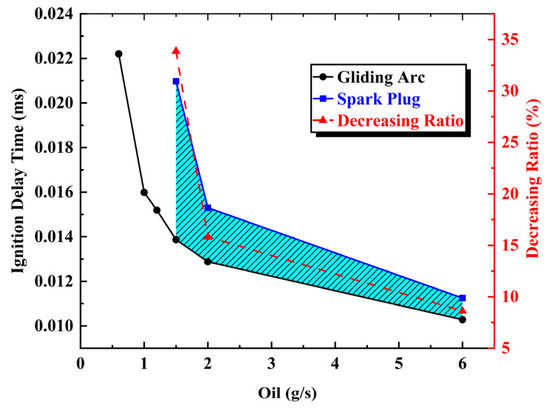
Figure 12.
Ignition delay time under different fuel flow rates and ignition methods.
At a fuel flow rate of 1.2 g/s, the ignition delay time of the gliding arc igniter is approximately 15.19 ms, which is close to that of the spark plug igniter at 2 g/s. However, under this condition, the spark plug igniter fails to ignite the fuel, indicating that its ignition limit lies between 1.2 g/s and 1.5 g/s under the conditions of this study. On the other hand, the gliding arc successfully achieved ignition even under a lean burn condition of 0.6 g/s fuel flow rate, demonstrating that gliding arc can extend the lean oil ignition limit of the afterburner by a remarkable 50% in this research.
3.3. Combustion Analysis
In ignition and combustion experiments, the spark plug igniter will be turned off after completing the ignition discharge, while the gliding arc actuator will maintain its actuation state after ignition to assist combustion. Therefore, this section will analyze the regulatory effects of the gliding arc actuator on combustion. This section will use the unexcited case as the baseline.
To facilitate systematic analysis of combustion chamber performance, including temperature, combustion efficiency, and total pressure recovery coefficient, nine axial monitoring planes were established along the afterburner, spanning from the cavity front to the combustion chamber outlet. The spatial arrangement of these diagnostic cross-sections is detailed in Figure 13.
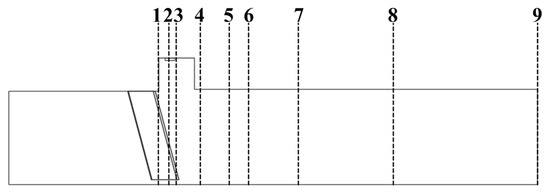
Figure 13.
Schematic diagram of axial cross-sections in the afterburner.
3.3.1. Combustion Efficiency
As depicted in Figure 14, the combustion efficiency and outlet temperature of the combustor under different conditions exhibit distinct performance characteristics. For combustion efficiency, both gliding arc and baseline demonstrate similar trends; the combustion efficiency increases with fuel flow but with progressively diminishing growth rates. Under gliding arc, combustion efficiency rises rapidly at low fuel flows (0.6–1.2 g/s), then plateaus gradually, reaching a peak of 96.8% at 6 g/s. In contrast, baseline shows a sharp efficiency increase below 2 g/s, followed by a slower ascent, peaking at 94.2% at 6 g/s. Notably, gliding arc consistently achieves higher combustion efficiency than baseline across all tested fuel flow rates, with the performance gap most pronounced at lower fuel flows, showing a maximum improvement of 7.6%.
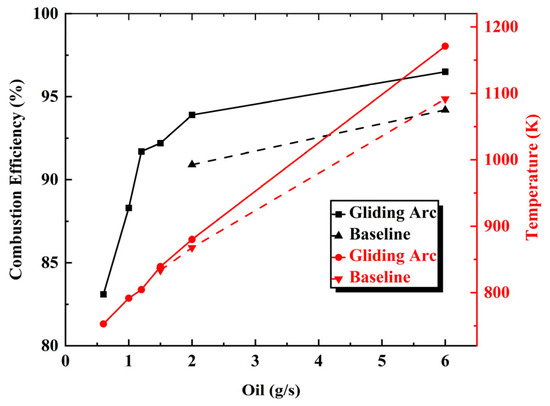
Figure 14.
Combustion efficiency and combustor outlet temperature under different fuel flow rates and excitation methods.
Regarding outlet temperature, both methods display a linear correlation with fuel flow rate. However, the gliding arc exhibits a steeper temperature rise slope, reflecting enhanced thermal responsiveness. At 6 g/s, the gliding arc yields a peak temperature of 1171 K, compared to 1091 K for the baseline. While the temperature difference is marginal (0.6%) at 1.5 g/s, it amplifies to 7% at 6 g/s.
Analysis shows that the gliding arc significantly enhances combustion efficiency under low fuel flow rates, while, under high fuel flow rates, it improves combustion organization to enable the fuel to release more heat.
3.3.2. Axial Cross-Section Temperature
Figure 15 shows the axial cross-section temperature under different fuel flow rates in a gliding arc system. Clearly, the variation in fuel flow rate significantly impacts the combustion chamber temperature.
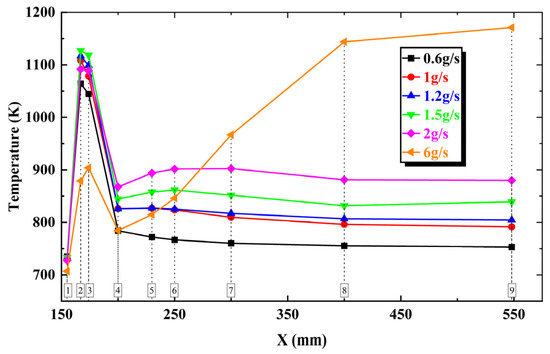
Figure 15.
Axial cross-section average temperature under different fuel flow rates in gliding arc system.
Within the studied range (0.6–2 g/s), the temperature across all sections increases with higher fuel flow rates, demonstrating a positive correlation. Notably, the highest temperatures occur at Sections 2 and 3, consistent with the previously analyzed cold flow fuel distribution field. These sections feature recirculation zones that entrain substantial fuel, releasing intense heat during combustion and sharply elevating local temperatures. Given the lean burn combustion conditions, the temperature rise aligns with increased heat release from additional fuel. However, at 6 g/s, the temperature profile diverges markedly from other cases; while Sections 2 and 3 still exhibit elevated temperatures, they are surpassed by downstream Sections 7–9. This anomaly arises because the cavity’s fuel entrainment creates a locally fuel-rich environment, depleting available oxygen. Excess fuel is then carried downstream, where abundant oxygen promotes combustion, elevating temperatures in rear sections, it can be concluded that, under these operating conditions, the combustion zone has partially shifted rearward from Sections 2 and 3.
Figure 16 presents a comparative analysis of axial cross-section temperature under gliding arc versus baseline at different fuel flow rates. The results reveal that, while both methods produce similar temperature variation trends across sections, the baseline consistently yields lower temperatures than the gliding arc at all measured cross-sections. This observation aligns quantitatively with the combustion efficiency curves presented earlier, where the afterburner demonstrated lower combustion efficiency under baseline compared to gliding arc.
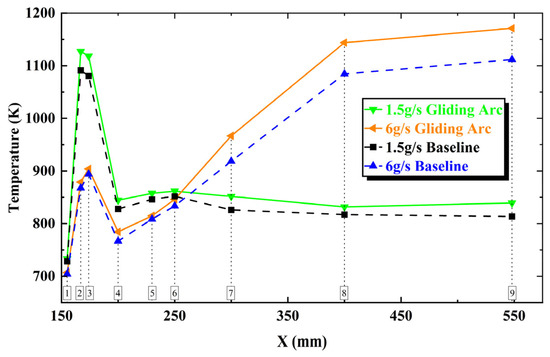
Figure 16.
Axial cross-section average temperature under different fuel flow rates and excitation methods.
3.3.3. Total Pressure Recovery Coefficient
Figure 17 shows the total pressure loss under different excitation methods in combustor symmetry plane (slice 3). Where Figure 17a is the total pressure loss under gliding arc excitation, Figure 17b is the total pressure loss of the baseline. The figure clearly shows that the total pressure loss under gliding arc is consistently higher than the baseline. The distribution patterns of total pressure loss are similar in both cases; losses begin to appear at the cavity and strut, then gradually increase along the flow direction. However, the total pressure loss under gliding arc grows at a much faster rate. This occurs because the gliding arc enhances fuel combustion, leading to more complete combustion, which consequently causes greater total pressure loss compared to the unexcited case.
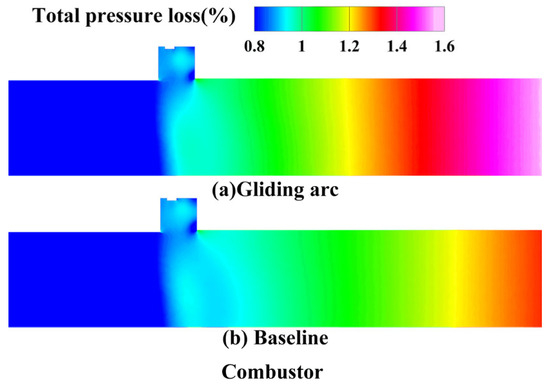
Figure 17.
Total pressure loss under different excitation methods in combustor symmetry plane.
Figure 18 shows the total pressure loss in combustor symmetry plane (slice 3). Figure 18a is the total pressure loss under gliding arc excitation, and Figure 18b is the total pressure loss of the baseline. By comparing the two cases, it is evident that the total pressure loss within the cavity under gliding arc discharge is significantly higher and primarily concentrated in two distinct regions. Firstly, at a certain distance downstream of the igniter outlet, no additional total pressure loss occurs in the unexcited case. However, under gliding arc excitation, noticeable additional loss emerges here. This is attributed to the gliding arc outlet functioning as a jet, injecting high-velocity airflow into the cavity and resulting in mixing losses. Secondly, at the center of the recirculation zone, the total pressure loss under gliding arc excitation is substantially more severe than in the unexcited case. This can be explained by the fact that the gliding arc generates oxygen-containing species that promote combustion, thereby enhancing burning within the recirculation zone and leading to increased total pressure loss.
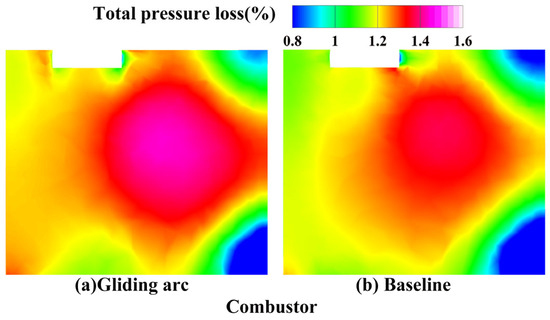
Figure 18.
Total pressure loss under different excitation methods at the cavity in combustor symmetry plane.
Figure 19 shows the distribution of total pressure recovery coefficient under gliding arc at different fuel flow rates. The results indicate that the variation trend of total pressure loss along the flow path is generally similar under different fuel flow conditions. From Section 1 to Section 3, the total pressure drops sharply. On one hand, this is due to the recirculation zone formed by the cavity where low flow velocity causes pressure loss and fuel injection also brings certain mixing loss. On the other hand, combustion initiates in the afterburner in this region and the violent gas expansion leads to total pressure loss. The total pressure partially recovers at Section 4. According to the previously analyzed temperature at different sections, the temperature at Section 4 decreases compared to Sections 2 and 3, resulting in reduced combustion intensity. The temperature contours also show that the combustion zone volume decreases, thus reducing thermal blockage caused by combustion. Meanwhile, the flow leaves the recirculation zone behind the cavity and gradually exits the low-speed zone, leading to decreased total pressure loss at Section 4. From Sections 5 to 9, the total pressure continues to decrease, but the combustion intensity begins to weaken after Section 6 and the combustion zone shrinks, resulting in relatively smaller total pressure loss. The rate of total pressure decrease rises with increasing fuel flow rate, especially under high fuel flow rates (6 g/s). At low fuel flow rates (0.6–1.2 g/s), the pressure loss at Sections 2 and 3 accounts for about 70% of the total pressure loss. At medium fuel flow rates (1.5–2 g/s), this proportion decreases to 60%, while, at high fuel flow rates (6 g/s), it further drops to about 55%. This agrees with previous conclusions that the combustion zone gradually moves toward the rear of the combustion chamber as fuel flow increases, causing the proportion of total pressure loss in the rear sections to progressively increase.
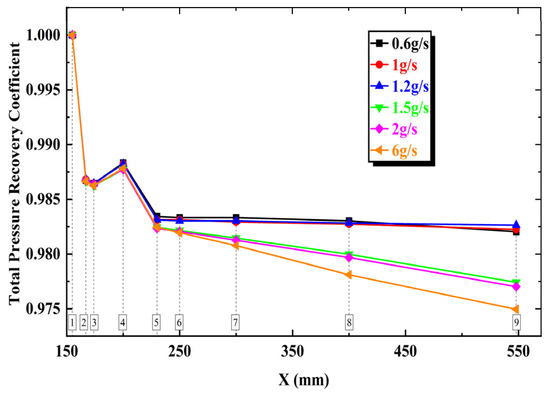
Figure 19.
Total pressure recovery coefficient under different fuel flow rates in gliding arc system.
Figure 20 presents a comparison of total pressure recovery coefficient distributions between gliding arc and baseline under identical operating conditions. The results demonstrate that both methods exhibit similar trends in total pressure loss along the combustion chamber.
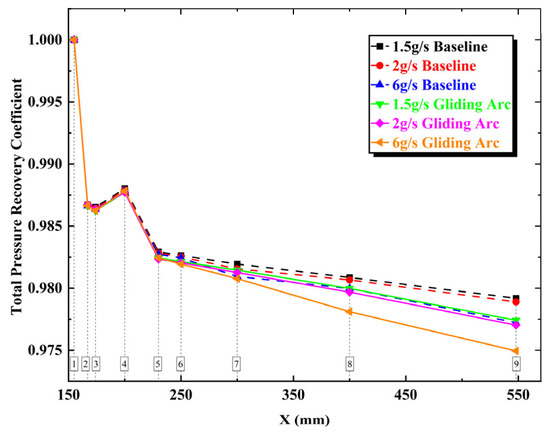
Figure 20.
Total pressure recovery coefficient under different fuel flow rates and excitation methods.
Under successful ignition conditions, the baseline achieves a total pressure recovery coefficient exceeding 0.977 at the combustor exit. However, at equivalent oil–gas ratios, the gliding arc system shows approximately 8% lower pressure recovery compared to the baseline.
4. Conclusions
The performance of the afterburner results from the combined effects of aerodynamic processes, fuel atomization, and chemical reactions. In this study, two different igniter excitation models were established through numerical simulation, and ignition and combustion processes were conducted within the afterburner. The main conclusions are as follows:
- Under the same oil–gas ratio, compared to the electric spark generated at the outlet of the spark plug igniter, the ignition kernel and initial flame formed by the jet at the outlet of the gliding arc igniter are larger in area, which facilitates successful ignition. At lower fuel flow rate, the spark plug igniter fails to ignite in the cavity due to its inability to form a stable flame. Gliding arc can extend the lean oil ignition limit of the afterburner by a remarkable 50% in this research.
- As the oil–gas ratio decreases, the ignition delay time of both the gliding arc igniter and the spark plug igniter increases. However, the delay time of the spark plug igniter increases more significantly, leading to a growing difference between the two. The decreasing ratio of ignition delay time achieved by the gliding arc (compared to spark plug ignition) progressively increased from 8.6% to 33.85%. Therefore, the gliding arc igniter can effectively reduce the ignition delay time compared to the spark plug igniter.
- The combustion efficiency increases with fuel flow rate but with progressively diminishing growth rates, while the afterburner outlet temperature displays a linear correlation with fuel flow rate. Under this pattern, the gliding arc significantly enhances combustion efficiency under low fuel flow rate, while, under high fuel flow rate, it improves combustion organization to enable the fuel to release more heat.
- The total pressure recovery coefficient of the combustor gradually decreases with increasing oil–gas ratio. Compared to baseline without excitation effects, the gliding arc demonstrates enhanced combustion effects, leading to more intense combustion. Consequently, under identical operating conditions, the gliding arc results in greater total pressure losses, approximately 8% higher than those observed with baseline.
Author Contributions
Conceptualization, X.Z.; methodology, X.Z.; software, Z.L. and Y.L.; validation, Z.L., Y.L. and X.Z.; formal analysis, None; investigation, Z.L. and Y.L.; resources, None; data curation, None; writing—original draft preparation, Z.L.; writing—review and editing, Z.Z.; visualization, None; supervision, Z.Z.; project administration, None; funding acquisition, Z.Z. and Y.W. All authors have read and agreed to the published version of the manuscript.
Funding
This work was financially supported by the National Natural Science Foundation of China (Grant No. 52488101, 52376138) and Basic Research Projects (Grant No. 1002TJA22010).
Data Availability Statement
This study did not report any data.
Conflicts of Interest
The authors declare no conflict of interest.
References
- Feng, M.; Dai, X.; Zhang, F.; Liao, G.; E, J. Numerical investigation on film cooling and aerodynamic performance for gas turbine endwalls with upstream vane-type and cascade-type slots. Aerosp. Sci. Technol. 2024, 145, 108857. [Google Scholar] [CrossRef]
- Chen, Z.; Yu, J.; Cheng, W.; Jiang, Y.; Jiang, L.; Tian, Y.; Zhang, L. Spatiotemporally resolved characteristics of AC three-dimensional rotating gliding arc at atmospheric pressure. J. Phys. D Appl. Phys. 2021, 54, 225203. [Google Scholar] [CrossRef]
- Chen, Y.; Fan, Y.; Bai, X.S.; Xu, L.; Shan, X.; Bi, Y.; Deng, Y.; Han, Q. Experimental study on combustion and flow resistance characteristics of an afterburner with air-cooled bluff-body flameholder. Aerosp. Sci. Technol. 2022, 123, 107488. [Google Scholar] [CrossRef]
- Lovett, J.; Brogan, T.; Philippona, D.; Kiel, B.V.; Thompson, T. Development needs for advanced afterburner designs. In Proceedings of the 40th AIAA/ASME/SAE/ASEE Joint Propulsion Conference and Exhibit, Fort Lauderdale, FL, USA, 11–14 July 2004; p. 4192. [Google Scholar]
- Safdar, M.M.; Masud, J.; Mufti, B.; Naseer, U.; Farooq, A.; Ullah, A. Numerical modeling and analysis of afterburner combustion of a low bypass ratio turbofan engine. In Proceedings of the AIAA Scitech 2020 Forum, Orlando, FL, USA, 6–10 January 2020; p. 628. [Google Scholar]
- Kheirkhah, S.; Maxim, C.J.D.; Saini, P.; Venkatesan, K.; Steinberg, A.M. Dynamics and mechanisms of pressure, heat release rate, and fuel spray coupling during intermittent thermoacoustic oscillations in a model aeronautical combustor at elevated pressure. Combust. Flame 2017, 185, 319–334. [Google Scholar] [CrossRef]
- Stöhr, M.; Yin, Z.; Meier, W. Interaction between velocity fluctuations and equivalence ratio fluctuations during thermoacoustic oscillations in a partially premixed swirl combustor. Proc. Combust. Inst. 2017, 36, 3907–3915. [Google Scholar] [CrossRef]
- Zhang, B. Status and development of aeroengine combustors. Aeroengine 2013, 39, 67–73. [Google Scholar]
- Zhang, X.C.; Sun, Y.C.; Liu, T. Summary of advanced afterburner design technology. Aeroengine 2014, 40, 24–30. [Google Scholar]
- He, L.M.; Yu, J.L.; Zeng, H. The Technology of Plasma Ignition and Assisted Combustion; Aviation Industry Press: Beijing, China, 2019; pp. 1–6. [Google Scholar]
- Wang, H.R.; Jin, J. Overview of lean blowout limit prediction methods for aeroengine combustors. Aeroengine 2014, 40, 72–78. [Google Scholar]
- Li, Y.H.; Wu, Y. Research progress and outlook of flow control and combustion control using plasma actuation. Sci. Sin. Technol. 2020, 50, 1252–1273. [Google Scholar] [CrossRef]
- Weinberg, F.J.; Hom, K.; Oppenheim, A.K.; Teichman, K. Ignition by plasma jet. Nature 1978, 272, 341–343. [Google Scholar] [CrossRef]
- Wermer, L.; Lefkowitz, J.K.; Ombrello, T.; Im, S.-K. Spark and flame kernel interaction with dual-pulse laser-induced spark ignition in a lean premixed methane–air flow. Energy 2021, 215, 119162. [Google Scholar] [CrossRef]
- Ombrello, T.M.; Hammack, S.D.; Carter, C.D.; Busby, K.; Lefkowitz, J.K. Scramjet cavity ignition using nanosecond-pulsed high-frequency discharges. Combust. Flame 2024, 262, 113335. [Google Scholar] [CrossRef]
- Patel, R.; van Oijen, J.; Dam, N.; Nijdam, S. Low-temperature filamentary plasma for ignition-stabilized combustion. Combust. Flame 2023, 247, 112501. [Google Scholar] [CrossRef]
- Kong, C.; Li, Z.; Aldén, M.; Ehn, A. Stabilization of a turbulent premixed flame by a plasma filament. Combust. Flame 2019, 208, 79–85. [Google Scholar] [CrossRef]
- Zhu, J.; Ehn, A.; Gao, J.; Kong, C.; Aldén, M.; Salewski, M.; Leipold, F.; Kusano, Y.; Li, Z. Translational, rotational, vibrational and electron temperatures of a gliding arc discharge. Opt. Express 2017, 25, 20243–20257. [Google Scholar] [CrossRef]
- Zhu, J.; Sun, Z.; Li, Z.; Ehn, A.; Aldén, M.; Salewski, M.; Leipold, F.; Kusano, Y. Dynamics, OH distributions and UV emission of a gliding arc at various flow-rates investigated by optical measurements. J. Phys. D Appl. Phys. 2014, 47, 295203. [Google Scholar] [CrossRef]
- Feng, R.; Huang, Y.; Zhu, J.; Wang, Z.; Sun, M.; Wang, H.; Cai, Z. Ignition and combustion enhancement in a cavity-based supersonic combustor by a multi-channel gliding arc plasma. Exp. Therm. Fluid Sci. 2021, 120, 110248. [Google Scholar] [CrossRef]
- Yu, J.L.; Zhao, B.B.; Guo, H.; Xu, Z.L.; Hu, Y.J.; Fan, W.; Xu, H.S. Research progress of sliding arc plasma assisted combustion technology in aeroengines. Aeroengine 2022, 48, 52–59. [Google Scholar]
- Liu, X.; He, L.M.; Dai, W.F.; Zhao, Z.C.; Chen, G.C.; Zhang, H.L. Experimental study on characteristics of dc gliding arc plasma igniter. J. Propuls. Technol. 2020, 41, 1550–1559. [Google Scholar]
- Tan, Y.C.; Zhong, H.G.; Sum, R.L. Effect of lean blowout performance of trapped vortex combustor of the afterburner. J. Aerosp. Power 2021, 36, 1932–1941. [Google Scholar]
- Liu, R.; Liu, Y.Y.; Gao, Z. Structural parameters effects on lean blowout performance and prediction method for piloted vaporization flameholder. J. Propuls. Technol. 2017, 38, 2753. [Google Scholar]
- Huang, X.; Wang, H.R. Numerical simulation analysis of a cavity strut flame stabilizer cold flow field influence on ignition characteristics. Gas Turbine Exp. Res. 2018, 31, 11–16. [Google Scholar]
- Hsu, K.; Gross, L.; Trump, D.; Roquemore, W. Performance of a trapped-vortex combustor. In Proceedings of the 33rd Aerospace Sciences Meeting and Exhibit, Reno, NV, USA, 9–12 January 1995; p. 810. [Google Scholar]
- Davoudzadeh, F.; Buehrle, R.; Liu, N.S.; Ralph, W. Numerical simulation of the RTA combustion rig. In Proceedings of the 40th Combustion, 28th Airbreathing Propulsion, 22nd Propulsion Systems Hazards, 4th Modeling and Simulations Joint Subcommittees Meetings, Charleston, SC, USA, 13–17 June 2005. [Google Scholar]
- Lee, J.H.; Winslow, R.; Buehrle, R.J. The GE-NASA RTA hyperburner design and development. In Proceedings of the 40th Combustion, 28th Airbreathing Propulsion, 22nd Propulsion Systems Hazards and 4th Modeling and Simulation Joint Subcommittee Meetings, Charleston, SC, USA, 13–17 June 2005. [Google Scholar]
- Pascaud, S.; Boileau, M.; Martinez, L.; Cuenot, B.; Poinsot, T. LES of Steady Spray Flame and Ignition Sequences in Aeronautical Combustors. In Proceedings of the 1st Workshop INCA, SNECMA, Villaroche, France. pp. 19–26. 2025. Available online: https://www.cerfacs.fr/~cfdbib/repository/TR_CFD_05_70.pdf (accessed on 1 August 2025).
- Li, Z.; Zhu, Y.; Pan, D.; Cheng, X. Characterization of a Gliding Arc Igniter from an Equilibrium Stage to a Non–Equilibrium Stage Using a Coupled 3D–0D Approach. Processes 2023, 11, 873. [Google Scholar] [CrossRef]
- Gui, T.; Fang, R.L.; Qiu, W.; Zheng, Y.; Fan, W. Experimental investigation on ignition performance of coaxial and divisional high temperature rise combustor. J. Propuls. Technol. 2022, 43, 224–232. [Google Scholar]
- Li, M.; Wang, Z.; Li, J. Numerical study of cold flow characteristics of a new integrated afterburner with strut flame stabilizer. Aerosp. Sci. Technol. 2024, 153, 109476. [Google Scholar] [CrossRef]
- Li, M.; Wang, Z.; Li, J. Numerical study on the performance of a new integrated afterburner under a wide range of bypass ratio conditions. Energy 2024, 313, 133919. [Google Scholar] [CrossRef]
- ANSYS Inc. Ansys Fluent Theory Guide; ANSYS Inc.: Canonsburg, PA, USA, 2024. [Google Scholar]
- Qiu, H.; Zhang, J.; Sun, X.; Chang, J.; Bao, W.; Zhang, S. Flowing residence characteristics in a dual-mode scramjet combustor equipped with strut flame holder. Aerosp. Sci. Technol. 2020, 99, 105718. [Google Scholar] [CrossRef]
- Miao, J.; Fan, Y.; Wu, W.; Zhao, S. Influence of air-entraining intensity on the afterburner ignition, flame-holding and combustion characteristics. Aerosp. Sci. Technol. 2020, 106, 106063. [Google Scholar] [CrossRef]
- Gao, Y.; Wang, Y.; Wang, Y.; Liu, B.; Qin, F. Optimization method of global reactions kinetic parameters for kerosene combustion. Aerosp. Technol. 2022, 4, 62–72. [Google Scholar]
- Wang, C.; Tian, Y.; Wang, T.; Liu, C.; Wang, K.; Wang, S.; Liu, F.; Mu, Y.; Xu, G. Study on ignition mechanism and flame dynamic characteristics in a strut and cavity integrated bypass combustor. Phys. Fluids 2025, 37, 055110. [Google Scholar] [CrossRef]


Disclaimer/Publisher’s Note: The statements, opinions and data contained in all publications are solely those of the individual author(s) and contributor(s) and not of MDPI and/or the editor(s). MDPI and/or the editor(s) disclaim responsibility for any injury to people or property resulting from any ideas, methods, instructions or products referred to in the content. |
© 2025 by the authors. Licensee MDPI, Basel, Switzerland. This article is an open access article distributed under the terms and conditions of the Creative Commons Attribution (CC BY) license (https://creativecommons.org/licenses/by/4.0/).