
Civil Aircraft Landing Attitude Ultra-Limit Warning System Based on mRMR-LSTM


Abstract
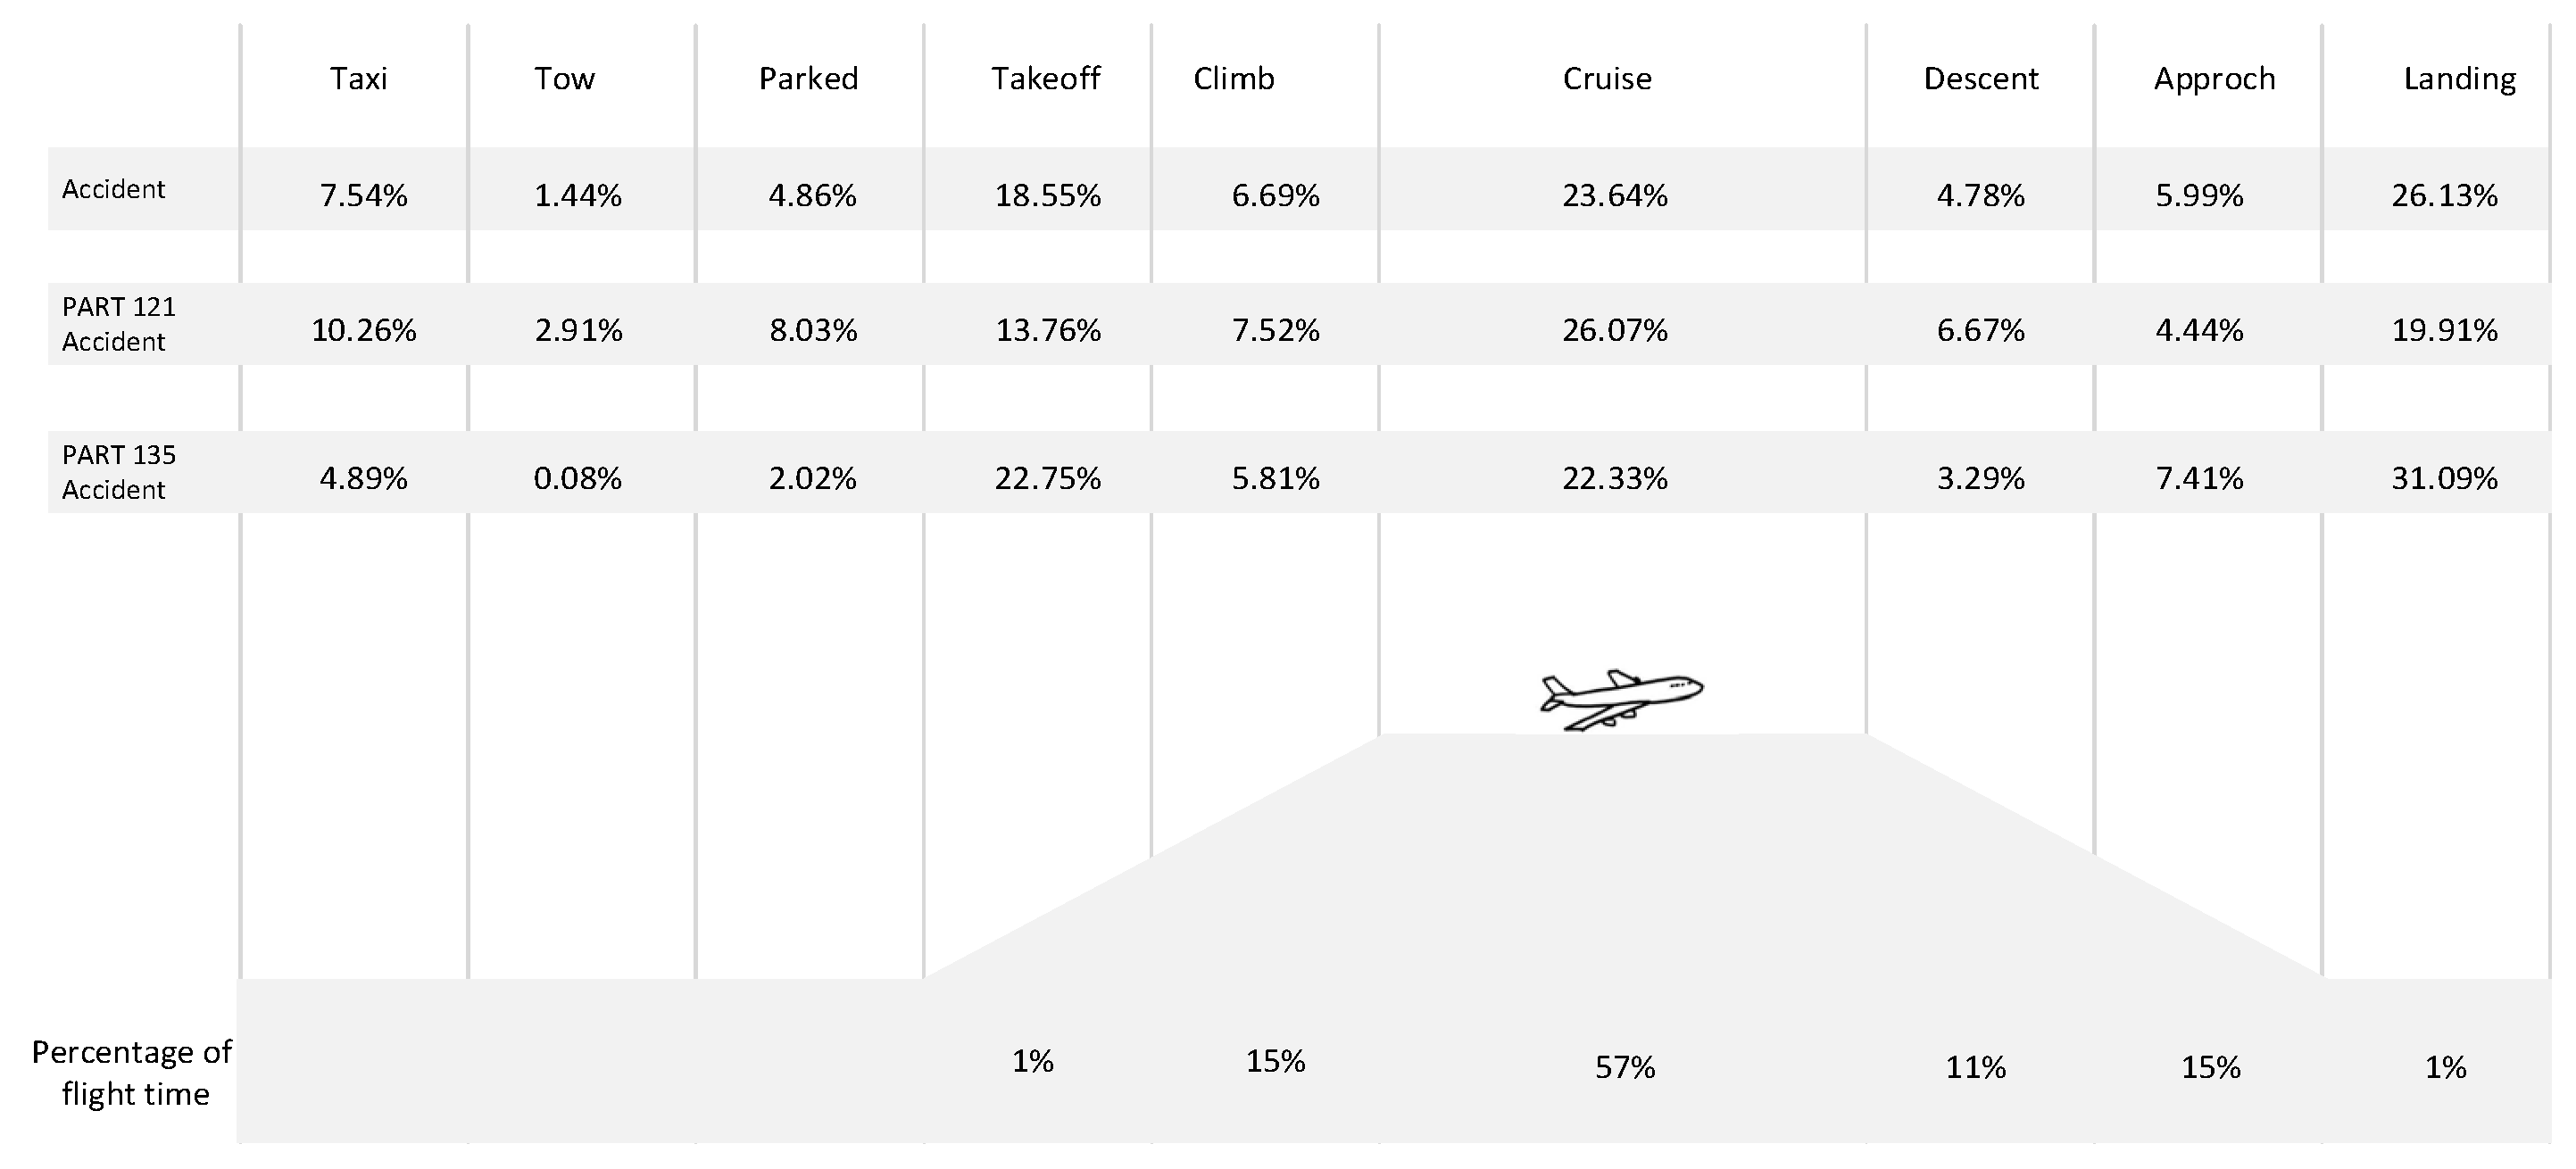
1. Introduction
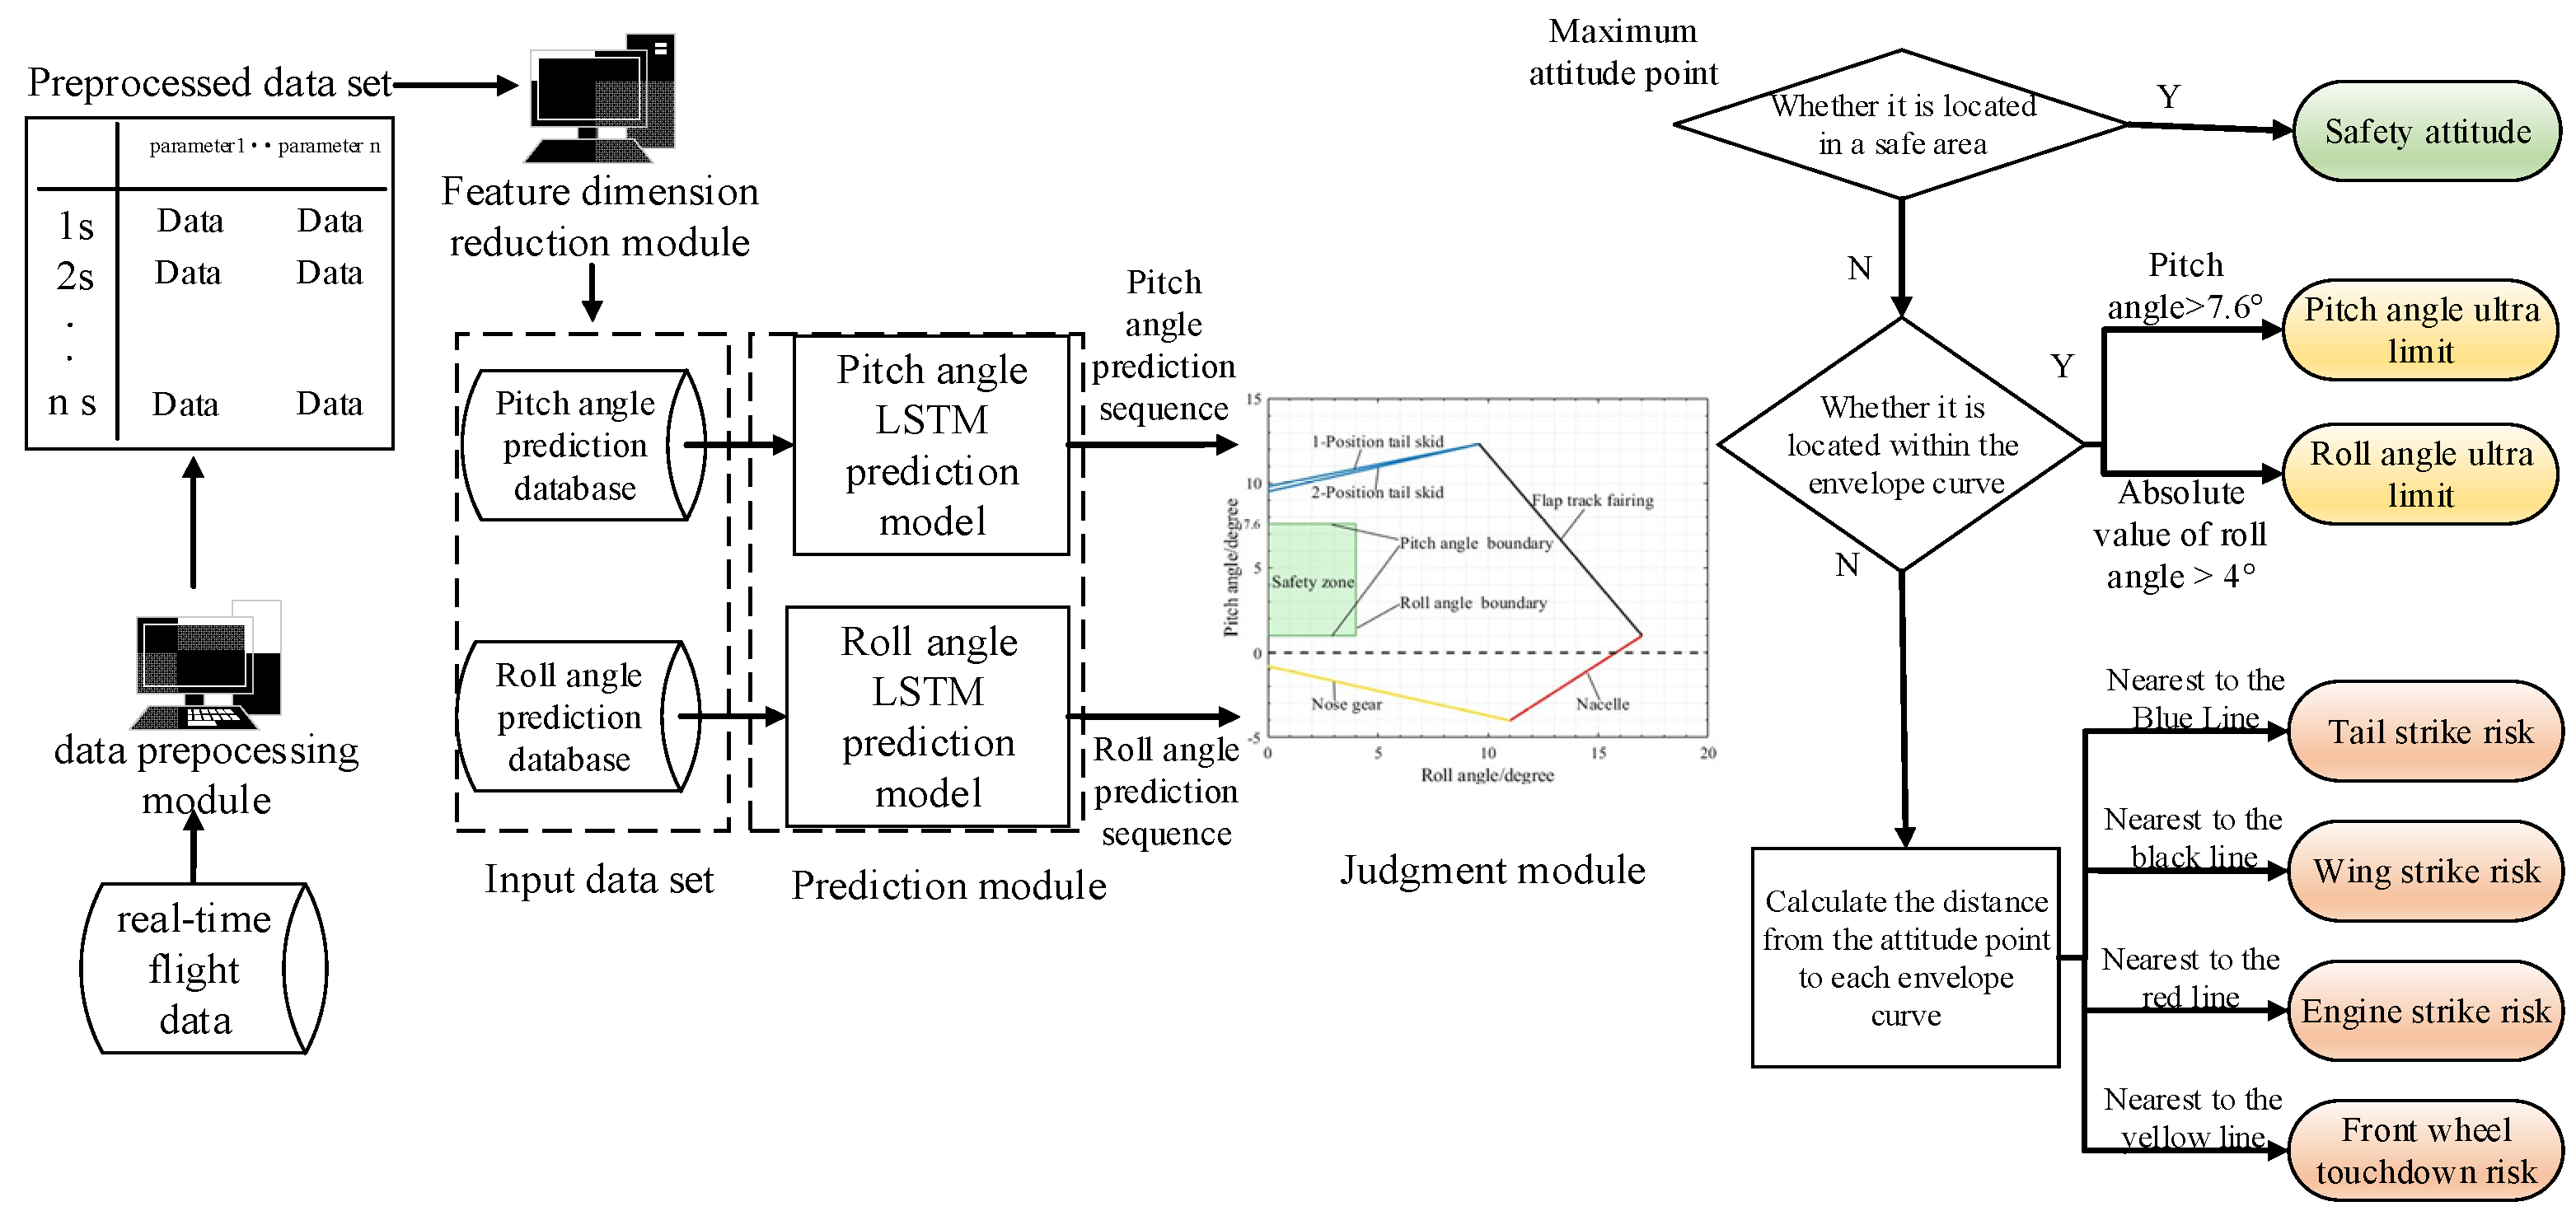
2. Aircraft Landing Attitude Ultra-Limit Risk Warning System
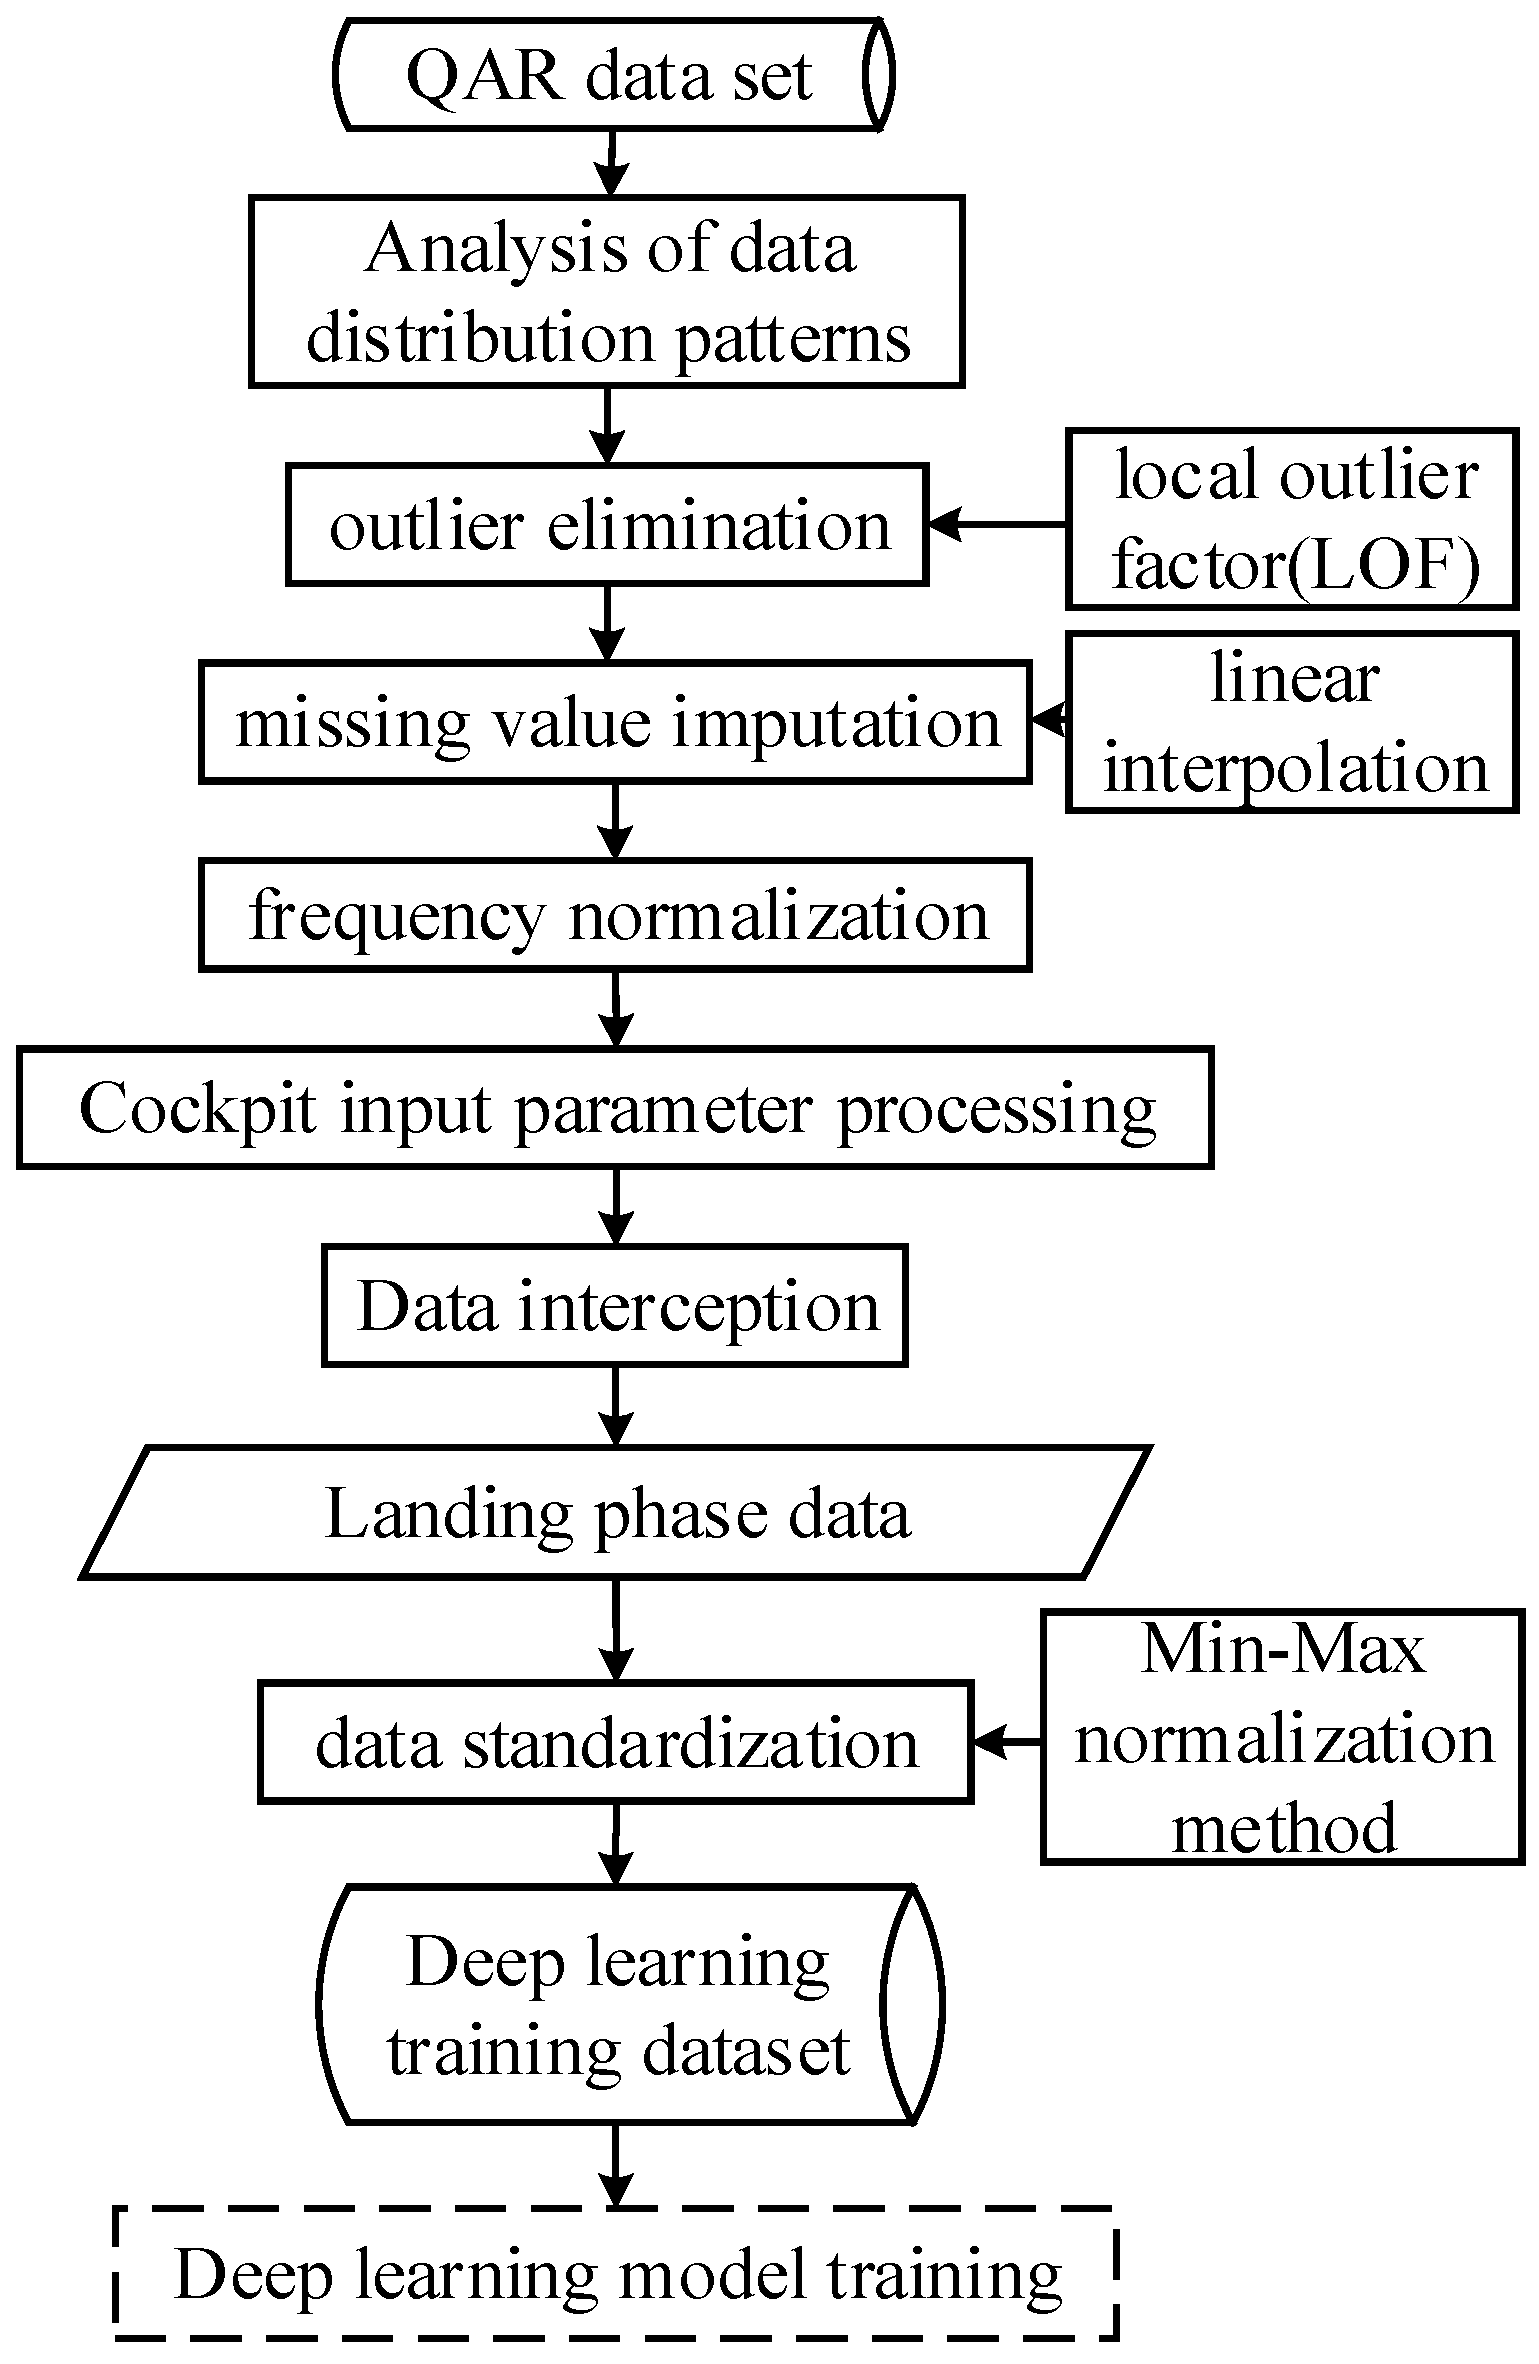
2.1. Early Warning System Framework
2.2. Data Pre-Processing
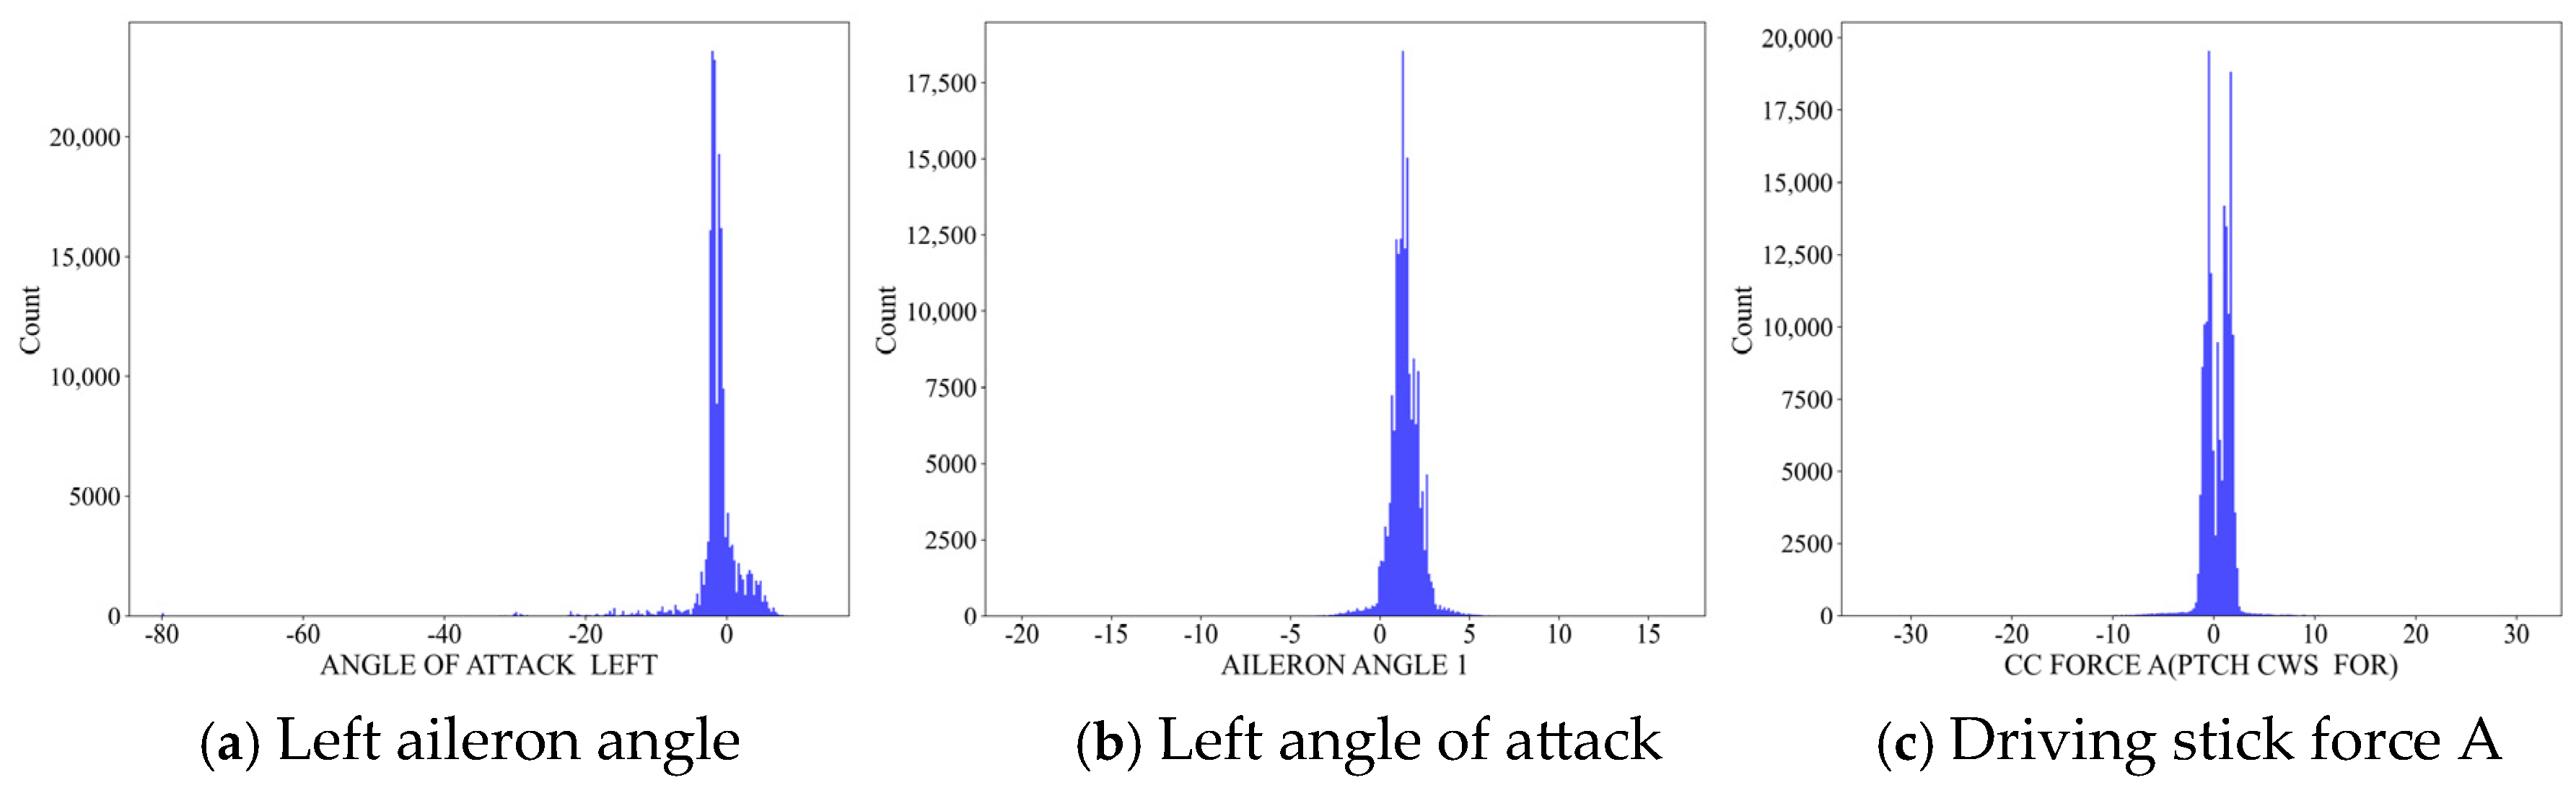
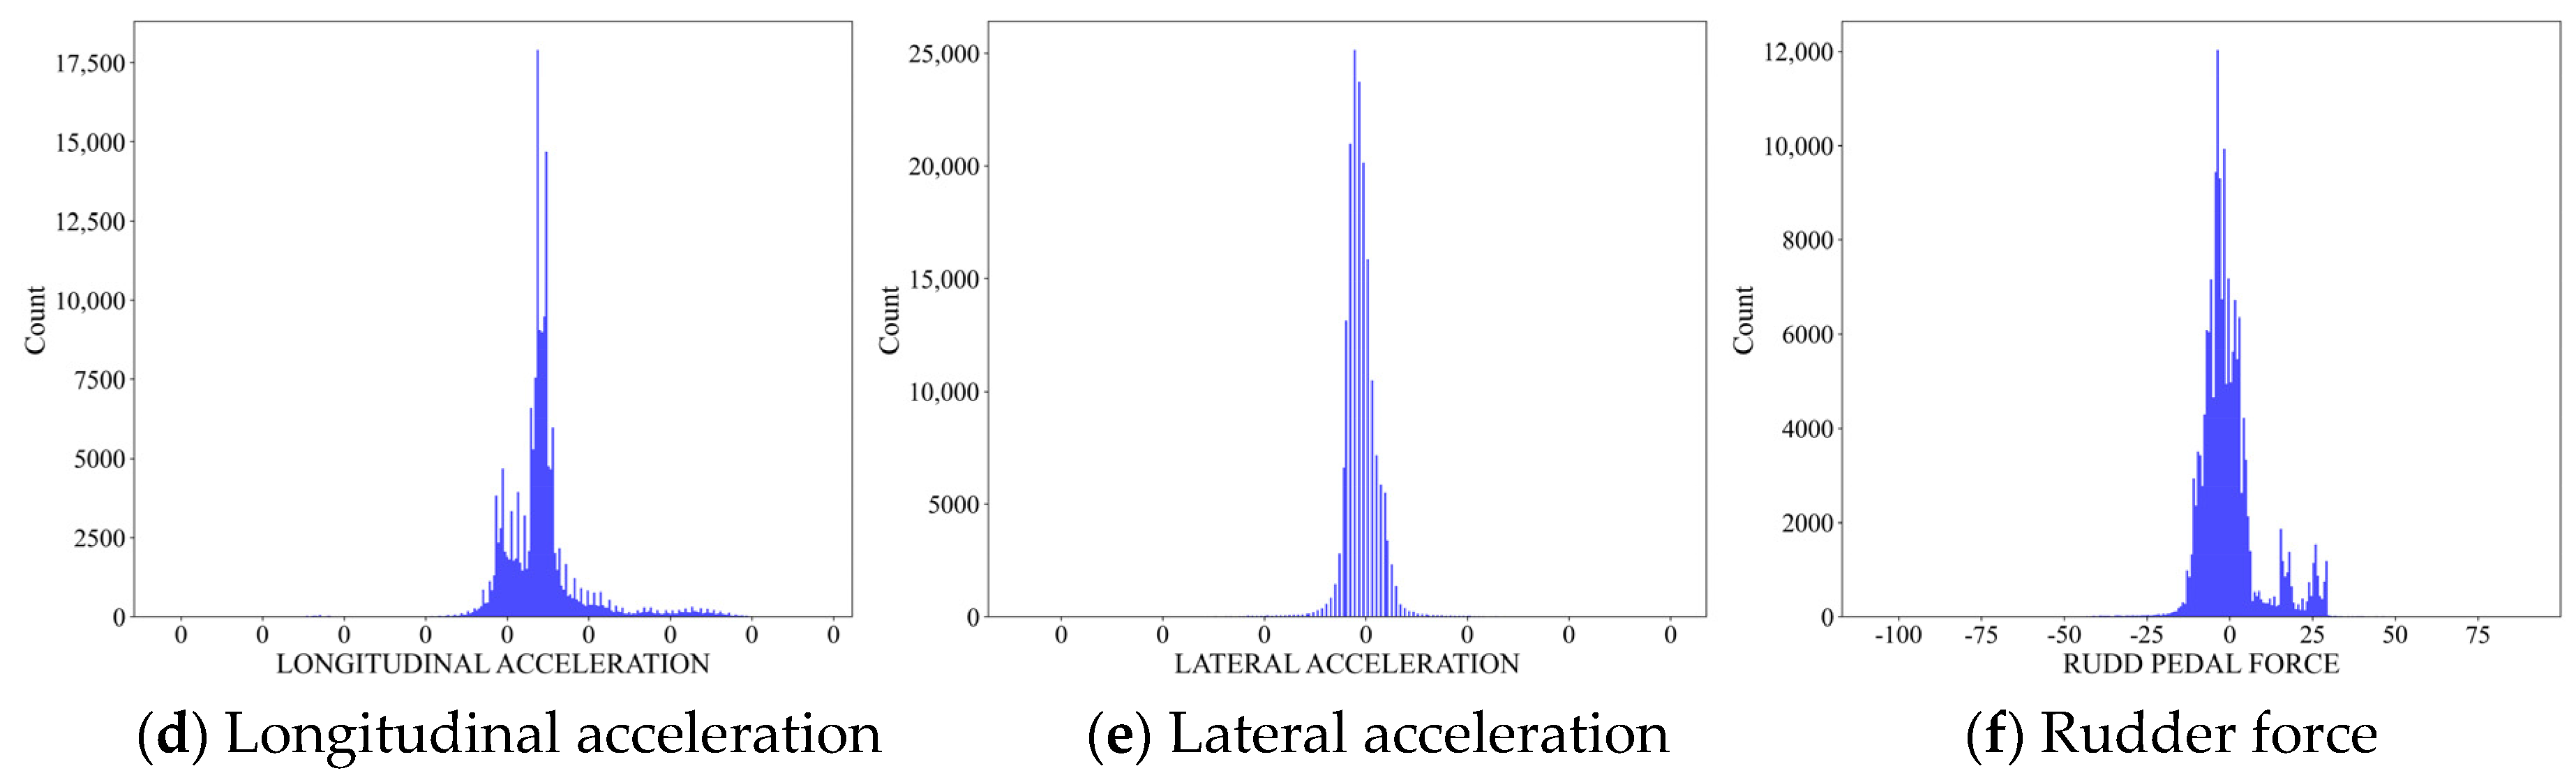
2.2.1. QAR Parameter Distribution Pattern
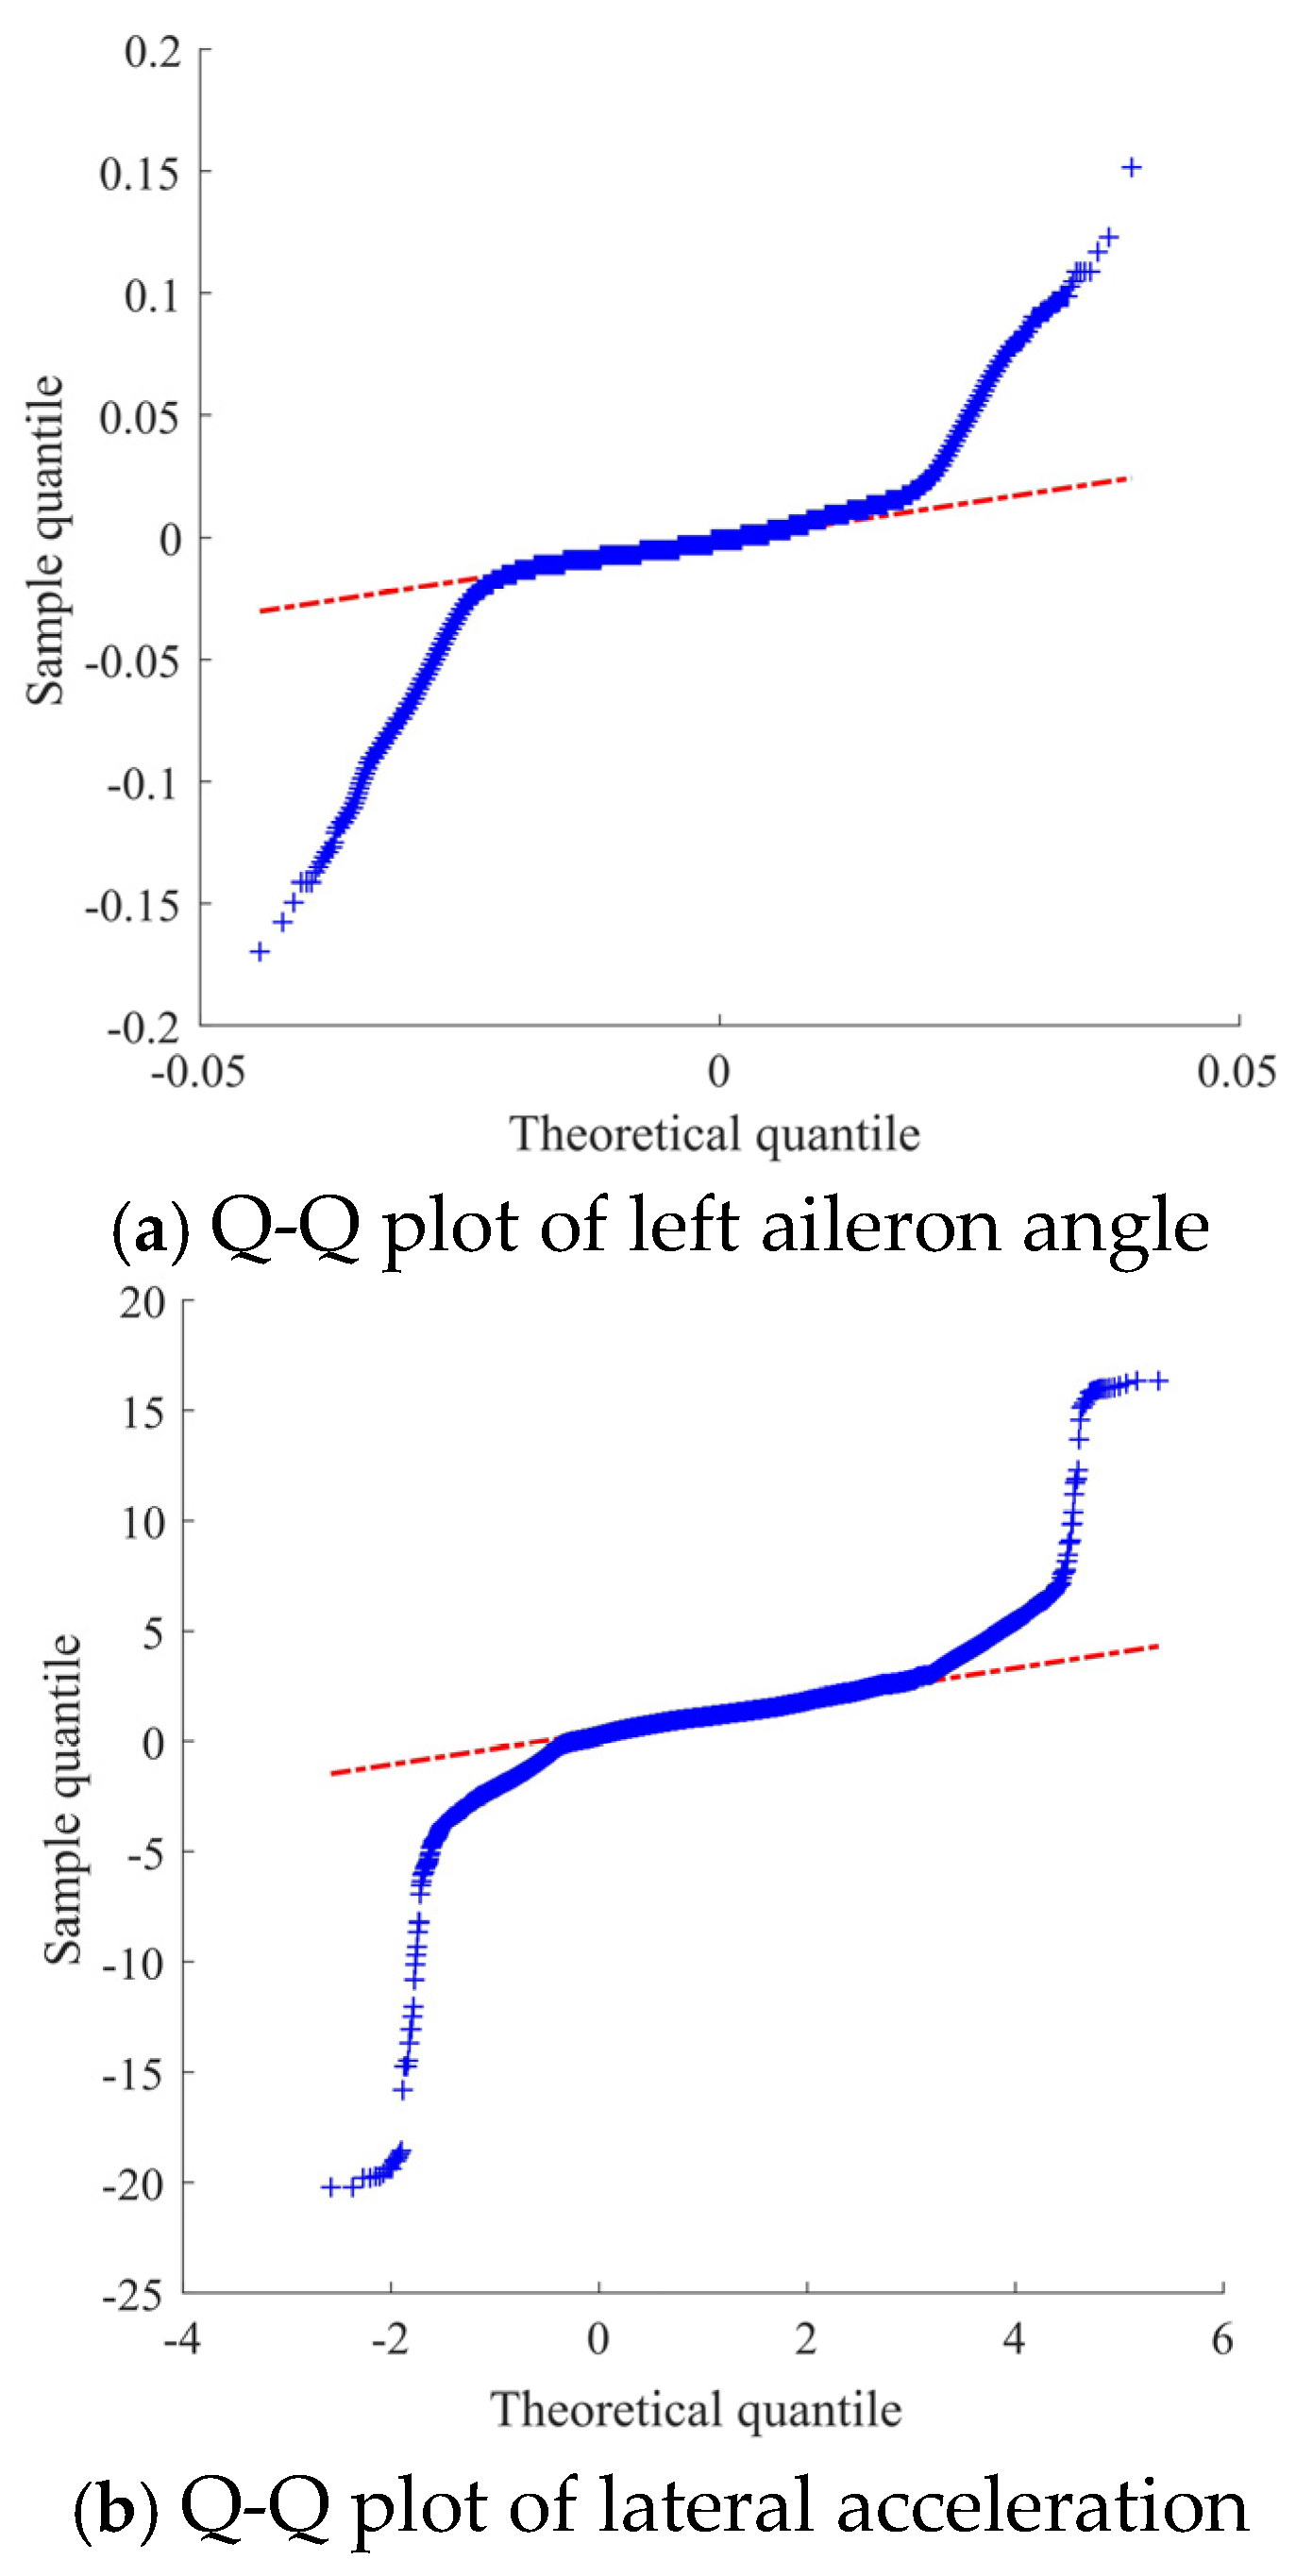
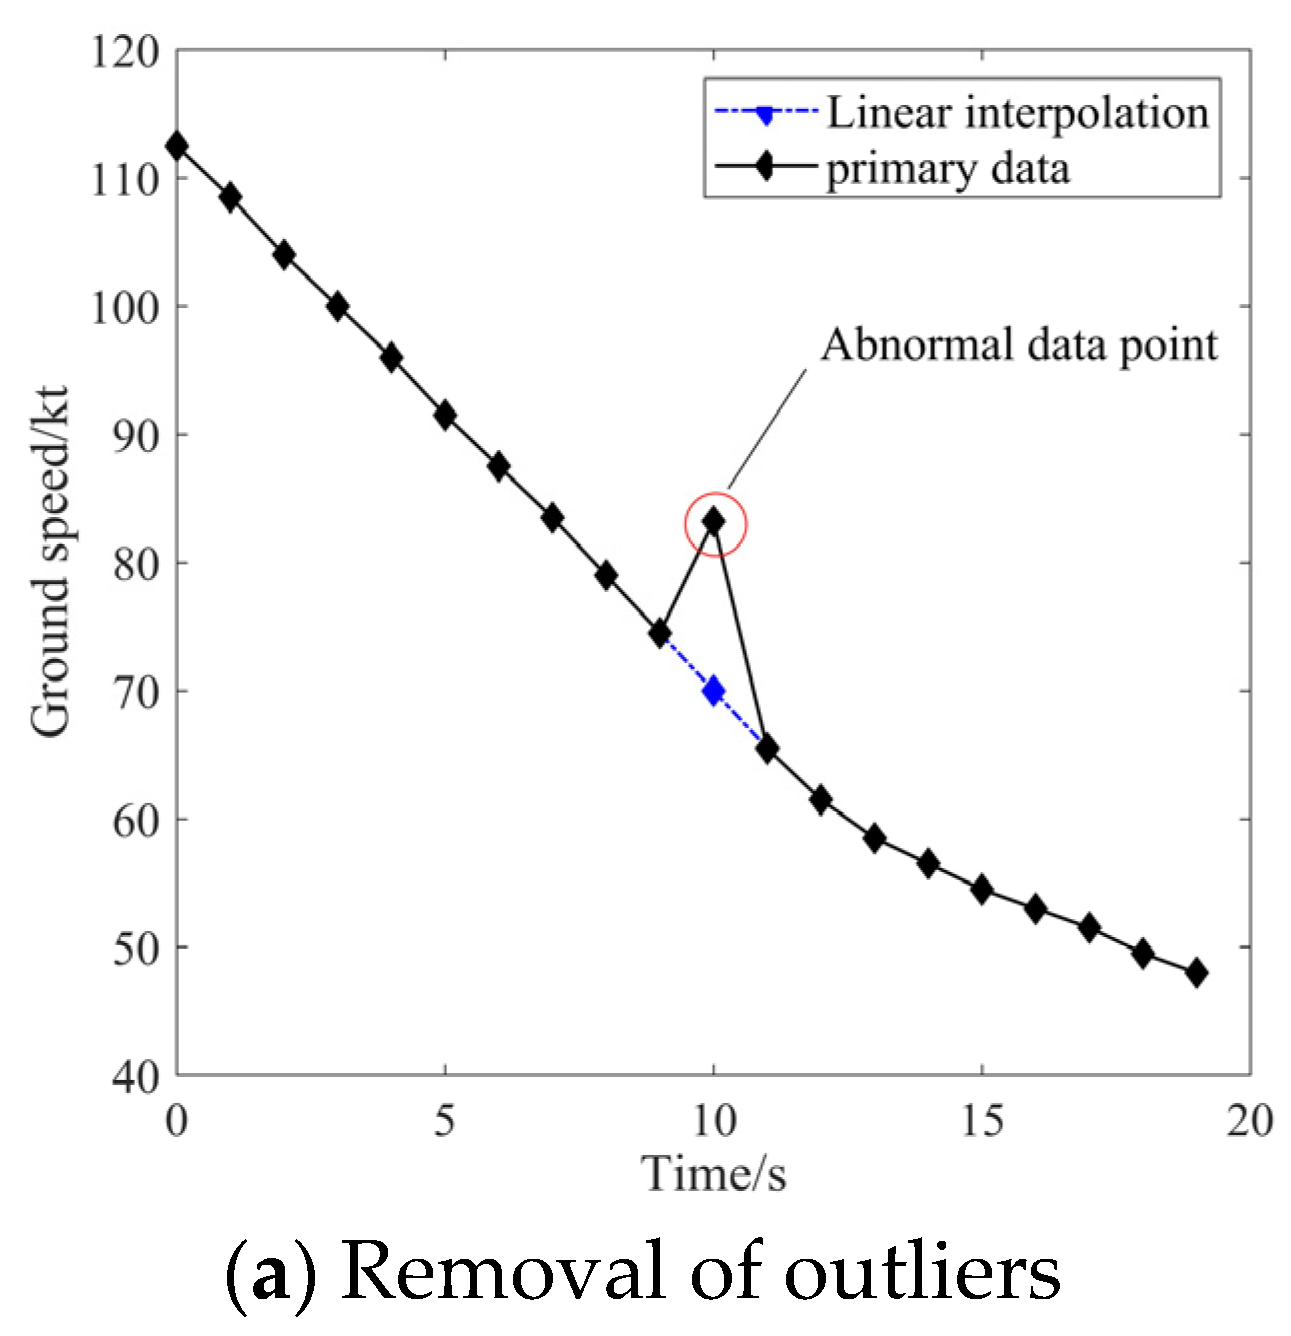
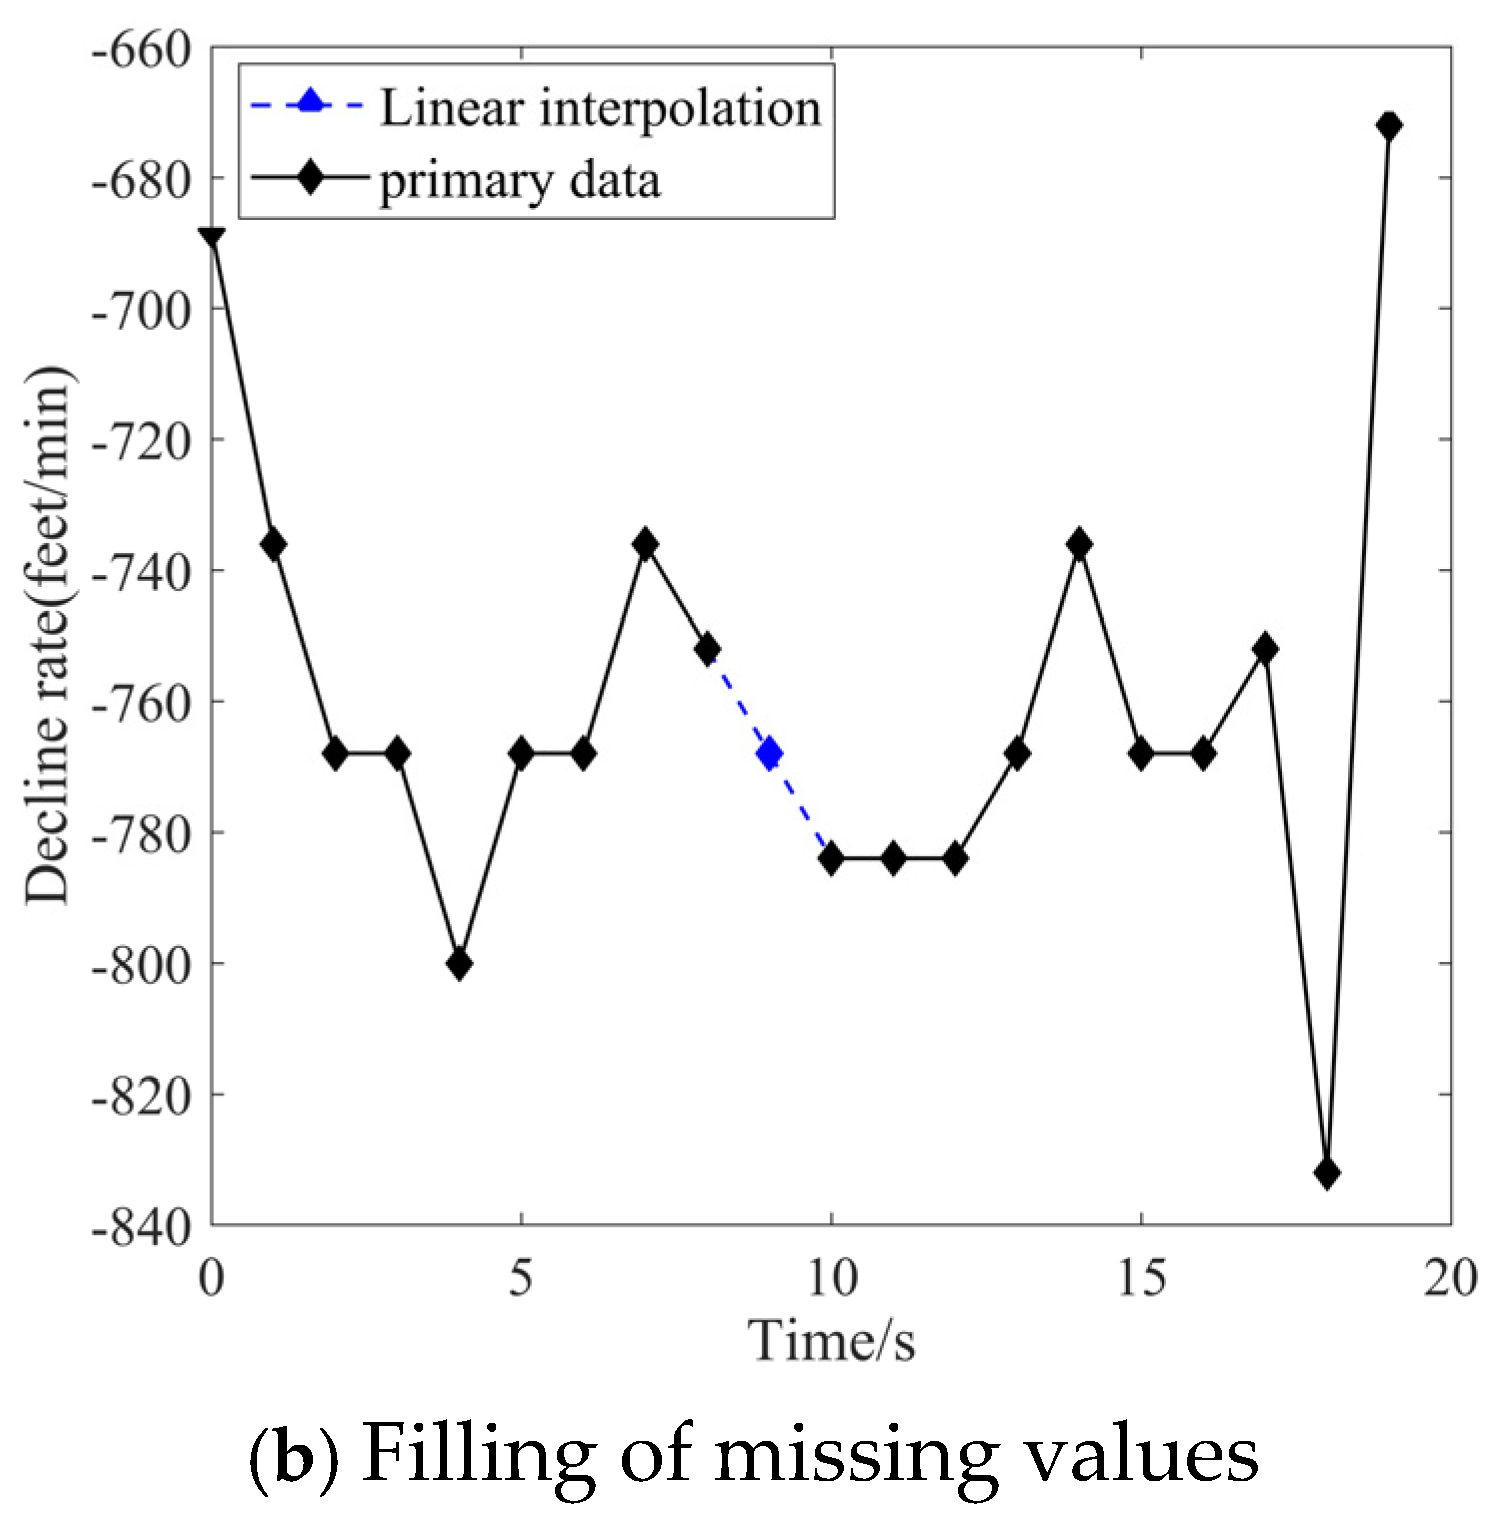
2.2.2. Outlier Detection
2.2.3. Data Standardization
2.3. Feature Dimensionality Reduction
2.3.1. Max-Relevance and Min-Redundancy Algorithm
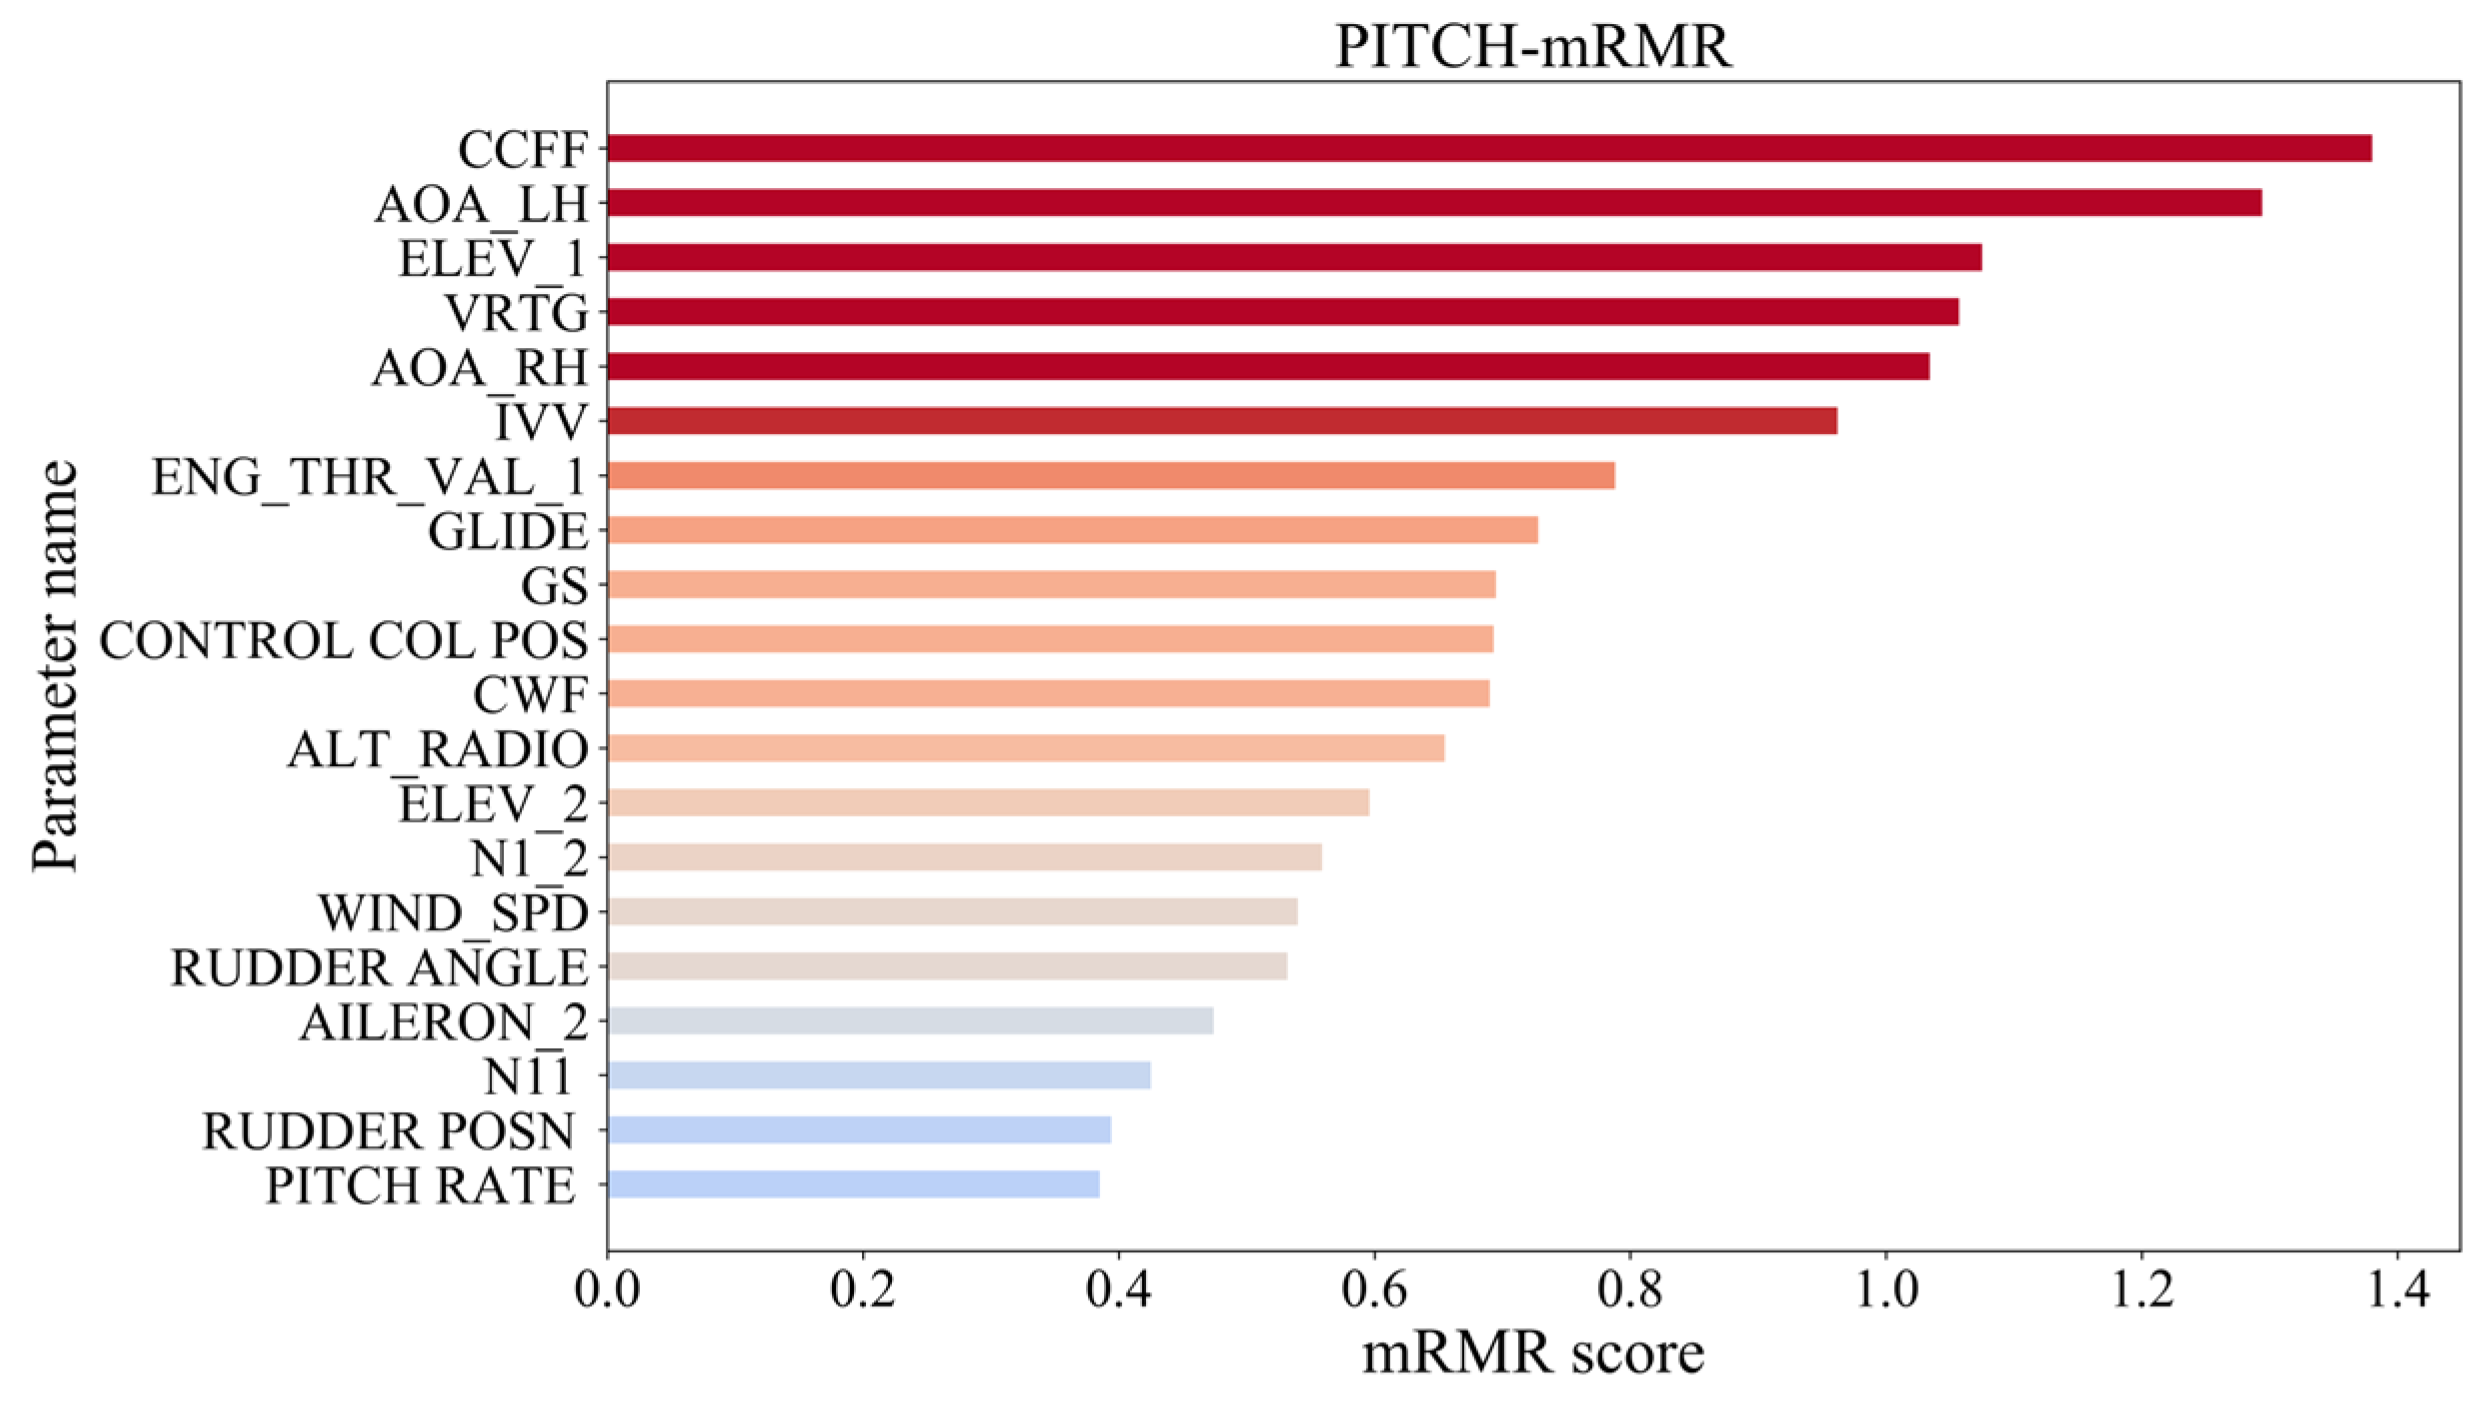
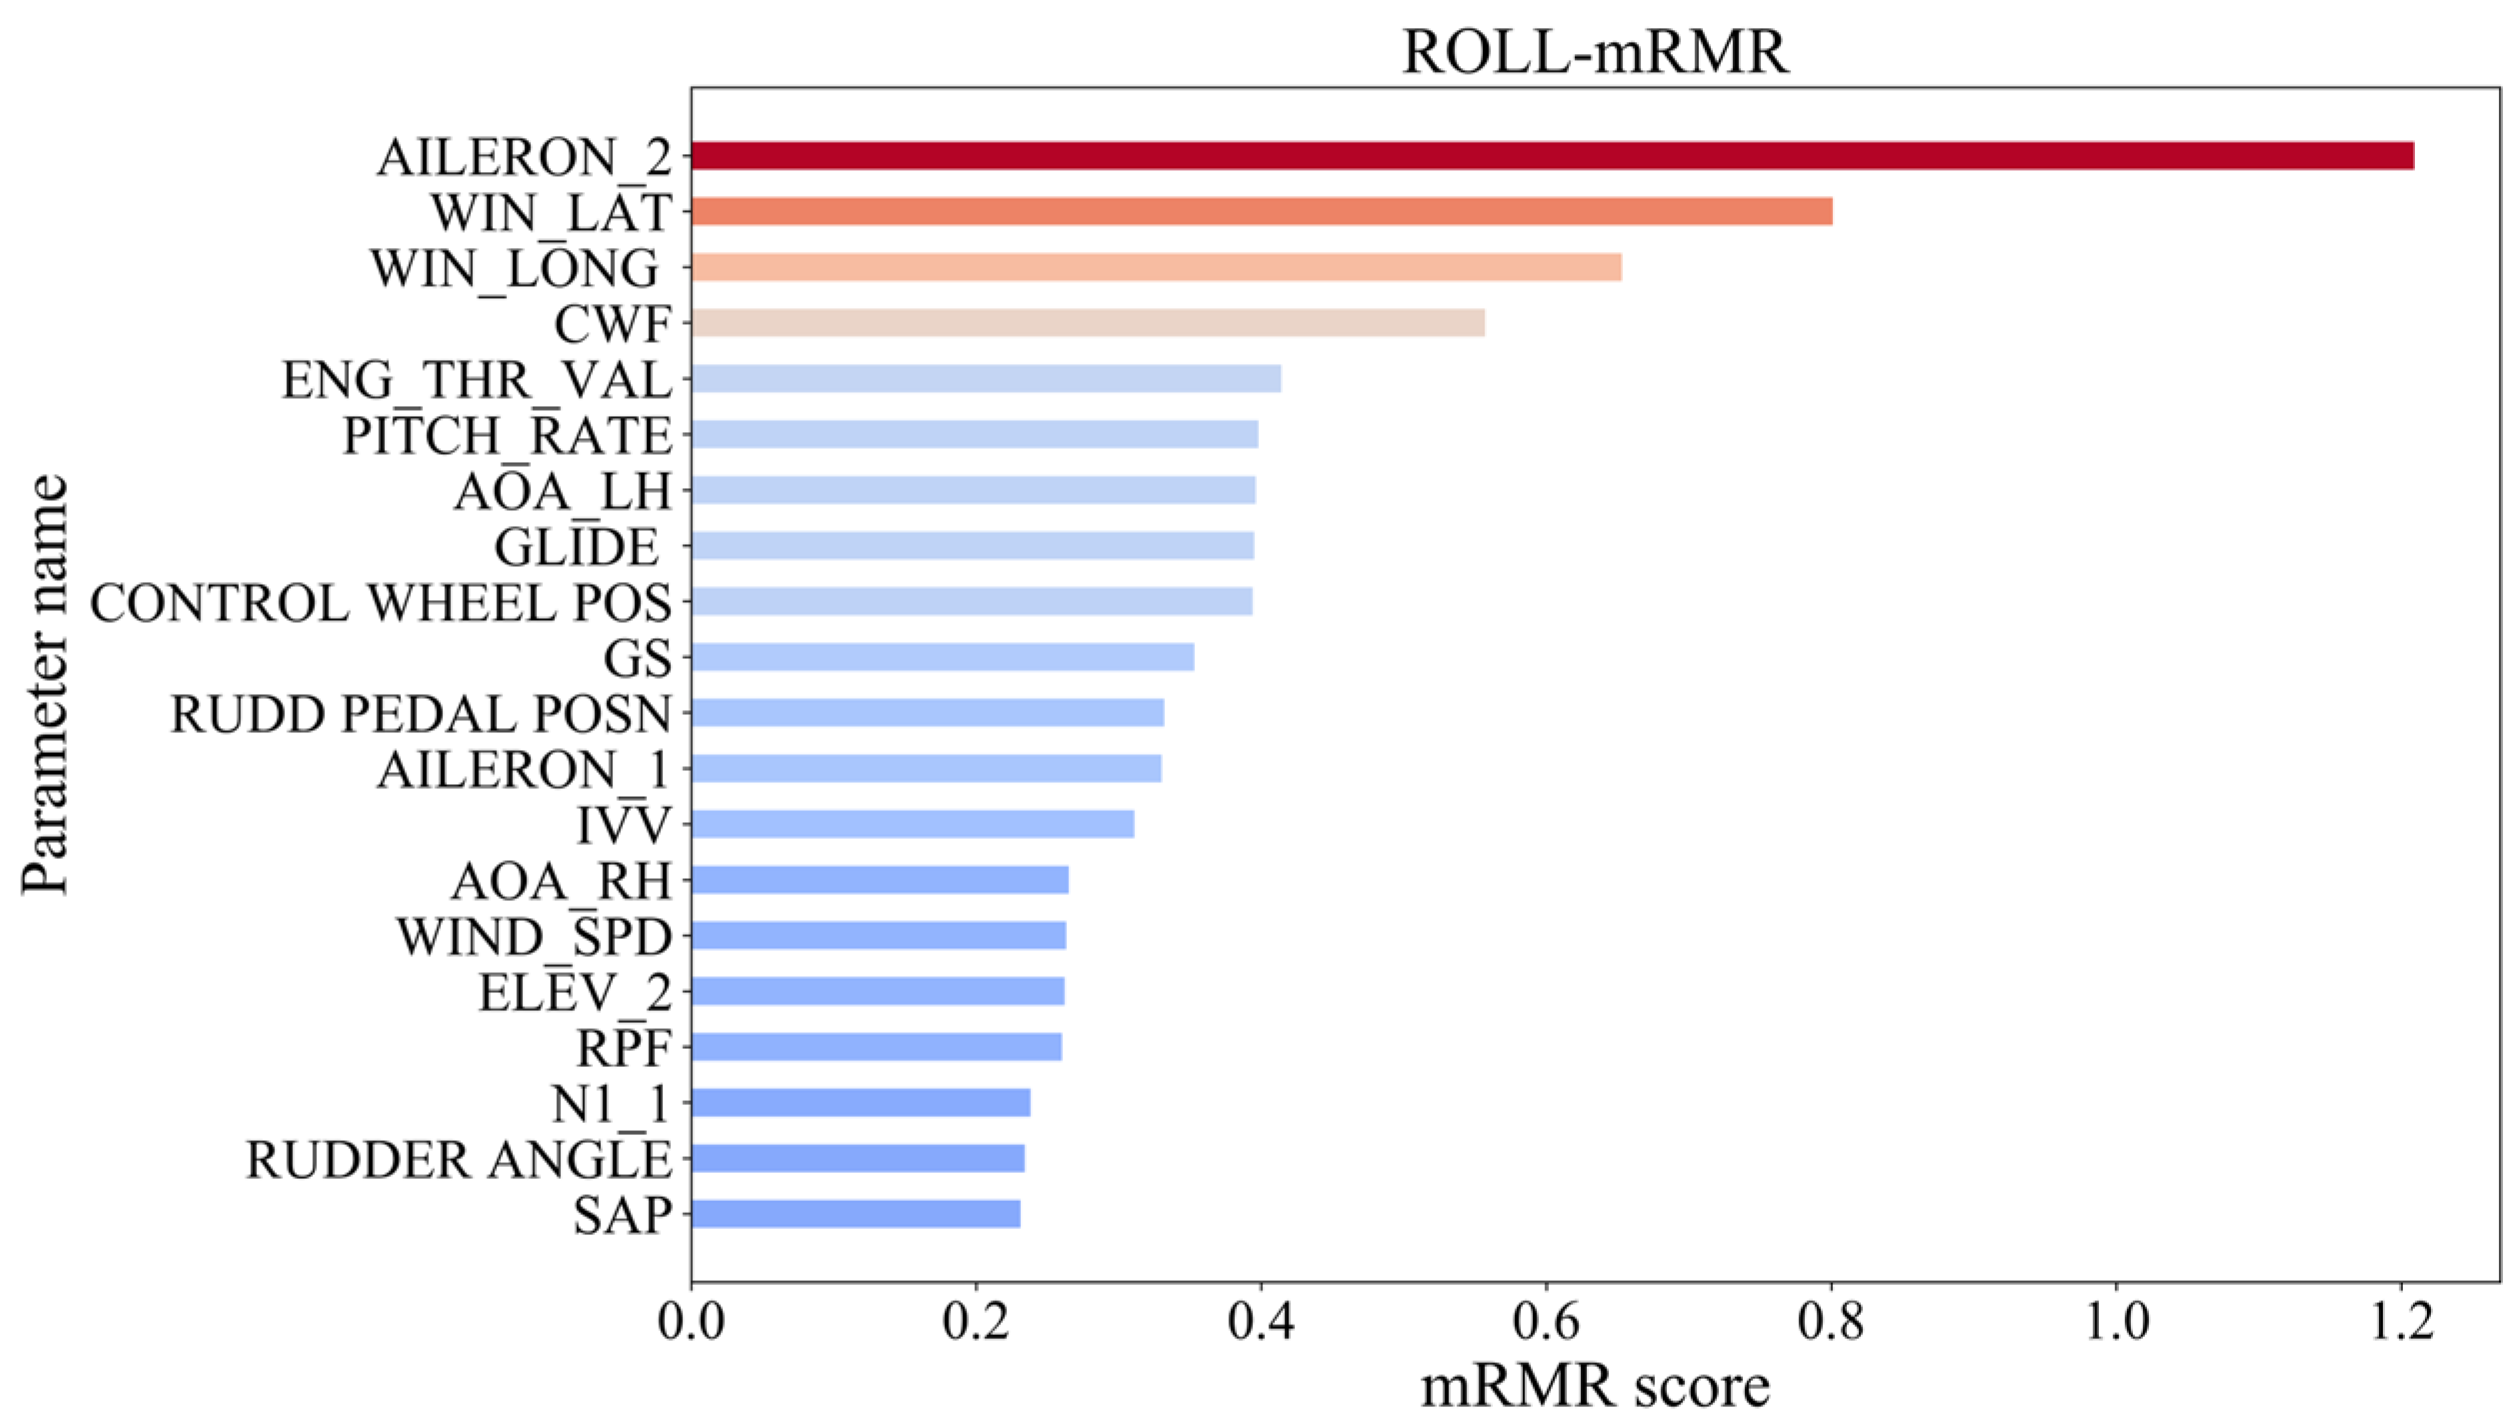
2.3.2. Results of Feature Dimensionality Reduction
2.4. Predictive Modeling
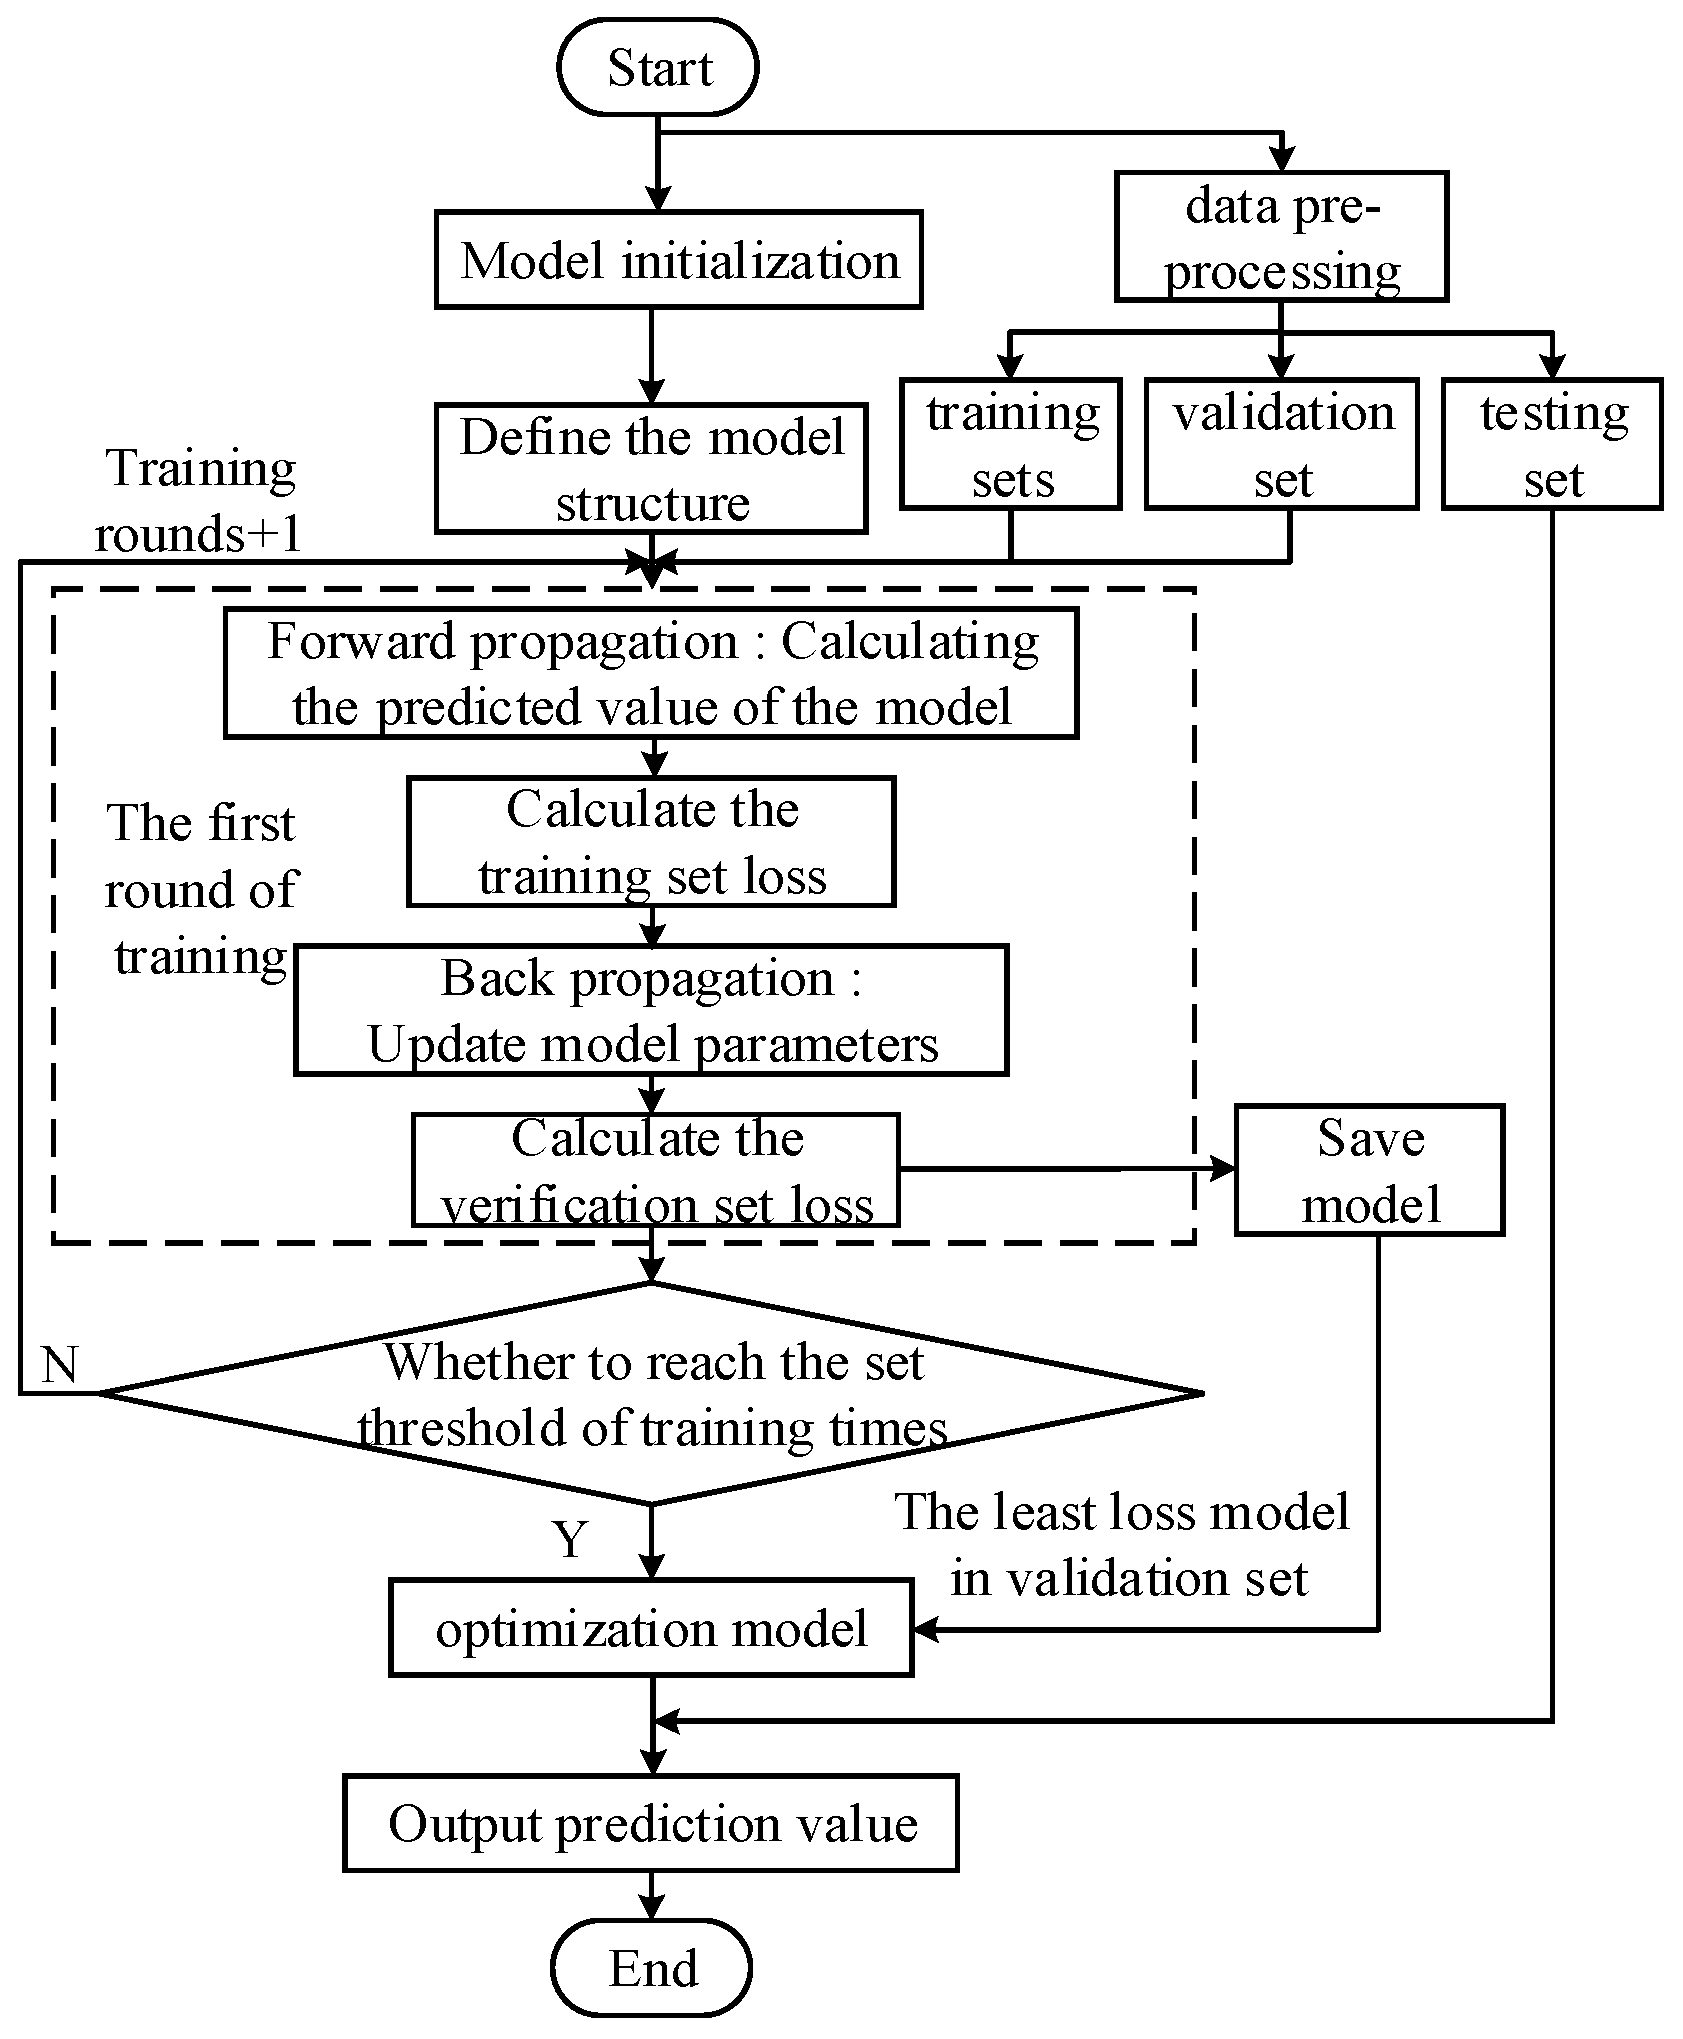
2.4.1. Model Training Process
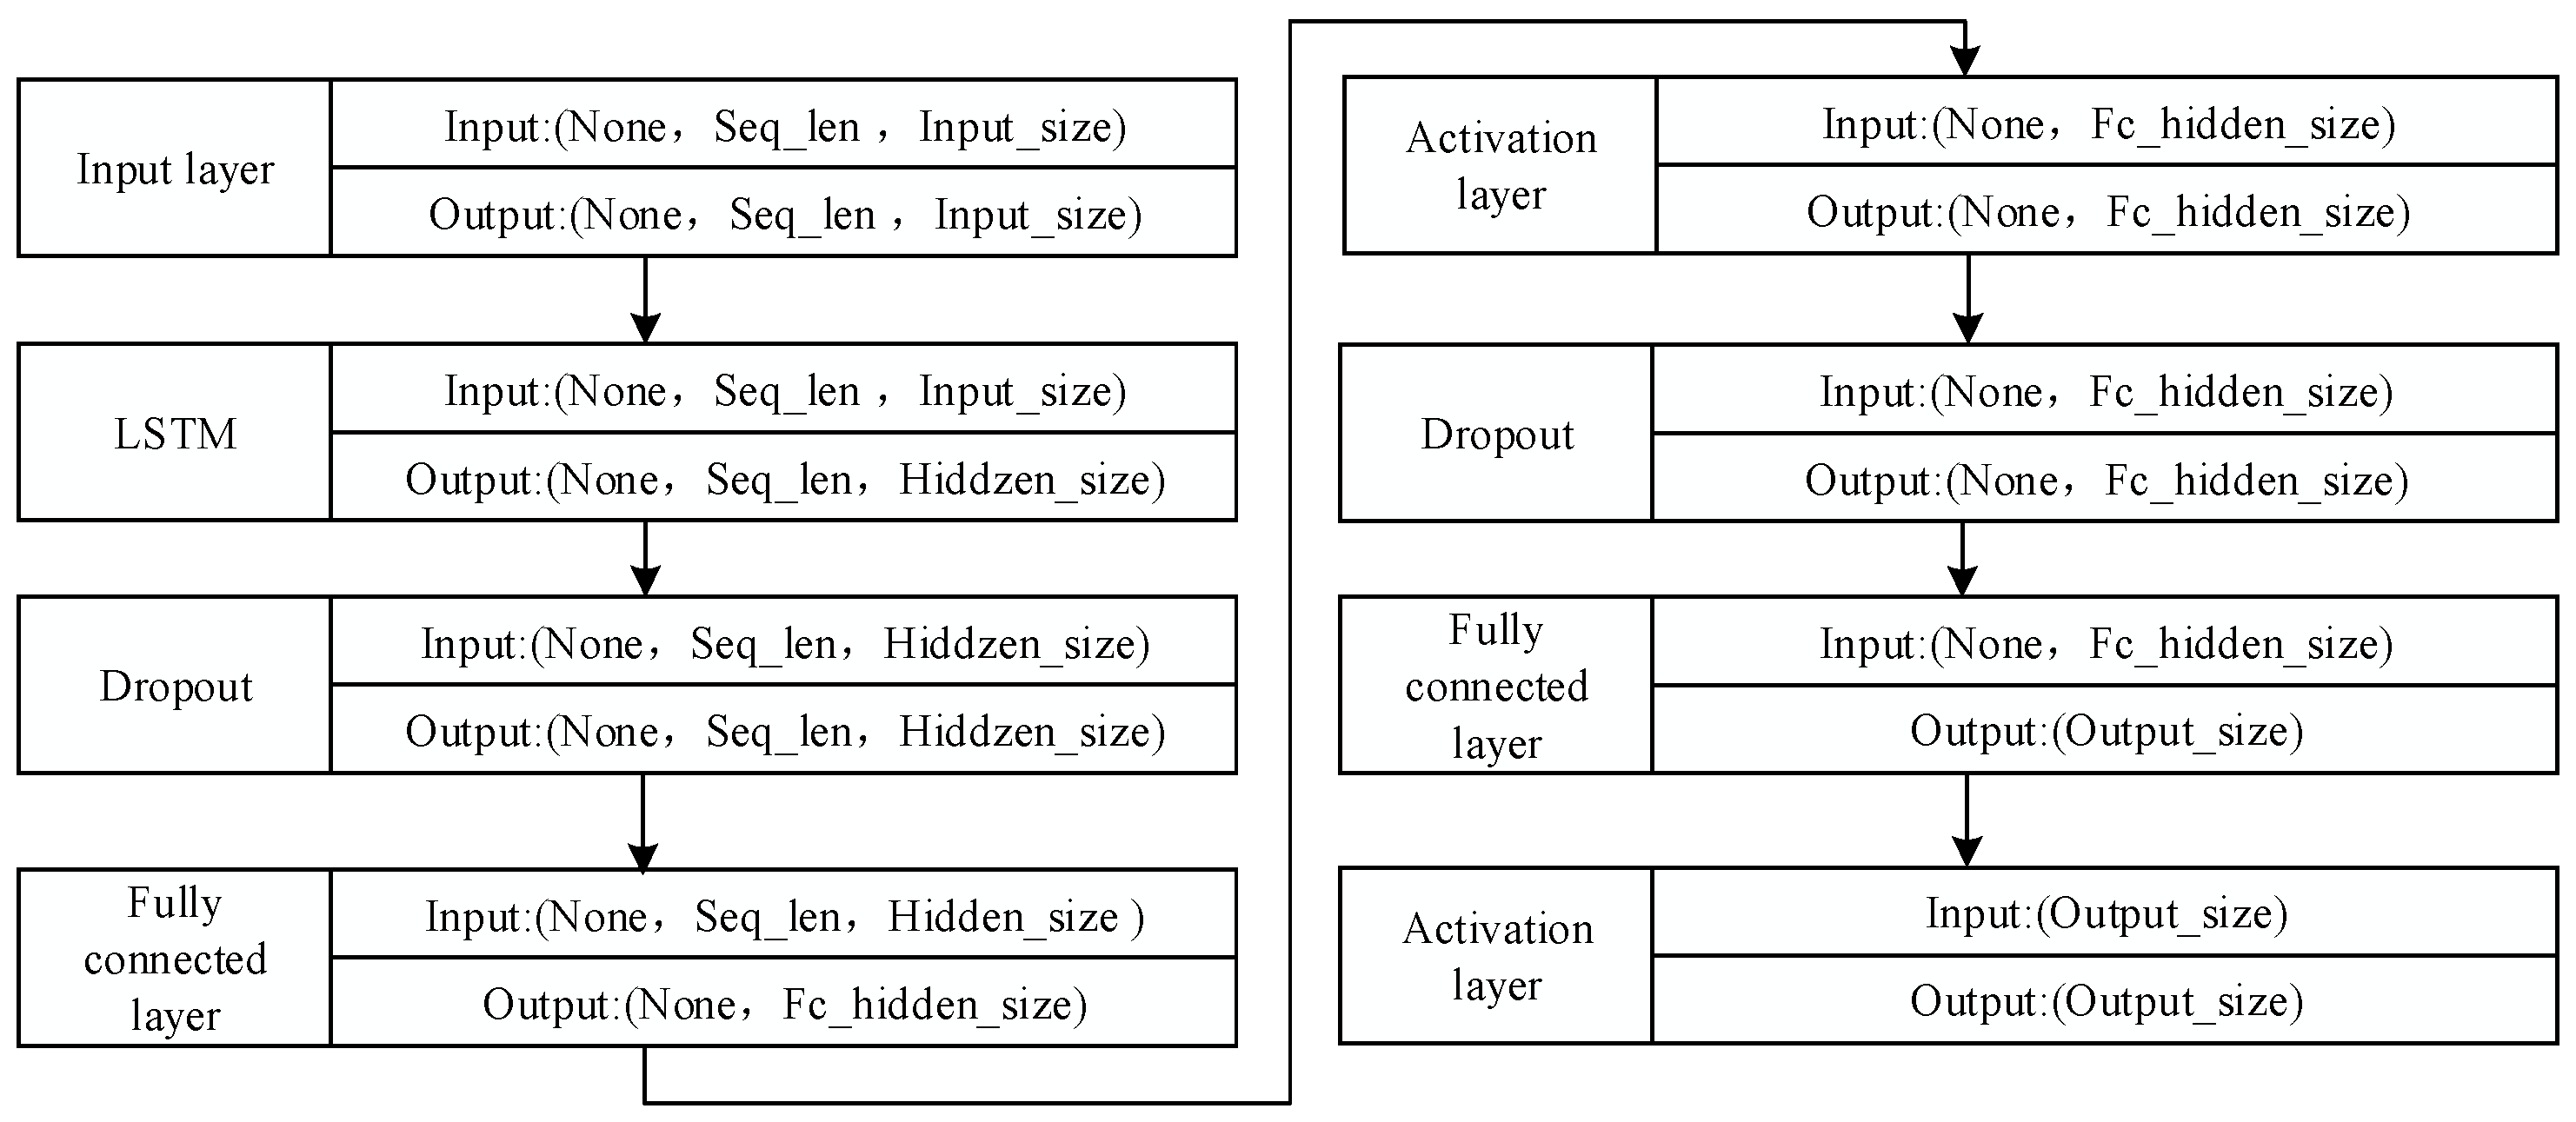
2.4.2. Definition of Model Structure
2.4.3. Optimization of Model Parameters
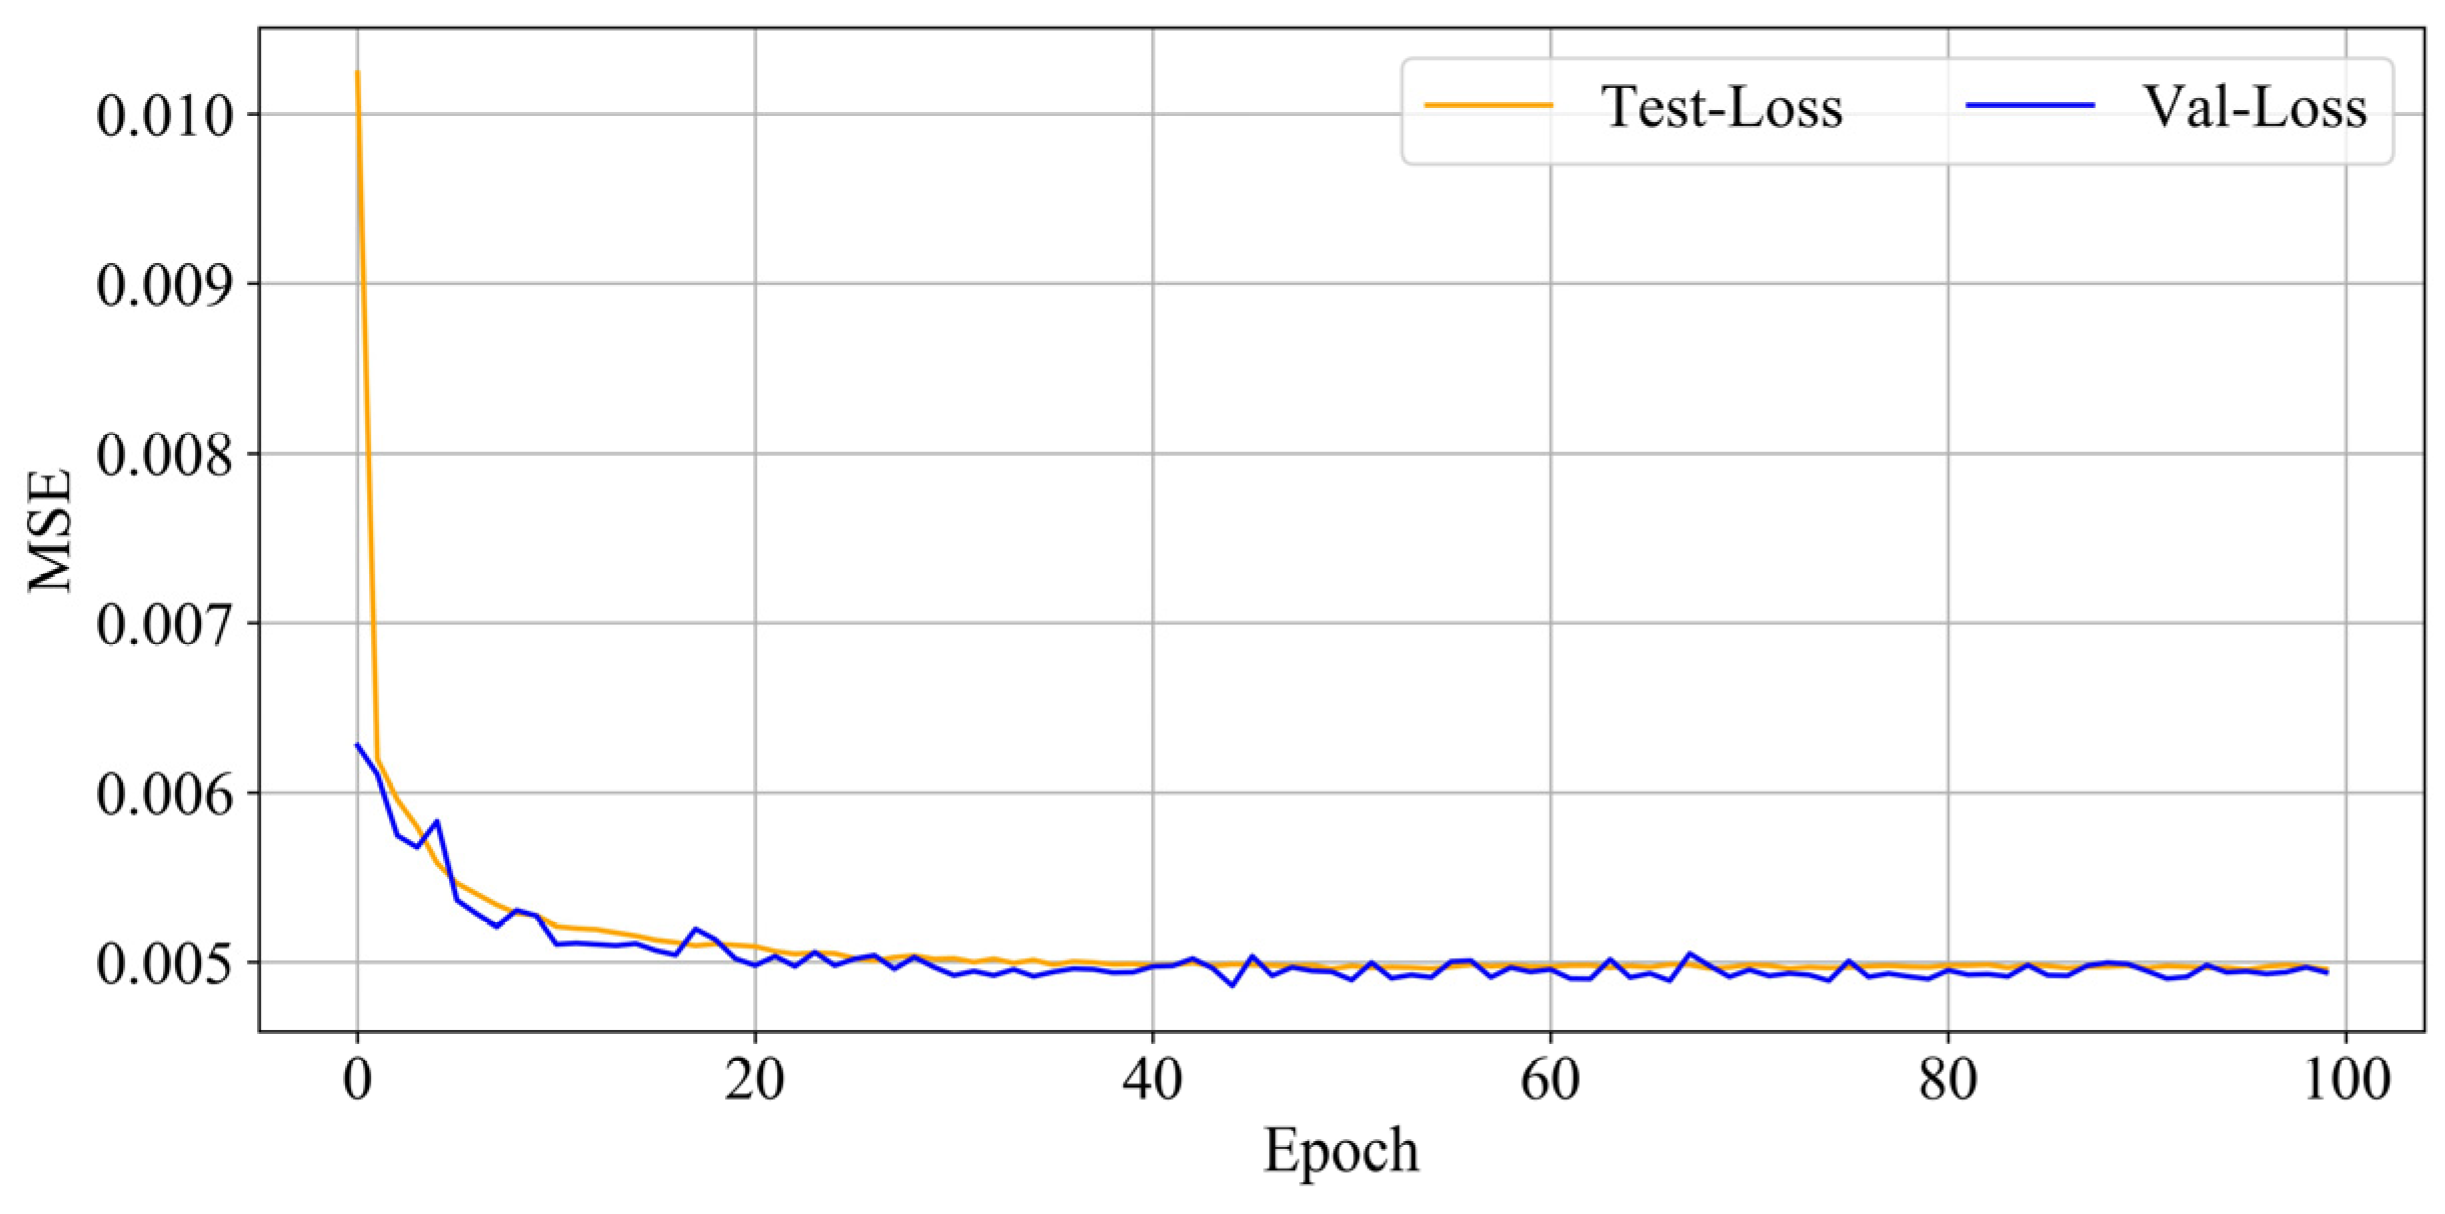
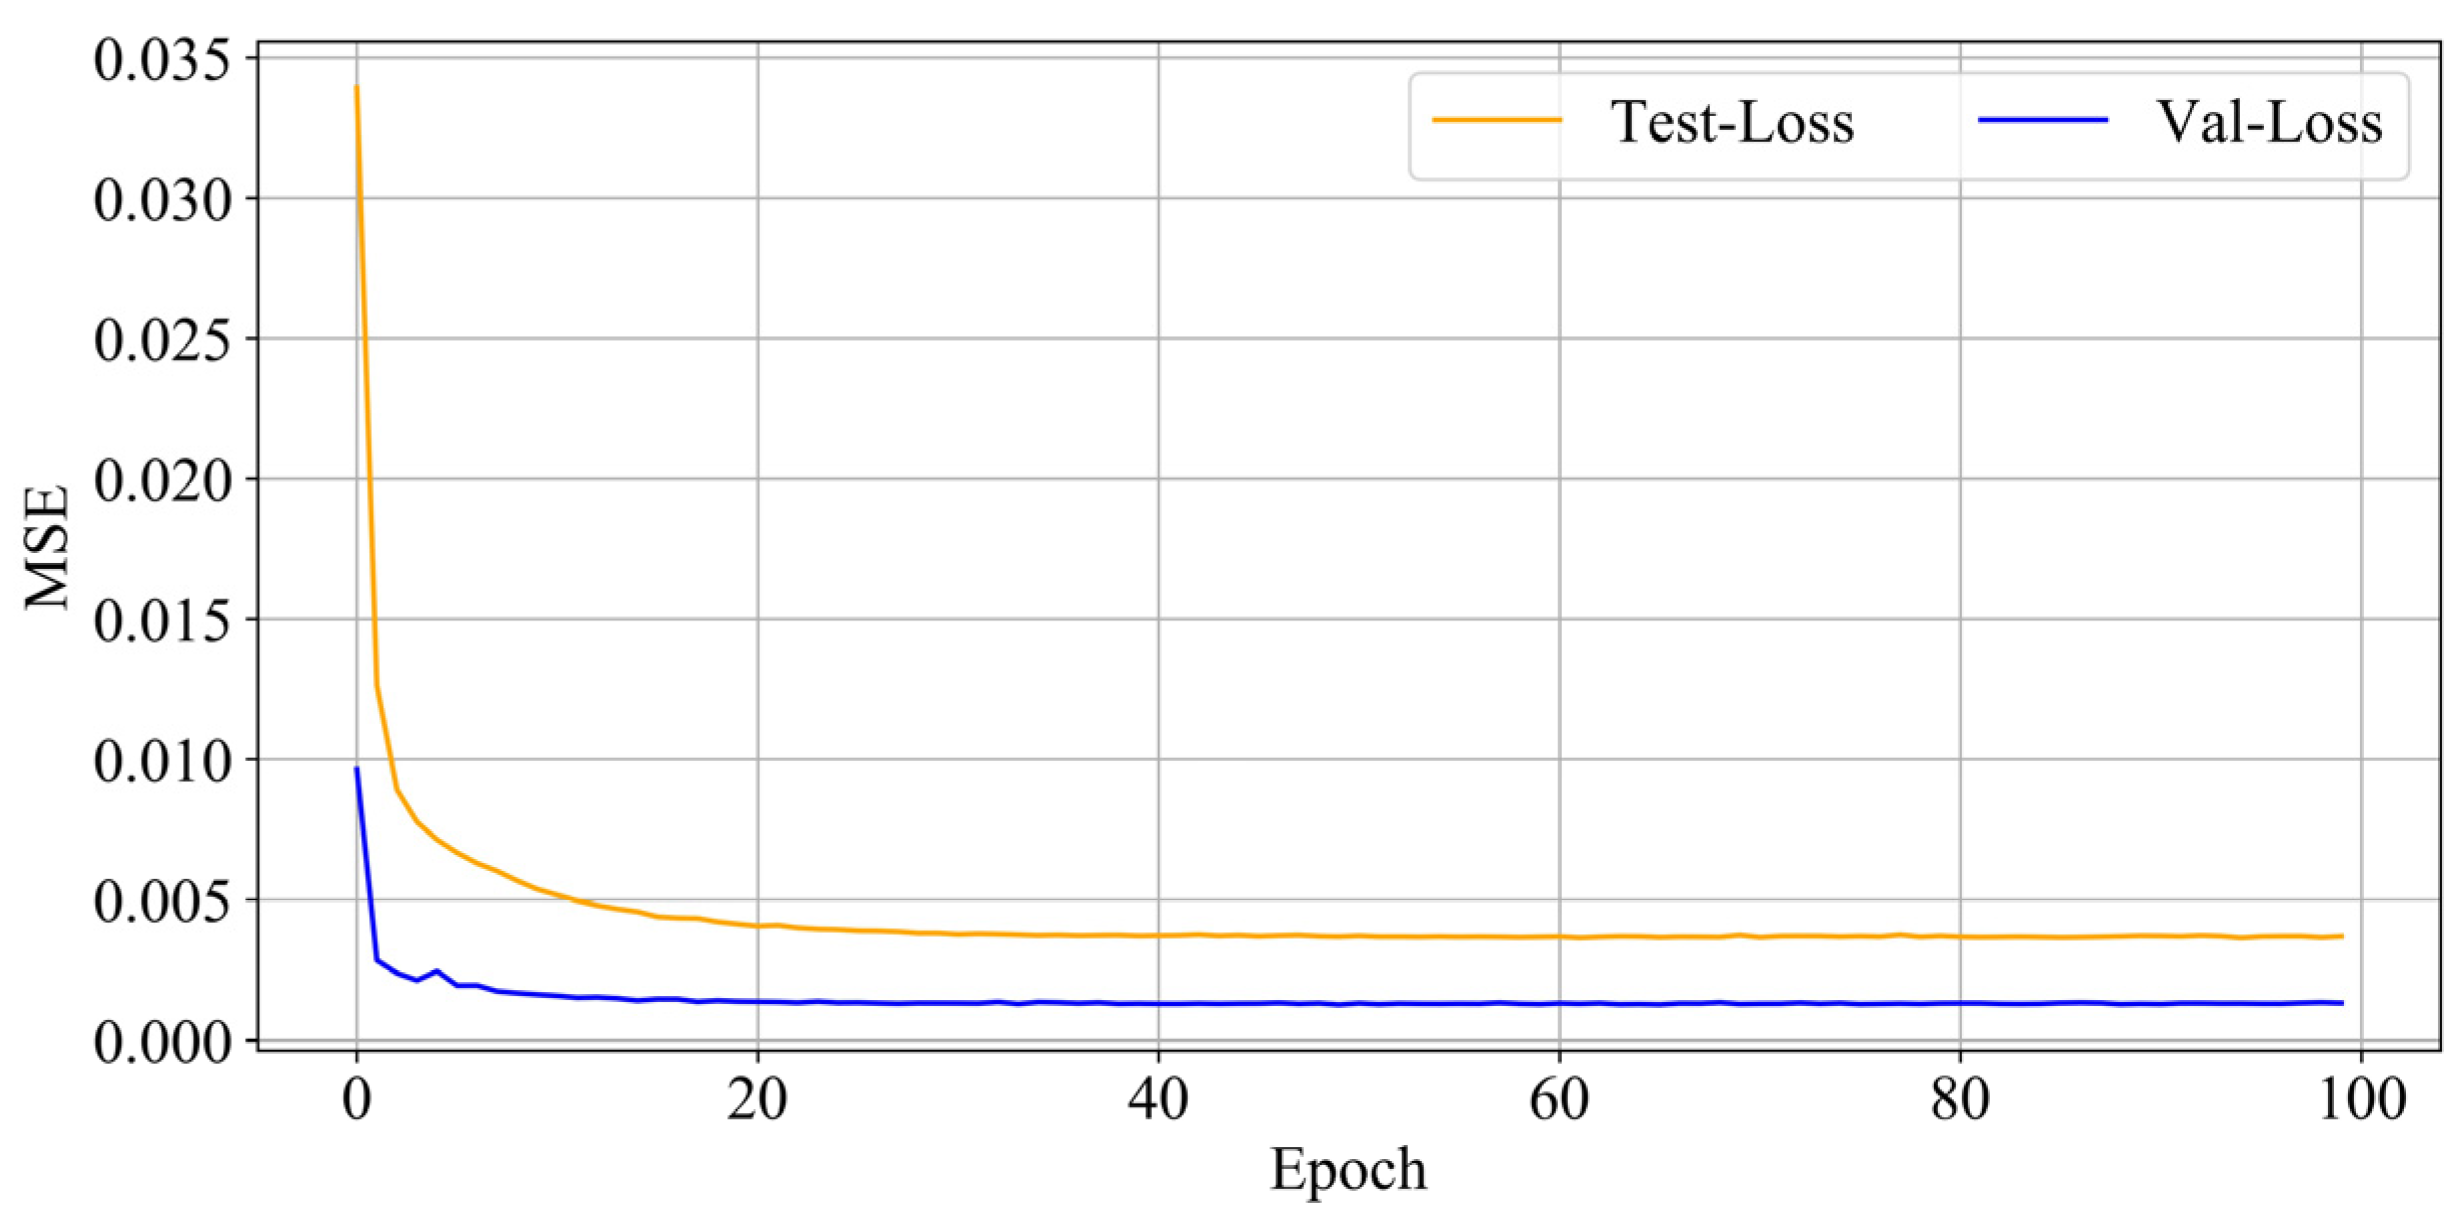
2.4.4. Model Training Effects
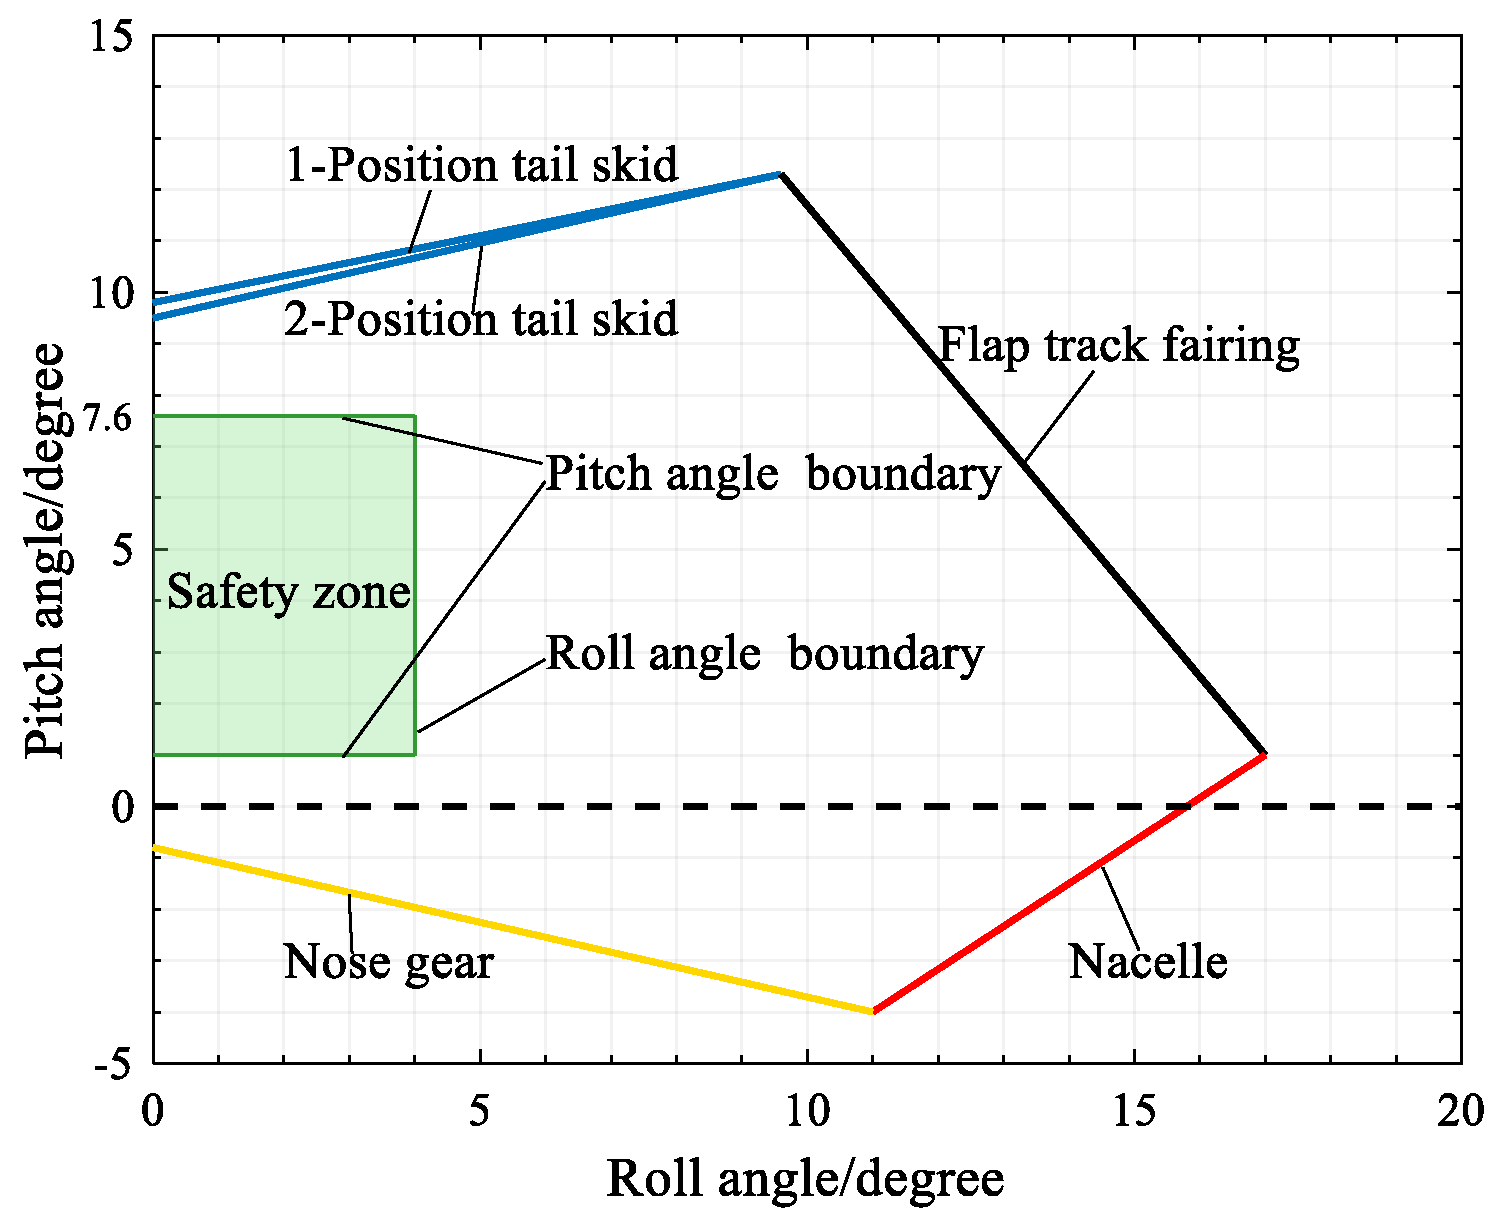
2.5. Landing Attitude Ultra-Limit Judgment Criteria
3. System Performance Verification and Analysis
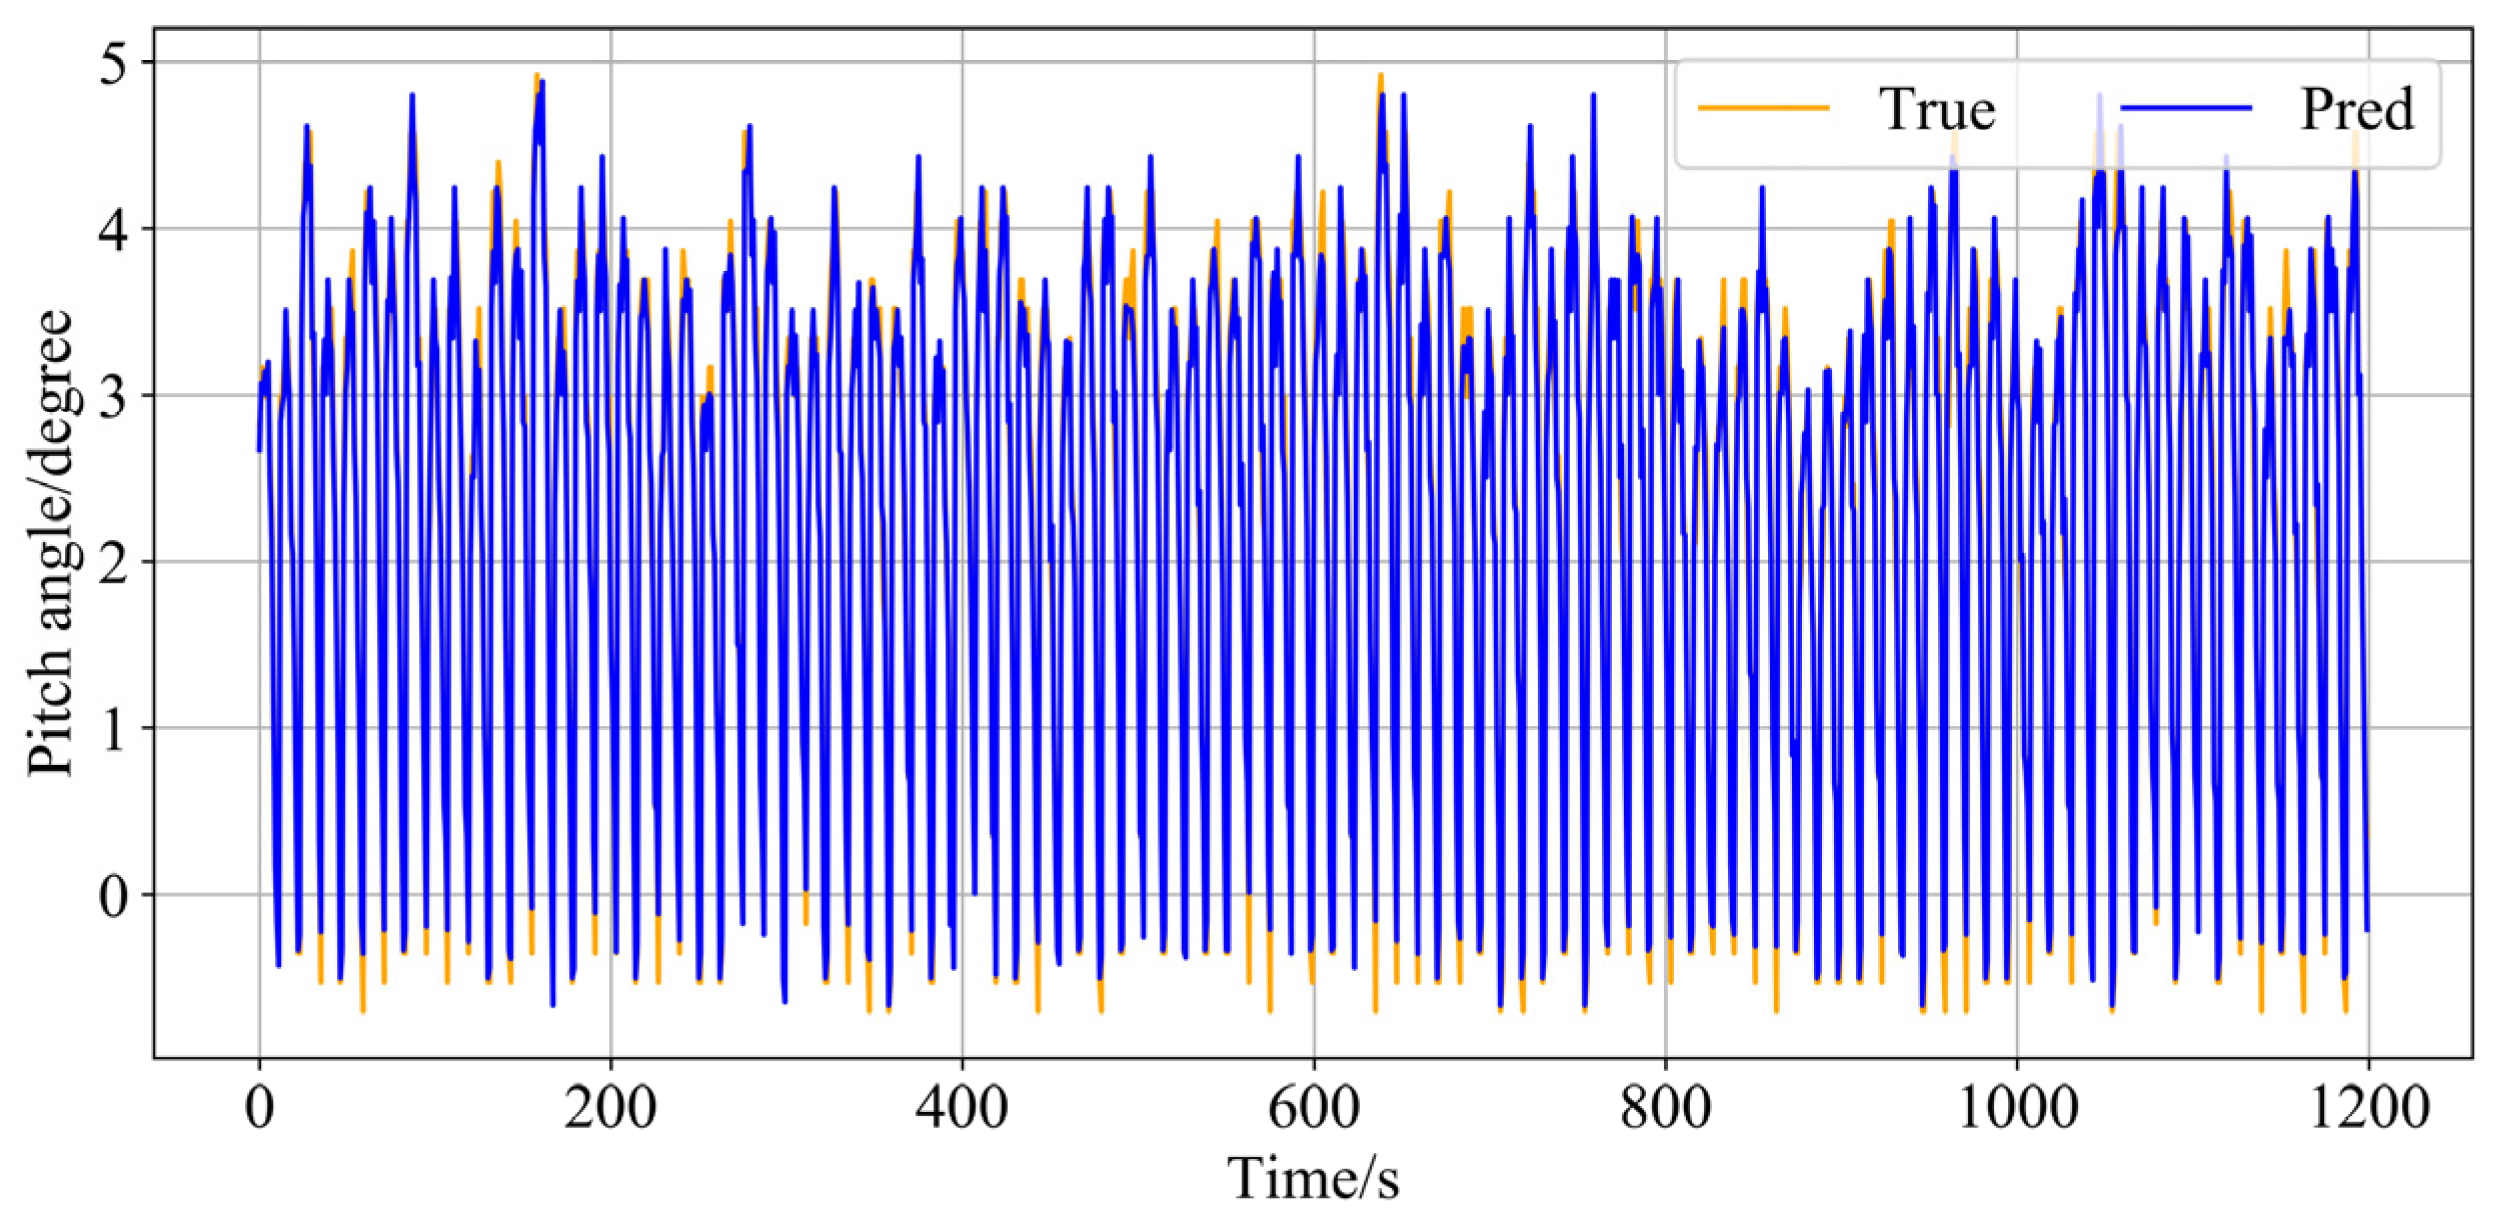
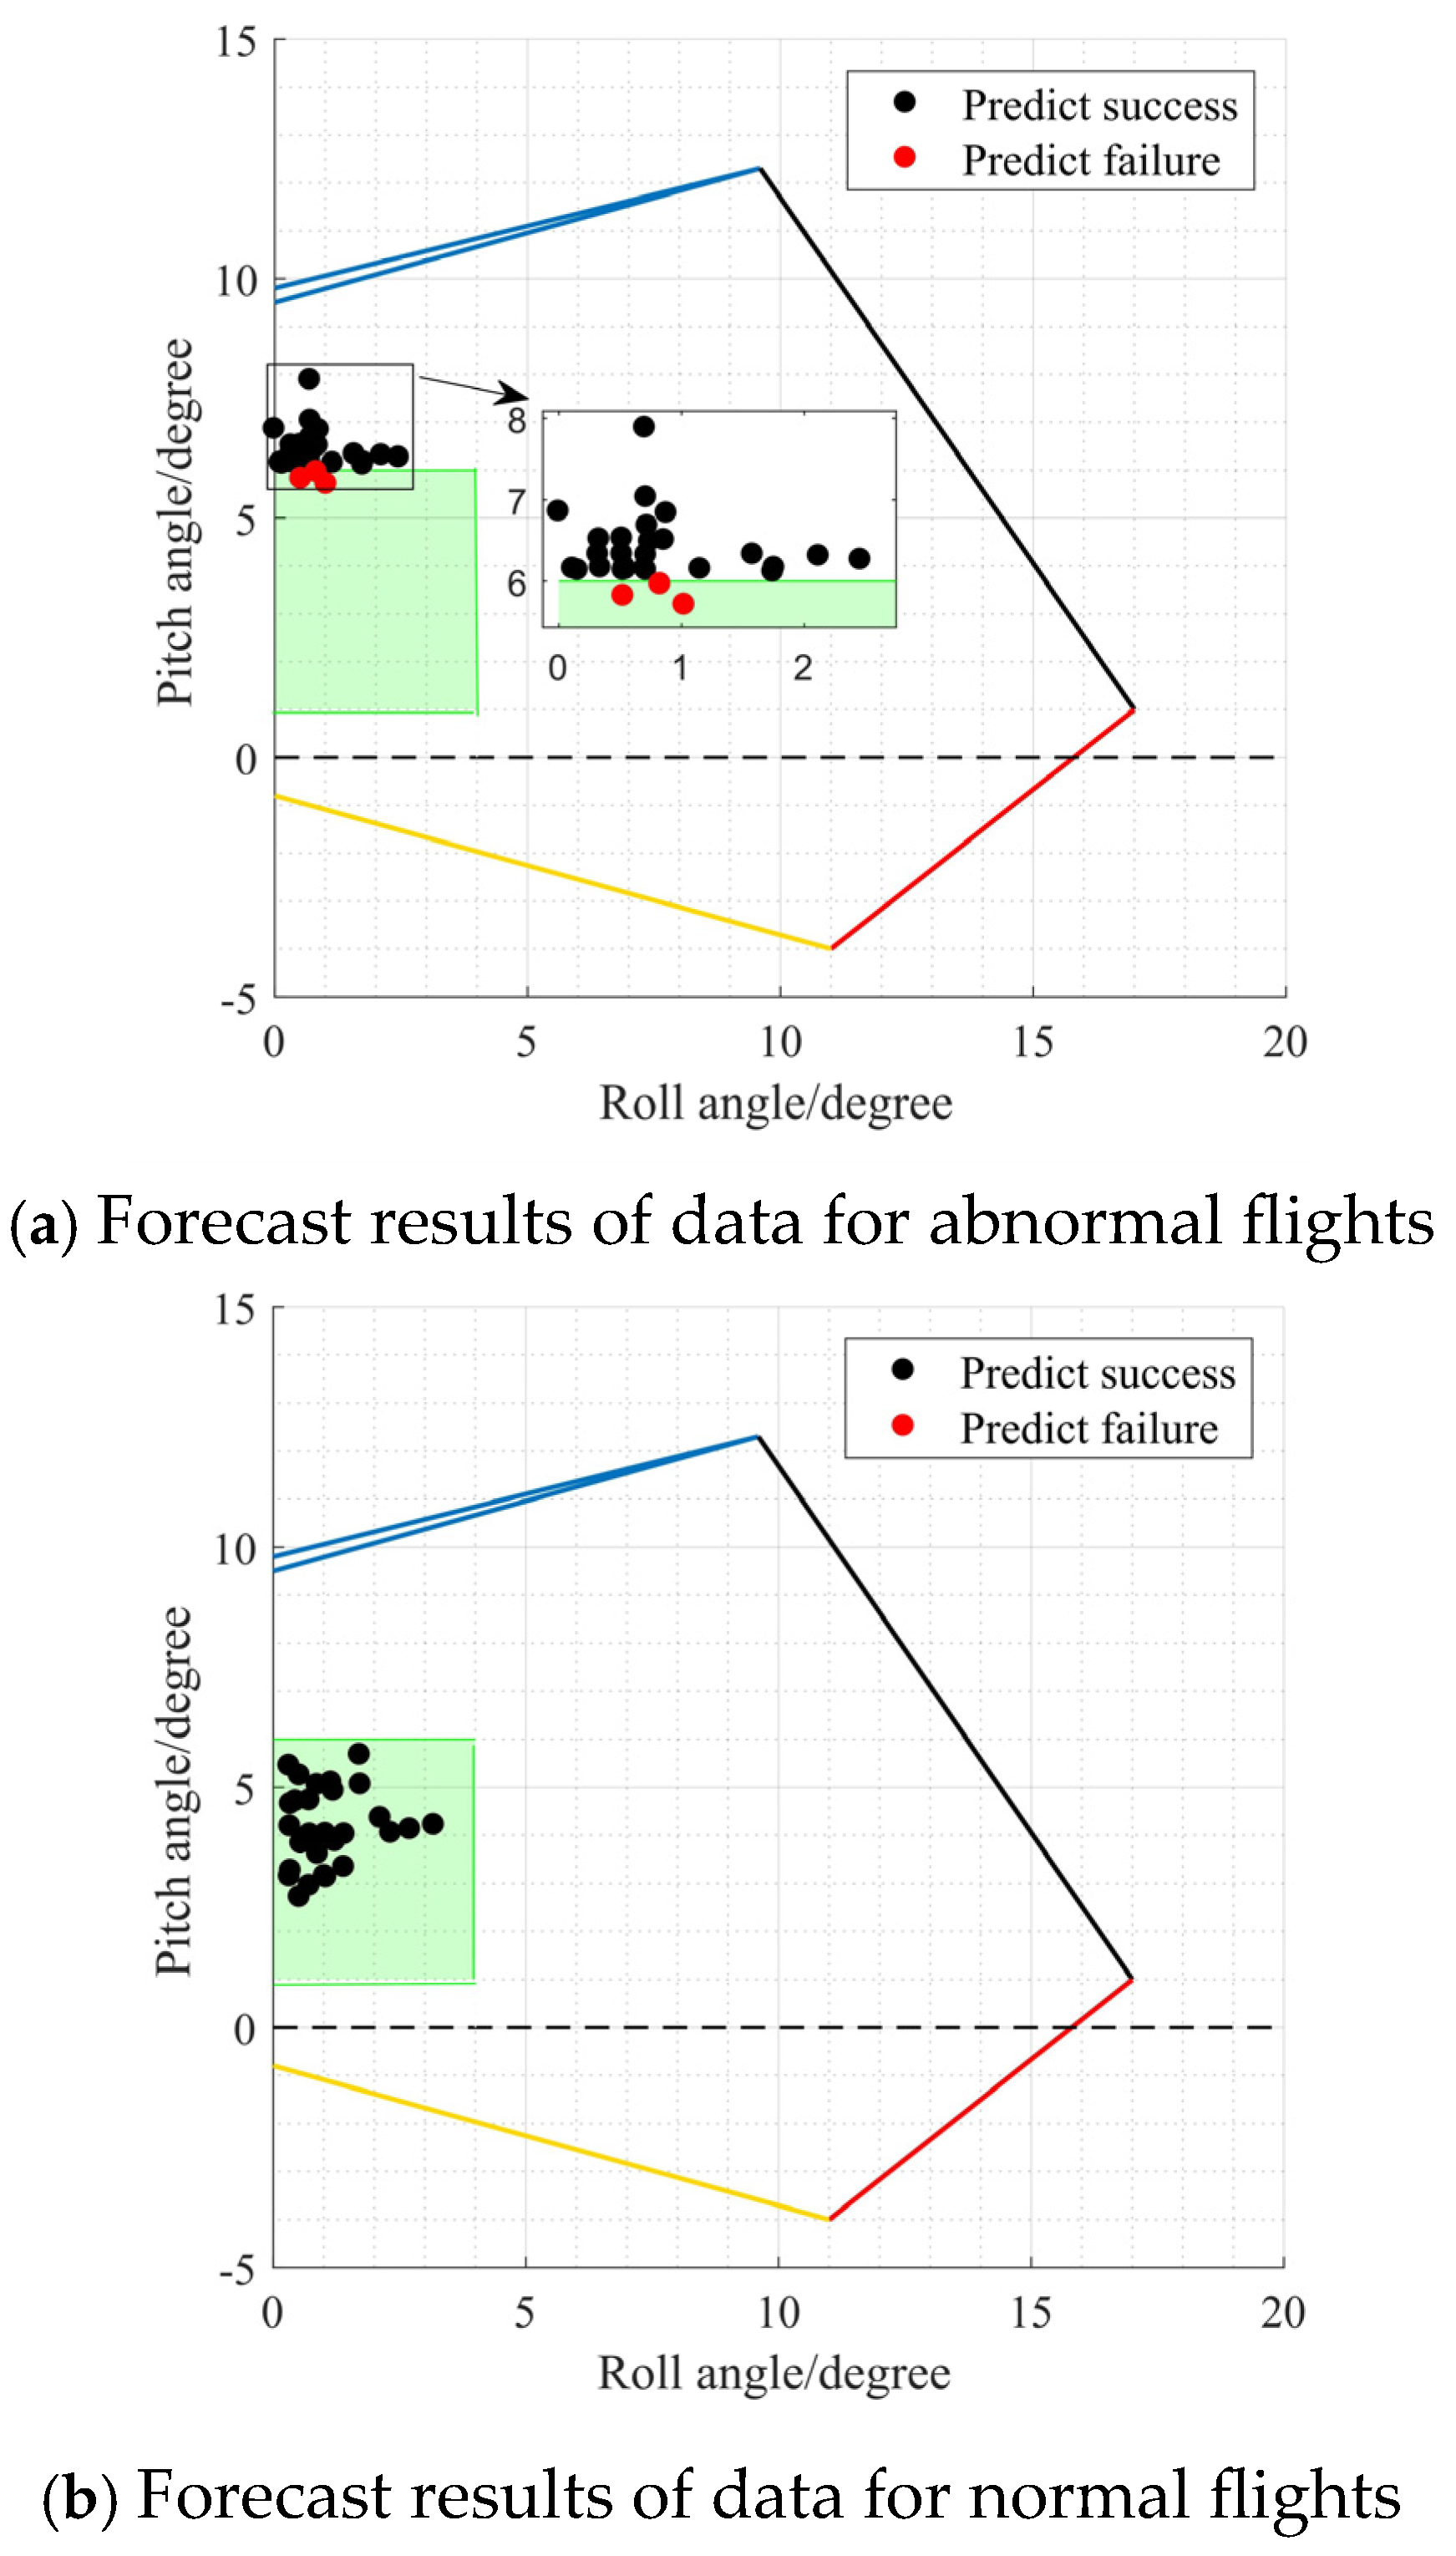
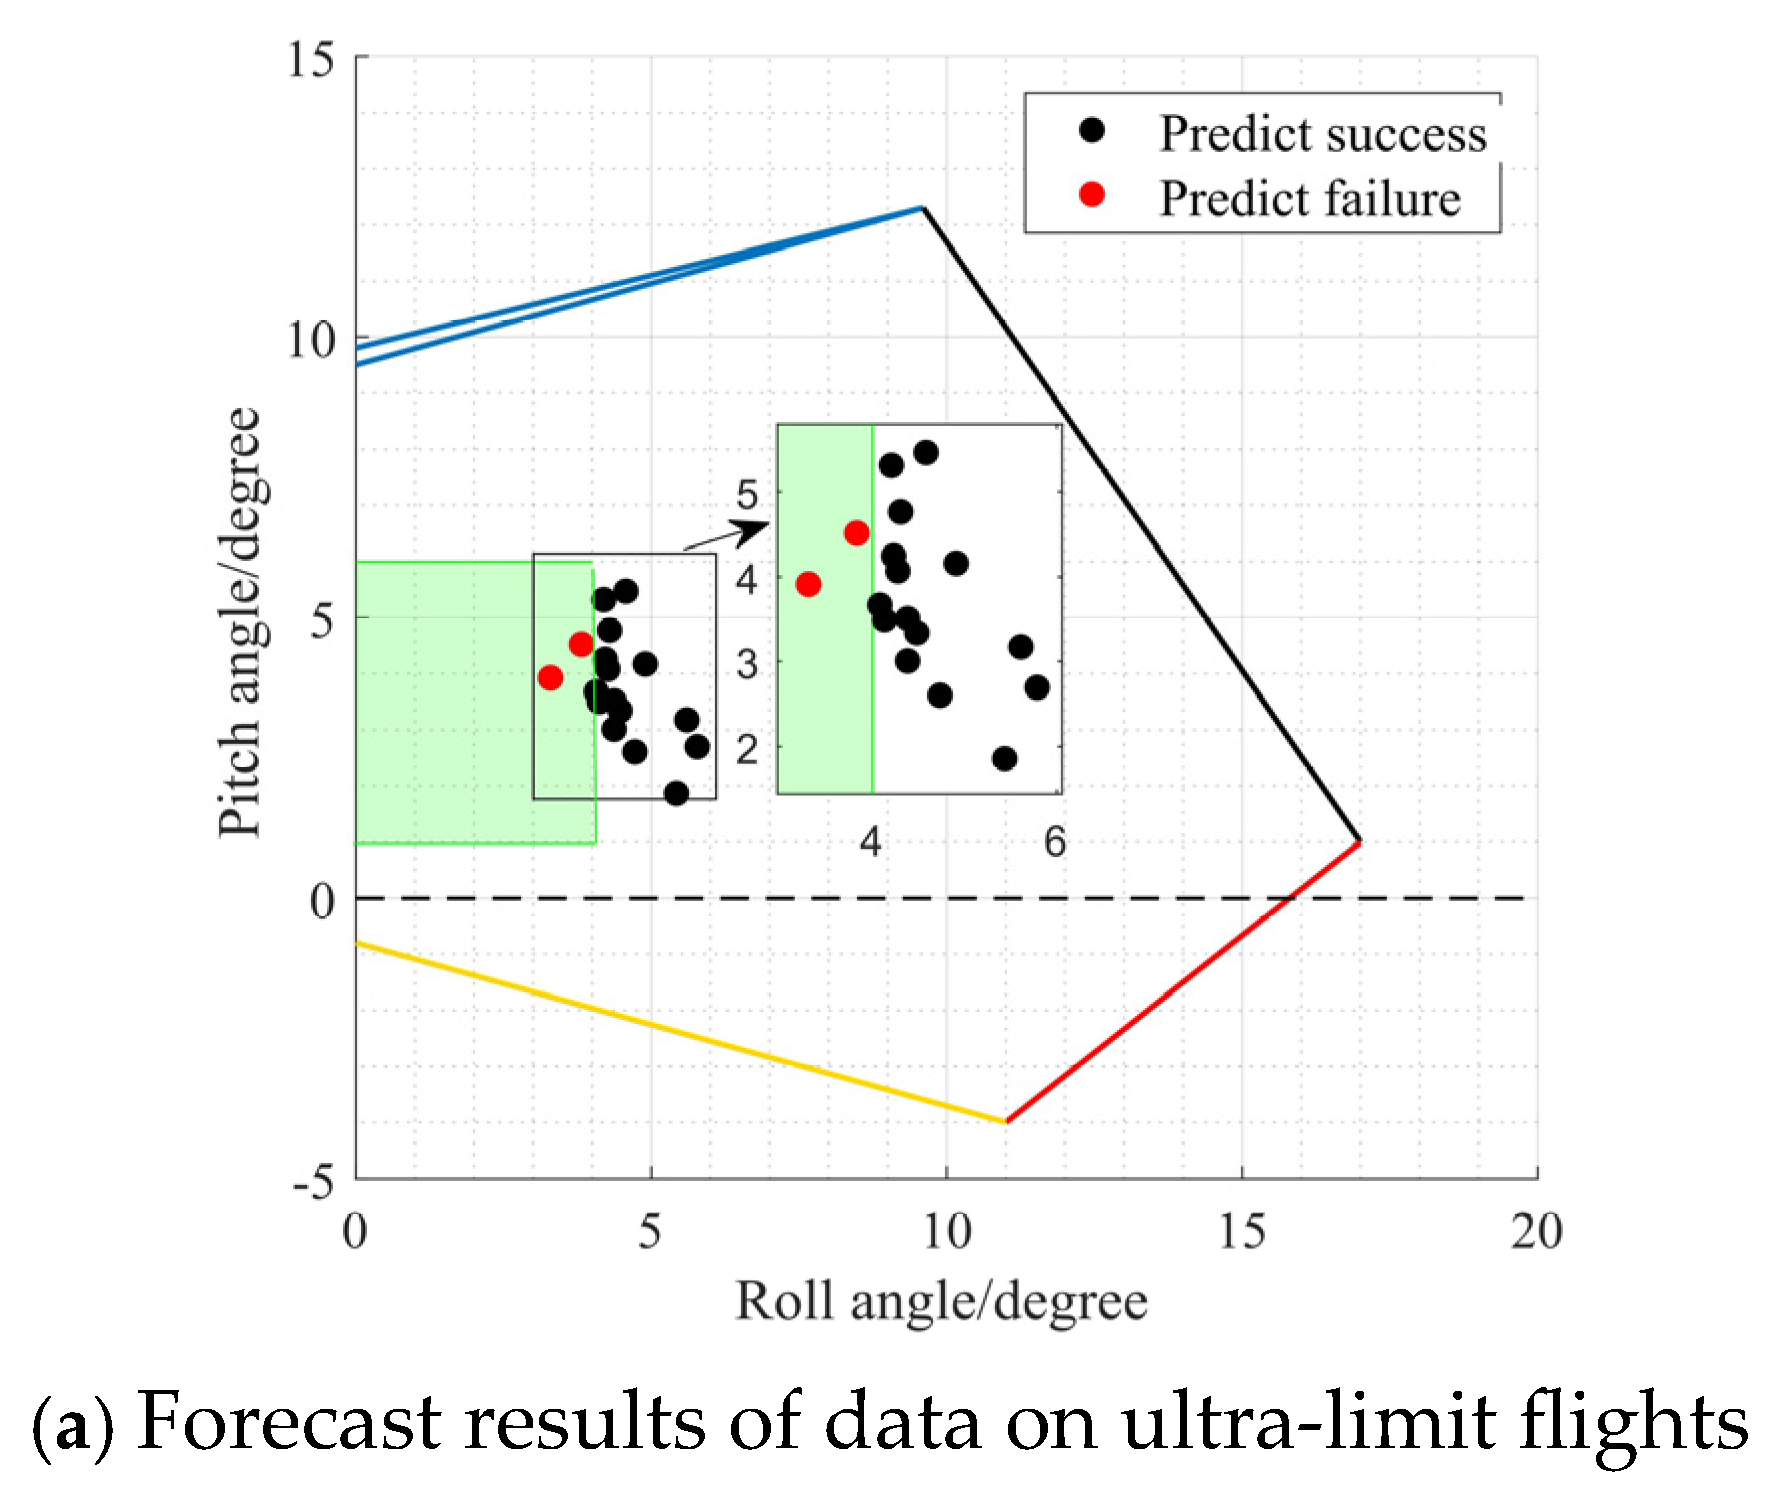
3.1. Visualization of Evaluations
3.2. Quantitative Evaluation
4. Conclusions
Author Contributions
Funding
Data Availability Statement
Conflicts of Interest
Abbreviations
| AILERON 1/2 | Aileron Angle (Left/Right Channel) |
| ALT_RADIO | Radio Altitude |
| AOA_LH | Angle of Attack (Left Probe) |
| AOA_RH | Angle of Attack (Right Probe) |
| CCFF | Control Wheel Force |
| CONTROL COL POS | Control Column Position |
| CONTROL WHEEL POS | Control Wheel Position |
| CWF | Control-Wheel Force |
| ELEV 1/2 | Rudder Angle |
| ENG_THR_VAL | Engine Thrust Lever Value |
| GLIDE | Glide-Slope Deviation |
| GS | Ground Speed |
| Hidden_size | hidden layer |
| IVV | Instantaneous Vertical Velocity |
| Input_size | Input parameter |
| LSTM | Long Short-Term Memory |
| LOF | Local Outlier Factor |
| N1_1/N1_2 | N1 Fan Speed (Left/Right Engine) |
| QAR | Quick Access Recorder |
| RPF | Rudder-Pedal Force |
| RUDD PEDAL POSN | Rudder-Pedal Position |
| mRMR | Max-Relevance and Min-Redundancy |
| SAP | Static Air Pressure |
| Seq_len | Input sequence |
| VRTG | Vertical Acceleration |
| WIND_SPD | Wind Speed (Total) |
| WIN_LAT | Lateral Wind Component |
| WIN_LONG | Longitudinal Wind Component |
References
- Wang, L.; Sun, R.S.; Wu, C.X.; Cui, Z.X.; Lu, Z. A flight QAR data based model for hard landing risk quantitative evaluation. China Saf. Sci. J. 2014, 24, 88–92. [Google Scholar]
- Sun, R.S.; Yang, Y.; Wang, L. Study on flight safety evaluation based on QAR data. China Saf. Sci. J. 2015, 25, 87–92. [Google Scholar] [CrossRef]
- Li, L.; Gariel, M.; Hansman, R.J.; Palacios, R. Anomaly detection in onboard-recorded flight data using cluster analysis. In Proceedings of the 2011 IEEE/AIAA 30th Digital Avionics Systems Conference, New York, NY, USA, 16–20 October 2011; p. 4A4-1. [Google Scholar]
- Das, S.; Li, L.; Srivastava, A.; Hansman, R.J. Comparison of algorithms for anomaly detection in flight recorder data of airline operations. In Proceedings of the 12th AIAA Aviation Technology, Integration, and Operations (ATIO) Conference and 14th AIAA/ISSMO Multidisciplinary Analysis and Optimization Conference, Reston, VA, USA, 17–19 September 2012; p. 5593. [Google Scholar]
- Li, L.; Das, S.; Hansman, R.J.; Palacios, R.; Srivastava, A.N. Analysis of flight data using clustering techniques for detecting abnormal operations. J. Aerosp. Inf. Syst. 2015, 12, 587–598. [Google Scholar] [CrossRef]
- Li, L.; Hansman, R.J.; Palacios, R.; Welsch, R. Anomaly detection via a gaussian mixture model for flight operation and safety monitoring. Transp. Res. Part C Emerg. Technol. 2016, 64, 45–57. [Google Scholar] [CrossRef]
- Ayra, E.S.; Insua, D.R.; Cano, J. Bayesian network for managing runway overruns in aviation safety. J. Aerosp. Inf. Syst. 2019, 16, 546–558. [Google Scholar] [CrossRef]
- Sun, H.; Xie, J.; Jiao, Y.; Huang, R.; Lu, B. Event Detection and Spatio-temporal Analysis of Low-Altitude Unstable Approach. Appl. Sci. 2020, 10, 4934. [Google Scholar] [CrossRef]
- Xie, J.; Sun, H.; Wang, C.; Lu, B. Analysis of Influence Factors for Unstable Approach in Fine- Grained Scale. Geomat. Inf. Sci. Wuhan Univ. 2021, 46, 1201–1208. [Google Scholar]
- Li, X.; Shang, J.; Zheng, L.; Lu, B. Curve Cluster: Automated recognition of hard landing patterns based on QAR curve clustering. In Proceedings of the 2019 IEEE SmartWorld, Ubiquitous Intelligence & Computing, Advanced & Trusted Computing, Scalable Computing & Communications, Cloud & Big Data Computing, Internet of People and Smart City Innovation (SmartWorld/SCALCOM/UIC/ATC/CBDCom/IOP/SCI), Leicester, UK, 19–23 August 2019; pp. 602–609. [Google Scholar]
- Li, X.; Shang, J.; Zheng, L.; Wang, Q.; Sun, H.; Qi, L. CurveCluster+: Curve Clustering for Hard Landing Pattern Recognition and Risk Evaluation Based on Flight Data. IEEE Trans. Intell. Transp. Syst. 2022, 23, 12811–12821. [Google Scholar] [CrossRef]
- Chatterji, G.B.; Menon, P.K.; Sridhar, B. Vision-based position and attitude determination for aircraft night landing. J. Guid. Control. Dyn. 1998, 21, 84–92. [Google Scholar] [CrossRef]
- Theriault, R.J. Impending Aircraft Tail Strike Warning Display Symbology. US Patent 6,121,899, 19 September 2000. [Google Scholar]
- Chester, D.H. Aircraft landing impact parametric study with emphasis on nose gear landing conditions. J. Aircr. 2002, 39, 394–403. [Google Scholar] [CrossRef]
- Zhang, W.; Zhang, Z.; Zhu, Q.; Xu, S. Dynamics model of carrier-based aircraft landing gears landed on dynamic deck. Chin. J. Aeronaut. 2009, 22, 371–379. [Google Scholar]
- Zhang, G.; Yang, L.; Zhang, J.; Han, C. Longitudinal attitude controller design for aircraft landing with disturbance using ADRC/LQR. In Proceedings of the 2013 IEEE International Conference on Automation Science and Engineering (CASE), Madison, WI, USA, 17–20 August 2013; pp. 330–335. [Google Scholar]
- Zhang, Y.; Yu, J. The Risk Prevention and Analysis on Tail Strike of Civil Aircraft. J. Civ. Aviat. Flight Univ. China 2021, 32, 9–13. [Google Scholar]
- Su, Z. Impact analysis of aircraft landing variables based on joint probability distributions. New Technol. New Prod. China 2021, 18–20. [Google Scholar] [CrossRef]
- Li, C.; Zhong, M.; Zhou, X. An Algorithm for Aircraft Tailstrike Screening Based on Geometric Constraint Model. In Proceedings of the 2022 IEEE 4th International Conference on Civil Aviation Safety and Information Technology (ICCASIT), Dali, China, 12–14 October 2022; pp. 346–351. [Google Scholar]
- Alogdianakis, G.; Katsidimas, I.; Kotzakolios, A.; Plioutsias, A.; Kostopoulos, V. Runway Safety Assistant Foreseeing Excursions: Calculating Means. Aerospace 2024, 11, 705. [Google Scholar] [CrossRef]
- Wang, L.; Yang, X. Risk prediction of tail strike during landing based on Monte Carlo method. J. Saf. Sci. Technol. 2019, 15, 45–50. [Google Scholar]
- Yang, X.; Wang, L. Analysis of civil aircraft tail striking event based on pilot model. Flight Dyn. 2022, 40, 89–94. [Google Scholar]
- Wang, L.; Sun, J.; Wang, W. Bayesian network analysis model on landing exceedance risk based on flight QAR data. J. Saf. Environ. 2023, 23, 26–34. [Google Scholar]
- Zhang, N.; Wang, L.; An, J.; Qi, X. Risk Analysis of Human Factors in Aircraft Tail Strike During Landing: A Study Based on QAR Data. In Proceedings of the International Conference on Human-Computer Interaction, Copenhagen, Denmark, 23–28 July 2023; pp. 178–187. [Google Scholar]
- Lu, F.; Song, J.J. Application of Random Forest algorithm in tail-strike event prediction. J. Saf. Environ. 2024, 24, 3028–3035. [Google Scholar]
- Ding, C.; Peng, H. Minimum redundancy feature selection from microarray gene expression data. J. Bioinform. Comput. Biol. 2005, 3, 185–205. [Google Scholar] [CrossRef]
- Sundermeyer, M.; Schlüter, R.; Ney, H. LSTM neural networks for language modeling. In Proceedings of the Thirteenth Annual Conference of the International Speech Communication Association, Portland, OR, USA, 9–13 September 2012; pp. 194–197. [Google Scholar]
- Zong, X.; Yao, Y. Quick test of statistical distribution of data using Q-Q and P-P plots. Stat. Decis. 2010, 151–152. [Google Scholar] [CrossRef]
- Wang, B.; Zhang, H.; Deng, F. Localization for MMC submodule open-circuit fault based on Pauta criterion. Electr. Power Eng. Technol. 2023, 42, 116–123. [Google Scholar]
- Xu, C.; Ma, M. Optimization Method for Gross Error Processing of Traffic Data Based on Pauta Criterion. J. Shanghai Univ. Eng. Sci. 2018, 32, 64–67. [Google Scholar]
- Breunig, M.M.; Kriegel, H.P.; Ng, R.T.; Sander, J. LOF: Identifying density-based local outliers. In Proceedings of the 2000 ACM SIGMOD International Conference on Management of Data, Dallas, TX, USA, 16–18 May 2000; pp. 93–104. [Google Scholar]
- Civil Aviation Administration of China. AC-121/135-FS-2012-45R1: Flight Quality Assurance (FOQA) Implementation and Management; Civil Aviation Administration of China: Beijing, China, 2015.
- Craig, J.C. A Confusion matrix for tactually presented letters. Percept. Psychophys. 1979, 26, 409–411. [Google Scholar] [CrossRef]


| Length of Input List/s | Number of Input Parameters | ||||||||
|---|---|---|---|---|---|---|---|---|---|
| 11 | 16 | 21 | |||||||
| MSE | RMSE | MAE | MSE | RMSE | MAE | MSE | RMSE | MAE | |
| 12 | 0.00505 | 0.0711 | 0.0523 | 0.00505 | 0.0710 | 0.0523 | 0.00502 | 0.0709 | 0.0521 |
| 18 | 0.00508 | 0.0713 | 0.0525 | 0.00506 | 0.0711 | 0.0524 | 0.00503 | 0.0709 | 0.0521 |
| 24 | 0.00460 | 0.0678 | 0.0500 | 0.00457 | 0.0676 | 0.0498 | 0.00456 | 0.0675 | 0.0497 |
| 30 | 0.00461 | 0.0679 | 0.0501 | 0.00456 | 0.0675 | 0.0497 | 0.00454 | 0.0674 | 0.0495 |
| Length of Input List/s | Number of Input Parameters | ||||||||
|---|---|---|---|---|---|---|---|---|---|
| 11 | 16 | 21 | |||||||
| MSE | RMSE | MAE | MSE | RMSE | MAE | MSE | RMSE | MAE | |
| 12 | 0.00272 | 0.0522 | 0.0402 | 0.00271 | 0.0521 | 0.0400 | 0.00270 | 0.0519 | 0.0401 |
| 18 | 0.00296 | 0.0544 | 0.0432 | 0.00427 | 0.0653 | 0.0509 | 0.00374 | 0.0612 | 0.0492 |
| 24 | 0.00132 | 0.0363 | 0.0285 | 0.00137 | 0.0370 | 0.0292 | 0.00134 | 0.0366 | 0.0287 |
| 30 | 0.00135 | 0.0367 | 0.0288 | 0.00137 | 0.0370 | 0.0291 | 0.00140 | 0.0374 | 0.0294 |
| Pitch Confusion Matrix | Projected Value | ||
|---|---|---|---|
| Ultra-Limit | Normalcy | ||
| Actual value | Ultra-limit | 26 | 3 |
| Normalcy | 0 | 29 | |
| Roll Confusion Matrix | Projected Value | ||
|---|---|---|---|
| Ultra-Limit | Normalcy | ||
| Actual value | Ultra-limit | 15 | 2 |
| Normalcy | 1 | 16 | |
Disclaimer/Publisher’s Note: The statements, opinions and data contained in all publications are solely those of the individual author(s) and contributor(s) and not of MDPI and/or the editor(s). MDPI and/or the editor(s) disclaim responsibility for any injury to people or property resulting from any ideas, methods, instructions or products referred to in the content. |
© 2025 by the authors. Licensee MDPI, Basel, Switzerland. This article is an open access article distributed under the terms and conditions of the Creative Commons Attribution (CC BY) license (https://creativecommons.org/licenses/by/4.0/).
Share and Cite
Lu, F.; Jing, T.; Xie, C.; Chen, H. Civil Aircraft Landing Attitude Ultra-Limit Warning System Based on mRMR-LSTM. Aerospace 2025, 12, 581. https://doi.org/10.3390/aerospace12070581
Lu F, Jing T, Xie C, Chen H. Civil Aircraft Landing Attitude Ultra-Limit Warning System Based on mRMR-LSTM. Aerospace. 2025; 12(7):581. https://doi.org/10.3390/aerospace12070581
Chicago/Turabian StyleLu, Fei, Tong Jing, Chunsheng Xie, and Haonan Chen. 2025. "Civil Aircraft Landing Attitude Ultra-Limit Warning System Based on mRMR-LSTM" Aerospace 12, no. 7: 581. https://doi.org/10.3390/aerospace12070581
APA StyleLu, F., Jing, T., Xie, C., & Chen, H. (2025). Civil Aircraft Landing Attitude Ultra-Limit Warning System Based on mRMR-LSTM. Aerospace, 12(7), 581. https://doi.org/10.3390/aerospace12070581