Article

Experimental Study on the Icing of Rotating Intake Cones in Wind Tunnels Under Supercooled Large-Droplet Conditions

1
Liaoning Provincial Key Laboratory of Aircraft Ice Protection, AVIC Aerodynamics Research Institute, Shenyang 110034, China
2
Liyang Aerodynamics Innovation Institute, Liyang 213300, China
3
School of Energy and Power Engineering, Nanjing Institute of Technology, Nanjing 211167, China
*
Authors to whom correspondence should be addressed.
Aerospace 2025, 12(5), 384; https://doi.org/10.3390/aerospace12050384
Submission received: 10 March 2025 / Revised: 17 April 2025 / Accepted: 27 April 2025 / Published: 29 April 2025
(This article belongs to the Special Issue Aerospace Anti-icing Systems)

Abstract

:
Supercooled droplets that collide with the windward surface of the aircraft will freeze, which results in icing on both stationary and rotating components. The ice accretion on rotating surfaces is physically different from those on stationary components. The icing phenomenon on the surface of a rotating intake cone was investigated in an icing wind tunnel, and the influence of icing conditions of supercooled large droplets on the experimental results was analyzed. In the experiments, the ice accretion of the intake cone was studied under various conditions, including rotational speed, wind speed, icing temperature, droplet diameter, and icing time. The ice shape on the surface of the intake cone is notably unique due to the influence of centrifugal force, which produces a longer feather-like ice structure that has a significant effect on the performance of the engine. The process of ice shedding caused by centrifugal force is also critical for the engine anti-icing process. Therefore, it is essential to study the icing characteristics under rotational effects during the design and verification process of engine anti-icing systems.

1. Introduction

When an aircraft passes through clouds, icing occurs on the windward surface. The icing on the surface of the wing and tail can change the aerodynamic shape and the critical angle of attack, which reduces the lift and increases the drag of the aircraft [1,2]. In severe cases, it can even lead to accidents, resulting in aircraft destruction and loss of life. For an aircraft engine, due to the influence of the intake duct, the temperature of the airflow may gradually decrease during the flow process. Therefore, compared with the wing, the intake components of the engine are more prone to icing, including the intake cone, guide vanes, and fan blades [3,4].
When the intake components of the engine freeze, the flow field in the intake duct becomes distorted, resulting in a reduction in airflow into the engine and causing engine stall and surge. As icing thickens, decreased engine intake airflow leads to reduced engine thrust. When icing occurs on the intake cone surface, ice accretion may shed under airflow and centrifugal forces. Once shed ice cubes enter the engine with the airflow, they may strike high-speed rotating components, causing mechanical damage [5]. Therefore, studying the icing characteristics of engine intake cones is of significant importance.
The icing wind tunnel experiment is a commonly used method for investigating icing phenomena on the surface of rotating components in the process of aircraft design. The icing wind tunnels can simulate the icing meteorological conditions that aircraft may encounter in real situations [6,7]. The simulation and observation of the ice accretion phenomenon of rotating components in an icing wind tunnel can provide more accurate data. The icing experiment of rotating surfaces in icing wind tunnels requires additional drive systems compared to stationary surfaces, thus making the whole system more complex. At present, there are two main types of intake cone icing: experimental research and numerical simulation. Li et al. [8] carried out scaling experiments on three different configurations of intake cones, mainly investigating the changes in icing range and thickness with the cone configuration under rime ice and glaze ice conditions. Li et al. also conducted experiments on the scaling cone, using the ratio of inflow velocity to rotational speed as a constant to perform rotational speed scaling. Hu et al. [9,10,11] carried out experimental research on intake cone icing and analyzed the characteristics of ice growth and shedding during the icing process, the influence of rotational speed on ice shape, and the influence of different cone angles on icing. In the ice accretion experiment of the intake cone, the Rossby number was added on the basis of the similarity theory of ice accretion on stationary components, and the scaling ratio of the rotational speed of the intake cone was applied. Mu et al. [12] conducted a study on ice accretion numerical simulation in intake cones, considering water film shedding. Zhao et al. [13] and Wu et al. [14] numerically simulated the droplet impact characteristics of intake cones. Zhang et al. [15,16] carried out numerical simulations of droplet impact and icing on the surface of the intake cone and proposed a computational model for surface residual water film. The calculated ice shapes were in good agreement with the experimental results. Hu et al. [17] conducted research on the icing and anti-icing process of a rotating intake cone in YBF-03 icing wind tunnel, and they measured the surface temperature distribution of hot air anti-icing system in the experiment. He et al. [18] established a numerical simulation method to develop a surface icing model for a rotating intake cone and introduced an ice shedding model. Qi et al. [19] investigated a numerical simulation method for ice accretion in intake systems under mixed-phase conditions; they studied the surface icing under the combined action of droplets and ice crystals. Mahmoud et al. [20] studied the surface icing of gas turbine inlet under different anti-icing conditions and investigated the surface anti-icing performance under different structural configurations. Guo et al. [21] used numerical simulation methods to study the impact of particles on engine surfaces and investigated the impact behavior under different conditions. It can be seen that, although there are some numerical simulations and experimental studies on the rotating intake cone, there is relatively little research on the icing experiment, especially under supercooled large-droplet conditions.
There is a significant difference between the icing processes of supercooled large droplets and conventional droplets [22,23]. During motion, conventional droplets remain spherical due to surface tension, whereas supercooled large droplets undergo deformation and even break up under aerodynamic forces. Conventional droplets entirely participate in the icing process after impacting the surface, while supercooled large droplets may experience adhesion, rebound, splashing, and other phenomena during impact process, with only a portion of droplets participating in the icing process. Due to the larger size of supercooled large droplets, the surface impact range and amount are larger compared to conventional droplets, resulting in a wider icing range. The icing mechanism of supercooled large droplets is even more complex, and the icing of supercooled large droplets is also one of the factors that must be considered in the process of airworthiness certification.
In the actual atmospheric environment, due to terrain and influence of many factors, the temperature of cloud layers is often not uniform. Therefore, there are often both small-sized and large-sized supercooled droplets distributed in the atmosphere. Based on the icing process of the intake cone, an icing experimental method for the intake cone was developed in this paper, and the ice shape through icing wind tunnel experiment was conducted. The icing experiment of the intake cone was conducted under the supercooled large-droplet condition, and the influence of different conditions on the experimental results was analyzed. The results of this paper can be used to support the analysis of the icing mechanism of the intake components, thereby improving the level of engine anti-icing system design.

2. Experimental Equipment

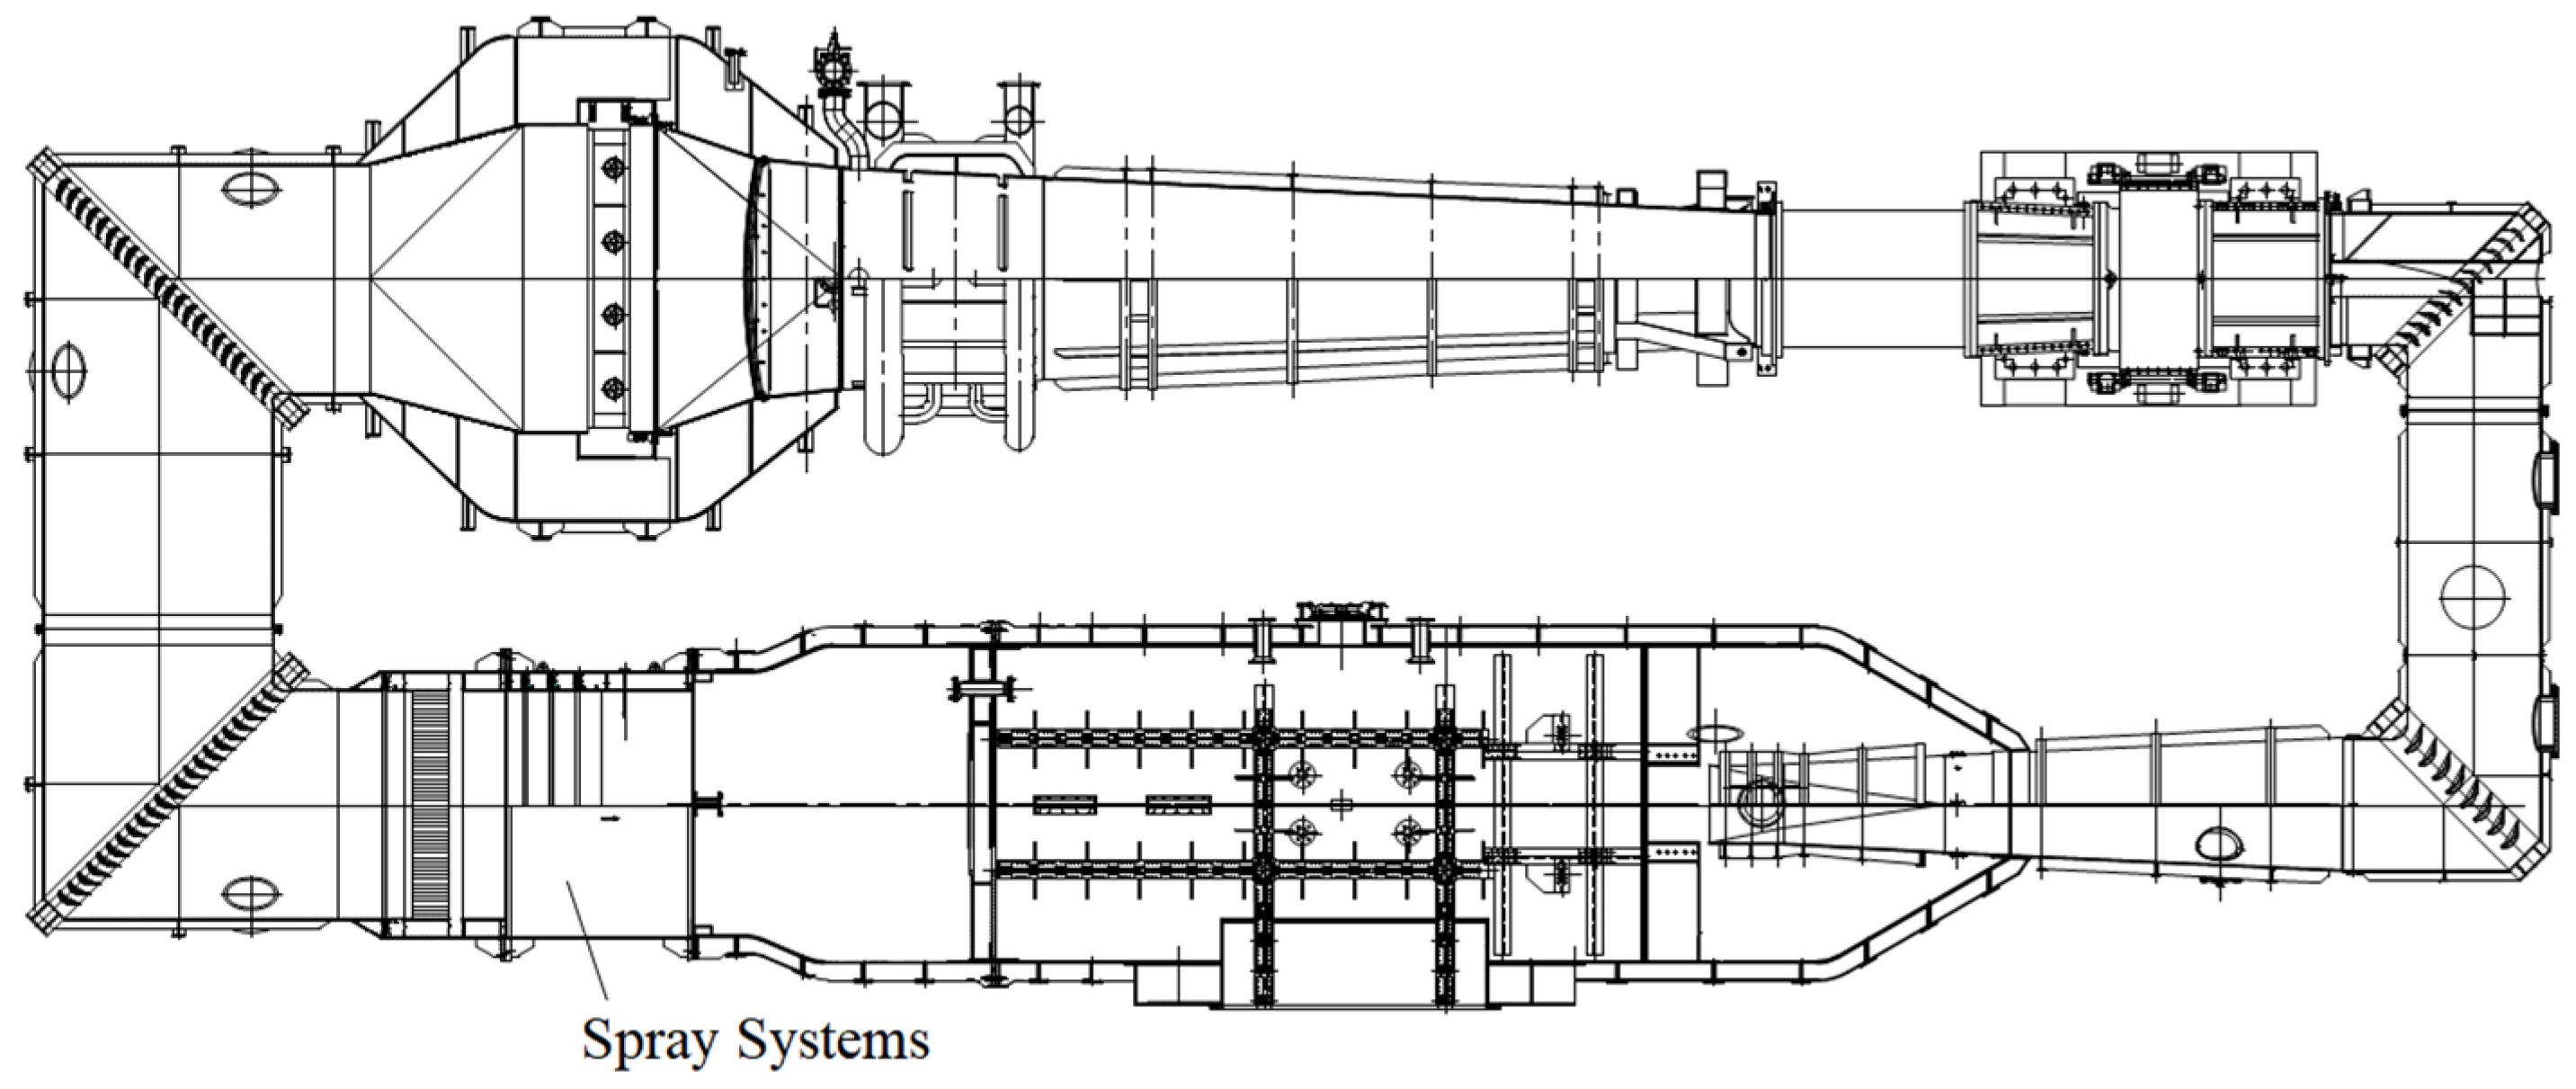
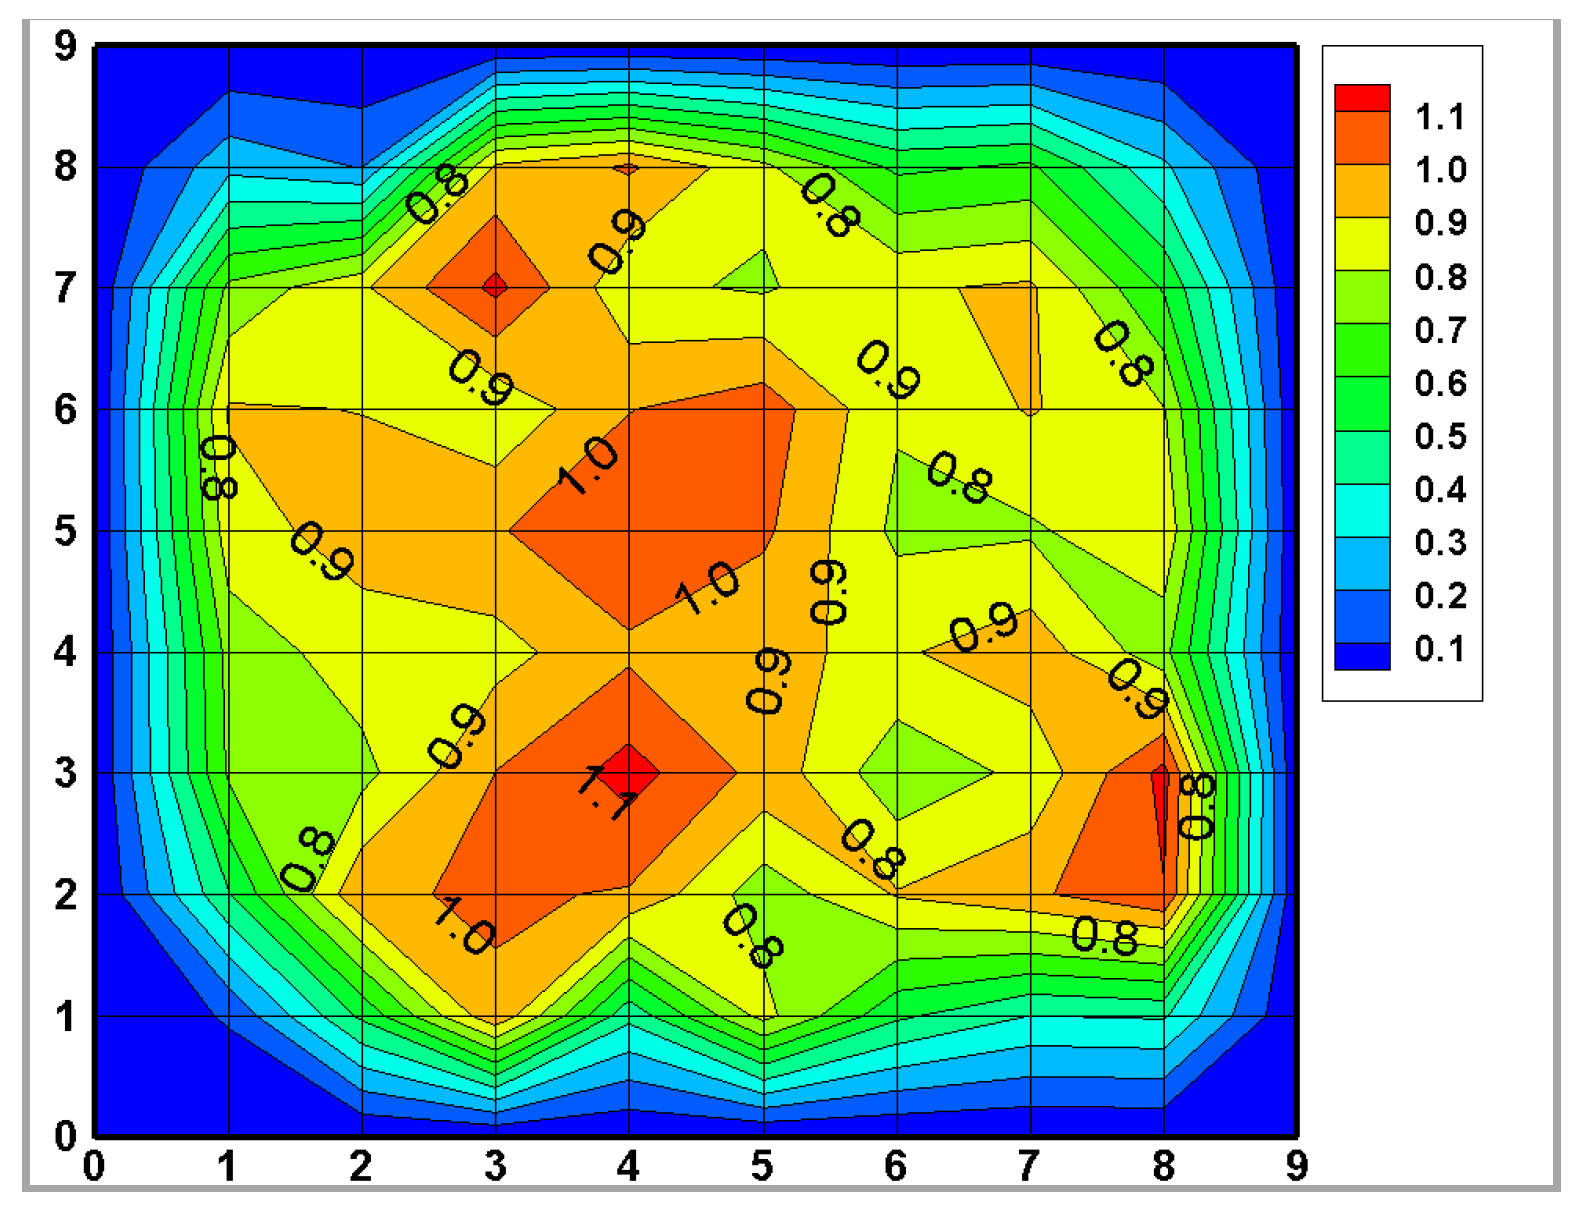
2.1. Icing Wind Tunnel

The experiments were completed in the FL-61 wind tunnel of the AVIC Aerodynamics Research Institute [24,25]. The structure of the FL-61 wind tunnel is shown in Figure 1. The wind tunnel is a subsonic, transonic, and supersonic continuous facility. The cross-sectional size of the experimental section is 0.6 m × 0.6 m, with a total length of 2.7 m. The designed wind speed in this section can reach 210 m/s, and the temperature range is from −40 °C to 60 °C. The Mach number in the FL-61 wind tunnel is controlled and adjusted by regulating the rotational speed of the main compressor. Certain Mach numbers require the interplay of the main and auxiliary compressors to achieve the target conditions. The control accuracy of parameters such as liquid water content (LWC) and mean volume diameter (MVD), as well as cloud uniformity, is calibrated according to SAE ARP 5905. The FL-61 wind tunnel exhibits excellent flow field quality, with detailed flow field parameters and icing experiment indicators summarized in Table 1.
The liquid water content uniformity map of the experimental section under typical conditions is shown in Figure 2, demonstrating the high uniformity of icing wind tunnel. The LWC error in the experiment was within 20%, which can lead to deviations in the ice shape. However, in this paper, the icing pattern in different conditions was obtained by changing a single parameter, and the pattern was invariant and reasonable.
The FL-61 wind tunnel spray system can generate icing conditions that meet the MVD and LWC requirements specified in Appendix C of FAR25, and can simulate the SLD conditions as defined in Appendix O. The spray system is located in the stabilization section of the FL-61 wind tunnel, approximately 8 m upstream of the experimental section in Figure 1. The droplets generated by the spray system were calibrated to maintain supercooled conditions upon reaching the experimental section.
The FL-61 spray system comprises 13 rows of atomizing nozzles, totaling 121 nozzles, designed to produce clouds that satisfy experimental requirements. Purified water with verified quality indicators was used for spraying. The medium-pressure air supply system of wind tunnel provided air compliant with strict quality standards. This air was heated to 70 °C via a heater before being directed to the spray system of icing wind tunnel to fulfill its pneumatic demands. By regulating water and air pressures under controlled conditions, the spray system achieves the optimal mixing of water and air within the nozzles, enabling the simulation of clouds with precise MVD and LWC parameters.

2.2. Experimental Model

The main component of the icing experimental model under SLD conditions was the intake cone. The experimental model was designed based on the front end of a real engine intake cone, featuring a 50° cone angle and a 300 mm base diameter. The front end of bearing seat was connected to the intake cone, while its rear end was linked to the motor. The intake cone was driven by the motor, which was mounted on the support structure. The rotational axis of intake cone aligned with the axis of wind tunnel. Instead of scaling, the intake cone was truncated along its rotational axis, resulting in a 260 mm axial length from the cone tip to the truncation plane and a maximum base diameter of 405 mm.
As shown in Figure 3, the intake cone model was installed in the experimental section of the FL-61 wind tunnel. A motor with a 5000 r/min rated speed and 17 Nm rotor torque was employed. The motor speed accuracy was ±1 r/min, with real-time feedback via an encoder. The motor is initialized at position 0 and returns to this position post-experiment, locking automatically. During non-rotational experiment, the motor remains locked at position 0. Post-calibration, the acceleration rate of the motor can be regulated with a precision of ±5 r/min/s.

2.3. Experimental Methods

The wind tunnel was activated prior to the experiment, with operators maintaining stable wind speed, temperature, and total pressure post-calibration. The motor in the experimental model was accelerated to the target rotational speed. Once the spray system was calibrated for stability, nozzles were activated. After the intake cone was iced for the predetermined duration, the spray system ceased operation. The rotational speed of the intake cone was reduced to 0 rpm, and ice morphology was documented via photography and scanning following wind tunnel deactivation. With the high-speed camera secured, the changes in the shape of the intake cone before and after icing can be recorded. During the experiment, video footage capturing the operation of spray system from initiation to termination within the icing wind tunnel was recorded and archived. The icing on the surface of the rotating intake cone at different times recorded by the high-speed camera is shown in Figure 4. It can be seen that the icing gradually increases with the increase in the icing time and forms a feather-like icing.
After the experiment, the two-dimensional ice shape was recorded. The ice shape encapsulates both the external contour of intake cone and icing curve characteristics, facilitating reconstruction and comparative analyses across diverse conditions. The SLD icing experiments on the intake cone were divided into two states: with and without rotation speed. It was found that, with rotation speed, the icing height on the intake cone was consistent, and there was almost no difference in the different sections. Therefore, when analyzing the working conditions with rotation speed, one of the cross-sections was generally selected for comparison. When there was no rotational speed, SLD had obvious settling characteristics, and the main icing characteristics were reflected on the side cross-section direction.
Experimental motor speed data were derived from raw drive encoder feedback. The data underwent initial processing via a second-order low-pass filter with a 0.125 Hz cutoff frequency, followed by the application of a simple moving average filter. Every three consecutive data points were averaged and rounded to single-digit precision to produce precise, stable speed feedback.

3. Experimental Results and Discussion

Icing experiments on the intake cone under different conditions were carried out, and the influence of different parameters on the ice shape was obtained by changing the experimental conditions. The experimental conditions were selected based on real-world icing weather conditions, taking into account the capabilities of the icing wind tunnel. The experimental conditions are shown in Table 2. The icing time in the experiment was generally chosen to be 20 min, based on the following reasons: In the experiment, it was found that this time is close to the critical time for ice shedding, and it is difficult to obtain a complete ice shape after a longer time, as ice shedding is more likely to occur. At the same time, referring to the actual working envelope of the engine model, the working state at the corresponding speed will not exceed 20 min. Obtaining 20 min icing experimental data is beneficial for guiding the engine’s anti-icing design. We also added explanations in the manuscript.

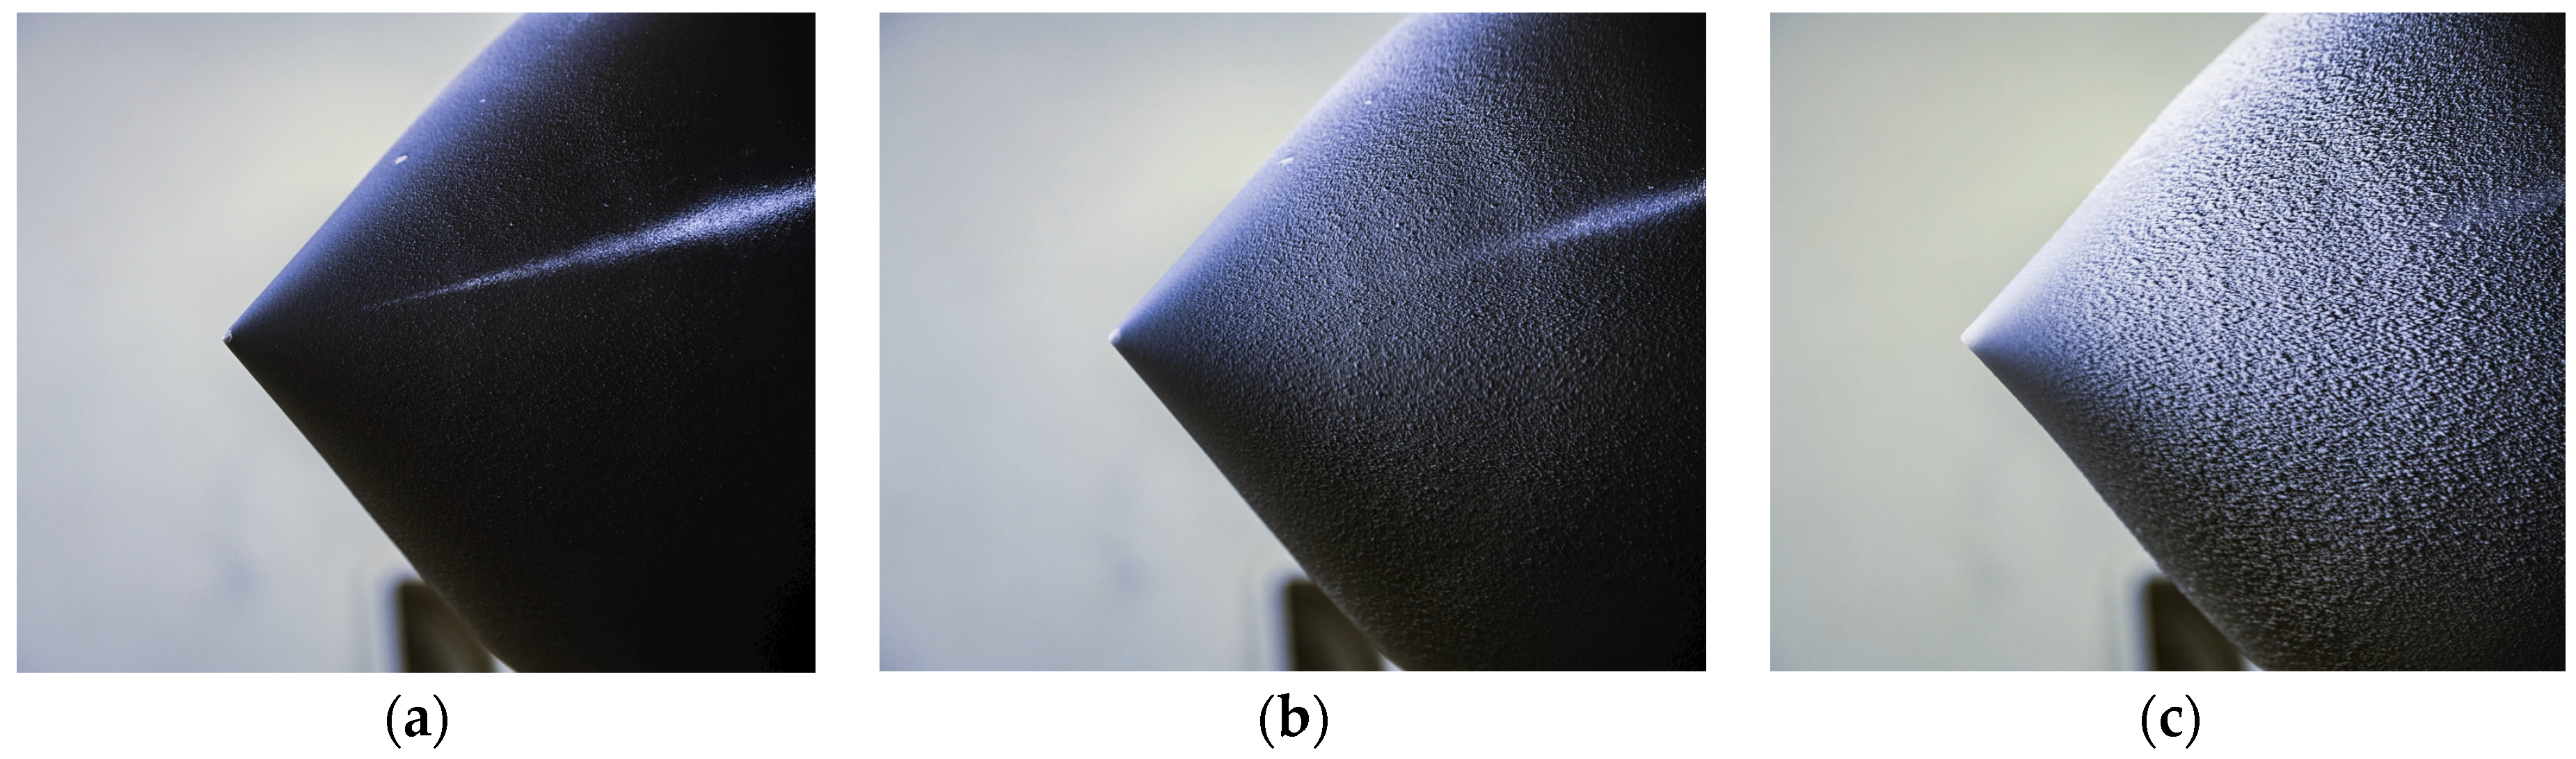
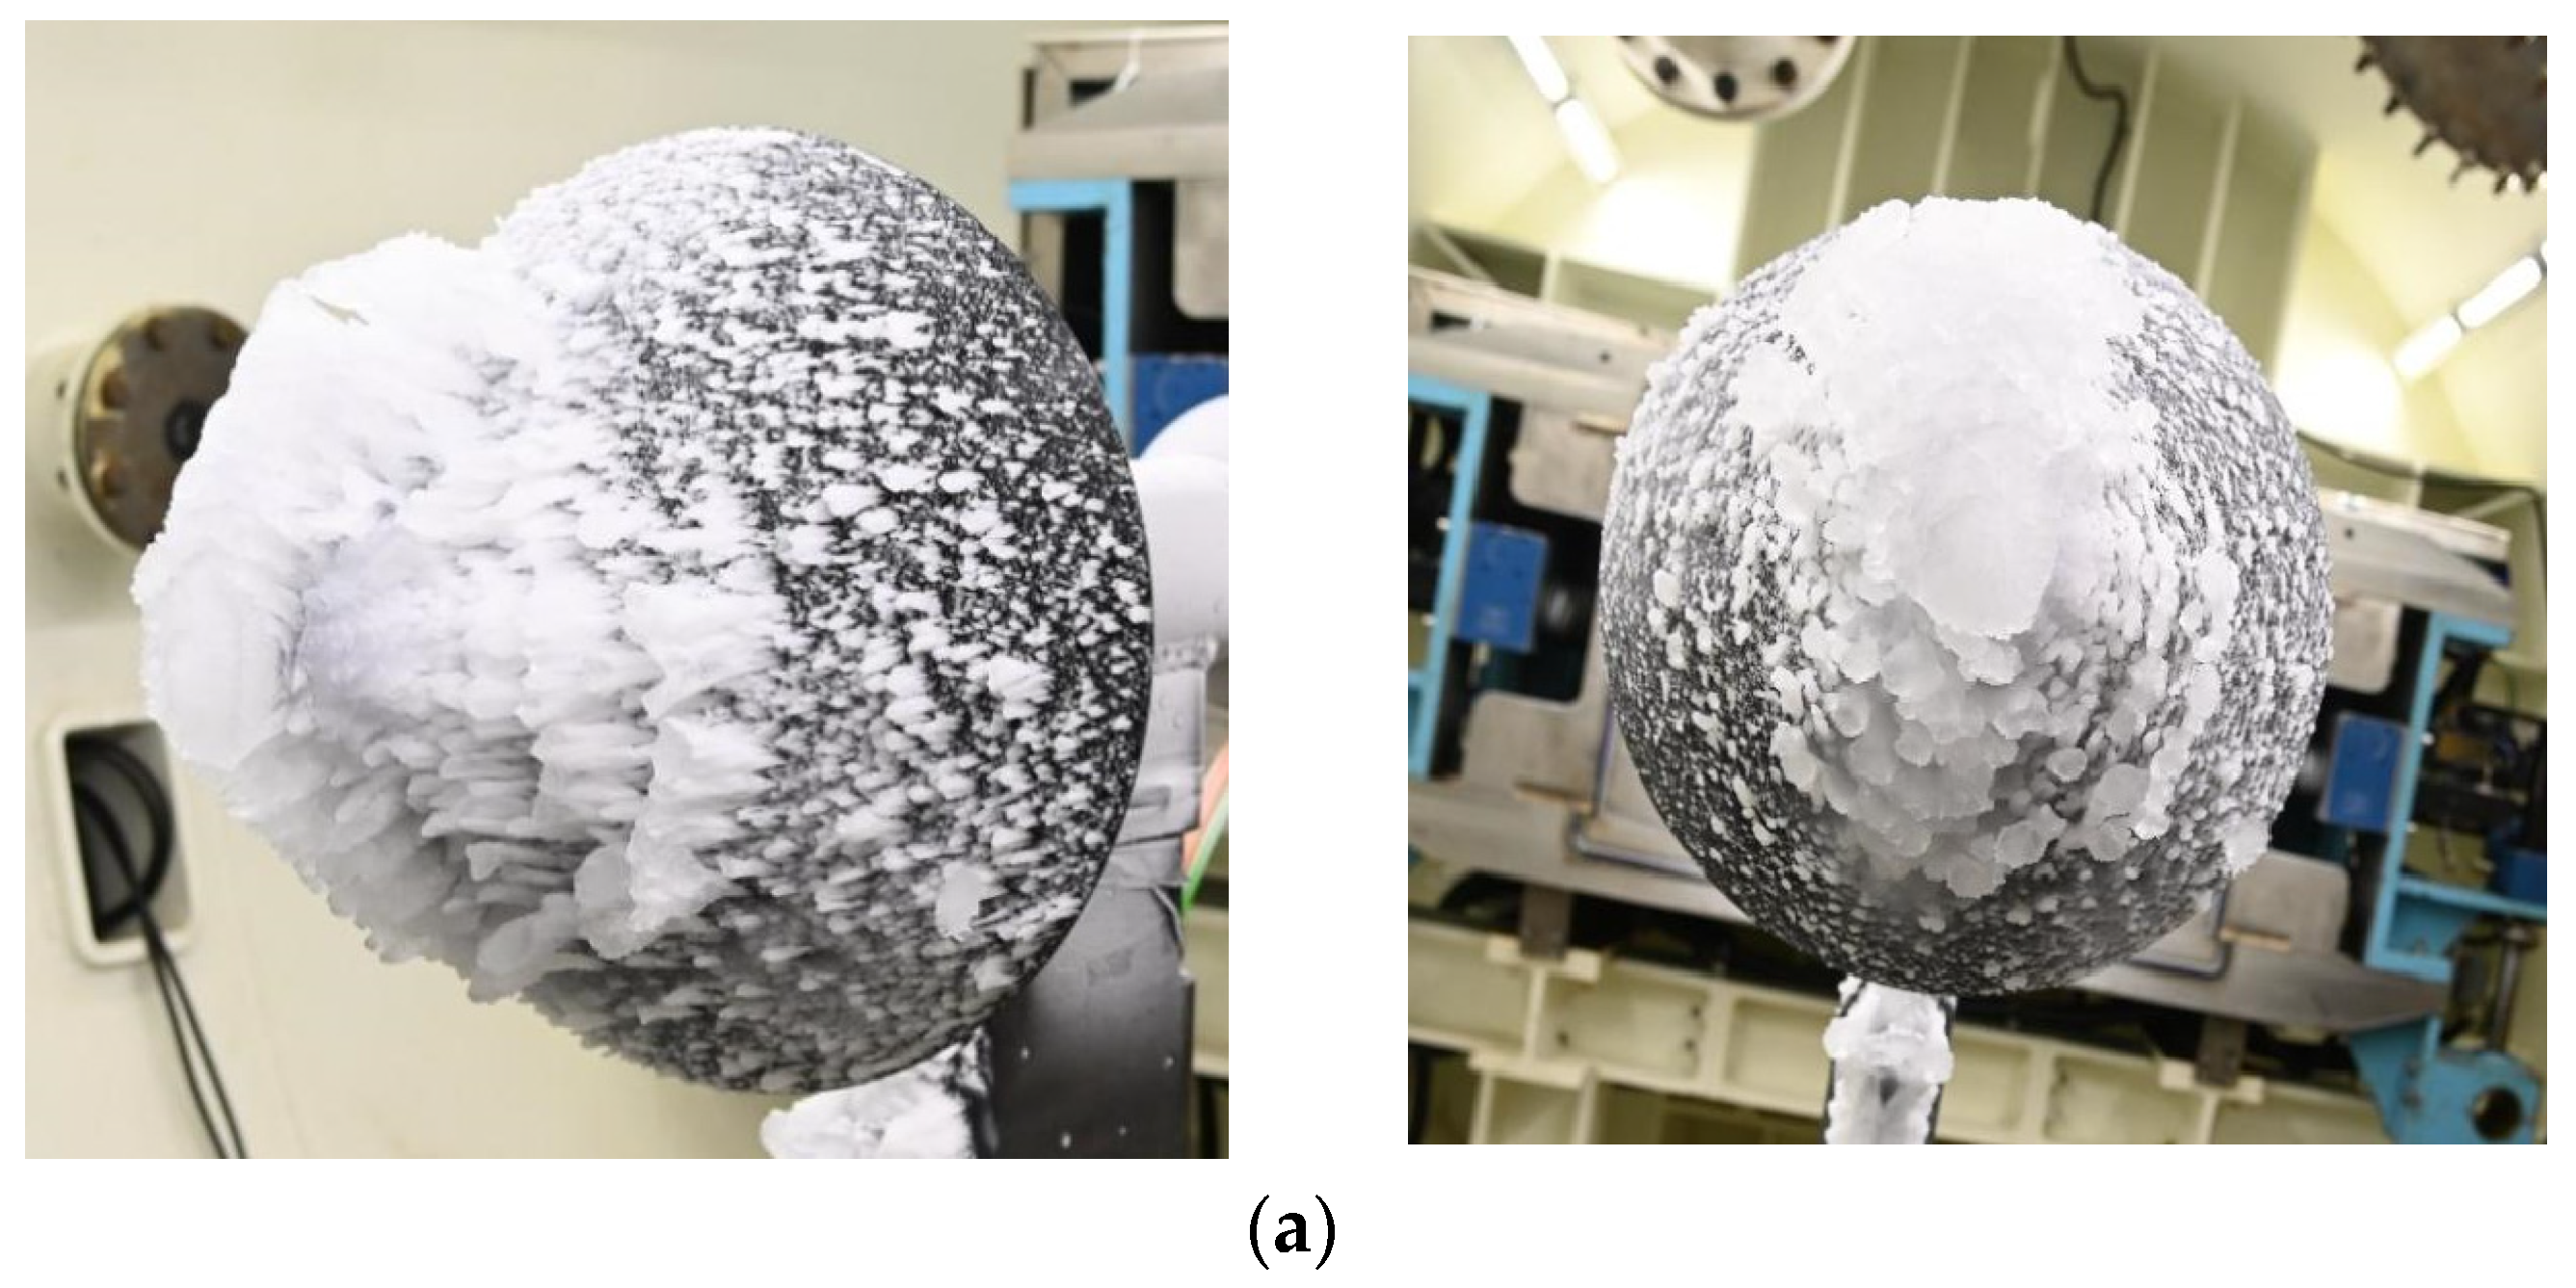
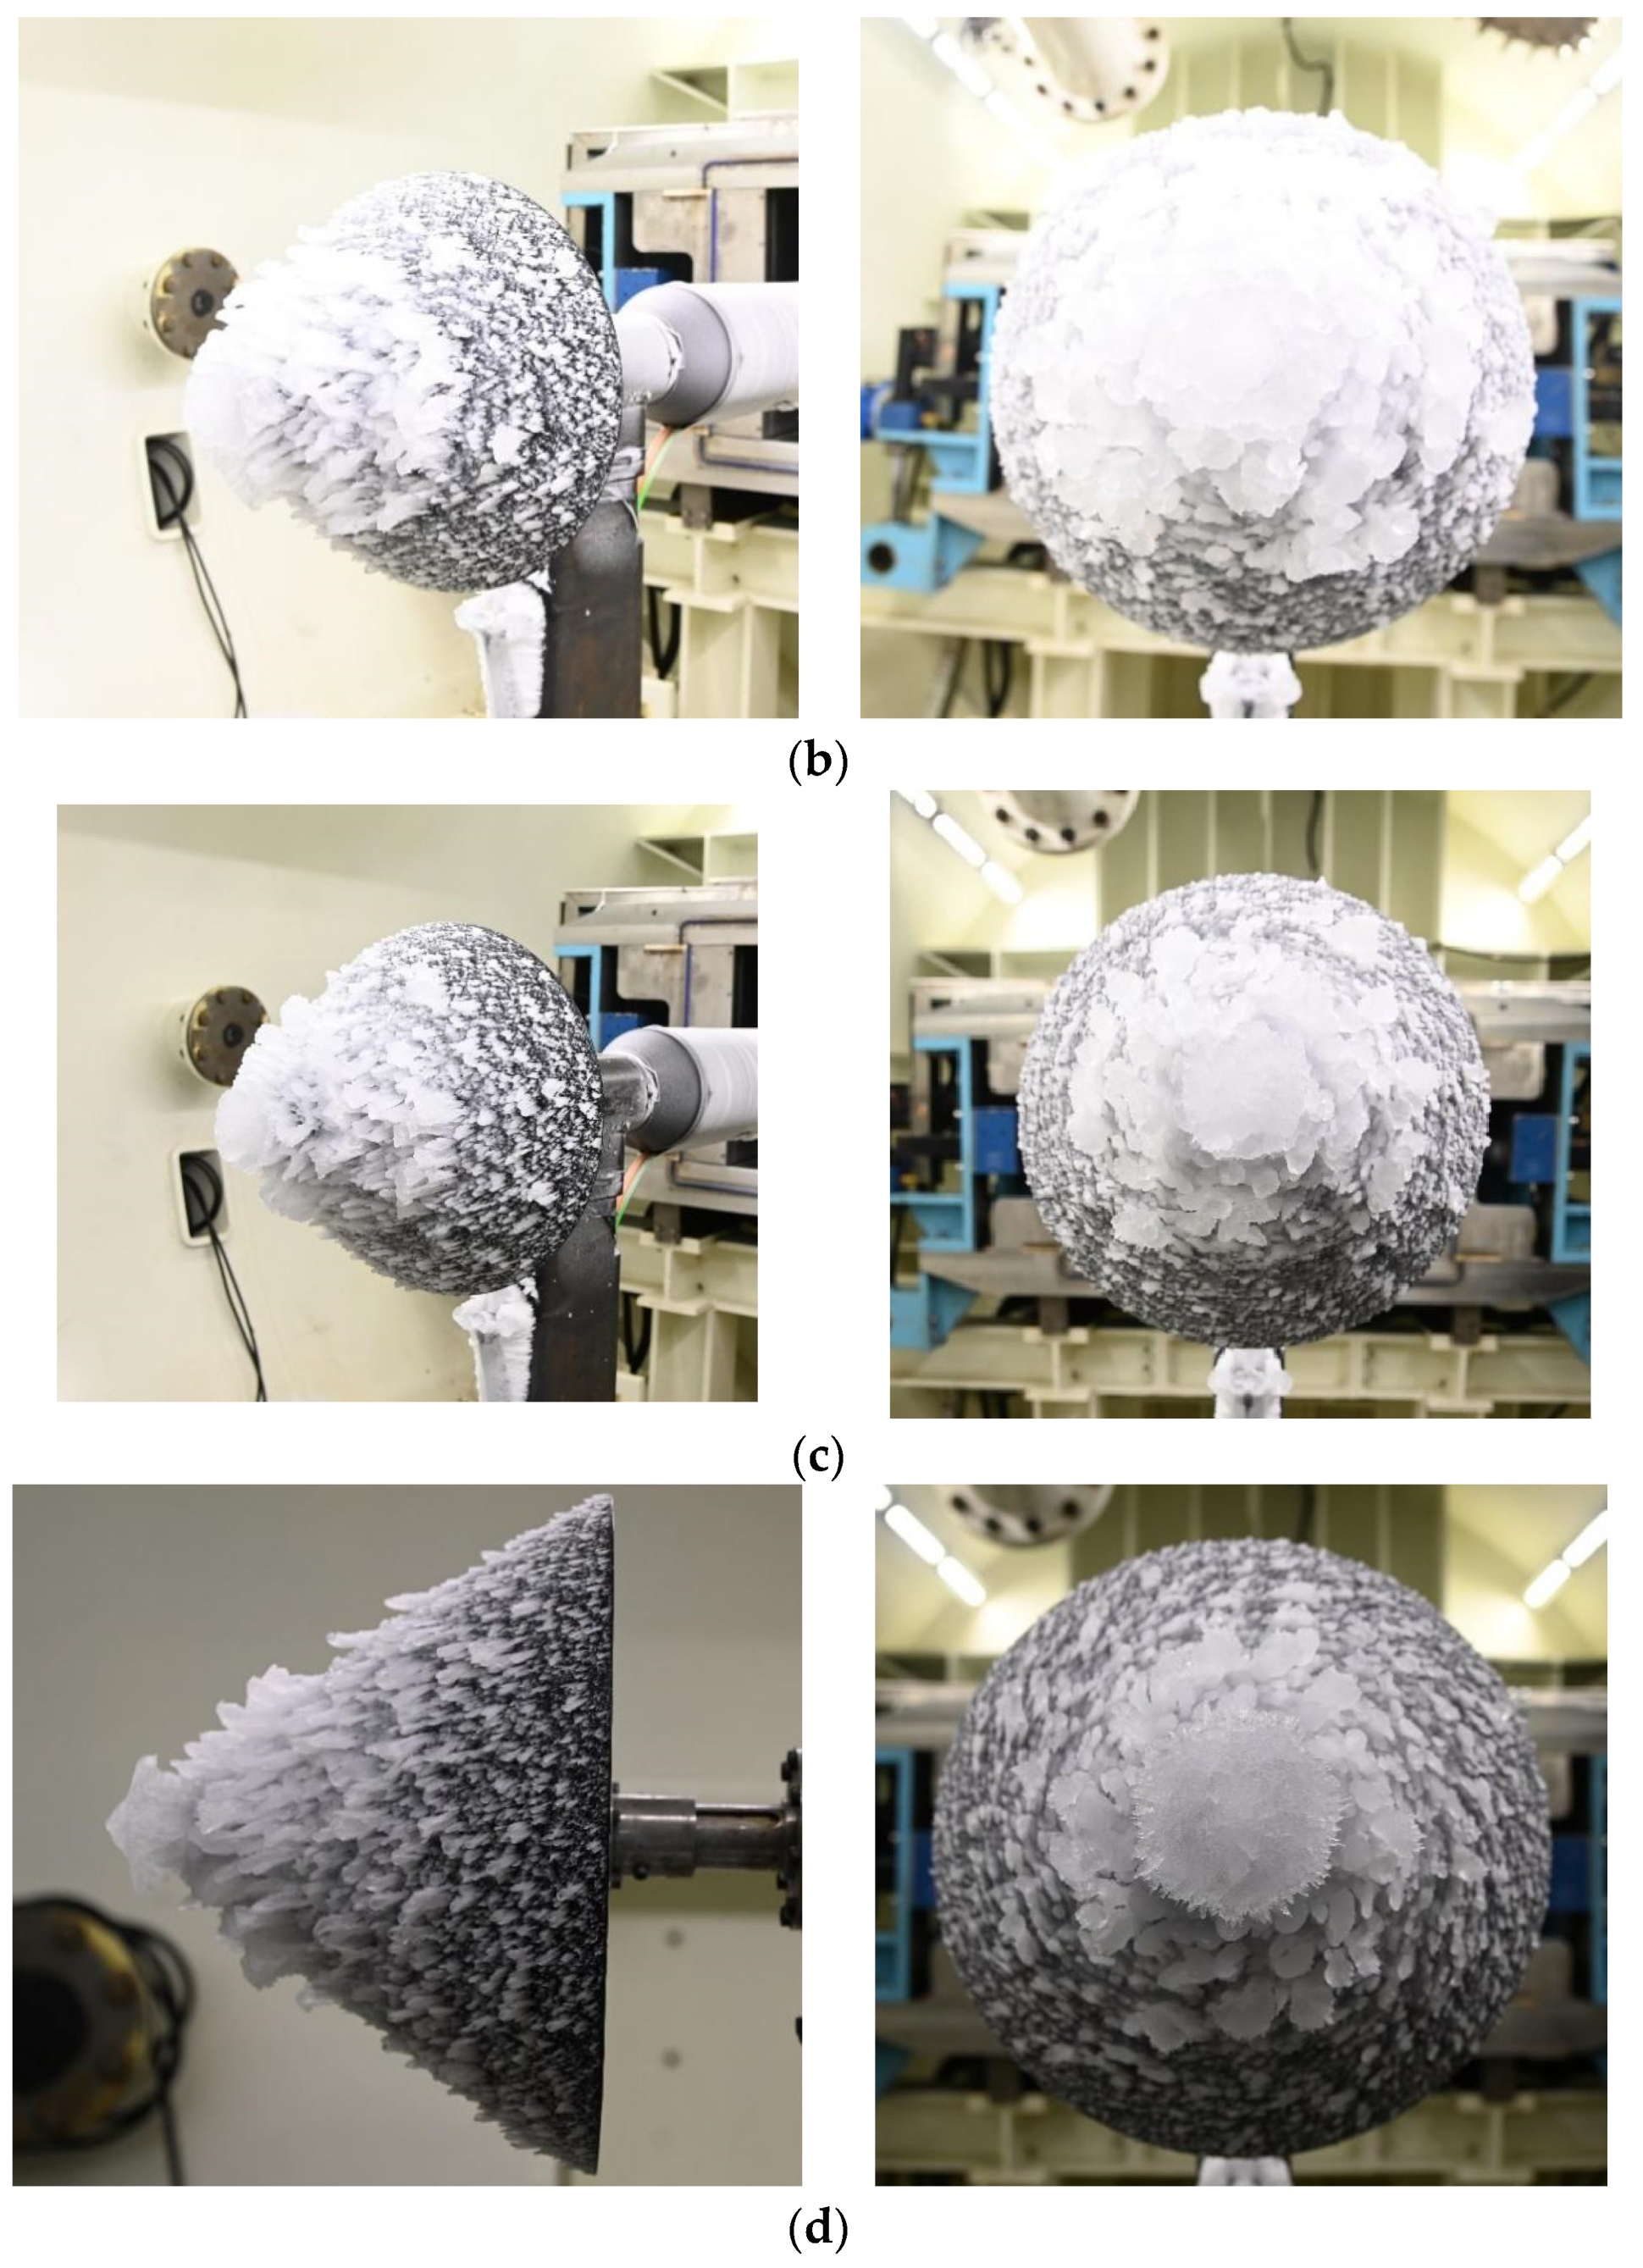
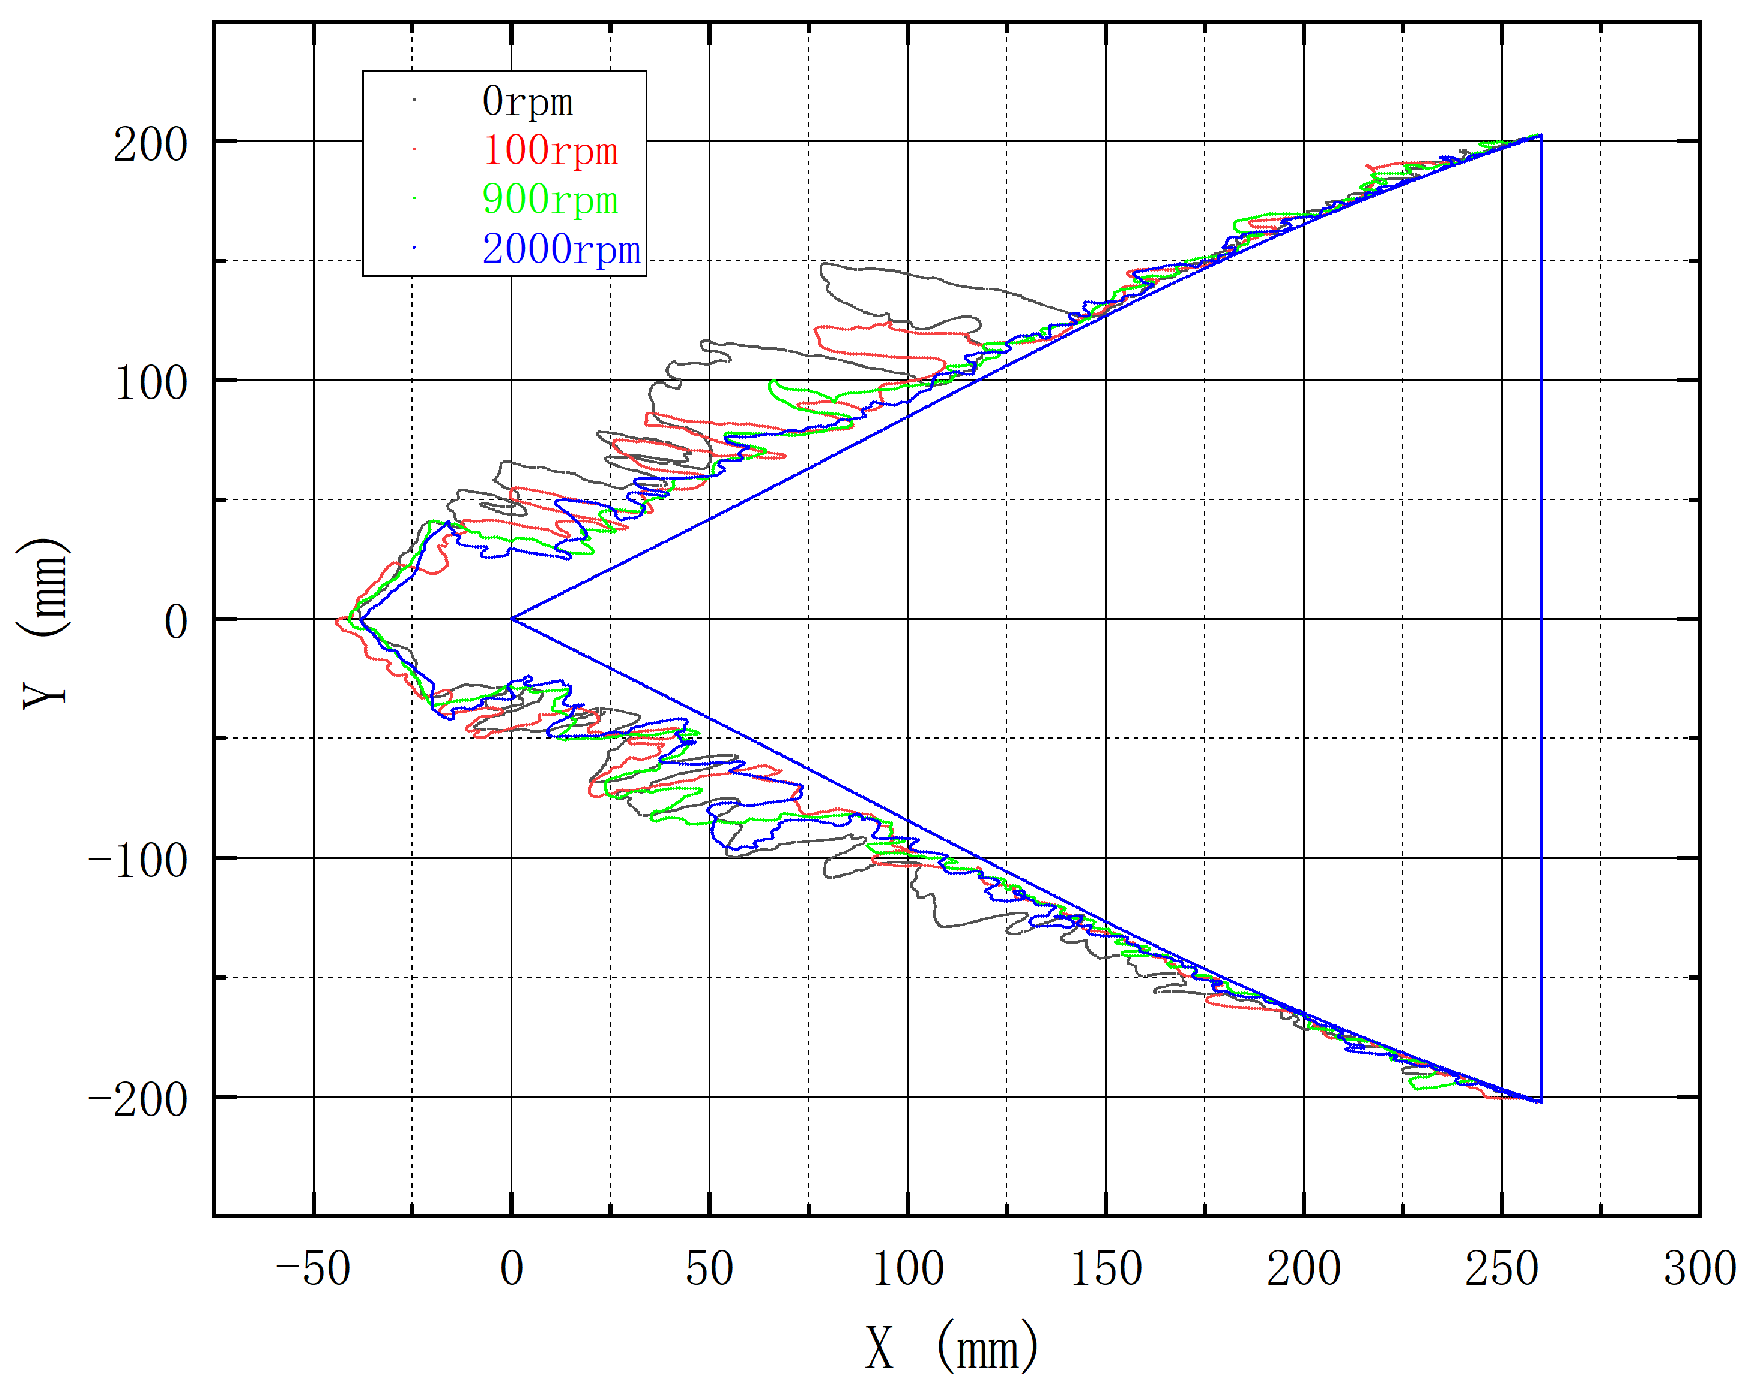
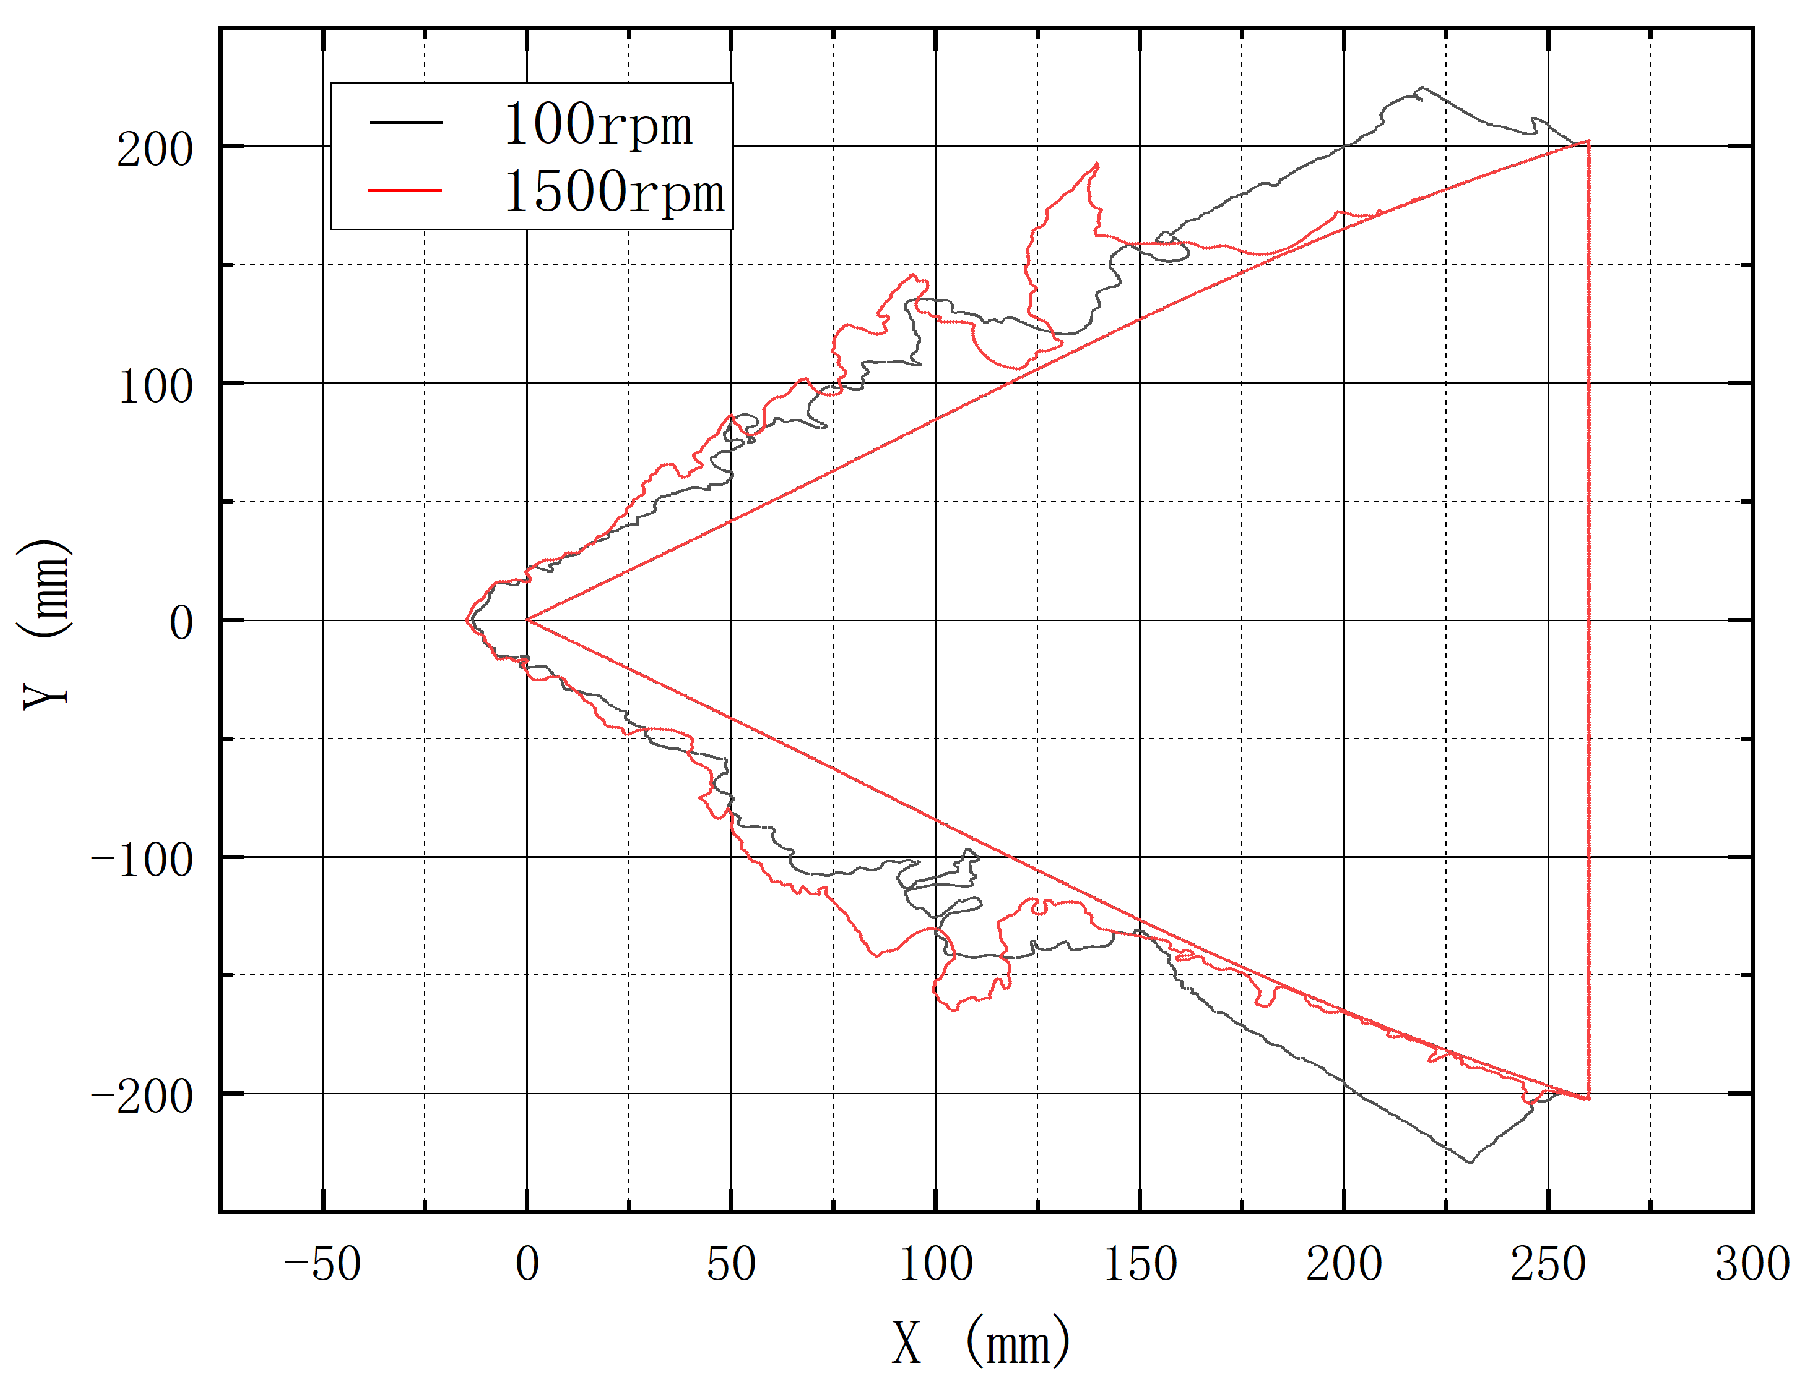
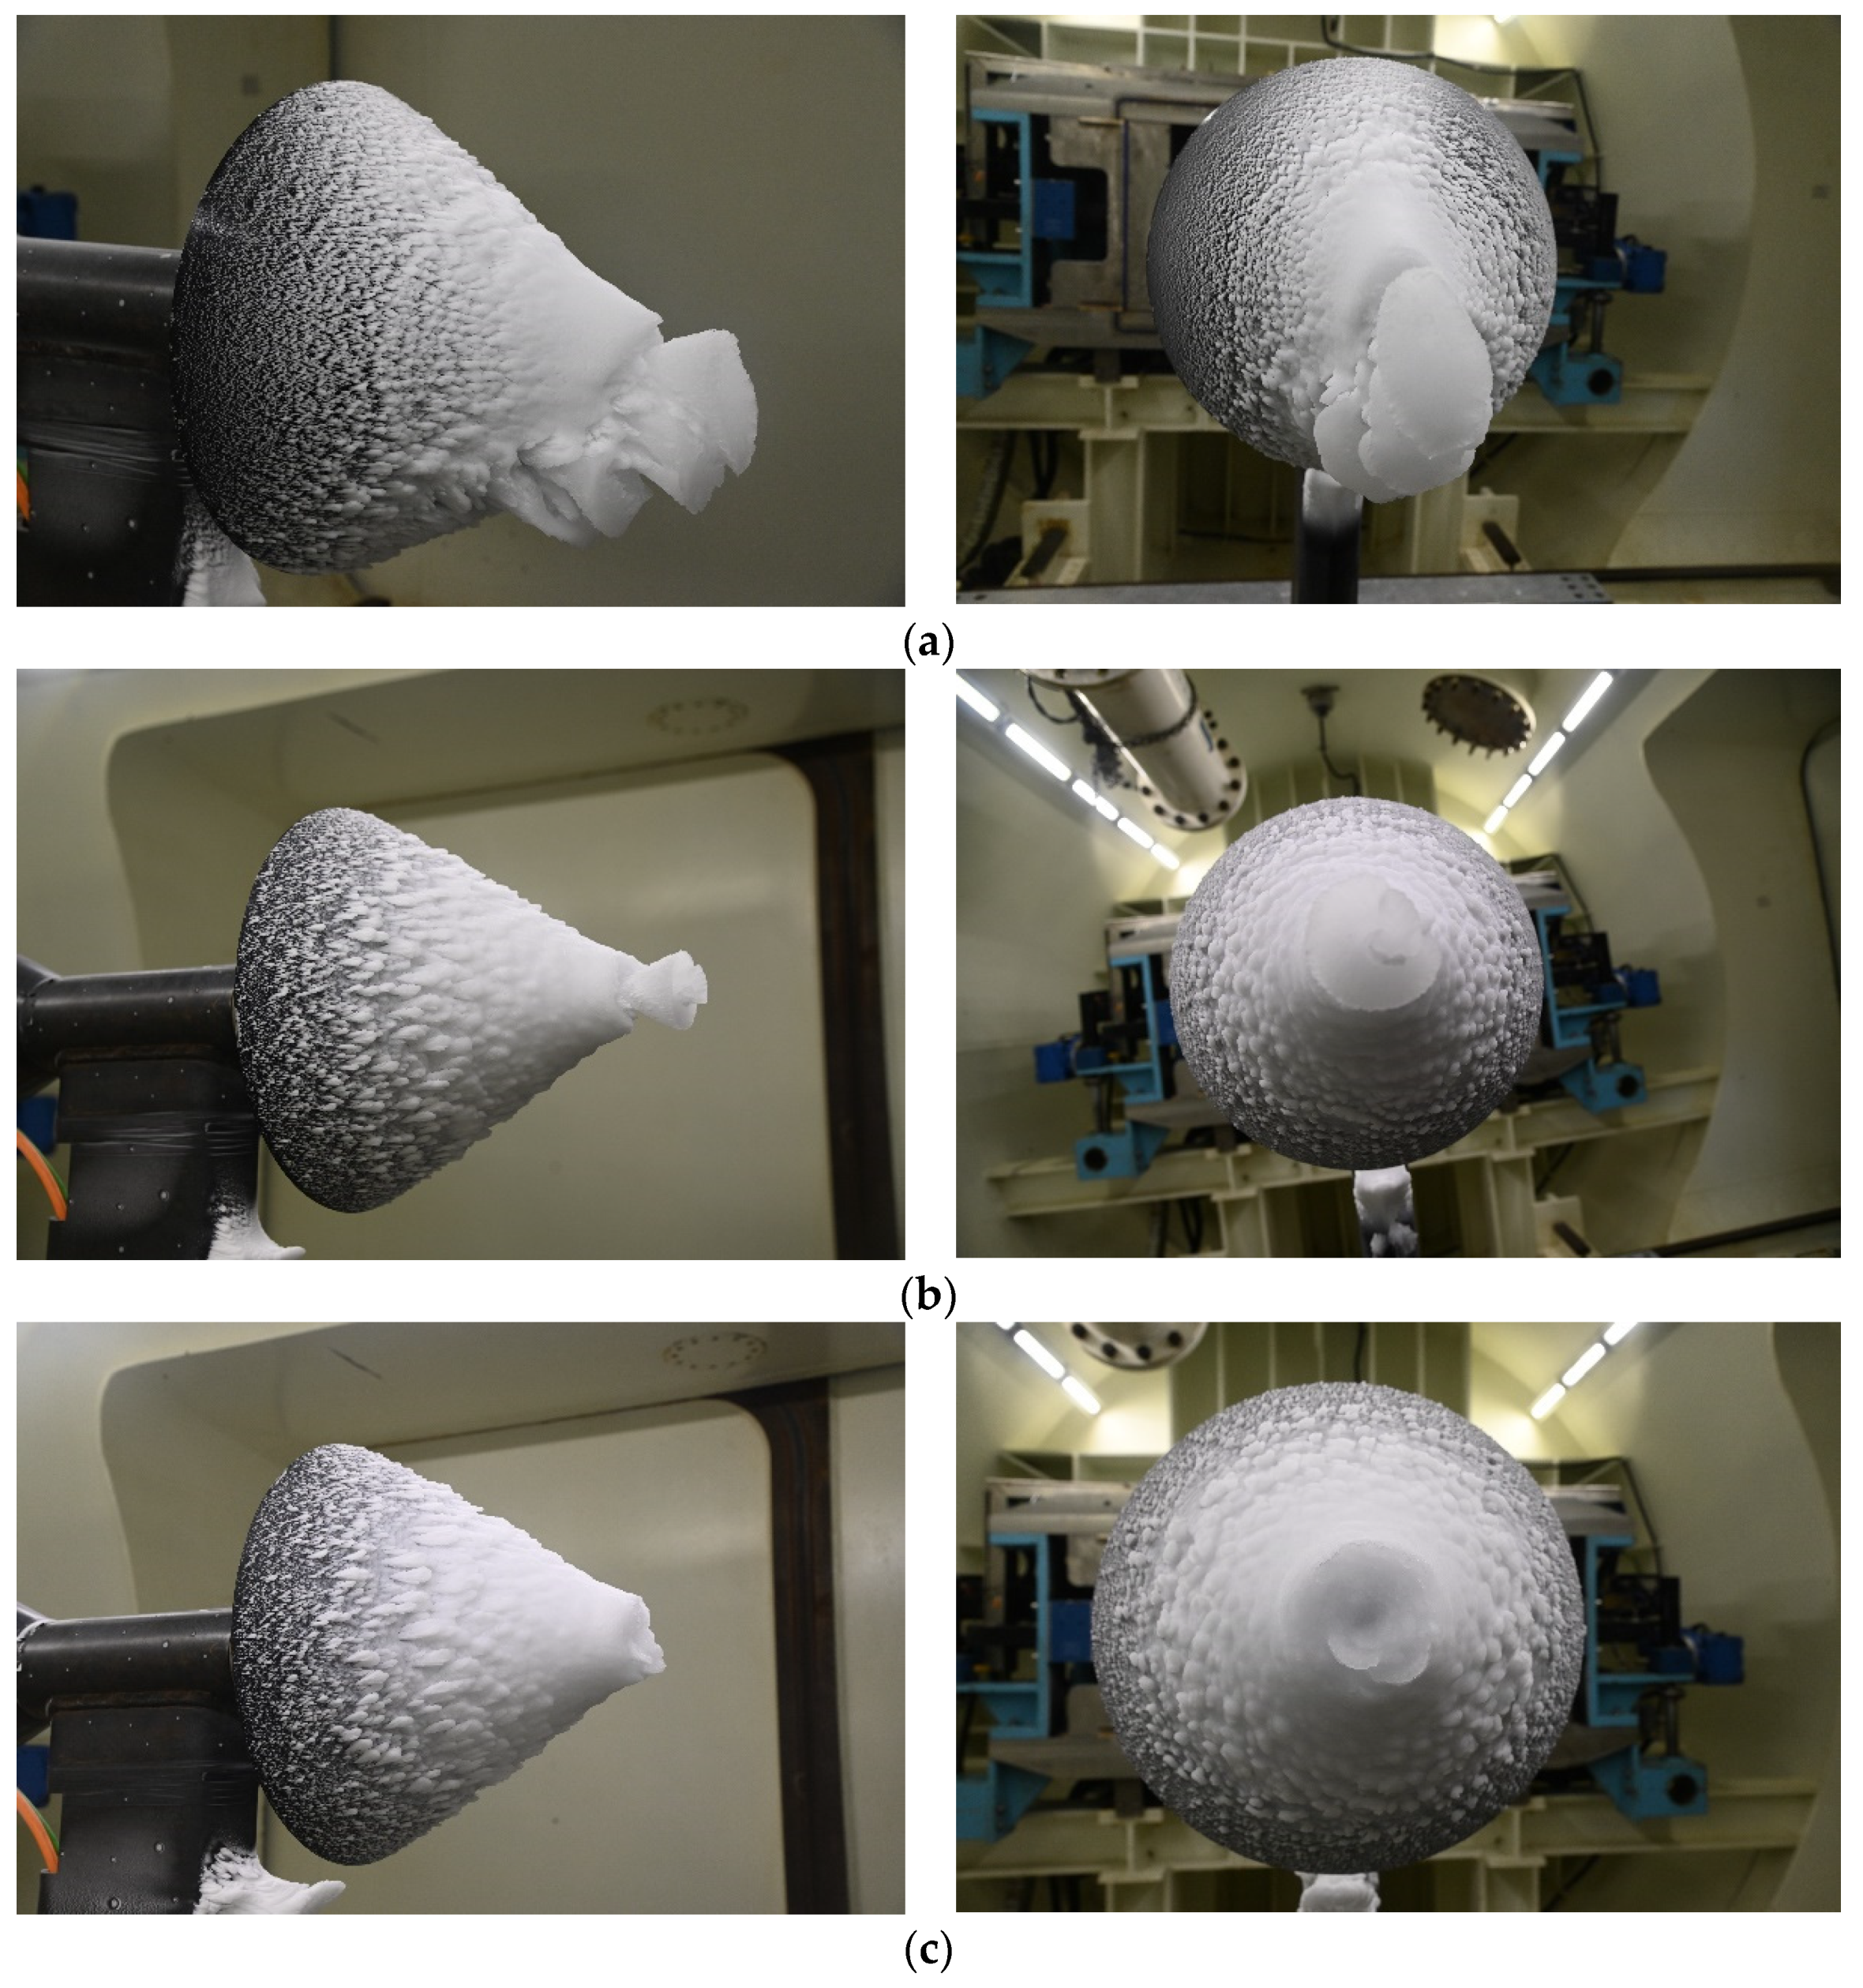
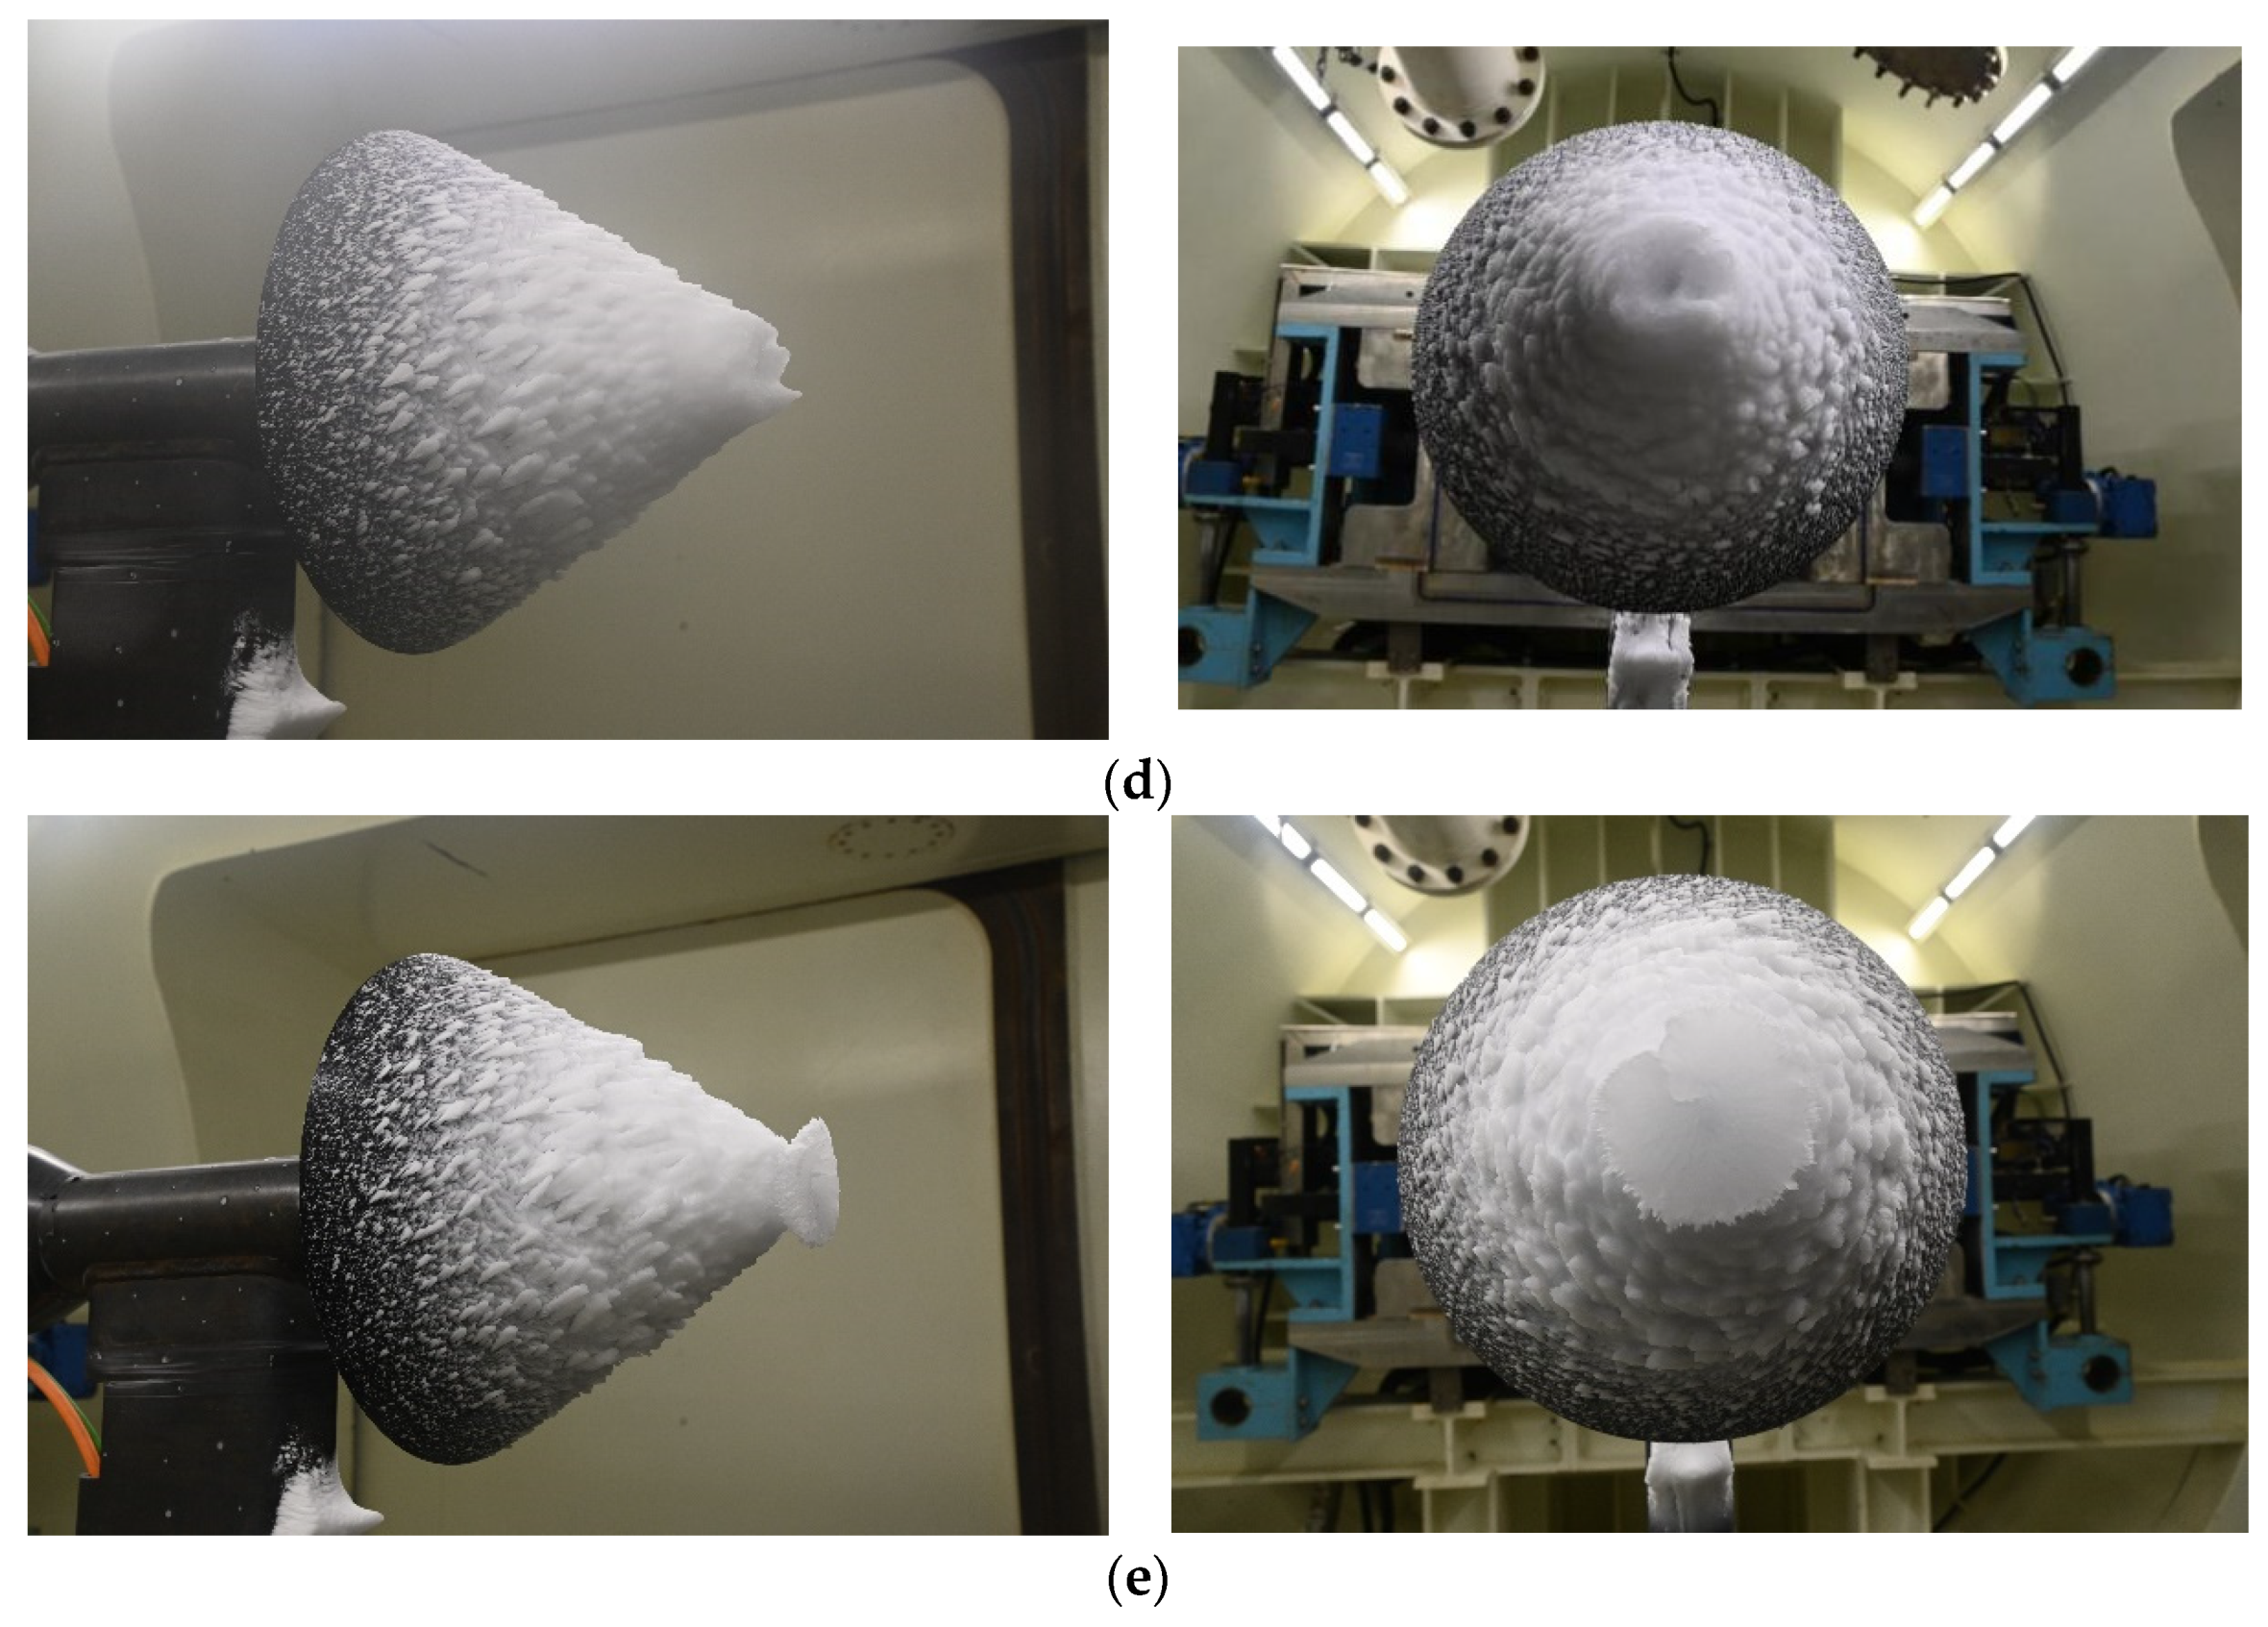
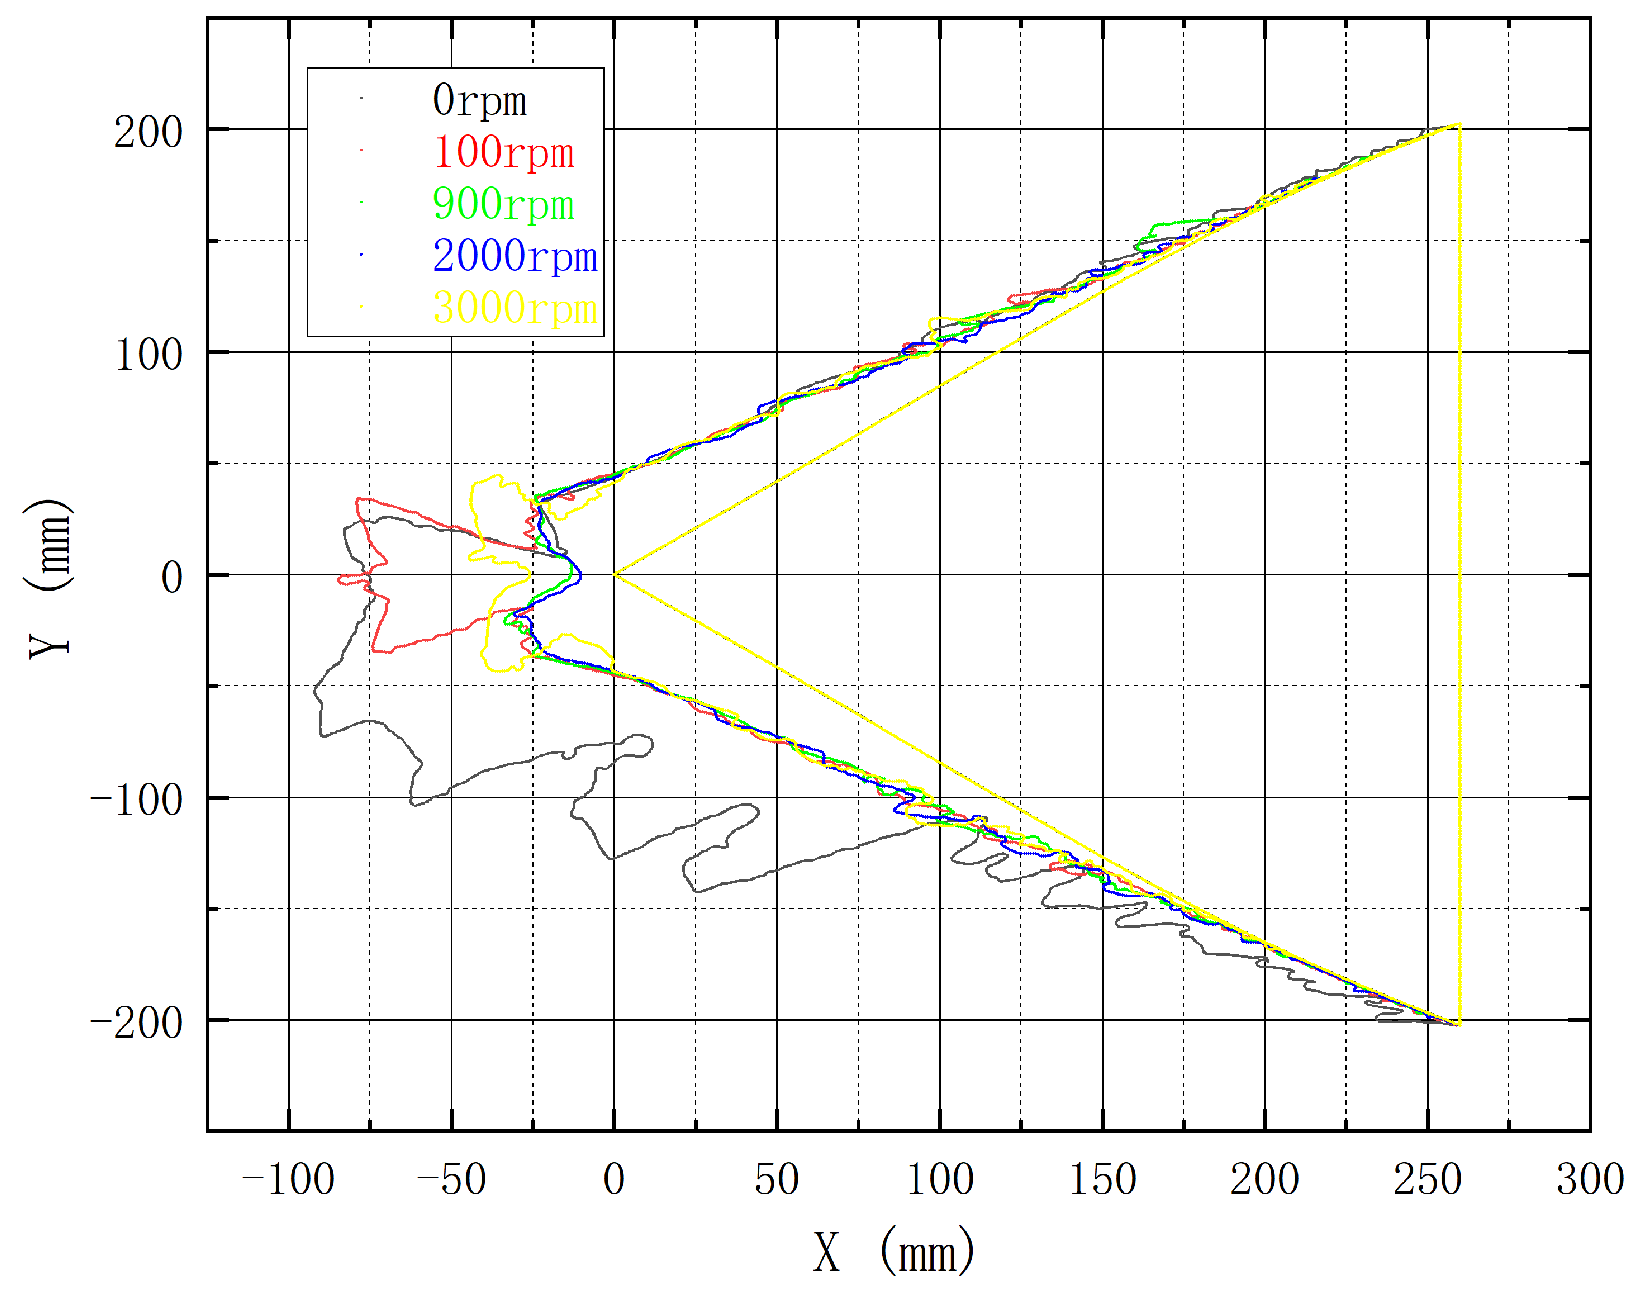
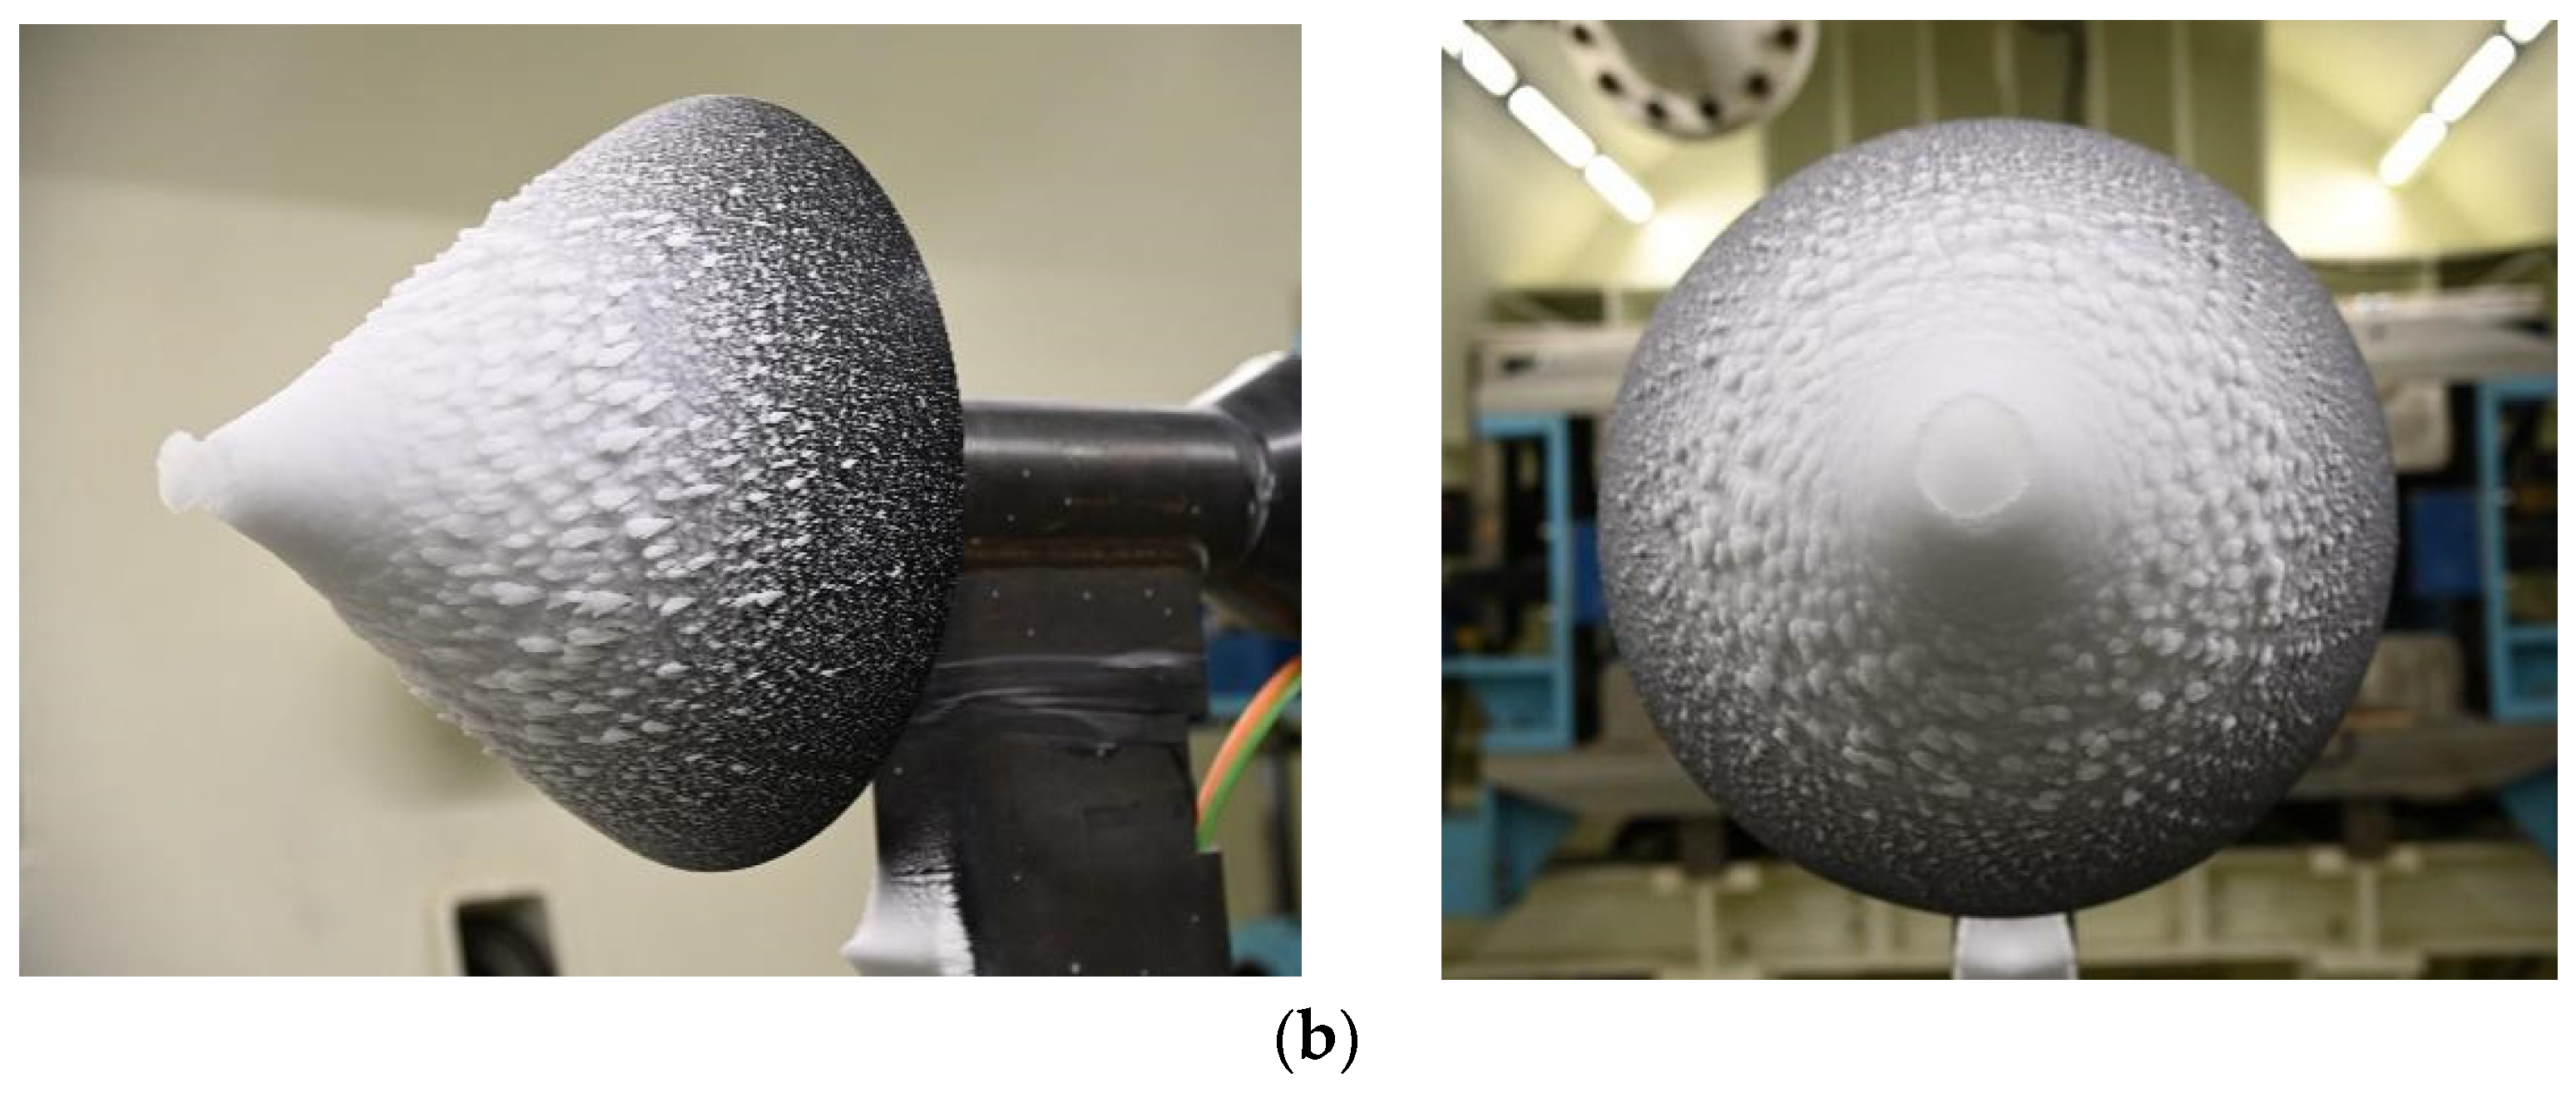
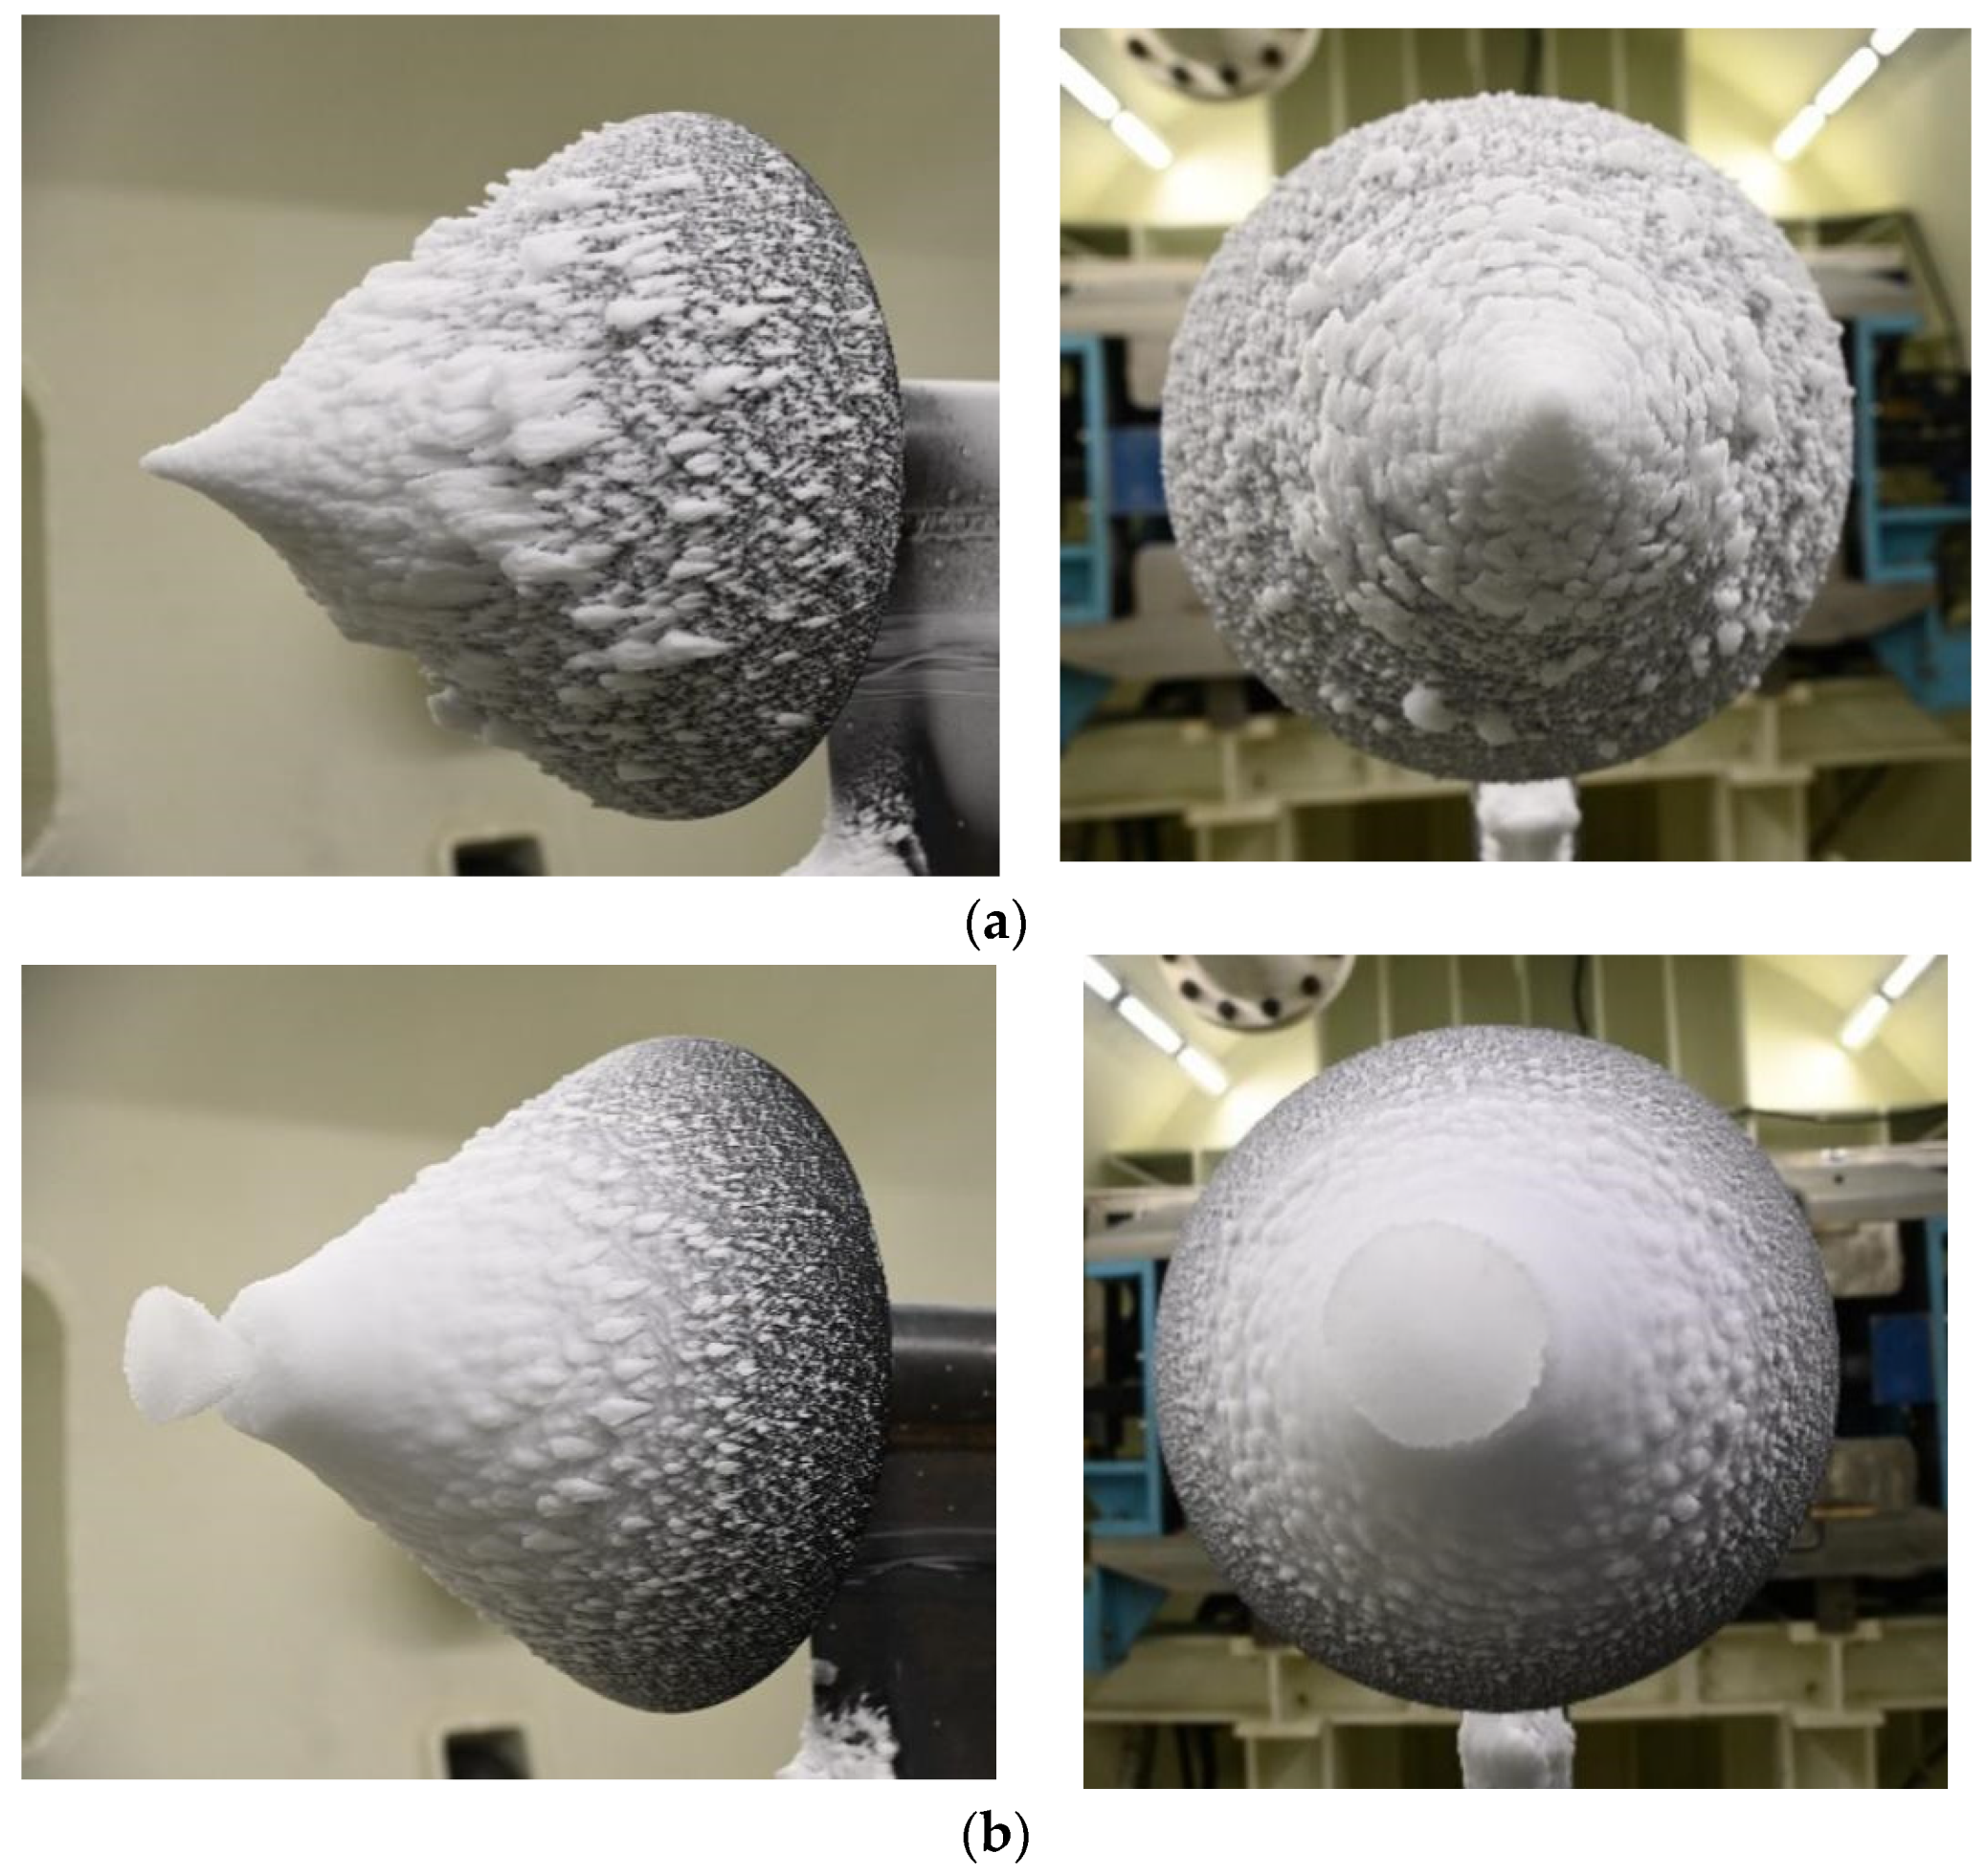
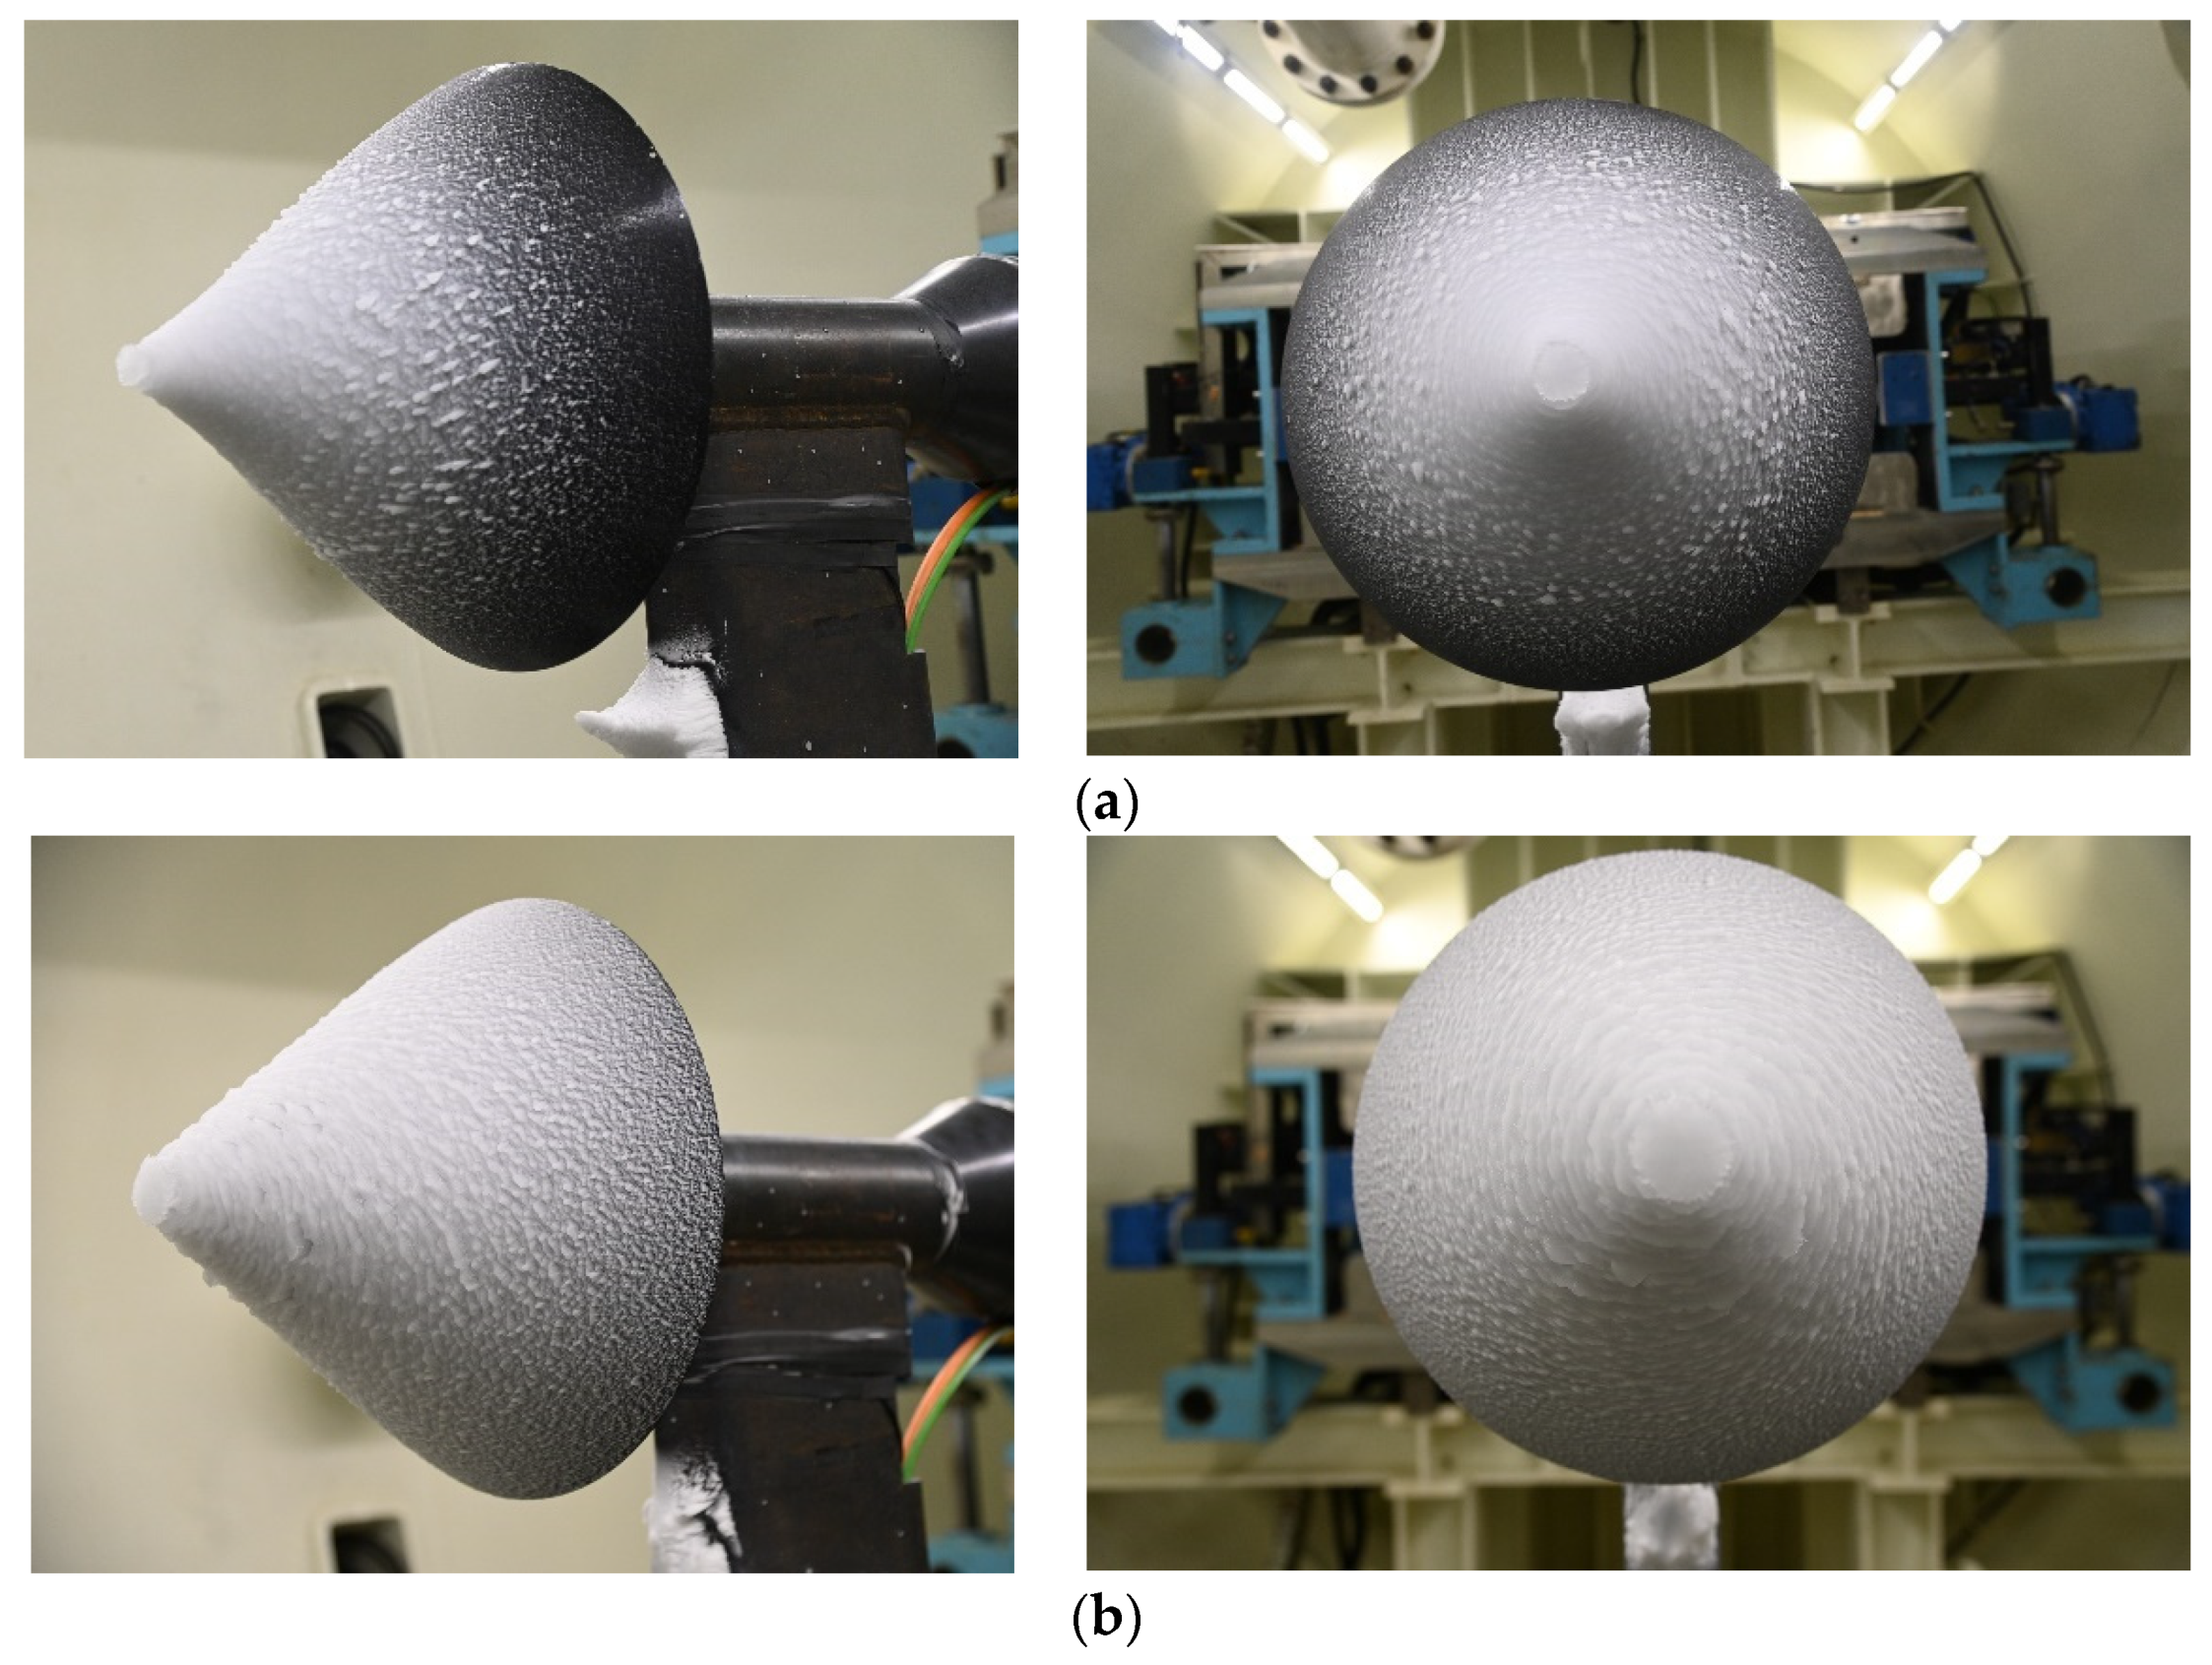
3.1. Influence of Rotational Speed on Icing

During the experiment, other experimental parameters were kept constant, and only the intake-cone rotational speed was changed to obtain ice shape data.
First, icing experiments were carried out under conditions 1 to 4, and the ice shapes are shown in Figure 5 and Figure 6. From the analysis of the ice shape data, the icing thickness at the leading edge of the intake cone remains consistent across different rotational speeds. However, as the rotational speed increases, the icing becomes relatively denser, and the ice shape becomes more concentrated toward the center when viewed from the front. Meanwhile, ice accretion at the trailing edge decreases with the increase in the rotational speed, which aligns with the general icing shedding law.
Subsequently, icing experiments were carried out under conditions 5 and 6, and the ice shapes are shown in Figure 7 and Figure 8. From the analysis of the ice shape data, with the MVD increased to 50 μm, the icing thickness at the leading edge of the intake cone remains consistent across different rotational speeds. However, due to the larger MVD, the freezing time of the droplets becomes longer, and droplets are completely frozen at the trailing edge of the intake cone, which does not shed at low speed. The ice accretion forms a circular shape when viewed from the front, similar to a petal. When the rotational speed is increased to 1500 rpm, the ice accretion at the trailing edge sheds off, and the icing range expands. The ice accretion adopts an umbrella shape, which contrasts sharply with the pattern observed at low rotational speeds.
Finally, icing experiments were conducted under conditions 7 to 11, with the results being shown in Figure 9 and Figure 10. When the rotational speed is 0 rpm, due to the cloud simulation capability of the icing wind tunnel, the icing is mainly concentrated on the corresponding surface of the wind tunnel axis. The surface water film freezes on the lower surface under the action of gravity, resulting in an asymmetric ice accretion. This situation does not occur when the rotational speed is high. This also indicates that there is a difference in the experimental results between the rotating intake cone and the stationary intake cone icing. In other experimental conditions with different rotational speeds, there is no obvious difference in the icing range and thickness. However, when the rotational speed exceeds 900 rpm, the ice is shedding from the tip of the intake cone during the experiment process, resulting in a concave ice shape.
Overall, when the incoming temperature is high, different rotational speeds have a certain effect on the location and range of ice accretion, as well as the final ice shape. This is because droplets do not immediately freeze upon impact, but instead flow. Under the condition of a rotating intake cone, the linear velocity at the tail is greater, so that shedding of the surface water film is more likely to occur, resulting in significant changes in the ice shape at the tail. When the temperature decreases to the point where the ice forms as typical rime ice, different rotational speeds only have a certain effect on the ice shedding at the intake cone tip, and have a relatively small effect on the location and range of ice accretion. This is because the droplets freeze immediately after impact, and the amount of surface icing is basically the same. But the ice formed at this condition is relatively loose, making it more prone to freezing and shedding off.

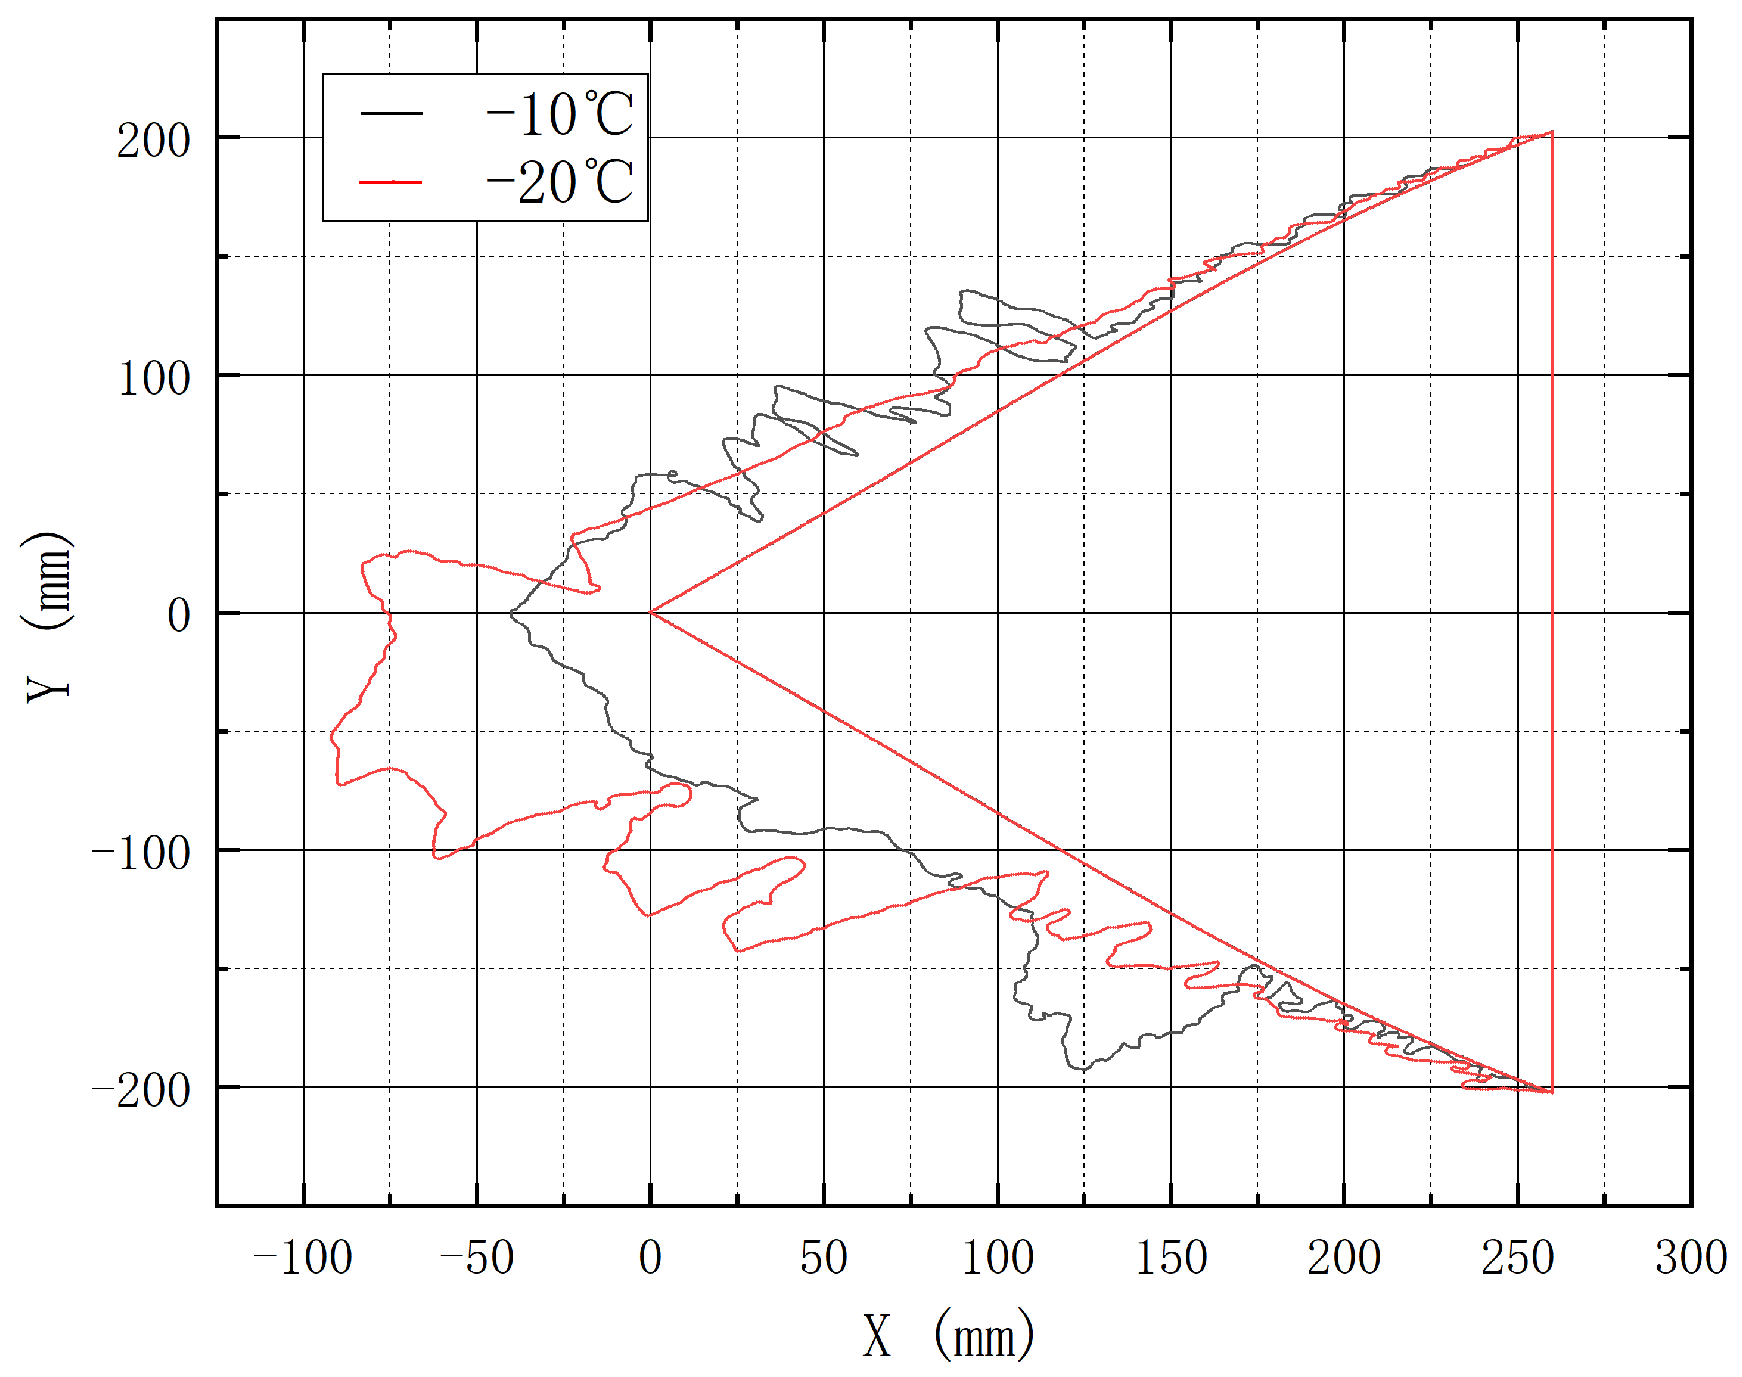
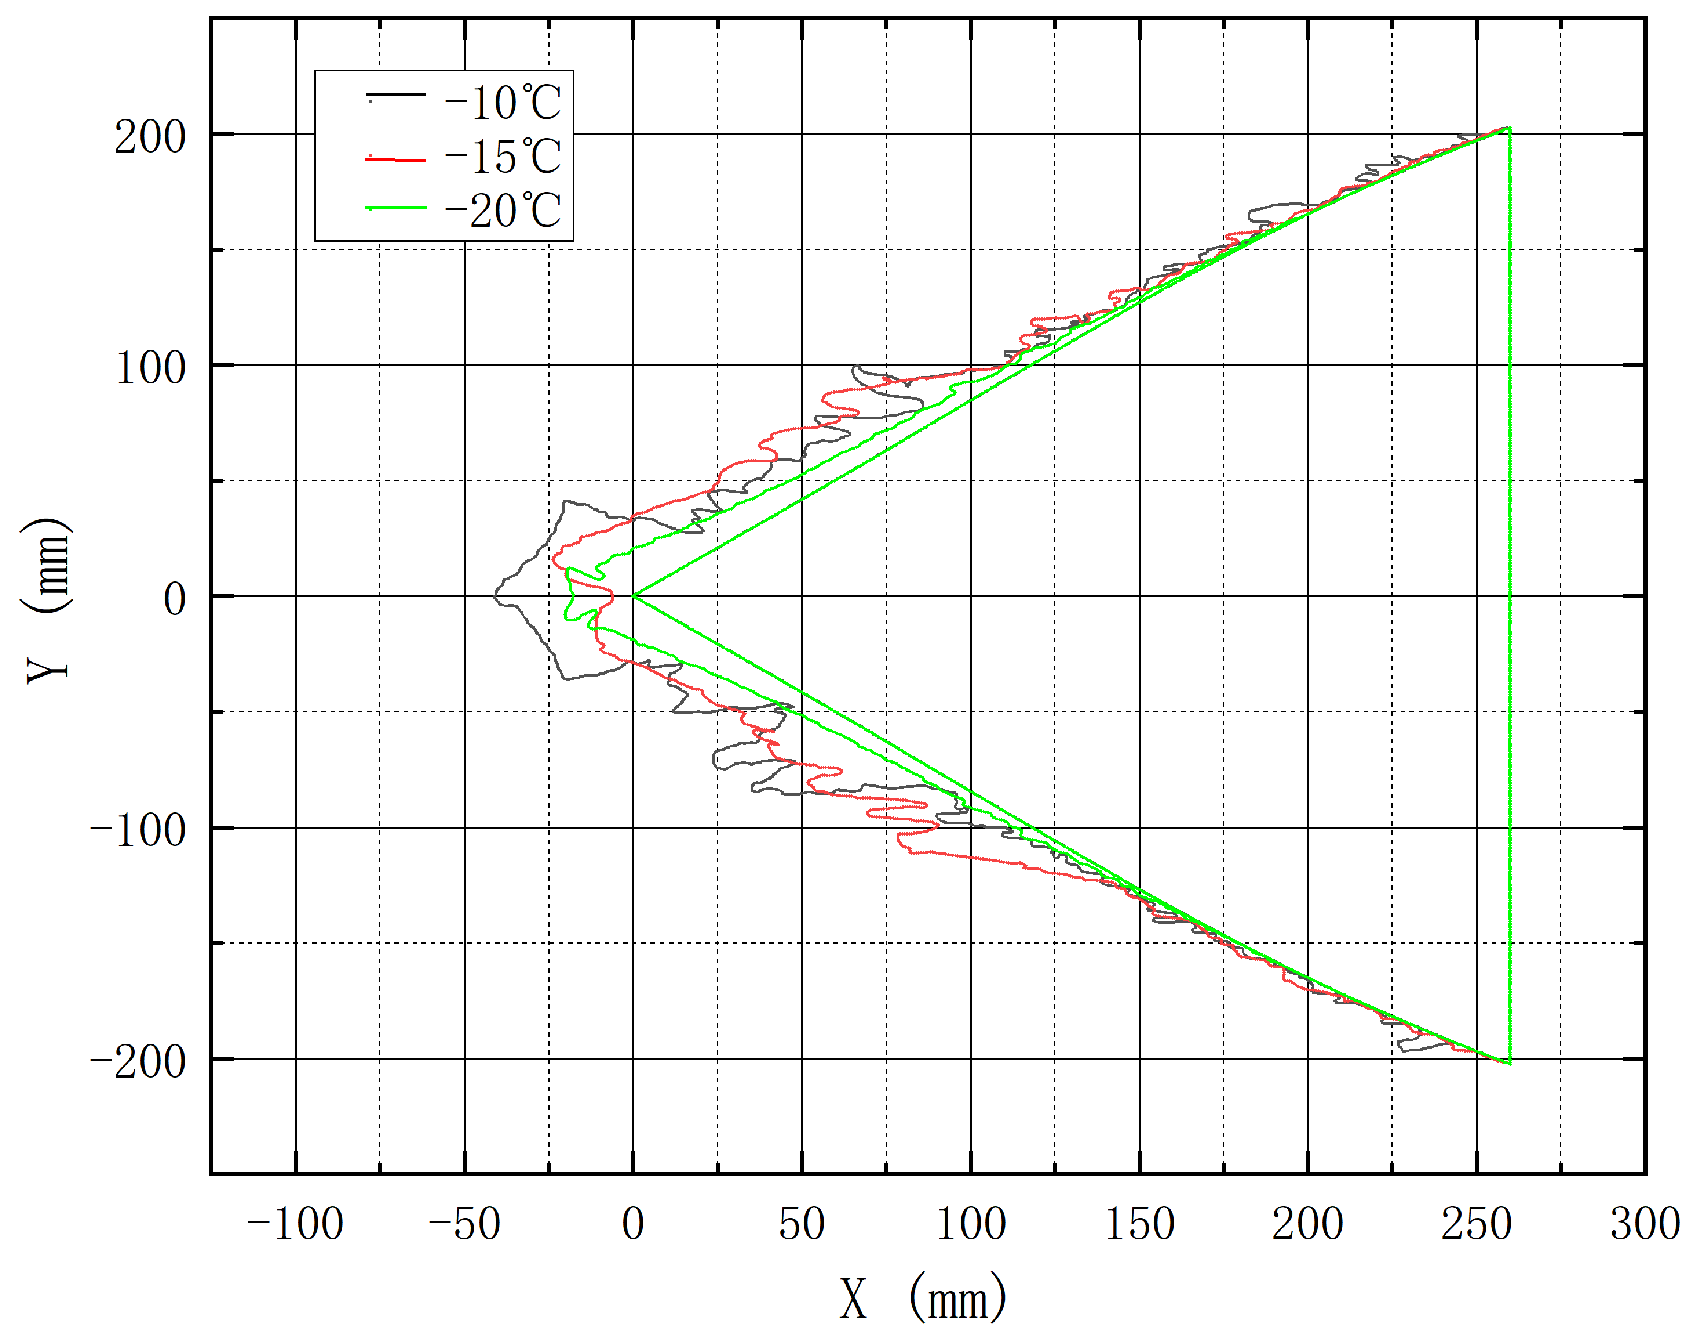
3.2. Influence of Temperature on Icing

During the icing experiment, other parameters were controlled to remain unchanged, while the temperature was varied to obtain ice shape data and analyze the influence of the temperature on intake cone icing.
First, icing experiments were conducted under conditions 7 and 12, with the ice shapes being presented in Figure 11 and Figure 12. Due to the larger MVD, an obvious glaze ice characteristic appears at −10 °C. At −20 °C, the ice shape exhibits rime ice characteristics and opacity. The icing range shows minimal variation between the two temperatures, though a greater icing thickness occurs at the intake cone tip under lower temperature conditions. In contrast, higher temperatures cause ice shedding, which results in irregular surface ice accretion.
Icing experiments were conducted under conditions 3, 13, and 14, with the ice shapes being presented in Figure 13 and Figure 14. As the temperature gradually decreases, the icing characteristics are the transition from glaze ice to rime ice. Concurrently, due to the rotational speed of intake cone, ice accretion remains uniform, though ice shedding occurs at the cone tip under both −15 °C and −20 °C conditions. Additionally, as the temperature decreases, the ice shape reveals a gradual convergence toward the intake cone surface, transitioning from a petal-like structure to a conical form. Simultaneously, the ice accretion coverage on the intake cone surface diminishes progressively, with no ice accretion observed at the trailing edge area under −20 °C conditions.
Overall, the influence of the temperature on intake cone icing primarily affects the location, type, and morphological characteristics of ice accretion. This effect becomes more pronounced when the intake cone rotates. This is because, when the icing temperature is high, droplets do not immediately freeze after impact, but freeze during the flow process. At this condition, the ice is glaze ice with a larger icing range. When the icing temperature is low, droplets immediately form ice upon impact. At this condition, rime ice forms, the icing range is smaller, and the ice is more opaque.

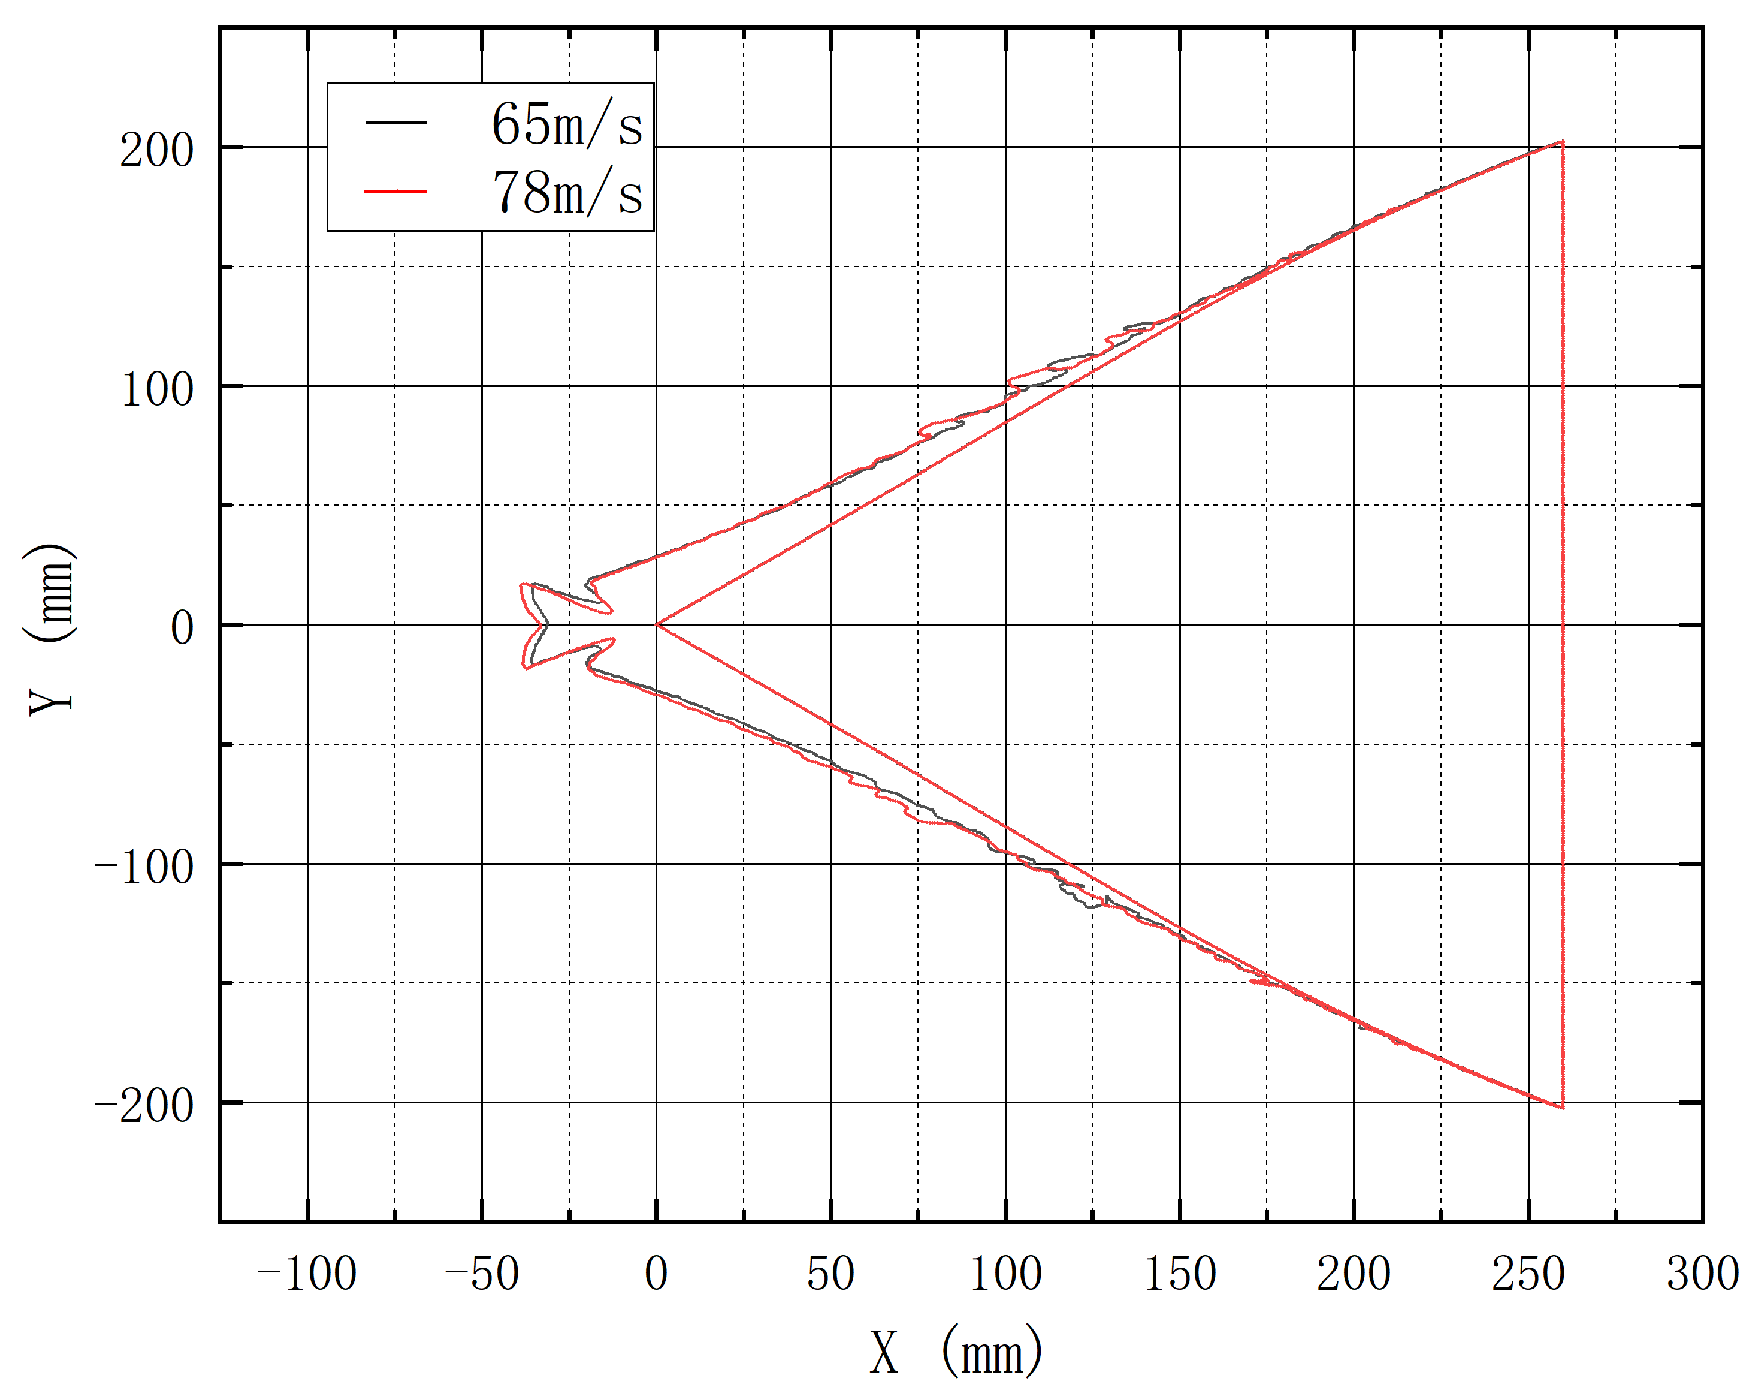
3.3. Influence of Wind Speed on Icing

Icing experiments were carried out at different wind speeds, where only the wind speed was varied to obtain ice shape data.
Icing experiments were carried out under conditions 15 and 16, and the ice shapes are shown in Figure 15 and Figure 16. At the two wind speeds, there is no significant difference in ice shape, and the icing range, thickness, and morphological characteristics are highly consistent. This is mainly due to the small change in speed during the experiment. The icing amount should be directly related to the wind speed. However, the wind speed changed from 78 m/s to 65 m/s in this paper, with a relatively small amplitude of change; so, the variation outside the ice accretion was also relatively small. Future work will involve additional experiments to further analyze these phenomena.

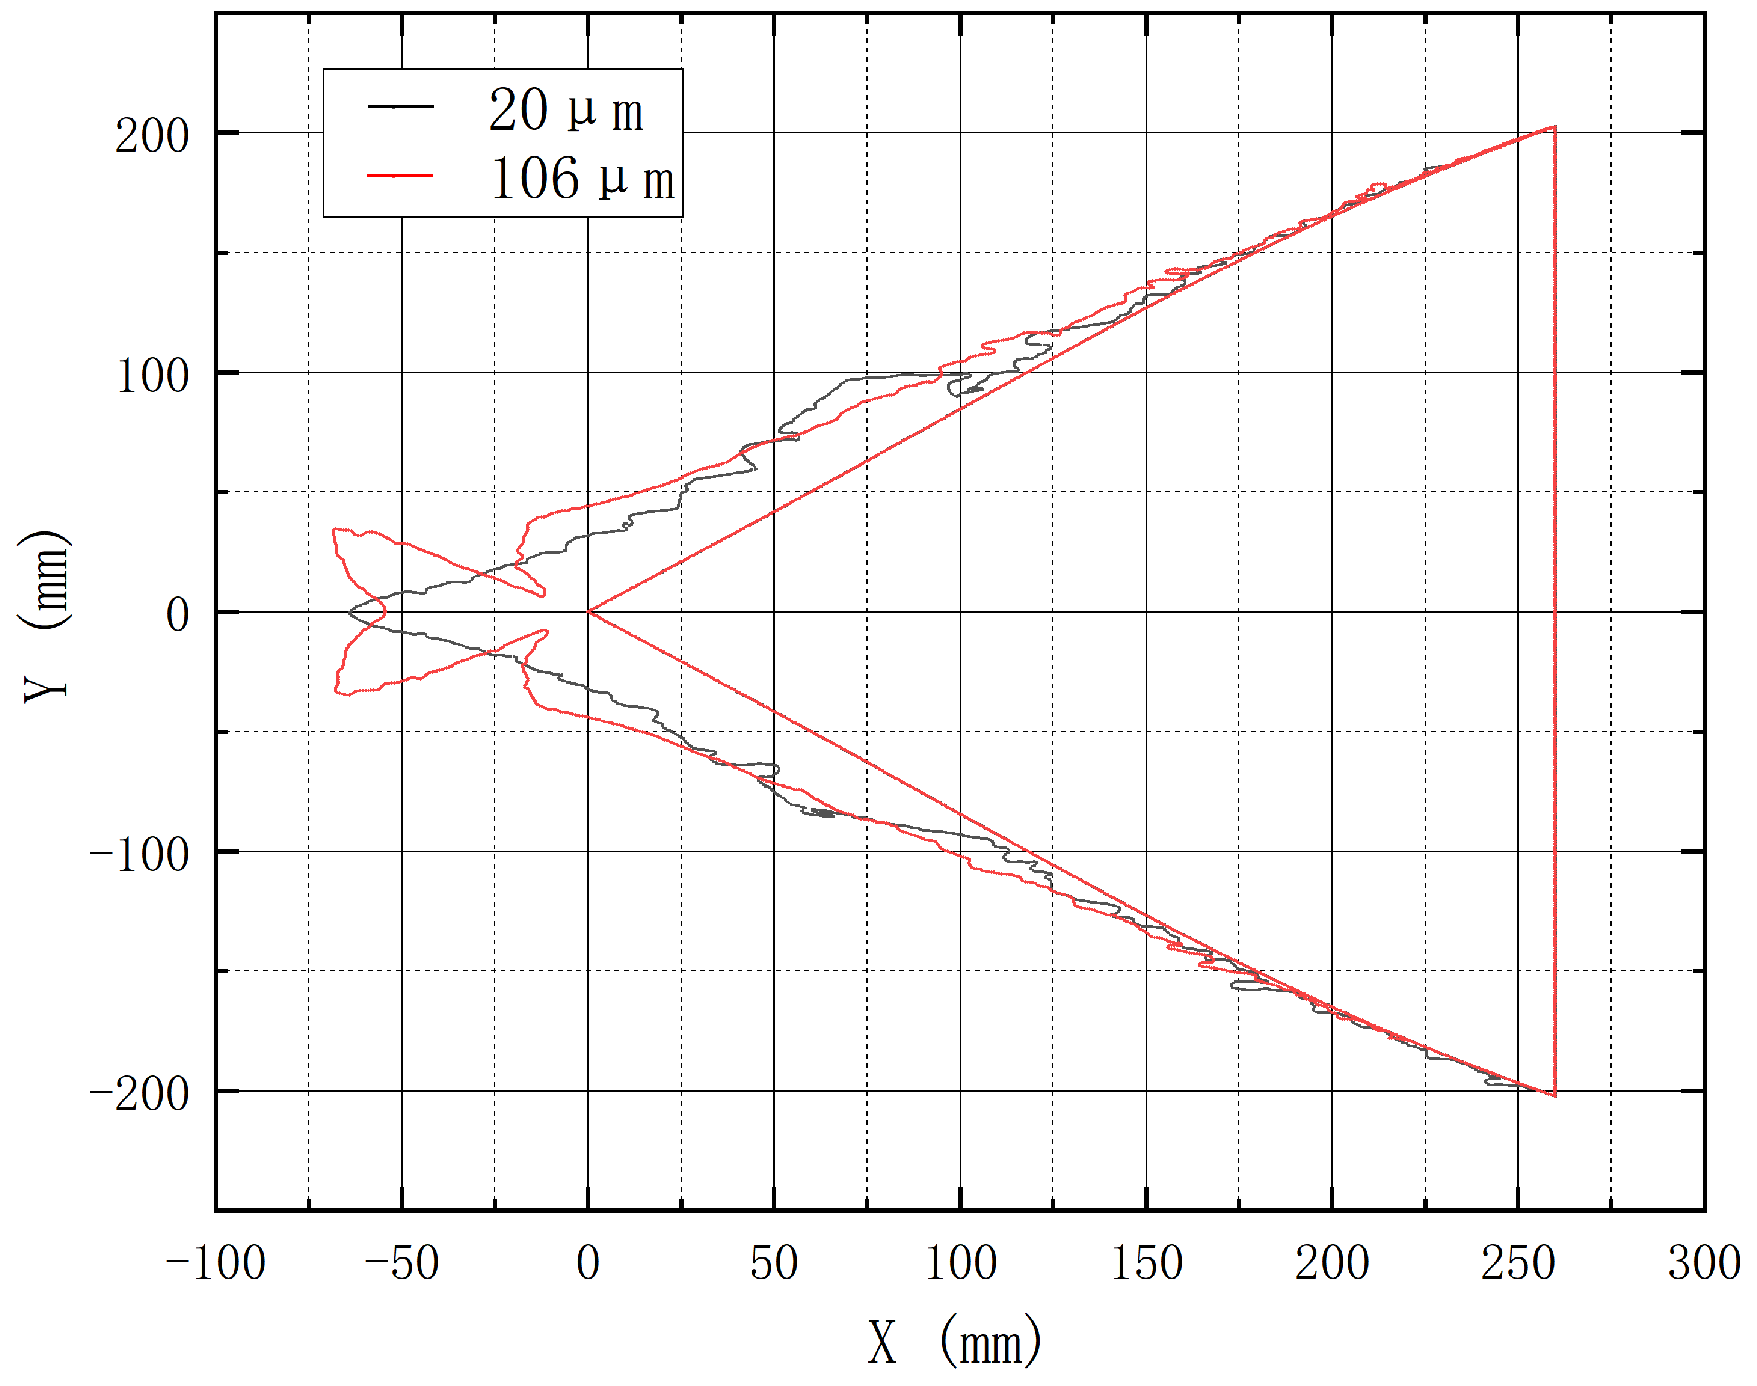
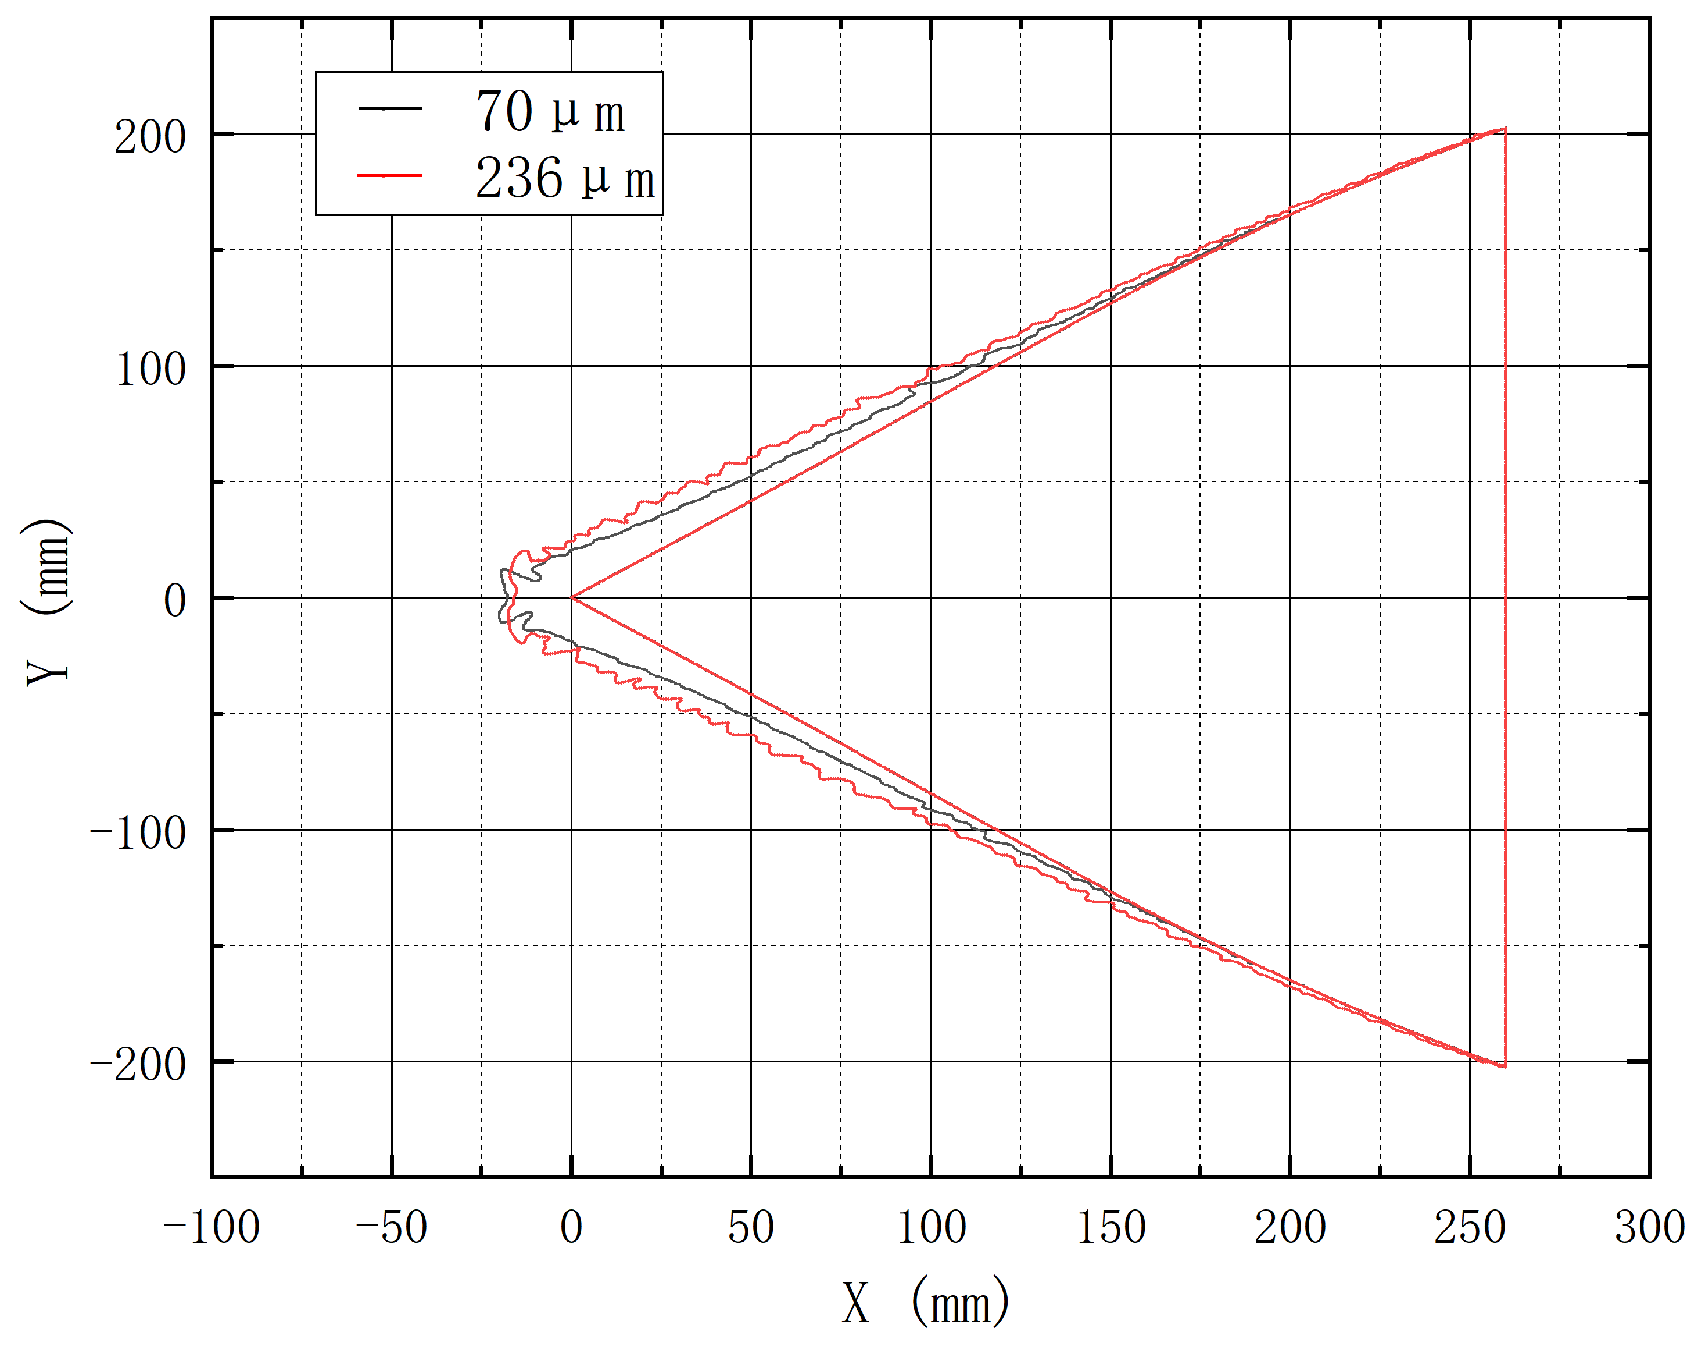
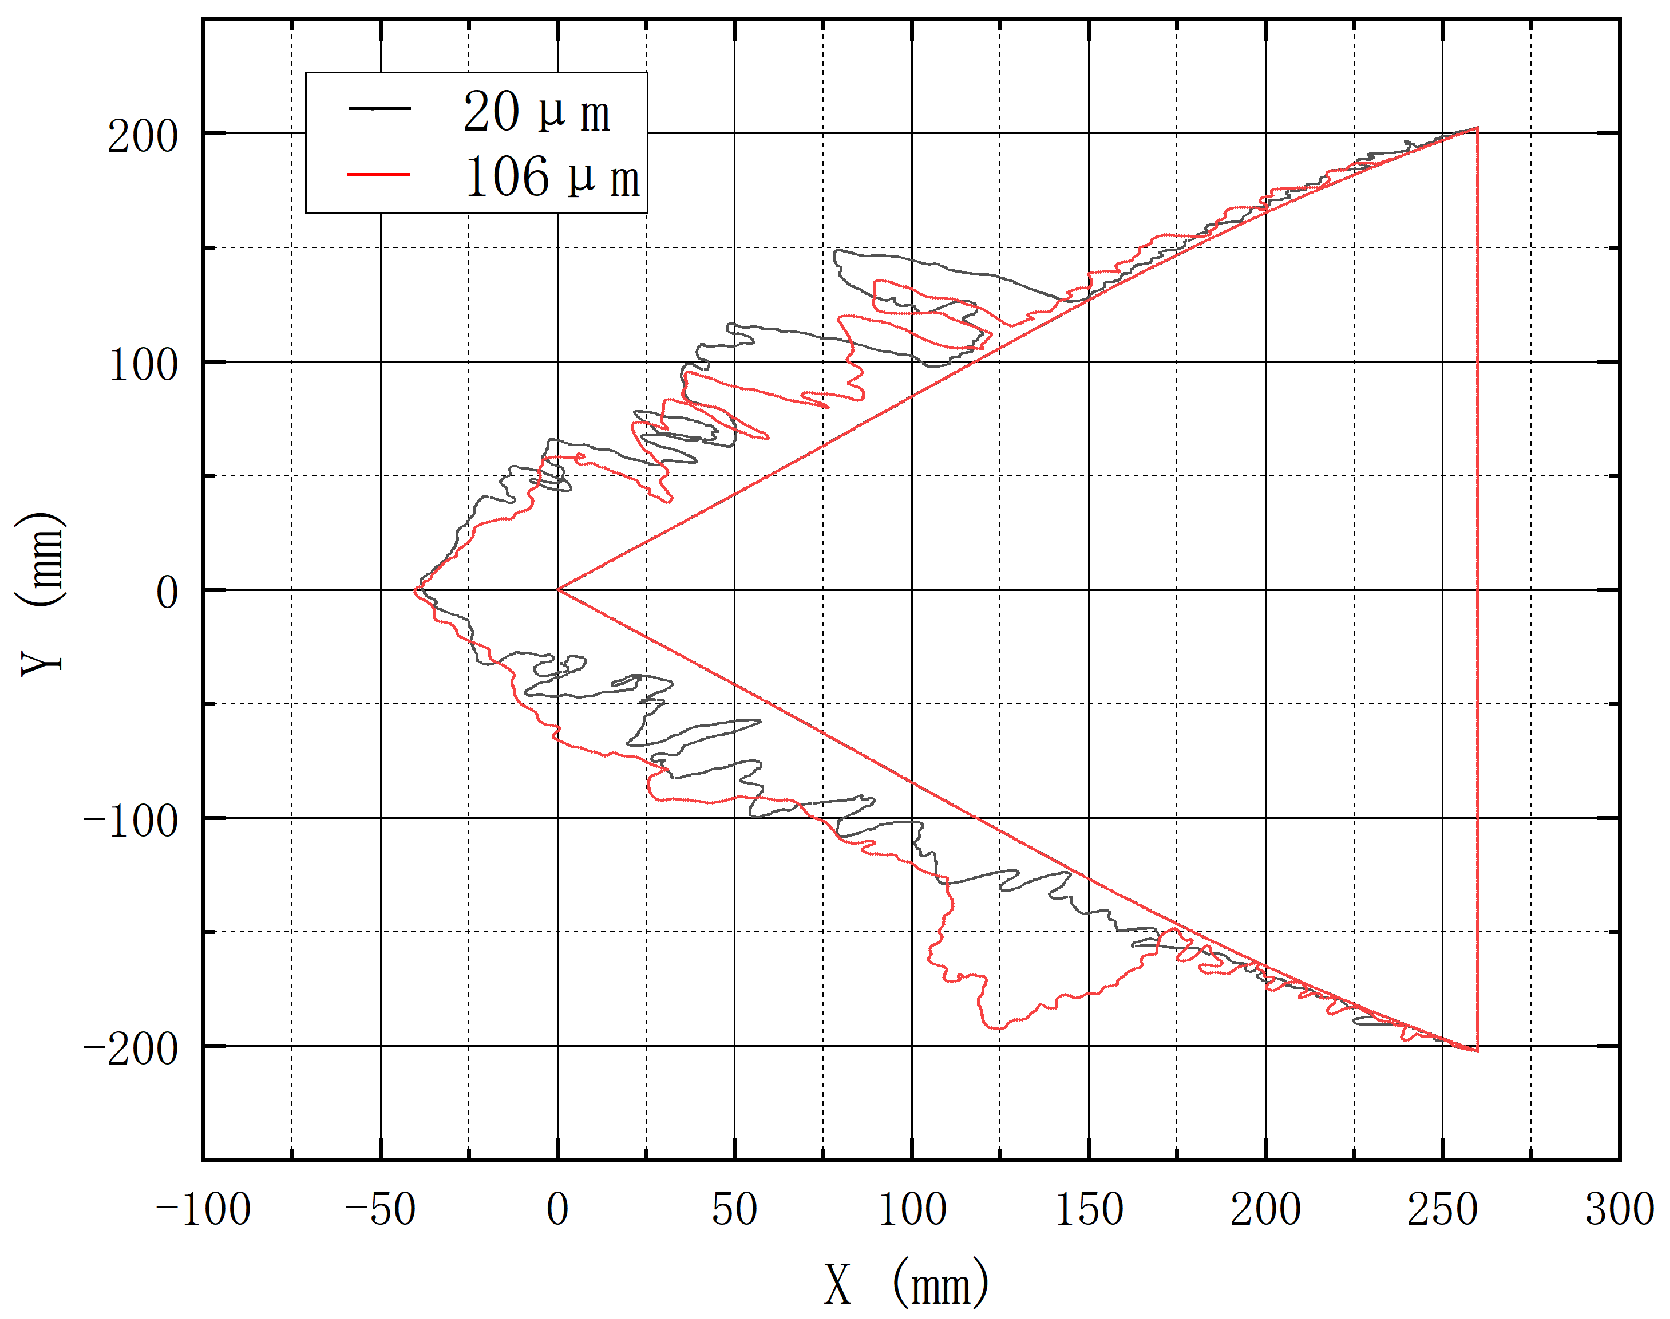
3.4. Influence of MVD on Icing

The influence of different icing parameter conditions on ice accretion was the focus of this experiment. Therefore, a comparison of ice shapes under different MVD and LWC was conducted to analyze the influence on ice accretion. In the study, the influence of SLD conditions on the icing of the intake cone was specifically investigated.
First, icing experiments were carried out under conditions 9 and 14, and the ice shapes are shown in Figure 17 and Figure 18. It can be seen that the most significant difference in ice accretion on the surface of the intake cone between MVD = 20 μm and MVD = 106 μm is reflected on the icing at the intake cone tip. As the MVD increases, the ice accretion at the intake cone tip presents a cap-like structure, while in the condition of small MVD, the ice shape remains conical.
Subsequently, icing experiments were carried out under conditions 17 and 18, with the ice shapes being presented in Figure 19 and Figure 20. When the MVDs are 70 μm and 236 μm, the primary difference in icing on the intake cone surface is reflected on the larger icing range for the larger MVD, with nearly the entire intake cone surface experiencing ice accretion. Additionally, under larger MVD conditions, the outer profile of the ice cap at the intake cone tip also increases in size.
Finally, icing experiments were conducted under conditions 1 and 12, and the ice shapes are shown in Figure 21 and Figure 22. Under this condition, due to the high static temperature of the incoming flow, the icing range under larger MVD condition is marginally greater than that under smaller MVD conditions.
Overall, different MVD conditions have a significant effect on ice accretion, mainly reflected on the icing range, outer profile characteristics of ice shape, and ice cap characteristics of the intake cone tip. This is because droplets with a smaller MVD are mainly affected by external aerodynamic forces during movement, while droplets with a larger MVD are mainly affected by inertial forces. Therefore, compared to conventional icing conditions, more droplets will collide with the surface under SLD conditions, leading to an increase in the surface icing range. The larger the MVD, the longer it takes to freeze into ice, which also affects the icing range. Specific results can be analyzed in relation to the individual experimental parameters.

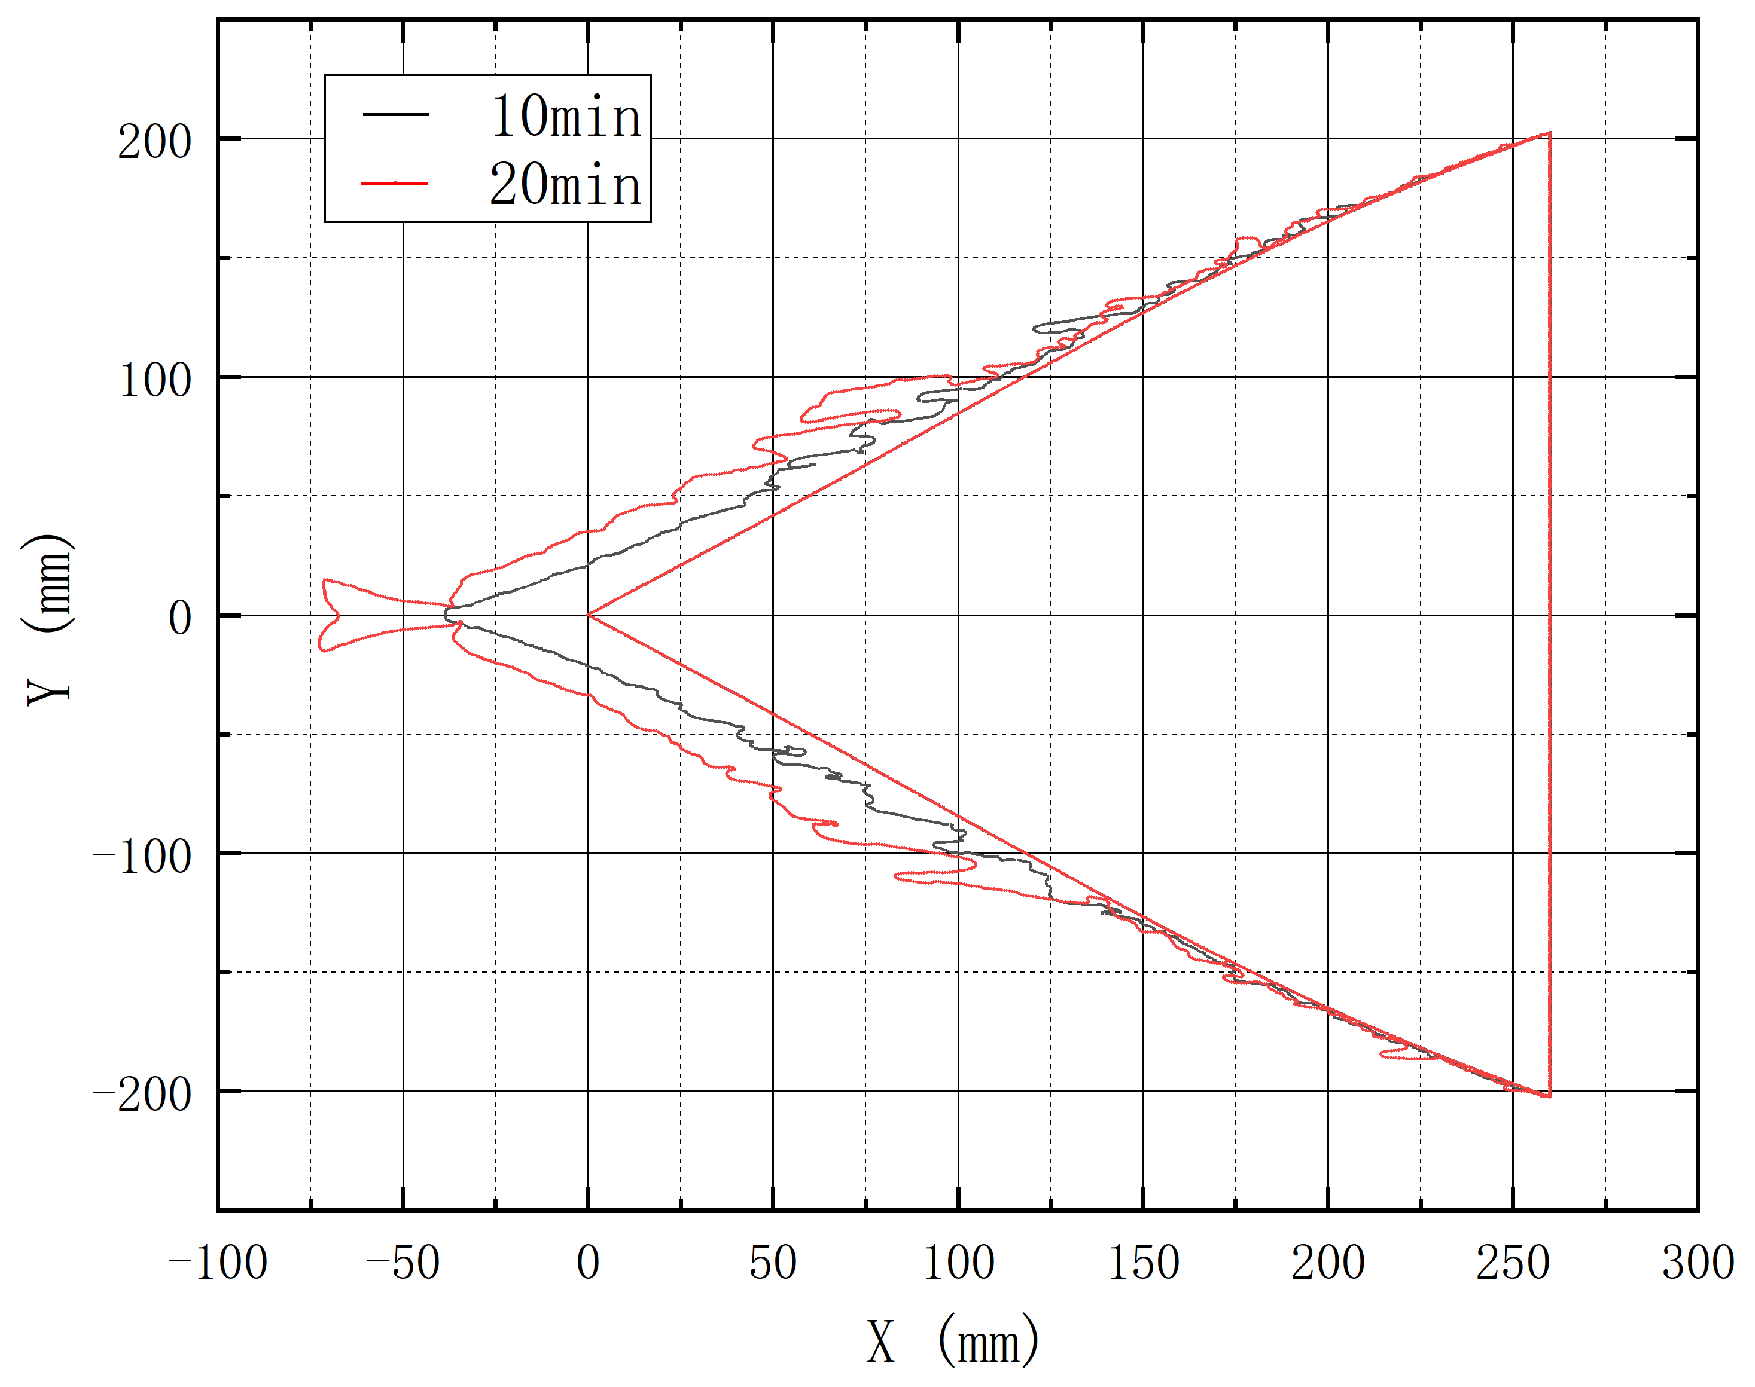
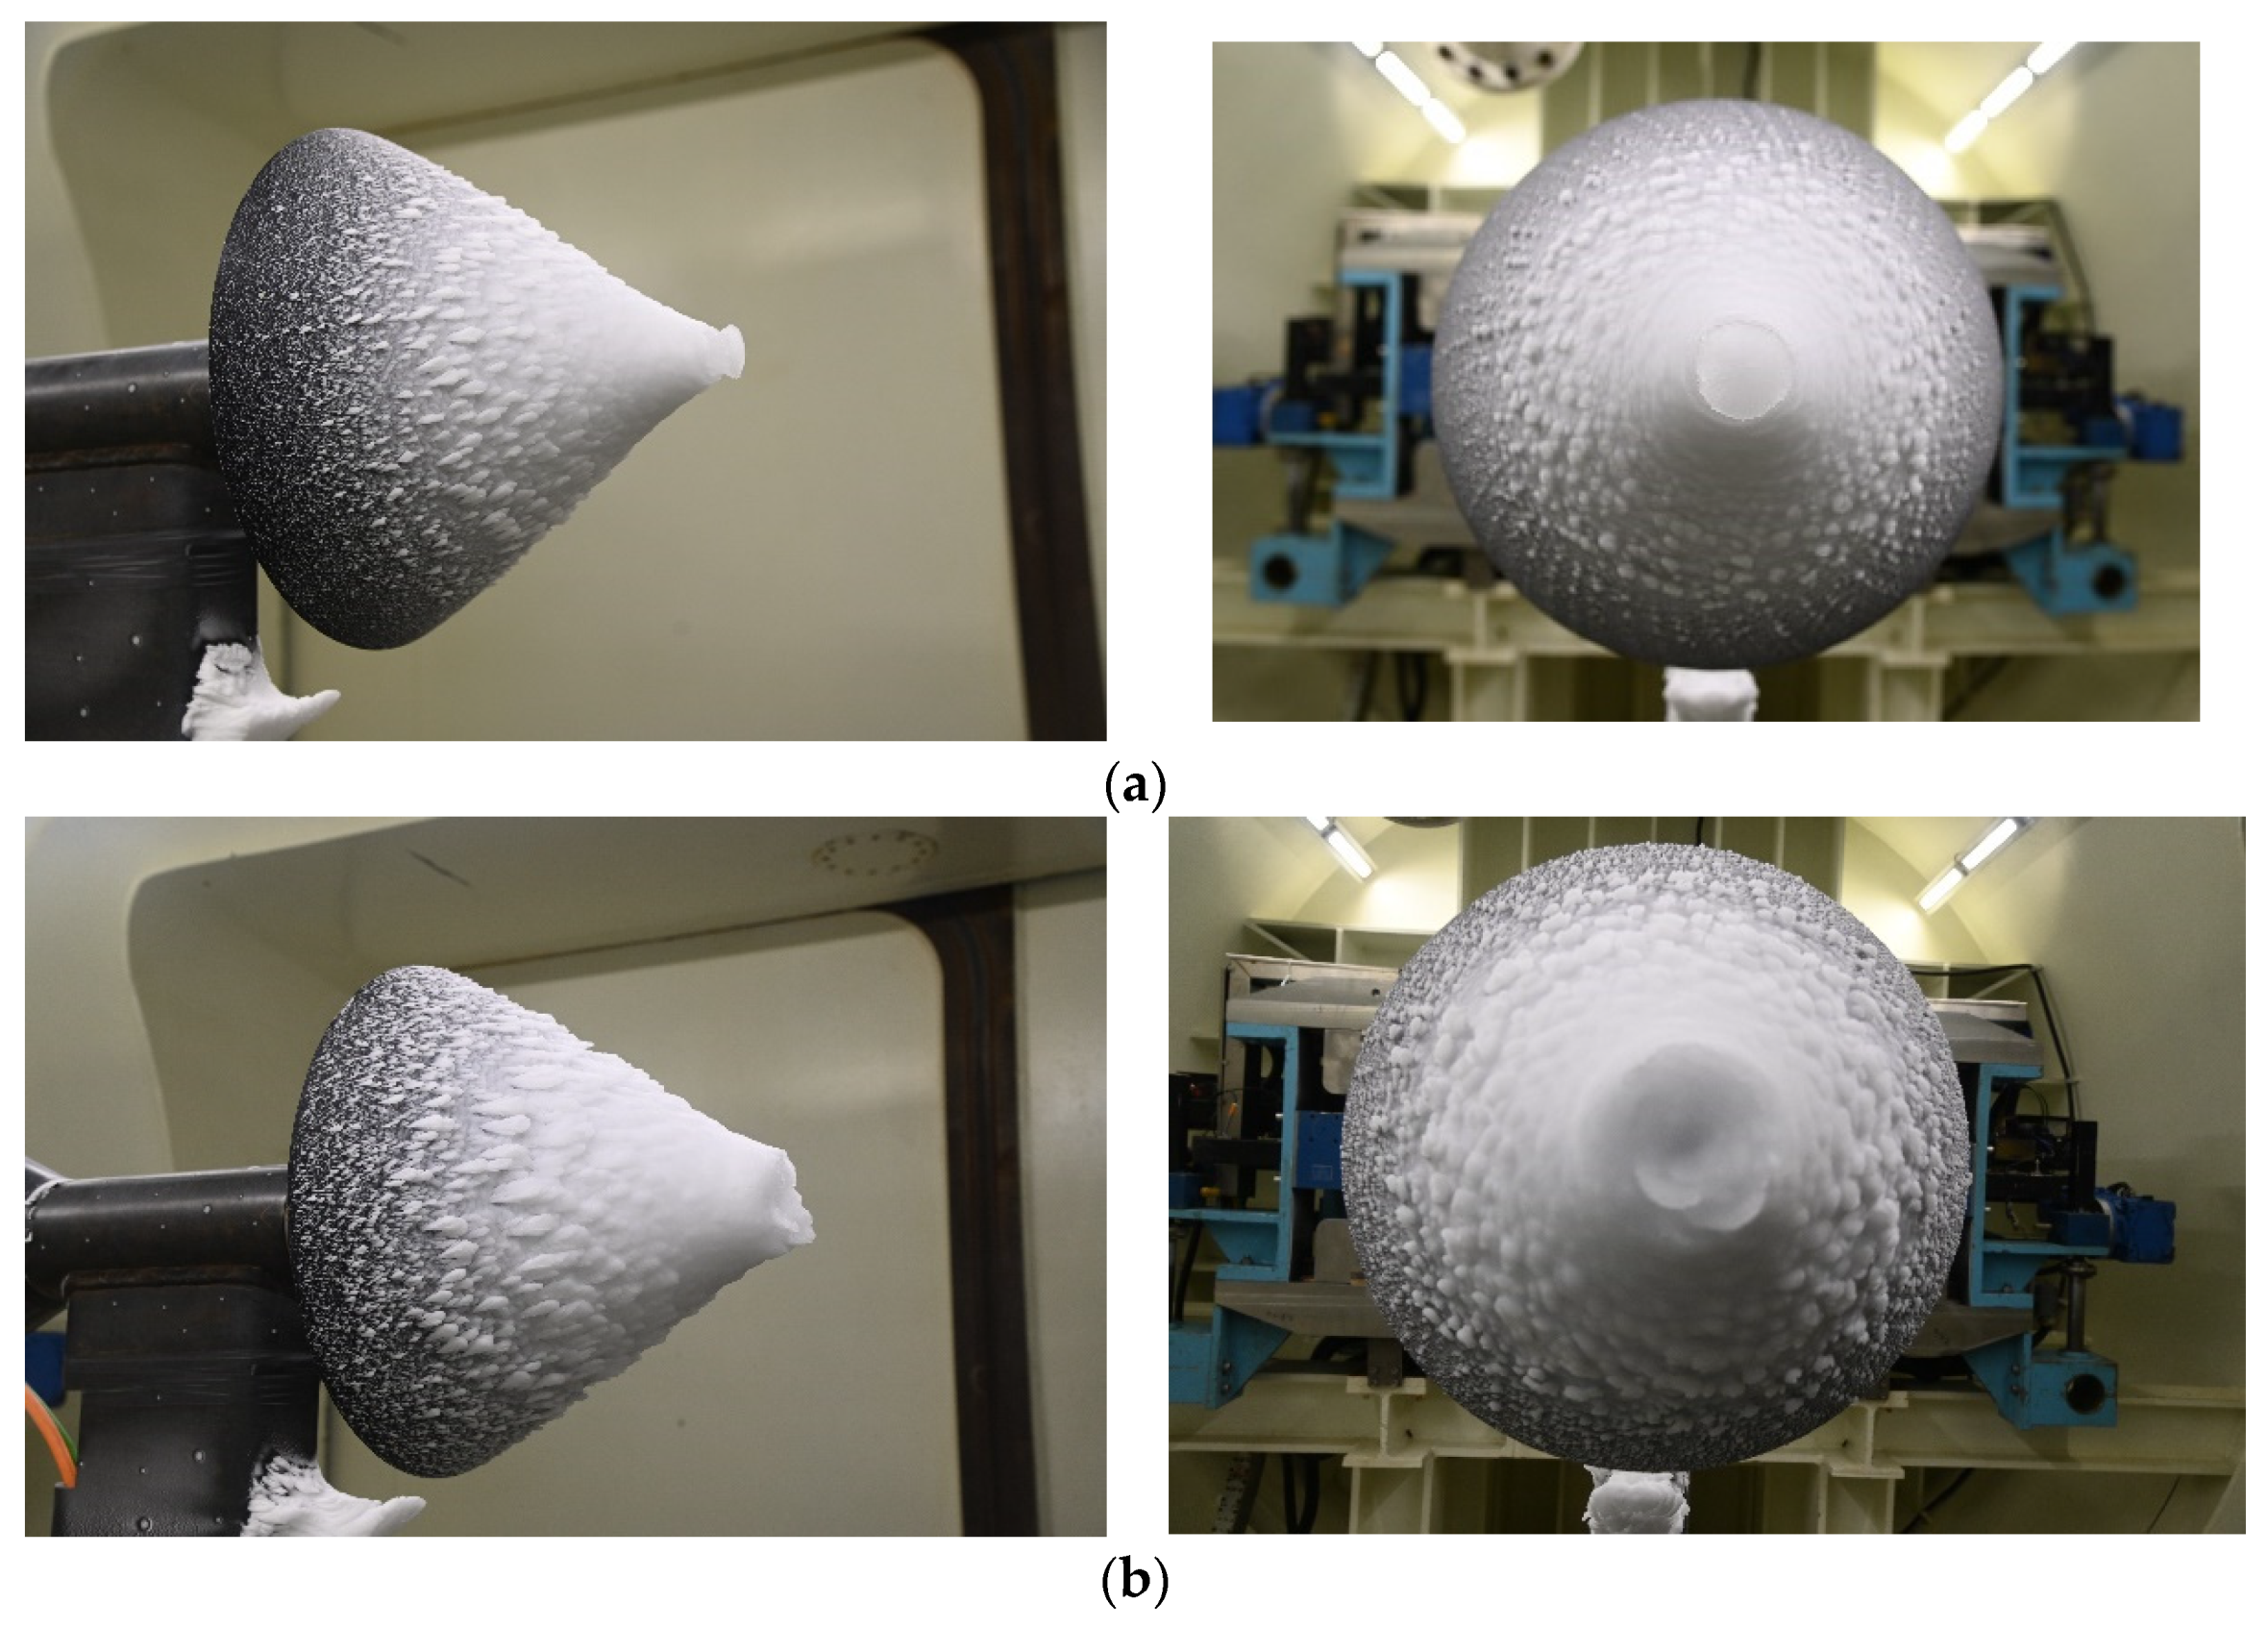
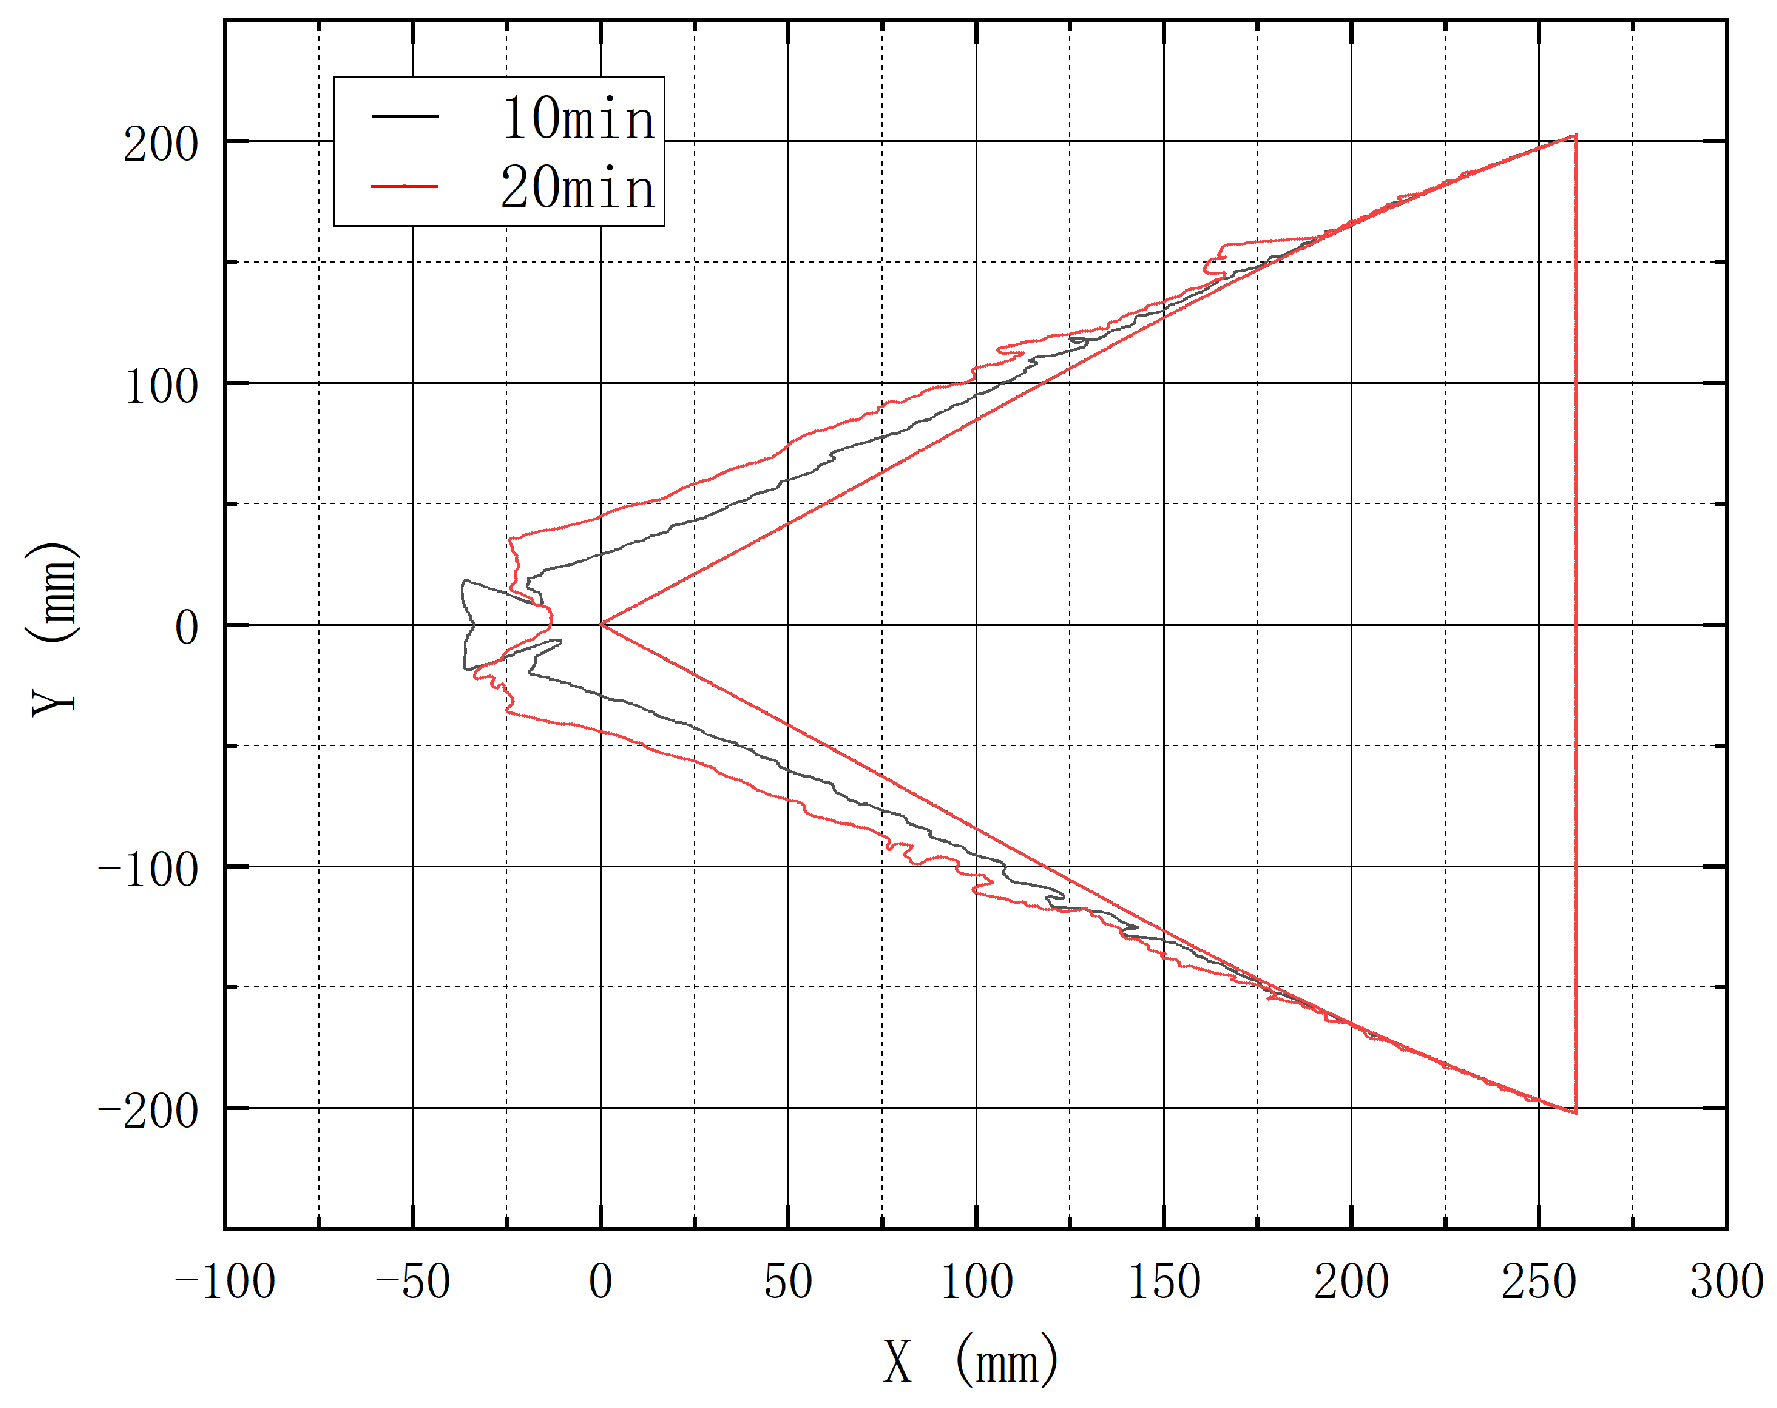
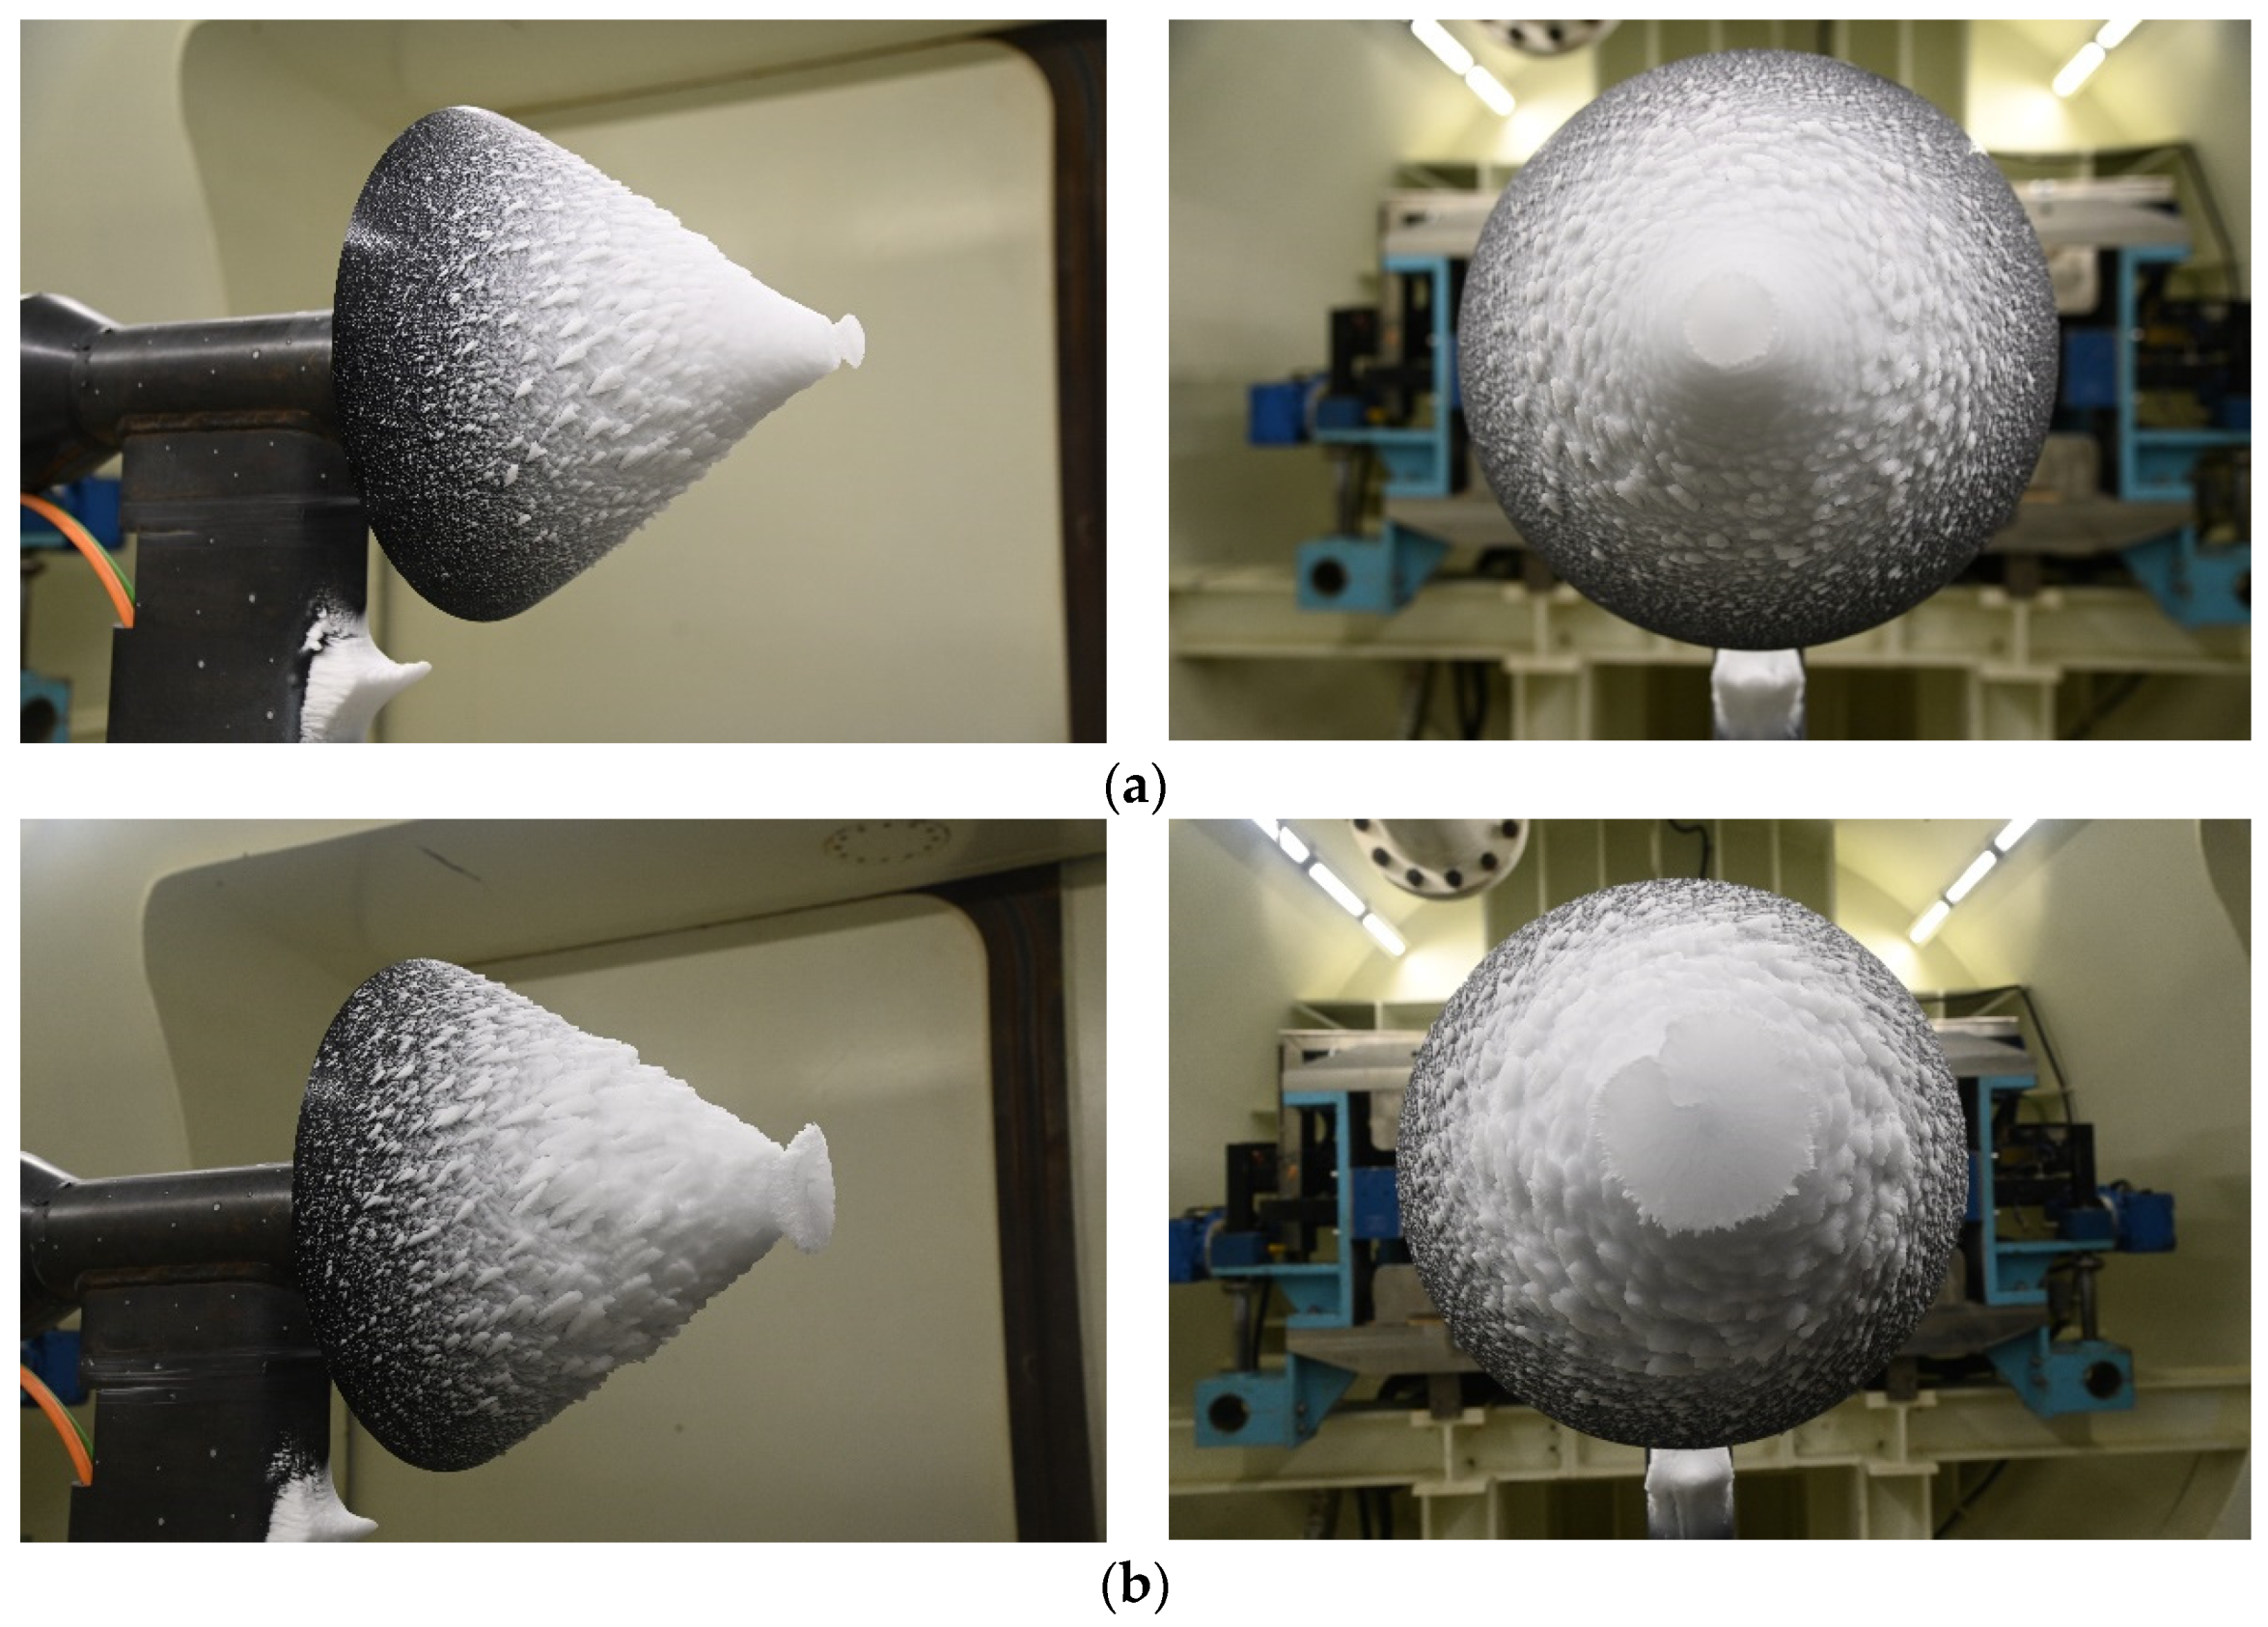
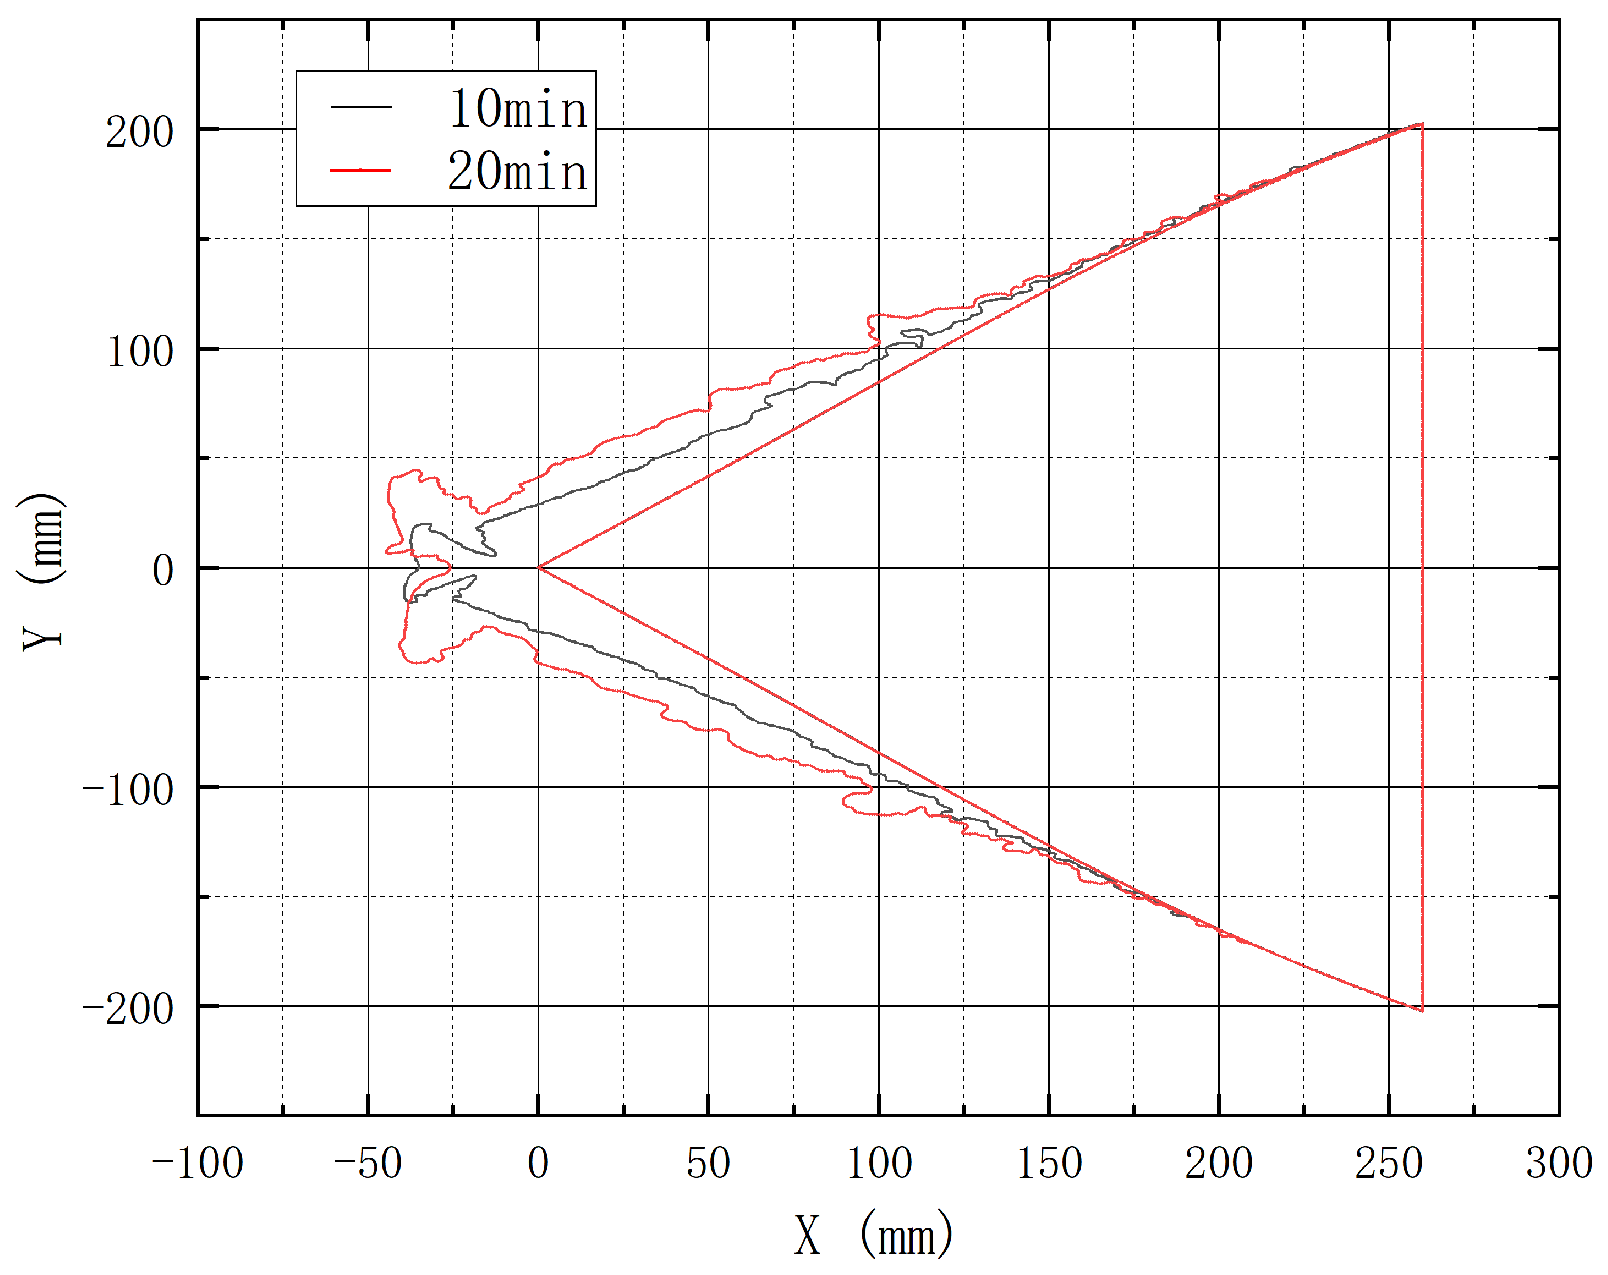
3.5. Influence of Time on Icing

Icing experiments were carried out with different icing times under the same conditions to obtain ice shape data.
First, icing experiments were carried out under conditions 3 and 19, and the ice shapes are shown in Figure 23 and Figure 24. As the icing time increases, the icing thickness at the leading edge of the intake cone becomes larger, and the ice accretion at the intake cone tip evolves from a conical shape to an ice cap shape.
Subsequently, icing experiments were carried out under conditions 10 and 20. The icing times were 10 min and 20 min, and the ice shapes are shown in Figure 25 and Figure 26. The experiment with an icing time of 20 min experienced ice shedding at the intake cone tip during the icing process, resulting in a slightly shorter ice shape in the final scan. An increase in icing time led to an increase in the icing thickness at the leading edge of the intake cone, with no significant effect on other icing characteristics.
Finally, icing experiments were carried out under conditions 11 and 21, with the ice shapes being shown in Figure 27 and Figure 28. Under these conditions, no ice shedding occurred at the intake cone tip, and increased icing time only altered icing thickness at the leading edge and the size of the ice cap at the cone tip, without significant effect on other icing characteristics.
From the above conditions, it can be seen that an increased icing time primarily affects the icing amount in areas prone to ice accretion at the leading edge of the intake cone, while having no significant effect on other icing characteristics. As the icing time increases, the ice accretion increases, making it more likely that icing shedding off will occur.

4. Conclusions

The icing experiments of a rotating intake cone under conventional droplet and SLD conditions were carried out. Different from existing research, icing wind tunnel experiments under SLD conditions were conducted and the icing patterns on the intake cone under different conditions were studied. The differences in icing characteristics between SLD and conventional droplets were compared, and the main characteristics of SLD icing were obtained.
In the experiment, the influence of factors such as rotational speed of intake cone, icing temperature, wind speed, droplet parameters, and icing time on ice accretion of the intake cone was studied. The influence laws under experimental conditions were mastered. Parameters such as intake cone rotational speed, icing temperature, and MVD significantly affect intake cone icing characteristics. The lower the icing temperature, the larger the MVD and LWC, and the longer the icing time and the more severe the icing, with condition 12 having the most severe icing in this experiment. The influence of a single variable on ice accretion are also constrained by other factors. It is necessary to comprehensively analyze the effect of various variables on icing. For example, in the study of the influence of rotational speed, the influence of icing temperature also exists. That is, when the icing temperature is higher, different speeds have a certain effect on the location and range of ice accretion, as well as the final ice shape. As the speed increases, the ice accretion becomes denser and more compact towards the intake cone. However, when the temperature decreases and the ice forms typical rime ice, different speeds only have a certain effect on the ice shedding at the intake cone tip, and the effect on the location and range of icing becomes very small.
However, there are also certain shortcomings. The experimental verification of individual influencing factors is not sufficient, and more experiments are still needed to verify the correctness of the influence laws.

Author Contributions

Conceptualization, Z.Z. and D.Z.; methodology, H.Z. and D.Z.; software, H.D.; validation, Z.Z., D.Z. and H.Z.; investigation, Z.Z.; resources, H.D.; writing—original draft preparation, Z.Z., H.Z. and Z.W.; writing—review and editing, Z.Z., H.Z. and Z.W.; visualization, H.D.; supervision, Z.W.; funding acquisition, D.Z. and H.Z. All authors have read and agreed to the published version of the manuscript.

Funding

This work was supported by the National Key R&D Program of China (Grant No. 2022YFE0203700), the National Natural Science Foundation of China (Grant No. 12402330), and the Aeronautical Science Foundation of China (Grant No. 2023M066027001).

Institutional Review Board Statement

Not applicable.

Informed Consent Statement

Not applicable.

Data Availability Statement

The original contributions presented in this study are included in the article. Further inquiries can be directed to the corresponding authors.

Conflicts of Interest

The authors declare no conflicts of interest.

Abbreviations

The following abbreviations are used in this manuscript:
SLDSupercooled Large Droplet
LWCLiquid Water Content
MVDMean Volume Diameter
AVICAviation Industry Corporation of China
SAESociety of Automotive Engineers
ARPAerospace Recommended Practice
FARsFederal Aviation Regulations

References

  1. Yamazaki, M.; Jemcov, A.; Sakaue, H. A review on the current status of icing physics and mitigation in aviation. Aerospace 2021, 8, 188. [Google Scholar] [CrossRef]
  2. Zhou, L.; Yi, X.; Liu, Q. A review of icing research and development of icing mitigation techniques for fixed-wing UAVs. Drones 2023, 7, 709. [Google Scholar] [CrossRef]
  3. Dong, W.; Zhu, J.; Lei, G.; Zheng, M. Numerical Simulation of Hot Air Anti-Icing Characteristics of an Aero-Engine Strut. In Proceedings of the 53rd AIAA Aerospace Sciences Meeting, AIAA-2015-0537, Kissimmee, FL, USA, 5–9 January 2015. [Google Scholar]
  4. Lian, W.; Xuan, Y. Experimental investigation on a novel aero-engine nose cone anti-icing system. Appl. Therm. Eng. 2017, 121, 1011–1021. [Google Scholar] [CrossRef]
  5. Mason, J.; Strapp, W.; Chow, P. The ice particle threat to engines in flight. In Proceedings of the 44th AIAA Aerospace Sciences Meeting and Exhibit, AIAA-2006-0206, Reno, Nevada, 9–12 January 2006. [Google Scholar]
  6. Shi, L.; Feng, F.; Guo, W.; Li, Y. Research and Development of a Small-Scale Icing Wind Tunnel Test System for Blade Airfoil Icing Characteristics. Int. J. Rotating Mach. 2021, 2021, 5598859. [Google Scholar] [CrossRef]
  7. Li, Y.; Tagawa, K.; Feng, F.; Li, Q.; He, Q. A wind tunnel experimental study of icing on wind turbine blade airfoil. Energy Convers. Manag. 2014, 85, 591–595. [Google Scholar] [CrossRef]
  8. Li, L.; Hu, H. An experimental study of dynamic ice accretion process on aero-engine spinners. In Proceedings of the 55th AIAA Aerospace Sciences Meeting, AIAA-2017-0551, Grapevine, TX, USA, 9–13 January 2017. [Google Scholar]
  9. Wang, J.; Hu, Y.P.; Ji, H.H.; Chen, N.-L.; Cao, G.Z. Experiment of ice accretion and shedding on rotating spinner. J. Aerosp. Power 2014, 29, 1352–1357. [Google Scholar]
  10. Chen, N.L.; Ji, H.H.; Hu, Y.P.; Wang, J.; Cao, G. Experimental study of icing accretion on a rotating conical spinner. Heat Mass Transf. 2015, 51, 1717–1729. [Google Scholar] [CrossRef]
  11. Hu, Y.P.; Ji, H.H.; Wang, J.; Chen, N.L.; Cao, G.Z.; Tong, H.; Pang, L. Experiment on effect of cone angle on ice accretion of rotating spinner. J. Aerosp. Power 2014, 29, 495–503. [Google Scholar]
  12. Mu, Z.D.; Shen, X.B.; Lin, G.P.; Bu, X. Numerical simulation for ice accretion on rotating cowling considering water film shedding. In Proceedings of the 54th AIAA Aerospace Sciences Meeting, AIAA 2016-2187, San Diego, CA, USA, 4–8 January 2016. [Google Scholar]
  13. Zhao, Q.Y.; Dong, W.; Zhu, J.J. Droplets impinging characteristic analysis of the rotating fairing of aero-engine. Gas Turbine Exp. Res. 2011, 24, 32–35. [Google Scholar]
  14. Wu, M.L.; Chang, S.N.; Leng, M.Y.; Wang, C. Simulation of droplet impingement characteristics of spinner based on Eulerian method. J. Beijing Univ. Aeronaut. Astronaut. 2014, 40, 1263–1267. [Google Scholar]
  15. Zhang, L.F.; Zhang, M.H.; Liu, Z.X. Collection efficiency of rotating spin in jet engine. In Proceedings of the 22nd International Symposium on Air Breathing Engines Conference, Phoenix, AZ, USA, 25–30 October 2015. [Google Scholar]
  16. Zhang, L.F.; Zhang, M.H.; Zhang, X.X.; Liu, Z. Modeling of ice accretion on rotating cone in aero-engine. In Proceedings of the 52nd AIAA/SAE/ASEE Joint Propulsion Conference, AIAA 2016-5059, Salt Lake City, UT, USA, 25–27 July 2016. [Google Scholar]
  17. Hu, Y.; Xu, C.; Li, S.; Li, P.; Liu, L. Experimental study on icing and anti-icing of a rotating conical spinner. Appl. Therm. Eng. 2023, 219, 119373. [Google Scholar] [CrossRef]
  18. He, H.; Peng, H.; Li, G.; Zhang, W.; Zhao, Z. Ice accretion and ice shedding on an aero-engine rotating cone. Phys. Fluids 2025, 37, 037169. [Google Scholar] [CrossRef]
  19. Qi, H.; Chang, S.; Yang, Y. Numerical study of mixed phase ice accumulation in aero-engine inlet system. Appl. Therm. Eng. 2023, 231, 120909. [Google Scholar] [CrossRef]
  20. Mahmoudi, F.Y.; Farhadi, M.; Darzi, A.R. Investigating effects of different anti-icing parameters on gas turbine air intake ice formation. J. Therm. Anal. Calorim. 2023, 148, 3793–3804. [Google Scholar] [CrossRef]
  21. Guo, Q.; Du, J.; Qian, F.; Ding, N. Numerical Study of Particle Implementation on Aeroengine under Mixed-Phase Conditions. Mechanics 2024, 30, 415–422. [Google Scholar] [CrossRef]
  22. Honsek, R.; Habashi, W.G.; Aube, M.S. Eulerian modeling of in-flight icing due to supercooled large droplets. J. Aircraft. 2008, 45, 1290–1296. [Google Scholar] [CrossRef]
  23. Zhang, C.; Liu, H. Effect of drop size on the impact thermodynamics for supercooled large droplet in aircraft icing. Phys. Fluids 2016, 28, 062107. [Google Scholar] [CrossRef]
  24. Zhu, D.; Pei, R.; Yang, Q.; Bu, X.; Zhu, Y.; Lin, G. Experimental researches on a hot air anti-icing system in FL-61 icing wind tunnel. Aerodyn. Res. Exp. 2020, 32, 144. [Google Scholar]
  25. Jia, W.; Zhang, F.; Zhang, Z. Numerical and experimental investigation of the supercooled large droplets icing of rotating spinner. Appl. Therm. Eng. 2024, 257, 124159. [Google Scholar] [CrossRef]
Figure 1. The structure of FL-61 wind tunnel.
Aerospace 12 00384 g001
Figure 2. Uniformity of liquid water content.
Aerospace 12 00384 g002
Figure 3. Physical intake cone model.
Aerospace 12 00384 g003
Figure 4. Experimental results of icing at different times: (a) t = 0 s; (b) t = 2 s; (c) t = 10 s; (d) t = 20 s; (e) t = 30 s; (f) t = 40 s; (g) t = 50 s; (h) t = 60 s.
Aerospace 12 00384 g004aAerospace 12 00384 g004b
Figure 5. Experimental results of icing at different rotational speeds under V = 78 m/s, Ts = −10 °C, MVD = 20 μm, LWC = 1.0 g/m3, t = 20 min: (a) Rev = 0 rpm; (b) Rev = 100 rpm; (c) Rev = 900 rpm; (d) Rev = 2000 rpm.
Aerospace 12 00384 g005aAerospace 12 00384 g005b
Figure 6. Comparison of icing at different rotational speeds under V = 78 m/s, Ts = −10 °C, MVD = 20 μm, LWC = 1.0 g/m3, t = 20 min.
Aerospace 12 00384 g006
Figure 7. Experimental results of icing at different rotational speeds under V = 78 m/s, Ts = −10 °C, MVD = 50 μm, LWC = 1.5 g/m3, t = 10 min: (a) Rev = 100 rpm; (b) Rev = 1500 rpm.
Aerospace 12 00384 g007
Figure 8. Comparison of icing at different rotational speeds under V = 78 m/s, Ts = −10 °C, MVD = 50 μm, LWC = 1.5 g/m3, t = 10 min.
Aerospace 12 00384 g008
Figure 9. Experimental results of icing at different rotational speeds under V = 78 m/s, Ts = −20 °C, MVD = 106 μm, LWC = 1.0 g/m3, t = 20 min: (a) Rev = 0 rpm; (b) Rev = 100 rpm; (c) Rev = 900 rpm; (d) Rev = 2000 rpm; (e) Rev = 3000 rpm.
Aerospace 12 00384 g009aAerospace 12 00384 g009b
Figure 10. Comparison of icing at different rotational speeds under V = 78 m/s, Ts = −20 °C, MVD = 106 μm, LWC = 1.0 g/m3, t = 20 min.
Aerospace 12 00384 g010
Figure 11. Experimental results of icing at different temperatures under V = 78 m/s, Rev = 0 rpm, MVD = 106 μm, LWC = 1.0 g/m3, t = 20 min: (a) Ts = −10 °C; (b) Ts = −20 °C.
Aerospace 12 00384 g011
Figure 12. Experimental results of icing at different temperatures under V = 78 m/s, Rev = 0 rpm, MVD = 106 μm, LWC = 1.0 g/m3, t = 20 min.
Aerospace 12 00384 g012
Figure 13. Experimental results of icing at different temperatures under V = 78 m/s, Rev = 900 rpm, MVD = 20 μm, LWC = 1.0 g/m3, t = 20 min: (a) Ts = −10 °C; (b) Ts = −15 °C; (c) Ts = −20 °C.
Aerospace 12 00384 g013
Figure 14. Experimental results of icing at different temperatures under V = 78 m/s, Rev = 900 rpm, MVD = 20 μm, LWC = 1.0 g/m3, t = 20 min.
Aerospace 12 00384 g014
Figure 15. Experimental results of icing at different wind speeds under Ts = −20 °C, Rev = 1500 rpm, MVD = 106 μm, LWC = 1.0 g/m3, t = 10 min: (a) V = 65 m/s; (b) V = 78 m/s.
Aerospace 12 00384 g015aAerospace 12 00384 g015b
Figure 16. Experimental results of icing at different wind speeds under Ts = −20 °C, Rev = 1500 rpm, MVD = 106 μm, LWC = 1.0 g/m3, t = 10 min.
Aerospace 12 00384 g016
Figure 17. Experimental results of icing at different MVDs under V = 78 m/s, Ts = −20 °C, Rev = 900 rpm, LWC = 1.0 g/m3, t = 20 min: (a) MVD = 20 μm; (b) MVD = 106 μm.
Aerospace 12 00384 g017
Figure 18. Experimental results of icing at different MVDs under V = 78 m/s, Ts = −20 °C, Rev = 900 rpm, LWC = 1.0 g/m3, t = 20 min.
Aerospace 12 00384 g018
Figure 19. Experimental results of icing at different MVDs under V = 78 m/s, Ts = −20 °C, Rev = 2500 rpm, LWC = 1.0 g/m3, t = 6 min: (a) MVD = 70 μm; (b) MVD = 236 μm.
Aerospace 12 00384 g019
Figure 20. Experimental results of icing at different MVDs under V = 78 m/s, Ts = −20 °C, Rev = 2500 rpm, LWC = 1.0 g/m3, t = 6 min.
Aerospace 12 00384 g020
Figure 21. Experimental results of icing at different MVDs under V = 78 m/s, Ts = −10 °C, Rev = 0 rpm, LWC = 1.0 g/m3, t = 20 min: (a) MVD = 20 μm; (b) MVD = 106 μm.
Aerospace 12 00384 g021
Figure 22. Experimental results of icing at different MVDs under V = 78 m/s, Ts = −10 °C, Rev = 0 rpm, LWC = 1.0 g/m3, t = 20 min.
Aerospace 12 00384 g022
Figure 23. Experimental results of icing at different icing times under V = 78 m/s, Ts = −20 °C, Rev = 900 rpm, MVD = 20 μm, LWC = 10 g/m3: (a) t = 10 min; (b) t = 20 min.
Aerospace 12 00384 g023
Figure 24. Experimental results of icing at different icing times under V = 78 m/s, Ts = −20 °C, Rev = 900 rpm, MVD = 20 μm, LWC = 1.0 g/m3.
Aerospace 12 00384 g024
Figure 25. Experimental results of icing at different icing times under V = 78 m/s, Ts = −20 °C, Rev = 900 rpm, MVD = 106 μm, LWC = 1.0 g/m3: (a) t = 10 min; (b) t = 20 min.
Aerospace 12 00384 g025
Figure 26. Experimental results of icing at different icing times under V = 78 m/s, Ts = −20 °C, Rev = 900 rpm, MVD = 106 μm, LWC = 1.0 g/m3.
Aerospace 12 00384 g026
Figure 27. Experimental results of icing at different icing times under V = 78 m/s, Ts = −20 °C, Rev = 3000 rpm, MVD = 106 μm, LWC = 1.0 g/m3: (a) t = 10 min; (b) t = 20 min.
Aerospace 12 00384 g027
Figure 28. Experimental results of icing at different icing times under V = 78 m/s, Ts = −20 °C, Rev = 3000 rpm, MVD = 106 μm, LWC = 1.0 g/m3.
Aerospace 12 00384 g028
Table 1. Flow field and icing indicators of FL-61 wind tunnel.
ItemDesign Indicator
Mach number control accuracy<0.001
Mach number distribution accuracy <0.002
Average airflow deviation angle ≤0.1°
Total temperature control accuracy ±1 K
Total pressure control accuracy ≤0.2%
Turbulence degree ≤0.2%
LWC0.3~3 g/m3
MVD15~500 μm
Uniformity of LWC ±20%
Continuous icing time60 min
Table 2. Experimental conditions.
ConditionWind Speed (V)
m/s
Static Temperature (Ts)
°C
MVD
μm
LWC
g/m3
Rotational Speed (Rev)
rpm
Icing Time (t)
min
178−10201.0020
278−10201.010020
378−10201.090020
478−10201.0200020
578−10501.510010
678−10501.5150010
778−201061.0020
878−201061.010020
978−201061.090020
1078−201061.0200020
1178−201061.0300020
1278−101061.0020
1378−15201.090020
1478−20201.090020
1578−201061.0150010
1665−201061.0150010
1778−20701.025006
1878−202361.025006
1978−20201.090010
2078−201061.090010
2178−201061.0300010
Disclaimer/Publisher’s Note: The statements, opinions and data contained in all publications are solely those of the individual author(s) and contributor(s) and not of MDPI and/or the editor(s). MDPI and/or the editor(s) disclaim responsibility for any injury to people or property resulting from any ideas, methods, instructions or products referred to in the content.

