Article

Investigation of Skin–Stringer Assembly Made with Adhesive and Mechanical Methods on Aircraft

by
Hacı Abdullah Tasdemir
1,
Berke Alp Mirza
2 and
Yunus Hüseyin Erkendirci
1,*
1
The Faculty of Mechanical Engineering, Mechanical Engineering Department, Istanbul Technical University, Istanbul 34437, Turkey
2
Turkish Aerospace Industries Inc., Ankara 06980, Turkey
*
Author to whom correspondence should be addressed.
Aerospace 2025, 12(5), 383; https://doi.org/10.3390/aerospace12050383
Submission received: 25 February 2025 / Revised: 6 April 2025 / Accepted: 18 April 2025 / Published: 29 April 2025
(This article belongs to the Special Issue Advanced Aircraft Structural Design and Applications)

Abstract

:
New assembly methods for aircraft structural parts, such as skins and stringers, are being investigated to address issues like galvanic corrosion, stress concentration, and weight. For this, many researchers are examining the mechanical and fracture properties of adhesively bonded parts through experimental testing and numerical modelling methods, including Cohesive Zone Modelling (CZM), Compliance-Based Beam Method (CBBM), Double Cantilever Beam (DCB), and End Notched Flexural (ENF) tests. In this study, similarly, DCB and ENF tests were conducted on skin and beam parts bonded with AF163-2K adhesive using CBBM and then modelled and analysed in ABAQUS CAE 2018 software. Four different skin–stringer connection models were analysed, respectively, using only adhesive, only rivets, both adhesive and rivets, and also a reduced number of rivets in the adhesively bonded joint. This study found that adhesive increased initial strength, while rivets improved strength after the adhesive began to crack. Using a hybrid connection that combines both rivets and adhesive has been observed to enhance the overall strength and durability of the assembly. Then, experimental results were compared, and four numerical models for skin–stringer connections (adhesive only, rivets only, adhesive and rivets, and adhesive with reduced rivets) were analysed and discussed. In this context, the results were supported and reported with graphs, tables, and analysis images.

1. Introduction

In recent years, the study of monolithic and composite materials, particularly their assembly, has gained increasing importance due to concerns about strength and rigidity. Adhesives have become more widely used as an alternative to metal and composite connections, which can disrupt structural rigidity and lead to stress concentration; consequently, research in this field has intensified [1,2,3,4]. Although mechanical connections like rivets are commonly used for skin–stringer connections, adhesive bonding is also an alternative method. This process involves bonding materials under pressure using an adhesive, which helps to resist separation. Due to its many advantages, adhesive bonding is used extensively in aerospace technology.
Additionally, adhesive bonding is beneficial for joining fragile materials that cannot be joined by methods like riveting, such as thin metal plates and ceramics [5,6,7,8,9,10,11,12,13].
When analysing damage at the connection points of composite materials, three different failure modes can be observed in adhesive joints: adhesive failure, cohesive failure of the adhesive, and cohesive failure of the adherend. Three methods are used to calculate the failure behaviour of adhesives: continuum mechanics, fracture mechanics, and damage mechanics. Numerical modelling calculations are based on the damage mechanics approach, which combines continuum and fracture mechanics [14,15,16,17,18]. Continuum mechanics estimate the maximum values of stress and strain using finite element analysis methods and compare them with test data, assuming a perfect bonding between the adhesive and the adhered material. Fracture mechanics are valid only if there is elastic deformation [19,20]. The method that combines these models is called Cohesive Zone Modelling (CZM). Fracture mode is divided into three types: Mode 1 (opening mode), where the crack surface moves perpendicular to crack propagation; Mode 2 (sliding); and Mode 3 (tearing). In most materials, the properties of Mode 2 and Mode 3, where crack surfaces move parallel to the crack direction, are equal. CZM relies on interface elements, junction planes, or three-dimensional solid elements that represent the connection between two solids, ignoring their thicknesses [21,22,23,24,25].
There are numerous studies in the literature on analytical calculations in this field. Volkersen (1938) developed a model considering that adhesively bonded materials also undergo elastic deformation when subjected to shear loads. In this model, the shear stress is highest at the ends of the bonded material and lowest in the middle. Bending moments occur due to applied forces in single-acting connections, making Volkersen’s model more suitable for double-acting connections [25,26,27,28]. Goland and Reissner (1944) were the first to account for the bending moments and resulting transverse forces in single-acting connections, as the forces are not linear. This bending moment distorts the materials, turning the problem into a non-linear one [29,30]. Hart-Smith developed models considering the plastic deformation of the adhesive in single-acting joints. He suggested that the tensile energy and strength of both the adhesive and the joint being stretched are the same. He assumed the maximum shear stress of the adhesive as the breaking stress of the joint, and this model provided more accurate results compared to previous models [31].
Rodriguez and Paivan’s experimental and numerical study on the Single Lap Joint (SLJ) test, Hart-Smith theory, Goland and Reissner theory, Volkersen theory, and calculation methods, in addition to numerical study results and experimental study results, were compared. In this study, ABAQUS CAE 2018 software was used to calculate numerical data. When the results of the data were compared, it was observed that the numerical results obtained with the ABAQUS software reached the closest result to the experimental data with a margin of error of 0.4% [32].
Cohesive zone modelling, based on Dugdale (1960) and Barenblatt (1962) models, explains stress limitation by yield stress and the plastic region in front of the crack tip. Barenblatt introduced cohesive forces at the molecular level to address equilibrium in elastic cracks, which Hillerborg later expanded with the concept of pulling forces to explain new crack formation. This modelling approach is advantageous over fracture mechanics as it predicts both crack initiation and propagation [33,34,35,36]. The cohesive region represents the crack formed when bonded materials separate under stress. Atomic bonds in this region prevent crack propagation through cohesive pulling forces. As adhesive surfaces separate, tensile forces increase until reaching a critical separation, after which they decrease to zero. The stress change on these surfaces follows the traction–separation law. Traction–separation graphs provide insights into the fracture behaviour in the cohesive region [37,38]. Different types of stress–strain graphs can be used, depending on the material and properties of the joint interface. The most common of these graphs are bilinear, polynomial, exponential, and trapezoidal. Studies on the effects of these graphs on analysis results concluded that the shape of the graphs did not significantly affect the analysis outcomes [39].
In this study, the general literature reveals insufficient studies on various assembly models to address this gap; experimental works, analyses, and numerical simulations were conducted on four different models. Test specimens for experimental works were produced using knit-supported structural film adhesive (AF163-2K), main material (7050-T7451 aluminium) or adherent, and primer (EC-3924B). The cure cycle temperature was around 130 °C at 1 h, pressure was 2.6 bar, vacuum was 200–250 mmHg, heat-up rate was rate 1.0–5.0 (°C/min), and cool-down temperature was 1.0–5.0 (°C/min). Double Cantilever Beam (DCB) and End-Notched Flexure (ENF) tests were conducted on skin and beam parts bonded with AF163-2K adhesive using the Compliance-Based Beam Method (CBBM). These tests were then modelled and analysed in Abaqus software for numerical simulations to compare experimental and numerical results. Four different skin–stringer connection models were analysed (these are adhesive only, rivets only, both adhesive and rivets, and a reduced number of rivets in an adhesive-bonded connection). Experimental results were compared, and four numerical models for cladding-beam connections (adhesive only, rivets only, adhesive and rivets, and adhesive with reduced rivets) were analysed and discussed.

2. Materials and Methods

Cohesive zone modelling (CZM) has been widely used in recent years to simulate failure in adhesive joints. Accurate determination of the traction–separation law (TSL) (or CZM parameters) is crucial to the success of this approach. Recent experimental studies have shown that the loading rate affects the TSL/CZM parameters [40]. In this paper, we attempt to quantify an inverse approach involving a finite element (FE) analysis in which the adhesive layer is also modelled and cohesive elements are used to model the interface failure. The TSL is then obtained iteratively by matching the numerical load–displacement data with the experimental data. To solve Cohesive Zone Modelling (CZM) numerical modelling, material parameters determined by experimental methods are needed. These models simulate adhesive bonding in DCB tests, representing cohesive stress versus interface displacement evolution, known as traction–separation laws (TSL). Double Cantilever Beam (DCB) analysis is a common method to study mode-I fracture behaviour and measure fracture toughness. When comparing force–displacement (F-D) graphs generated by different solvers in DCB analysis, several factors come into play. Analytical solutions use mathematical models to predict DCB behaviour under various loads, with corrections for crack-tip rotation and structural vibration. Numerical Simulations use computational methods to simulate and output frequency influencing results.
Each method has its advantages and limitations, and the choice of solver affects the accuracy and reliability of F-D graphs. Comparing these graphs helps researchers understand fracture mechanics and improve composite structure design. Comparing different CZMs can help identify the most accurate model for predicting fracture behaviour. In this study, to obtain these parameters, two types of experiments, Double Cantilever Beam (DCB) tests and End Notched Flexure (ENF) tests, were carried out. These material parameters are modulus of elasticity (E), shear modulus (G), tensile strength (σ), shear strength (τ), normal mode fracture energy release rate (GI), and shear mode fracture energy release rate (GII and GIII). In this experiment, test specimens consisted of adhesive (AF163-2K), main material (7050-T7451 aluminium) or adherent, and primer (EC-3924B). The E, G, σ, and τ parameters were taken from the catalogue [41], GI was obtained from Double Cantilever Beam (DCB) tests, and GII and GIII were obtained from End Notched Flexure (ENF) tests.

2.1. Double Cantilever Beam (DCB) Test

The application of a DCB test (as shown in Figure 1a) was prepared according to the ASTM D3433-99 standard(ASTM Standard D3433-99,2020, Standard Test Method for Fracture Strength in Cleavage of Adhesives in Bonded Metal Joints. ASTM International, 100 Barr Harbor Drive, PO Box C700, West Conshohocken, 2020, www.astm.org). For the DCB tests, two pieces of 7050-T7451 aluminium of the same length (L), height (h), and width (b) are bonded by applying the adhesive material between them, where L = 290 mm, h = 12.7 mm, and b = 25 mm. Thickness (t = 0.471 mm) of adhesive layer and adhesive length (LA are 0.241 mm and 0.230 mm), respectively. An initial crack a0 = 10 mm is given to the test specimens. Additionally, DCB tests were conducted with the Lloyd Instruments LR5KPlus test machine at room temperature with a tensile loading speed of 1 mm/min. To initiate an initial crack (a0) before the DCB test, one of the plates was fixed while a force (P) was applied in the opposite direction to the other plate, causing initial crack propagation. Due to the effect of the applied opposite forces, the adhesive material between the two plates could not withstand the stresses, resulting in the separation of the parts at the end of the DCB test. Subsequently, the force–displacement (F-D) graph was plotted using the experimental data (see Figure 1b). The amount of fracture energy release rate (GI) (mode-1) was calculated using experimental data. In this research, the Compliance-Based Beam Method (CBBM) was used to calculate (GI) [42]. The CBBM method does not require the measurement of crack length during the test, making it a frequently used method for calculating fracture energy. This method involves many formulas, and the data for these formulas are obtained from the force–displacement plot of the DCB test. In this study, MATLAB R2022a was used to handle the calculations involving thousands of data points. MATLAB codes were written for the CBBM method, and the fracture energy release rates were calculated. (GI) was found to be 3.8 N/mm.

2.2. End-Notched Flexure (ENF) Test

The End-Notched Flexure (ENF) test was used to determine the fracture energy release rate (GII) (mode-2). ENF tests were conducted with the Instron 6800 Series machine at a speed of 1 mm/min as shown in Figure 2a. In these tests, specimens of the same size and material were used as in the Double Cantilever Beam (DCB) test under identical conditions. The adhesive was again not applied completely, and the initial crack propagation was provided simultaneously force–displacement (F-D) graph plotted using ENF test data, is shown in Figure 2b. The Compliance-Based Beam Method (CBBM) is used to calculate G I I and it was found as 9.8 N/mm. Also, it is observed from Figure 2c that the cohesive failure in the adhesive layer occurred in the DCB test. The cohesive failure in the adhesive layer is observed with the same ENF test specimens as shown in Figure 2d below.

2.3. Numerical Works, Mesh Structure, DCB, and ENF Test Analysis

In the modelling of both DCB and ENF tests, the mesh parameter of the material to be bonded is selected as a cohesive element. The adhesive joint is defined as a 2D surface contact in the analysis program. Adhesive surfaces can be defined in 2D (triangular, quadrilateral) or 3D (tetrahedron, hexahedron, pyramid) in analysis programs. The 3D model enables detailed stress analysis on the adhesive at a smaller scale while significantly increasing analysis time. In this context, contact surface modelling is performed as the adhesive properties can be given directly from the program as master-sleeve contact. The Abaqus program offers only bilinear and exponential options when solved in energy type within the scope of the traction–separation law. These analyses were solved with the bilinear smoothing option, considering that the solution of the bilinear traction–separation law graph gives good results and is solved faster [40]. DCB and ENF tests were modelled to be exactly the same as the measurements made in real tests. In the DCB and ENF test modelling with 1 mm/min displacement, Figure 3a shows the fixed support and displacement application point of the DCB model. Figure 3b shows the application of the surface contact adhesive and the mesh structure in a 1 mm size. Figure 3c shows the application of the displacement force at a distance of 10 mm from the fixed support points for the ENF test, and Figure 3d shows the application of the surface contact adhesive for the ENF test.
The choice of model and parameters, like stabilisation methods and output frequency, can significantly influence the results. Three different methods (finite element, static ~ dynamic implicit, and dynamic explicit methods) can be used for CZM studies. To observe the differences between the static solver, dynamic explicit solver, and dynamic implicit solver, the DCB test was modelled in ABAQUS software with the same dimensions as real tests and solved using all three solvers. Force–Displacement (F-D) curves from numerical analysis of Double Cantilever Beam (DCB) tests indicate that the dynamic explicit solver provides more accurate results, as illustrated in Figure 4a. This solver enhances accuracy in dynamic load scenarios by considering structural vibrations and wave propagation. Following this result, the dynamic explicit solver was chosen for the analysis. For the DCB test, FEA and experimental solutions were compared, and as shown in Figure 4b, the results are closely aligned. Explicit dynamics is a time integration method used to perform dynamic simulations when speed is important. The experimental and FEA results of End-Notched Flexure (ENF) are shown in Figure 4c.
The comparison highlights differences in the mechanical behaviour and fracture properties of the materials under different loading conditions. In the ENF (End-Notched Flexure) test, the forces experienced by the specimens are nearly at their maximum thresholds. The analysis data reveal that the connection loses its strength rapidly, similar to the observations from the DCB (Double Cantilever Beam) test. These analysis data are based on the assumption of perfect adhesion and ideal testing conditions. Consequently, there is a noticeable deviation between the actual experimental data and the theoretical analysis data in the ENF test. This discrepancy is not unique to this study; it has also been documented in other academic research [42].
Since this study will also analyse skin–stringer connections and examine the system as a whole rather than regionally, the 2D adhesive surface connection model, which yields faster results, was used. Furthermore, the mesh sizes of the model were selected as 0.471 mm; the material properties of Scotch-Weld™ Structural Adhesive Film AF163-2K, EC-3924B primer, including adhesive parameters, were considered. In Figure 5a and Figure 5b, respectively, the DCB and ENF stress distributions can be observed. GI and GII fracture energy release rate value from DCB and ENF tests, elasticity modulus, shear modulus, tensile and shear strength values, and technical data sheet values are provided in Table 1 as numerical analysis parameters.
The aim of the study is to compare methods rather than numerically determining absolute values. In this context, it was observed that the graphs of the analysis results obtained from numerical methods for the same materials were close to the results of ENF and DCB tests. Based on this observation, it was concluded that the results of numerical analyses would be sufficient for this study.

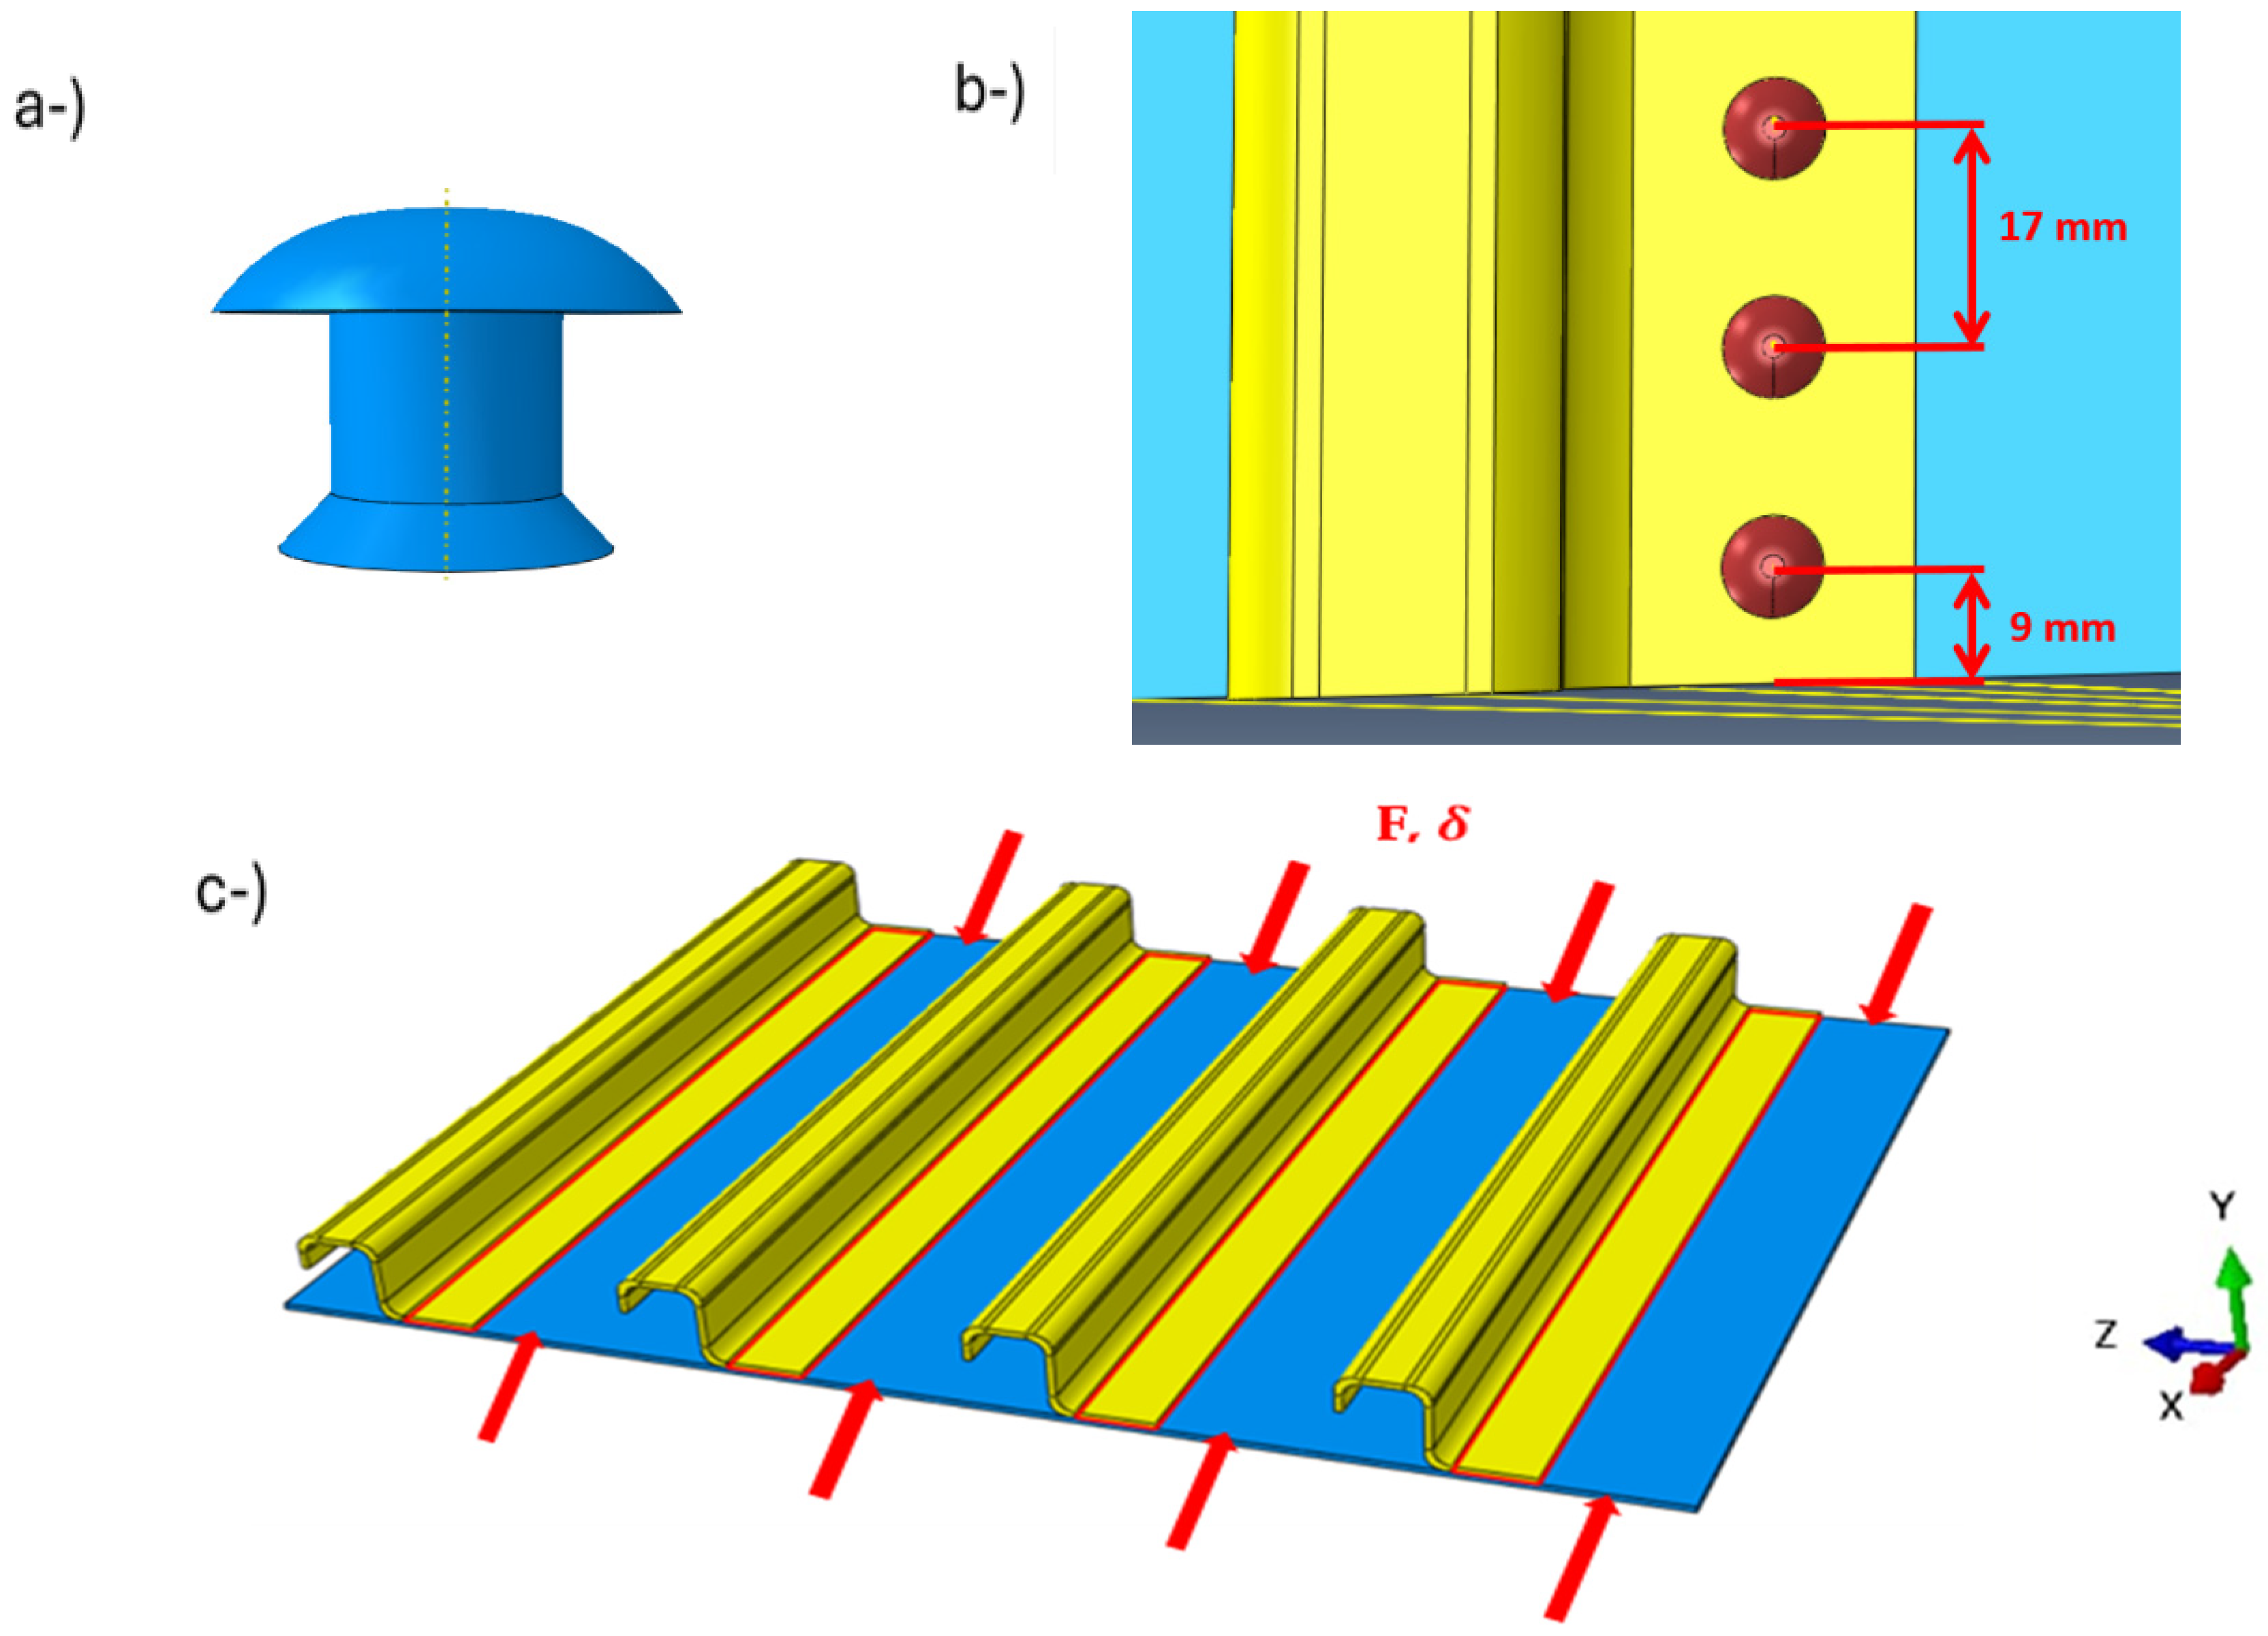
2.4. Skin–Stringer Analysis

The skin and stringer structures were made from 7050-T7451 aluminium alloy. This selected aluminium alloy is widely used in the aerospace field. In the modelling, the dimensions for the skin are L400 × W324 mm, the thickness is 2 mm, and the stringer dimensions are modelled as L = 324 mm with a thickness of 2 mm as in the skin. Given that one side of the skin structure is exposed to the atmosphere, countersunk rivets were chosen for aerodynamic reasons. In this study, one of the rivets commonly used in aeroplanes was used. NAS1097AD5 rivet with a diameter of 3.9624 mm (0.156 inch) was selected and modelled in an ABAQUS CAE 2018 environment as seen in Figure 6a. The distances of the rivets to the edge and to each other were kept at the minimum level according to the dimensions specified in the design recommendations in order to add the maximum number of rivets side by side, as shown in Figure 6b.
The analysis boundary conditions were given as support from the sides of the panel in directions other than the loading direction. The analysis conditions were entered into the program so that the panels could be moved equally from 2 points that are equidistant from each other. Analysis was performed in such a way that all skin–stringer assemblies would move 3 mm from both sides toward each other after 15 s, that is, they would be subjected to a compression force. This ensures that the panel can flex without lateral movement. In this study, the boundary conditions provided support from the sides of the panel in all directions except the loading direction, as illustrated in Figure 6c. The unit of all stress values in this study is MPa.
Four different skin–stringer connection models were analysed: the stringer attached to the skin using only adhesive, using only rivets, using both adhesive and rivets, and a hybrid model where the number of rivets is reduced in an adhesively bonded joint. The last two configurations are referred to as hybrid models.

3. Results

3.1. Skin–Stringer Model Joined with Only Adhesive Bonding

In aerospace engineering, a skin–stringer model refers to a structural configuration where stringers (longitudinal reinforcements) are bonded to the skin (outer surface) of an aircraft using adhesive bonding. This method is used to enhance the structural integrity and load-bearing capacity of the aircraft’s fuselage or wings. Adhesive bonding in this context involves using a high-strength adhesive to join the stringers to the skin, eliminating the need for mechanical fasteners like rivets, which can introduce stress concentrations and increase weight. This technique is advantageous because it can reduce the overall weight of the structure and improve its aerodynamic efficiency. However, the reliability of adhesive bonds can be a concern, as they may be susceptible to debonding under certain loading conditions. Therefore, extensive testing and analysis are often conducted to ensure the durability and performance of adhesively bonded skin–stringer assemblies. The skin–stringer structure was modelled in ABAQUS CAE 2018 software by adhesive bonding the components to each other without using rivets.
After the analysis, the force–displacement curve was obtained as shown in Figure 7a. As illustrated in Figure 7b, the skin condition just before the adhesive crack initiates, and the skin stringer withstands a maximum load of approximately 1 mm displacement. After exceeding the maximum load, the adhesive between the skin and stringer began to fail by cracking. The force–displacement graph shows an abrupt drop in the force required for displacement, indicating that the adhesive breaks easily. Initially, the adhesive exhibits very high strength, but after the first rupture, its strength significantly decreases. Consequently, the force required for displacement drops sharply, as there is no other joint to resist the movement. When the skin–stringer connection reaches its minimum strength, the adhesive has completely detached from the ends.

3.2. Skin–Stringer Model Joined with Only Rivets

In a multi-row riveted joint, the second row of rivets begins to carry the load as displacement progresses. This distribution of force helps in managing the overall stress on the joint, ensuring that the load is shared among multiple rivets, which can prevent premature failure. In this analysis, NAS1097AD5 rivets were used to join the skin and stringer. The distances of the rivets relative to the edge and to each other were minimised according to the dimensions specified in the design proposals to maximise the number of rivets placed side by side. Based on the given dimensions, the stringers were attached to the skin using 19 rivets each, a total of 76 rivets (19 rivets per stringer for 4 stringers), as shown in Figure 8a. Rivets were modelled as elastoplastic elements. Contact between rivet-skin-stringer was determined as frictionless and hard contact.
The force–displacement graph resulting from this test is shown in Figure 8b. After reaching the maximum loading (at point A) under a displacement load of approximately 0.62 mm), the rivets can still absorb additional force, and the reduction in their load-carrying capacity is more gradual. When the displacement load exceeds 0.75 mm (at point B), the second row of rivets begins to carry more of the load. Subsequently, displacement loading exceeds 1.5 mm (point C), the first row of rivets separates from the skin as a result of sheet yielding on the skin panel and becomes unable to carry the load. When the first row of rivets in a lap joint becomes disconnected, it can significantly impact the structural integrity of the joint. The load that was initially carried by the disconnected rivets must be redistributed to the remaining rivets. This can lead to increased stress and potential failure in the other rivets, especially those in the adjacent rows. The disconnected rivets can also cause a shift in the load transfer mechanism, leading to higher stress concentrations and potential crack initiation at the remaining rivet holes. Over time, this can result in fatigue failure of the joint, compromising the overall safety and performance of the structure. Ensuring proper maintenance and regular inspection of riveted joints is crucial to prevent such issues and maintain the structural integrity of the assembly.

3.3. Skin–Stringer Model Joined with Rivets and Adhesive

The rivets are modelled as 19 × 4 = 76 pieces, and the adhesives are modelled to contact the stringers throughout an applied adhesive 0.471 mm with rivets as shown in Figure 9a. The modelling concept remains the same as for the other types. In consequence of the analysis, the force–displacement graph is given in Figure 9b. As shown in the graph, when the skin–stringer model is subjected to loading, the maximum loading point matches that of the adhesively bonded concept. At the maximum loading condition (point A), the adhesive begins to fail. After the adhesive breaks, there is a sudden drop in the force graph until it reaches the point where the rivet starts to carry the load (point B). This same drop is observed in the skin–stringer model attached only with adhesive. Beyond this point, the behaviour resembles that of the rivet-only model, and the force–displacement graph follows a similar pattern. At the region marked by letter C, most of the first row of rivets separate from the skin. Due to the displacement loading until the end of the graph, roughly 3 mm, Figure 9c illustrates that the rivets in the first row have detached from the skin, and the adhesive has failed up to a certain distance.

3.4. Skin–Stringer Model Joined with Adhesive and Reduced Number of Rivets

The force–displacement (F-D) curve for a skin–stringer model joined with adhesive and a reduced number of rivets typically shows the relationship between the applied force and the resulting displacement of the structure. This curve is crucial for understanding the mechanical behaviour of the assembly, including stiffness, strength, and failure modes. In such models, the adhesive helps distribute the load more evenly across the skin and stringer, potentially reducing stress concentrations around the rivets. This can lead to improved performance in terms of load-bearing capacity and fatigue resistance. The F-D curve can reveal key points such as the initial linear elastic region, the onset of plastic deformation, and the ultimate failure point. Studies have shown that using adhesives in combination with rivets can enhance the overall structural integrity and performance of skin–stringer assemblies. This hybrid approach can be particularly beneficial in aerospace applications where weight reduction and structural efficiency are critical. In this case, 3 × 4 = 12 rivets were used (around 16% of the 76-rivet model), and a 0.471 mm thick adhesive layer was added as shown in Figure 10a. The force–displacement graph for this model (Figure 10b) is very similar to the other model using adhesive and rivets, despite using significantly fewer rivets. The notable point in this graph is that once the rivets detach from the skin, the force closely matches the strength of the model that is solely adhesively bonded. After a 3 mm displacement, the stress distribution on the model is shown in Figure 10c.

4. Conclusions

In this study, DCB and ENF tests were carried out on skin and beam parts and modelled numerically for four different skin–stringer connection models and then analysed. All numerical models were analysed in ABAQUS CAE 2018 software, with adhesive only, rivets only, adhesive and rivets, and adhesive with reduced rivets. Experimental results were compared with each other, and four numerical models for skin–stringer connections were analysed.
The conclusions obtained from this study are as follows,
  • In the four different skin stringer models we have applied,
    (a)
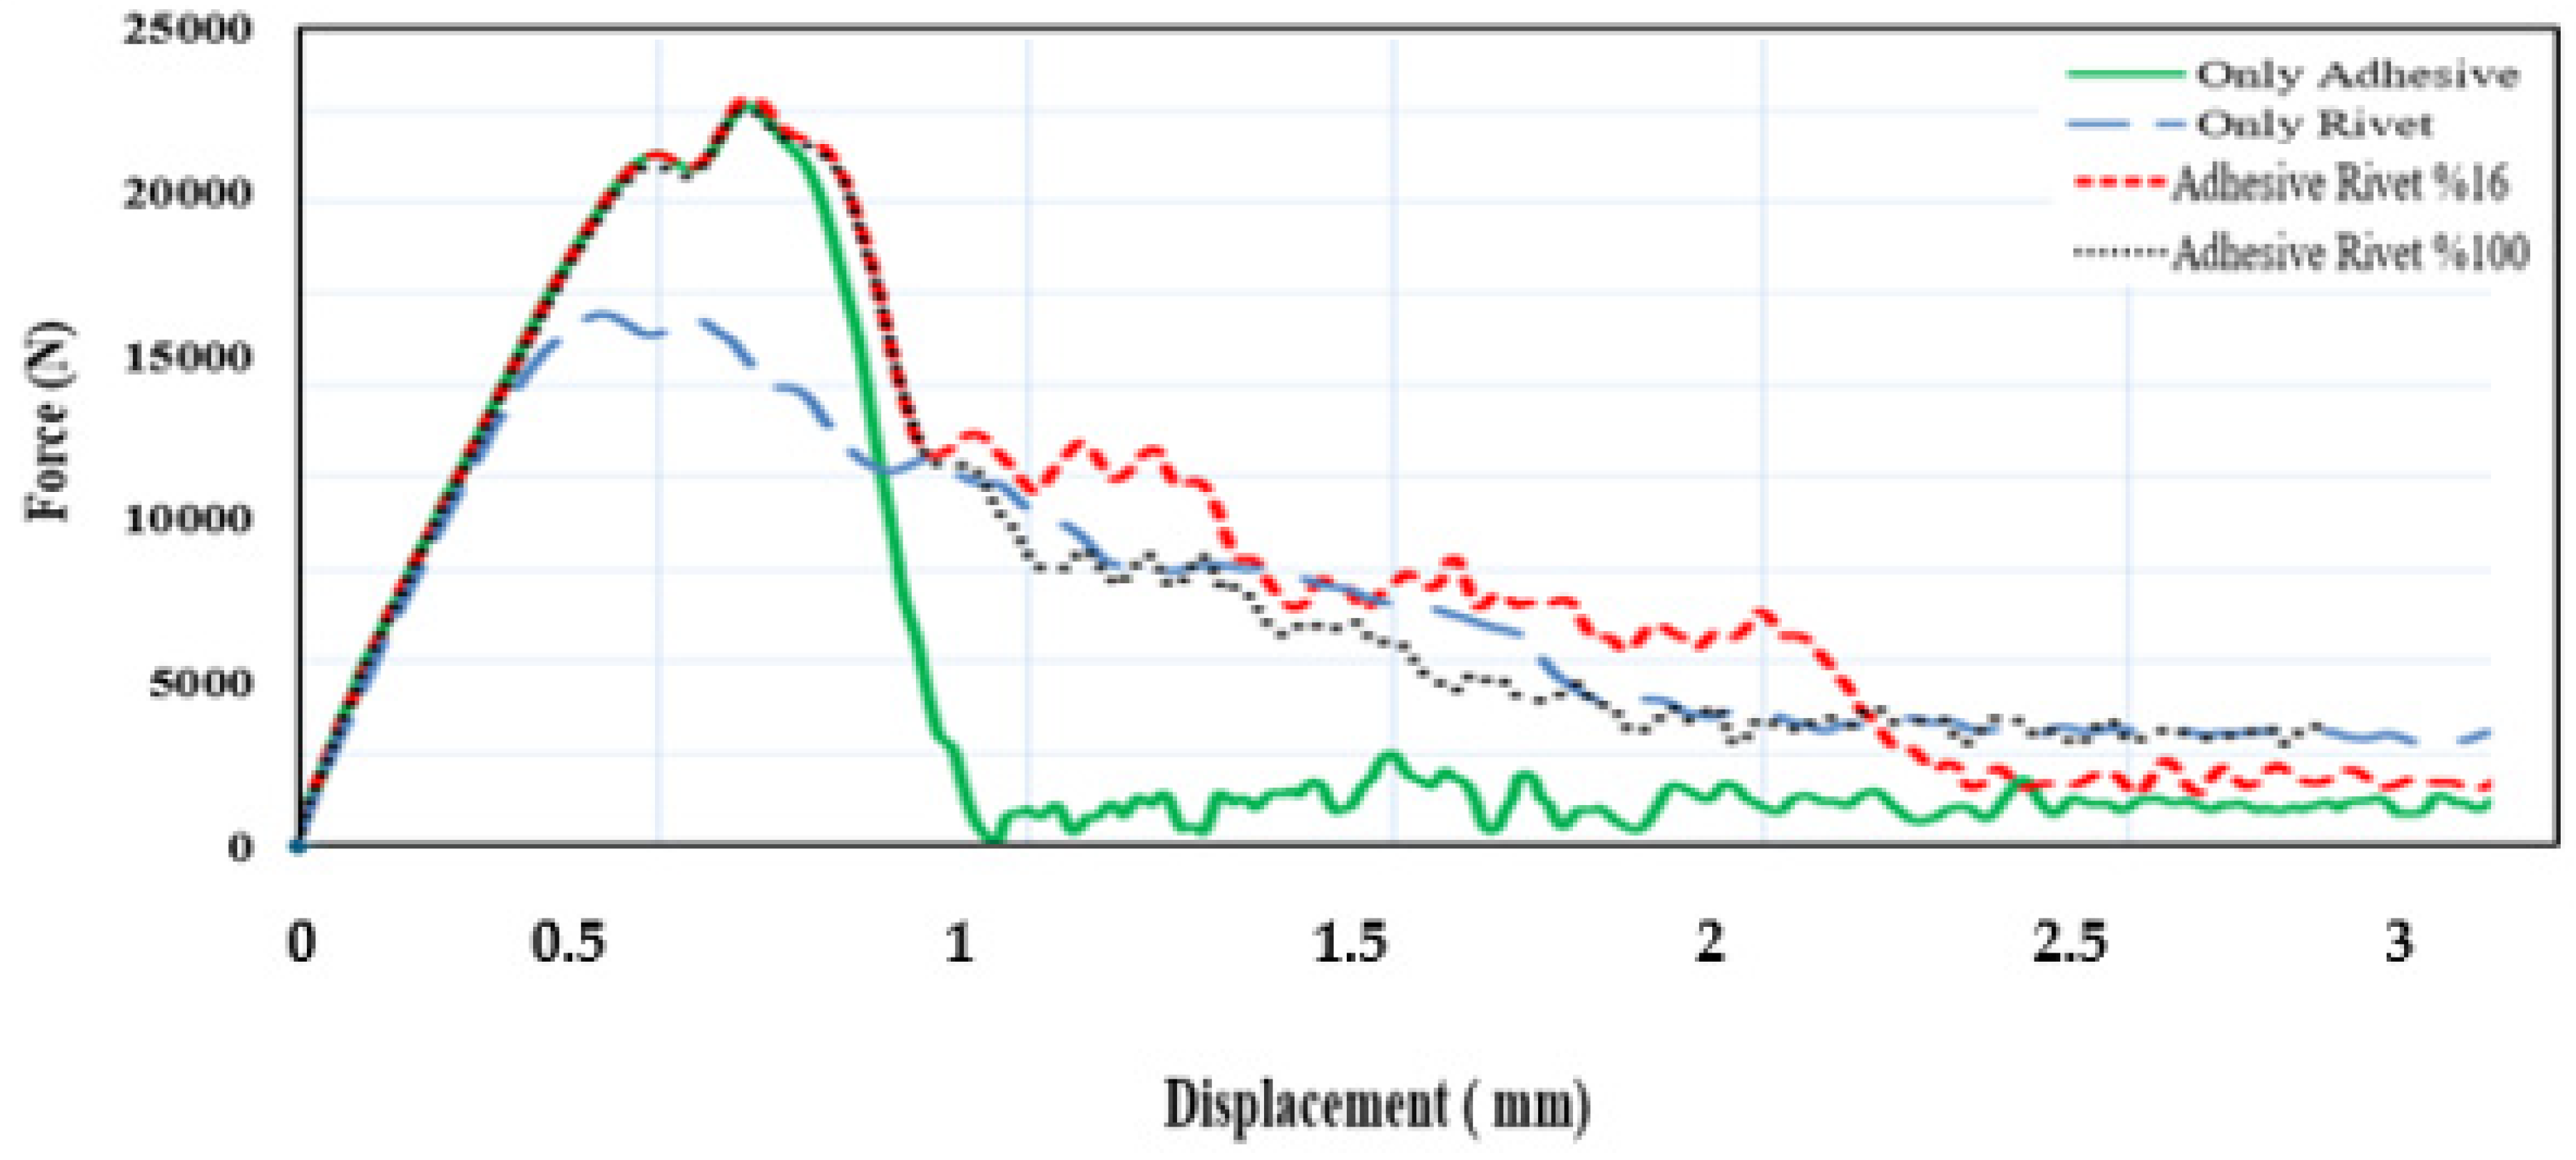
    one with only adhesive has the maximum strength of 200 KN. When the adhesive first starts to break, after the first crack initiation, the strength drops abruptly. This behaviour obeys the law of tensile separation. In this part, where only the adhesive is present, the force required for deformation was measured at 10 kN since there will be energy release after the moment of force rupture and the strength of the adhesive after the first crack is very low. This is fixed at 5% of the maximum strength.
    (b)
    a riveted connection only, the strength decreases more gradually with this connection method. The approximately maximum load resistance in the riveted connection is 144 kN. Here, the behaviour of the rivets after they start to separate from the skin is very different from the behaviour of the adhesive model after the first crack. The rivets allowed the load to fall in a more controlled manner and fixed it at about 20% of 29 kN. Adhesive increased the initial strength, while rivets improved the strength after the adhesive began to crack.
    (c)
    in the hybrid connections designed according to the advantages and disadvantages of connections requiring only rivets or adhesive, firstly in Section 3.3, in the modelling in which 76 rivets and AF163-2K adhesive were applied at 0.471 mm, the model withstood the strength of the adhesive until the adhesive formed its first crack. After the first crack, the strength of the adhesive suddenly decreased. At the point where it coincided with the graph of the riveted connection, the rivet started to carry the load, and its strength decreased more slowly than the connection with only adhesive and followed the graph of the riveted connection. The hybrid connection showed its advantage here, but both the use of 76 rivets and the use of adhesive did not contribute to the design in terms of weight. To overcome this problem, the number of rivets should be reduced. Using a hybrid connection that combines both rivets and adhesive has been observed to enhance the overall strength and durability of the assembly.
    (d)
    other hybrid connections, the weight is reduced by using 12 rivets and the same adhesive conditions. As a result of the analysis of the model, the maximum strength of the model glued with 12 rivets was very close to the maximum strength of the model glued with 76 rivets. However, at the point where the force reaches equilibrium, since the number of rivets is significantly reduced, the force value is closer to that of the model glued with adhesive only. The stress distributions are equal at 7.9 s for the skin–stringer connection with few rivets and glue and that with many rivets and glue. As seen in the model with few rivets, the stresses are more distributed. The reason for this is that the skin is more flexible due to the low number of rivets, and the amount of force required for displacement is high for a short time in the model with few rivets. As the displacement progresses and the flexibility of the panel decreases, the force required decreases compared to the model with more rivets.
  • The force–displacement curves for the four different models are shown in Figure 11. Comparing the models reveals that those with adhesive have higher strength, but the strength of the adhesive-only model drops sharply after reaching the maximum force. Adding rivets prevents this sudden drop, as the rivets carry the load at that point. It is observed that the number of rivets to be used with adhesive can be significantly reduced and their strength can be increased, as well as the weight caused by the rivets on the aircraft can be reduced. At the same time, the stress concentration around the holes drilled for the rivets will affect the system much less due to the small number of rivets in the hybrid connection and will contribute positively to the fatigue strength. Filling the skin and stringer with adhesive will also protect the materials from the risk of corrosion. In aircraft design, sealant is applied between materials to reduce the risk of corrosion in metal-to-metal contact. Since the adhesive itself performs this task, there will be no need to use sealant, and the weight effect of the sealant will be eliminated.
  • Using DCB and ENF tests, the force–displacement data obtained from these tests, the first and second mode fracture energies of the adhesive bonding were calculated by the CBBM method. Since it is impractical to manually calculate the CBBM method formulas using thousands of data points from force–displacement graphs, a MATLAB code was written to find the fracture energies. Using the obtained fracture energies, numerical results of DCB and ENF tests were obtained using static, dynamic implicit, and dynamic explicit methods in ABAQUS CAE 2018 software. By comparing these numerical results with experimental results, it was determined that the dynamic explicit method is more appropriate. The analysis and experimental data showed close values.
  • In substance, adhesive bonding increases the maximum strength of the skin–stringer. When the force suddenly drops, rivets help to carry the load at the moment of coincidence between the graphs of the models that are only adhesive and only riveted. After these results, it was observed that the hybrid model with a reduced rivet quantity gives good results and combines the advantages of mechanical joints and adhesive bonding.

Author Contributions

Conceptualisation, H.A.T. and B.A.M.; methodology, H.A.T. and B.A.M.; software, B.A.M.; validation, B.A.M.; investigation, B.A.M.; writing—original draft, B.A.M. and Y.H.E.; writing—review and editing, H.A.T., B.A.M. and Y.H.E.; supervision, H.A.T. All authors have read and agreed to the published version of the manuscript.

Funding

This research received no external funding.

Data Availability Statement

The original contributions presented in this study are included in the article. Further inquiries can be directed to the corresponding author(s).

Conflicts of Interest

The authors signed a signed statement that this was not a problem between them and the company. Author Berke Alp Mirza was employed by the company Turkish Aerospace Industries. The remaining authors declare that the research was conducted in the absence of any commercial or financial relationships that could be construed as a potential conflict of interest. All authors have read and agreed to the published version of the manuscript. All authors have read and agreed to the published version of the manuscript.

References

  1. Pethrick, R.A. Composite to metal bonding in aerospace and other applications. In Welding and Joining of Aerospace Materials; Woodhead Publishing: Shaston, UK, 2012. [Google Scholar]
  2. Nuhoğlu, K.; Aktaş, E.; Tanoğlu, M.; Martin, S.; İplikçi, H.; Barışık, M.; Yeke, M.; Türkdoğan, C.; Esenoğlu, G.; Dehneliler, S.; et al. Analysis of adhesively bonded joints of laser surface treated composite primary components of aircraft structures. Int. J. Adhes. Adhes. 2023, 126, 103456. [Google Scholar] [CrossRef]
  3. Encinas, N.; Oakley, B.R.; Belcher, M.A.; Blohowiak, K.Y.; Dillingham, R.G.; Abenojar, J.; Martínez, M.A. Surface modification of aircraft used composites for adhesive bonding. Int. J. Adhes. Adhes. 2014, 50, 157–163. [Google Scholar] [CrossRef]
  4. Chun Fang, X.; Lin Fa, S. Study on Adhesion of Carbon Fiber Resin Matrix Composite Skin Coating for Aircraft. J. Inst. Eng. Ser. D 2024, 105, 249–254. [Google Scholar] [CrossRef]
  5. Romano, M.G.; Guida, M.; Marulo, F.; Auricchio, M.G.; Russo, S. Characterization of adhesives bonding in aircraft structures. Materials 2020, 13, 4816. [Google Scholar] [CrossRef] [PubMed]
  6. Pogosyan, M.; Nazarov, E.; Bolshikh, A.; Koroliskii, V.; Turbin, N.; Shramko, K. Aircraft composite structures integrated approach: A review. J. Phys. Conf. Ser. 2021, 1925, 012005. [Google Scholar] [CrossRef]
  7. Bhagatji, J.D.; Morris, C.; Sridhar, Y.; Bhattacharjee, B.; Kaipa, K.N.; Kravchenko, O.G. Effect of Post-Cured through Thickness Reinforcement on Disbonding Behavior in Skin–Stringer Configuration. Materials 2024, 17, 3389. [Google Scholar] [CrossRef]
  8. An, Q.; Wang, C.; Ma, T.; Zou, F.; Fan, Z.; Zhou, E.; Ge, E.; Chen, M. Aeronautical composite/metal bolted joint and its mechanical properties: A review. J. Intell. Manuf. Spéc. Equip. 2024, 5, 70–91. [Google Scholar] [CrossRef]
  9. Popov, V.M. High-strength adhesive joints in aircraft parts. Russ. Aeronaut. 2013, 56, 423–430. [Google Scholar] [CrossRef]
  10. Pantelakis, S.; Tserpes, K.I. Adhesive bonding of composite aircraft structures: Challenges and recent developments. Sci. China Phys. Mech. 2014, 57, 2–11. [Google Scholar] [CrossRef]
  11. Maggiore, S.; Banea, M.D.; Stagnaro, P.; Luciano, G. A review of structural adhesive joints in hybrid joining processes. Polymers 2021, 13, 3961. [Google Scholar] [CrossRef]
  12. Pantelakis, S.; Tserpes, K. (Eds.) Revolutionizing Aircraft Materials and Processes; Springer International Publishing: Cham, Switzerland, 2020. [Google Scholar] [CrossRef]
  13. Bielawski, R.; Rządkowski, W.; Kowalik, M.P.; Kłonica, M. Safety of aircraft structures in the context of composite element connection. Int. Rev. Aerosp. Eng. 2020, 13, 159. [Google Scholar] [CrossRef]
  14. Yu, Y.; Hou, C.; Zheng, X.; Zhao, M. Meiying Zhao Phase field modeling for composite material failure. Fatigue Fract. Eng. Mater. Struct. 2024, 47, 4176–4195. [Google Scholar] [CrossRef]
  15. Ebnesajjad, C.F. Surface Treatment of Materials for Adhesion Bonding; William Andrew, Inc.: Norwich, UK, 2006; pp. 89–90. ISBN 978-0-8155-1523-4. [Google Scholar]
  16. Davis, M.; Bond, D. Principles and practices of adhesive bonded structural joints and repairs. Int. J. Adhes. Adhes. 1999, 19, 91–105. [Google Scholar] [CrossRef]
  17. Zimmermann, N.; Wang, P.H. A review of failure modes and fracture analysis of aircraft composite materials. Eng. Fail. Anal. 2020, 115, 104692. [Google Scholar] [CrossRef]
  18. Davis, M.J.; Bond, D.A. The Importance of Failure Mode Identification in Adhesive Bonded Aircraft Structures and Repairs. In Proceedings of the 12th International Conference on Composite Materials, Paris, France, 5–9 July 1999. [Google Scholar]
  19. Rośkowicz, M.; Godzimirski, J.; Komorek, A.; Jasztal, M. The effect of adhesive layer thickness on joint static strength. Materials 2021, 14, 1499. [Google Scholar] [CrossRef]
  20. Swamy, K.M.M.; Manjunath, H.; Shanmugavadivu, N.; Shanmugasundaram, M. An Overview of Adhesive Bonded Composite Joint Failure. In Failure of Fibre-Reinforced Polymer Composites; CRC Press: Boca Raton, FL, USA, 2021; pp. 91–103. [Google Scholar] [CrossRef]
  21. Freed, Y.; Salviato, M.; Zobeiry, N. Implementation of a probabilistic machine learning strategy for failure predictions of adhesively bonded joints using cohesive zone modeling. Int. J. Adhes. Adhes. 2022, 118, 103226. [Google Scholar] [CrossRef]
  22. Brito, R.F.N.; Campilho, R.D.S.G.; Moreira, R.D.F.; Sánchez-Arce, I.J.; Silva, F.J.G. Composite stepped-lap adhesive joint analysis by cohesive zone modelling. Procedia Struct. Integr. 2021, 33, 665–672. [Google Scholar] [CrossRef]
  23. Ma, F.; Zhu, Z.; Wang, D.; Jin, X. Numerical Analysis of the Wing Leading Edge Electro-Impulse De-Icing Process Based on Cohesive Zone Model. Appl. Sci. 2024, 14, 2777. [Google Scholar] [CrossRef]
  24. Bayramoglu, S.; Akpinar, S.; Çalık, A. Numerical analysis of elasto-plastic adhesively single step lap joints with cohesive zone models and its experimental verification. J. Mech. Sci. Technol. 2021, 35, 641–649. [Google Scholar] [CrossRef]
  25. Linke, M.; Lammering, R. On the calibration of the cohesive strength for cohesive zone models in finite element analyses. Theor. Appl. Fract. Mech. 2022, 124, 103733. [Google Scholar] [CrossRef]
  26. Silva, L. Modeling of Adhesively Bonded Joints; Springer: Berlin/Heidelberg, Germany, 2008; pp. 55–60. ISBN 978-3-540-79055-6. [Google Scholar] [CrossRef]
  27. Ohno, N.; Matsuda, T.; Wu, X. A homogenization theory for elastic–viscoplastic composites with point symmetry of internal distributions. Int. J. Solids Struct. 2001, 38, 2867–2878. [Google Scholar] [CrossRef]
  28. Adams, R.D. Prediction of the strength of adhesive lap joints. An investigative review. Int. J. Adhes. Adhes. 2024, 129, 103576. [Google Scholar] [CrossRef]
  29. Goland, M.; Reissner, E. The stresses in cemented joints. J. Appl. Mech. 1944, 11, 11–27. [Google Scholar] [CrossRef]
  30. Cioboată, D.D. (Ed.) International Conference on Reliable Systems Engineering (ICoRSE)—2023; Springer Nature: Cham, Switzerland, 2023; Volume 762, pp. 458–465. [Google Scholar] [CrossRef]
  31. da Silva, L.F.; das Neves, P.J.; Adams, R.; Spelt, J.K. Analytical models of adhesively bonded joints—Part I: Literature survey. Int. J. Adhes. Adhes. 2009, 29, 319–330. [Google Scholar] [CrossRef]
  32. Rene, Q.; Paulo, S.; William, P.; Marcelo, B. Failure criteria for adhesively bonded joints. Int. J. Adhes. Adhes. 2012, 37, 26–36. [Google Scholar] [CrossRef]
  33. Brick Chaouche, A. Cohesive Models for Anti-Plane Mode Fracture in Dissimilar Structures: Effect of Small/Large Scale Yielding Conditions on Computed Fracture Load. Iran. J. Sci. Technol. Trans. Mech. Eng. 2024, 48, 1551–1563. [Google Scholar] [CrossRef]
  34. Slamani, I.; Ferdjani, H. Solution of a Dugdale–Barenblatt crack in an infinite strip by a hyper-singular integral equation. Theor. Appl. Fract. Mech. 2024, 133, 104625. [Google Scholar] [CrossRef]
  35. Dundeti, C.; Punnam, P. A Finite Element Analysis of Crack Propagation in Interface of Aluminum Foil—LDPE Laminate During Fixed Arm Peel Test; Department of Mechanical Engineering Blekinge Institute of Technology: Karlskrona, Sweden, 2017; pp. 51–52, Id diva2:1088888. [Google Scholar]
  36. Birnie, J.; Falaschetti, M.P.; Troiani, E. Comparative Analysis on Modelling Approaches for the Simulation of Fatigue Disbonding with Cohesive Zone Models. Aerospace 2025, 12, 139. [Google Scholar] [CrossRef]
  37. Jiang, H. Cohesive Zone Model for Carbon Nanotube Adhesive Simulation and Fracture/Fatigue Crack Growth; The Graduate Faculty of The University of Akron: Akron, OH, USA, 2010; pp. 9–10. Available online: http://rave.ohiolink.edu/etdc/view?acc_num=akron1272647385 (accessed on 15 February 2025).
  38. Jia, L.; Zhang, C.; Li, J.; Yao, L.; Tang, C. Liaojun Yao Validation and development of trace-based approach for composite laminates. Compos. Sci. Technol. 2022, 221, 109348. [Google Scholar] [CrossRef]
  39. Zhua, Y.; Liechtib, M.K.; Ravi-Chandarb, K. Direct extraction of rate-dependent traction–separation laws for polyurea/steel interfaces. Int. J. Solids Andstruct. 2009, 46, 31–51. [Google Scholar] [CrossRef]
  40. Desai, C.K.; Basu, S.; Parameswaran, V. Determination of Traction Separation Law for Interfacial Failure in Adhesive Joints at Different Loading Rates. J. Adhes. 2016, 92, 819–839. [Google Scholar] [CrossRef]
  41. 3M™Scotch-Weld™ Structural Adhesive Film AF 163-2K Technical Datasheet. 2009. Available online: https://multimedia.3m.com/mws/media/282041O/3m-scotch-weld-structural-adhesive-film-af-163-2-af-163-3.pdf (accessed on 15 February 2025).
  42. Chaves, F.J.P.; de Moura, M.; da Silva, L.F.M.; David, A.D. Fracture Mechanics Tests in Adhesively Bonded Joints: A Literature Review. J. Adhes. 2014, 90, 955–992. [Google Scholar] [CrossRef]
Figure 1. Application of DCB test (a), Force–displacement (F-D) curve for DCB tests (b).
Aerospace 12 00383 g001
Figure 2. Application of ENF test (a), F-D curves for ENF tests (b), the cohesive failure in the adhesive layer was observed on DCB specimens (c) and ENF specimens (d).
Aerospace 12 00383 g002
Figure 3. DCB Test analysis setup (a), Mesh structure of DCB analysis (b), ENF test analysis setup (c), Mesh structure of ENF analysis (d).
Aerospace 12 00383 g003
Figure 4. Comparison of F-D graphs obtained from experimental and numerical solutions in DCB test (a), Comparison of F-D graphs the solvers on DCB analysis (b), Comparison of F-D graphs obtained from experimental and numerical solutions in ENF test (c).
Aerospace 12 00383 g004
Figure 5. Example images of DCB test simulation (a) and ENF test simulation (b), FEA stress distribution result.
Aerospace 12 00383 g005
Figure 6. NAS1097AD5 modelling on ABAQUES (a), Distance of rivets to each other and to the edge (b), Loading conditions of the test rig (c).
Aerospace 12 00383 g006
Figure 7. F-D curve for only adhesive bonded skin–stringer (a), Image of stress concentration at “A” point for only adhesive bonded skin–stringer (b).
Aerospace 12 00383 g007
Figure 8. Skin stringer model only joined with rivets (a), Force–displacement (F-D) curve of the skin–stringer model that is only riveted (b), Image of stress concentration at “A” point for only rivet skin stringer (c).
Aerospace 12 00383 g008
Figure 9. Skin stringer model only joined with rivets and adhesives (a) F-D curve for skin–stringer model which is joined with rivets and adhesive (b), Failure image after 3 mm displacement for skin–stringer model which is joined with rivets and adhesive (c).
Aerospace 12 00383 g009
Figure 10. Skin stringer model only joined with reduced number of rivets and adhesives (a), F-D curve for skin–stringer model which is joined with adhesive and reduced amount of rivets (b), Image of the stress distribution on the model after 3 mm displacement (c).
Aerospace 12 00383 g010
Figure 11. Force–Displacement curves for the four different models.
Aerospace 12 00383 g011
Table 1. AF163-2K adhesive material properties.
PropertyValue
E (Knn) Elastic Modulus1110 MPa
σi (Kss) Shear Modulus413.69 MPa
σii (Ktt) Shear Modulus413.69 MPa
Shear Strength First Direction47.92 MPa
Shear Strength Second Direction47.92 MPa
Tensile Strength Normal Mode 48.26 MPa
Normal Mode (GI c)3.8 N/mm
Shear Mode First Direction (GII c)9.8 N/mm
Shear Mode Second Direction (GIII c)9.8 N/mm
Disclaimer/Publisher’s Note: The statements, opinions and data contained in all publications are solely those of the individual author(s) and contributor(s) and not of MDPI and/or the editor(s). MDPI and/or the editor(s) disclaim responsibility for any injury to people or property resulting from any ideas, methods, instructions or products referred to in the content.

